This retrospective, single-arm study evaluated the prosthesis size-prediction accuracy of a robot-independent, artificial intelligence–based, three-dimensional preoperative planning system for total knee arthroplasty in patients with end-stage knee osteoarthritis and described the early postoperative alignment, functional scores, and complications observed in the same cohort.
Article de recherche
Artificial Intelligence–Based Three-Dimensional Preoperative Planning for Total Knee Arthroplasty in End-Stage Knee Osteoarthritis
Dans cet article
Résumé
Résumé
Accurate preoperative templating for total knee arthroplasty (TKA) in patients with end-stage knee osteoarthritis (KOA) remains challenging, and the accuracy of conventional planning methods is variable. This preliminary, retrospective, single-center study evaluated the reliability of a robot-independent, artificial intelligence (AI)-based, three-dimensional (3D) preoperative planning system (AIKNEE) for predicting prosthesis size and component position in patients undergoing TKA for end-stage KOA. Twenty-eight knees from 24 patients with Kellgren–Lawrence grade 3–4 KOA were included. The primary outcome was the agreement between the planned and implanted prosthesis sizes. Secondary outcomes included correction of the coronal hip–knee–ankle (HKA) angle, improvement in Hospital for Special Surgery (HSS) knee scores, and early postoperative complications. The planned size matched the implanted size exactly in 53.57% of femoral components (15/28; 95% confidence interval [CI], 35.8%–70.5%) and 46.43% of tibial components (13/28; 95% CI, 29.5%–64.2%). Agreement within ±1 size was 85.71% for femoral components (24/28; 95% CI, 68.5%–94.3%) and 96.43% for tibial components (27/28; 95% CI, 82.3%–99.4%), giving an overall matching rate of 91.07% (51/56; 95% CI, 80.7%–96.1%). The postoperative HKA angle improved from 173.0° ± 3.9° to 178.2° ± 1.2° (P < 0.001), and the HSS score increased from 39.7 ± 2.2 preoperatively to 80.8 ± 1.3 at the 1-month follow-up (P < 0.001). No major early complications, including infection, dislocation, or deep venous thrombosis, were observed. Within this preliminary cohort, the AIKNEE system predicted prosthesis size with a reliability comparable to that reported for existing AI templating tools. Because the study was retrospective, single-arm, unblinded, and limited to 1 month of follow-up, these data characterize planning accuracy only and do not demonstrate clinical effectiveness; adequately powered, controlled studies with long-term follow-up are required.
Introduction
Approximately 370,000 and 700,000 adults per year in China and the United States, respectively, undergo total knee arthroplasty (TKA) to treat end-stage knee osteoarthritis (KOA)1. TKA has proven to be one of the most effective treatments for this progressively increasing condition, including in younger patients with advanced joint degeneration resulting from sports-related injuries or improper exercise2. Interest in earlier detection and disease-modifying strategies for KOA has grown in parallel, and translational work ranging from multi-omic analyses of osteoarthritis pathogenesis to locally delivered biomaterial-based therapies continues to broaden the treatment options available before arthroplasty becomes necessary3,4; preclinical large-animal imaging studies have likewise refined the radiographic and quantitative magnetic resonance criteria used to characterize early and low-grade osteoarthritic changes5,6. Once end-stage disease is established, however, arthroplasty remains the definitive treatment. The outcomes and longevity of TKA depend on multiple technical factors, among which lower-limb alignment, prosthetic component rotation, and component sizing are particularly critical7,8. Therefore, individualized preoperative planning is essential to assist surgeons in selecting appropriate prosthetic implants and performing patient-specific, precise surgical procedures9. Conventional preoperative templating based on two-dimensional radiographs has demonstrated variable accuracy and reliability, which may result in errors in prosthesis sizing or component positioning10,11. Such inaccuracies may contribute to suboptimal clinical outcomes, including persistent joint pain, delayed recovery, aseptic loosening, and the need for revision surgery. These limitations highlight the clinical need for more accurate, standardized, and reproducible approaches to preoperative planning.
In recent years, artificial intelligence (AI) has increasingly been applied in orthopedic surgery, with applications including medical image interpretation, tissue segmentation, disease identification, and classification of joint pathologies12,13. Consequently, several digital and computer-assisted preoperative planning systems have been developed, and recent systematic reviews have summarized their performance across the perioperative pathway14,15. Existing AI-assisted planning tools nevertheless have important limitations that should be considered before introducing another system. A scoping review of AI-based three-dimensional (3D) templating found that, although such systems shorten planning time and improve estimation of implant size and position relative to conventional radiographic templating, most published models incompletely report data handling, model development, and external testing, which limits the reproducibility and generalizability of their stated accuracy16. Many available tools remain two-dimensional and radiograph-based and therefore inherit the magnification and rotation errors of plain-film templating17; most have been trained and validated using single-center datasets drawn from predominantly non-Chinese populations; and reported prediction accuracy varies substantially among algorithms and between the femoral and tibial components18. Few have been validated prospectively against the components actually implanted.
Robotic-assisted platforms such as Mako (Stryker) and ROSA (Zimmer Biomet) have demonstrated high accuracy in restoring mechanical alignment and implant positioning9,19. These platforms and the system evaluated here address different stages of the operation, and the distinction should be made explicit: robotic systems couple preoperative planning with intraoperative navigation and permit real-time, feedback-driven adjustment of bone resections, whereas an AI planning system produces a preoperative plan whose execution still depends on conventional intramedullary and extramedullary alignment guides, without intraoperative dynamic correction of errors arising from anatomical variation, guide positioning, or soft-tissue balancing. Robotic platforms also require substantial capital investment and specialized training. The AIKNEE system differs in that it uses deep-learning algorithms to generate a 3D preoperative surgical plan from computed tomography (CT) images while allowing the procedure to be performed using a conventional surgical workflow without robotic assistance. Accordingly, this study evaluates a robot-independent, AI-based preoperative planning system intended for use in conventional TKA; it does not evaluate the system against robotic guidance, and no equivalence between the two approaches is implied.
Based on this premise, this retrospective study was designed to evaluate the ability of the AIKNEE system to predict prosthesis size and osteotomy parameters for TKA in patients with end-stage KOA. We hypothesized that the AIKNEE system would achieve a high level of agreement (>85%) between the predicted and implanted prosthesis sizes while facilitating restoration of a neutral mechanical axis. The 85% threshold was derived from the performance already documented for comparable tools rather than chosen arbitrarily: a systematic review of AI models for TKA implant size prediction, comprising at least 34,547 patients, reported accuracy within one implant size of 88.3%–99.7% for the femoral component and 90.0%–99.9% for the tibial component18, and a deep-learning templating model validated against 81 consecutive TKA procedures achieved 88.9% accuracy within one size for both components17. An agreement rate below 85% would therefore fall short of the performance already reported for existing AI templating tools, whereas exceeding this threshold would indicate performance within the published range. The threshold was accordingly prespecified as the minimum considered clinically acceptable for a planning tool intended to support, but not replace, intraoperative sizing with trial components. The primary objective was to validate the agreement between AIKNEE-predicted and implanted prosthesis sizes. Secondary objectives included evaluating postoperative lower-limb alignment, early postoperative functional outcomes, and the incidence of postoperative complications. Because this was a retrospective, single-arm validation study without a comparator group, the findings should be interpreted as an evaluation of planning accuracy rather than evidence of superiority over conventional preoperative planning methods.
Protocole
This study was approved by the Institutional Review Board of Shenzhen People’s Hospital (IRB approval number ECSZPH2019-0684) and was conducted in accordance with the ethical principles of the Declaration of Helsinki. Written informed consent was obtained from all patients before study participation.
Study population
The AIKNEE system (3D preoperative planning software) has not been evaluated in controlled comparative trials and therefore serves as an early-stage investigation of the feasibility and accuracy of an AI-based tool for surgical planning rather than an assessment of effectiveness compared with conventional practice. A total of 24 patients who underwent TKA between June 2020 and July 2021 were included in this study. Patients were screened consecutively: every patient who presented to the participating department for primary TKA for end-stage KOA during this period was assessed against the eligibility criteria, and all patients who met the criteria were included. No further selection was applied. The inclusion criteria were as follows: (1) persistent knee joint pain for more than 6 months that was unresponsive to conservative treatment; (2) painless walking distance of less than 500 m; (3) significant joint space narrowing, osteophyte formation, sclerosis, defects, and cystic lesions observed on weight-bearing radiographs; and (4) availability of full-length lower-extremity radiographs and CT images of the knee. The exclusion criteria were as follows: (1) failure to undergo surgery after preoperative planning using the planning software; (2) preoperative imaging data that did not satisfy the planning software requirements20,21; and (3) poor physical condition or serious underlying disease precluding surgery. Baseline characteristics were not compared between the analyzed patients and the eight patients who were screened but not included because those patients did not undergo the planning and surgical procedures under study, and no outcome data were collected for them; the potential for selection bias arising from these exclusions is addressed in the Discussion section.
Imaging data
Knee CT images were acquired for preoperative planning. Patients were instructed to fully extend both knees as much as possible, keep the feet together, and position the patellae facing upward. CT acquisition parameters included a slice thickness of approximately 1.0 mm without interslice gaps or overlap, a scan range extending approximately 20 cm above and below the center of both knees, 3D spiral scanning, and an image resolution of 512 × 512 pixels. Images were obtained with a uCT 860 CT scanner (United Imaging Healthcare, Beijing, China) at a tube voltage of 140 kVp and a tube current–time product of 149 mAs, with a display field of view of 31.6 cm × 20.1 cm.
Image data were transferred in a DICOM3-compatible format as compressed ZIP or RAR files. Preoperative and postoperative knee radiographs were obtained for surgical evaluation. Radiographic acquisition followed the standardized institutional radiographic protocol, with patients positioned with both knees extended as fully as possible, the feet together, and the patellae facing upward. The exposure factors (kVp and mAs) and source-to-image distance were not recorded in the study documentation and are not available.
Preoperative Planning Using the AIKNEE System
Preoperative surgical planning was based on the knee CT scans acquired as described above (see Imaging data); the acquisition parameters are not repeated here. No physical calibration marker was used during CT acquisition. The AIKNEE system (3D preoperative planning software) incorporates an automatic magnification-correction algorithm to compensate for variations in scanning parameters. CT images were uploaded in a DICOM3-compatible format for preoperative planning. The number of AIKNEE plans that were manually adjusted before surgery and the planning parameters that were adjusted were not recorded in the study documentation and are not available. In addition, full-length preoperative and postoperative radiographs of both lower limbs were obtained for surgical assessment using the standardized institutional radiographic acquisition protocol.
The planning software was used for all preoperative planning. The workflow consisted of the following steps:
- Automated segmentation and 3D reconstruction: The planning software uses deep-learning algorithms to automatically segment the patient's CT data and generate visual representations of the femur, tibia, patella, and fibula. Following segmentation, the software automatically reconstructs a 3D surgical model based on the segmented images.
- Anatomical landmark identification: The planning software automatically identifies anatomical landmarks on the 3D model.
- Surgical parameter definition: The planning software automatically calculates the initial osteotomy parameters using the identified anatomical landmarks. The surgeon manually enters the desired femoral and tibial resection depths and angles required to achieve the planned mechanical-axis alignment target (e.g., 0° varus/valgus).
- Prosthesis matching and surgical planning: The planning software matches the calculated resection parameters with the appropriate prosthesis size and model available in its implant library and generates a detailed surgical plan, including the femoral valgus angle, femoral component external rotation, distal femoral resection thickness, tibial posterior slope, and tibial resection depth. Every automatically generated plan was reviewed and approved before use by the same senior orthopedic surgeon who performed all operations; no other operator generated or approved the plans, and interobserver variability in the planning step was therefore not assessed. Manual adjustment of the planned resection thicknesses, angles, and component sizes was permitted within the software before a plan was finalized. A schematic representation of this workflow is shown in Figure 1.
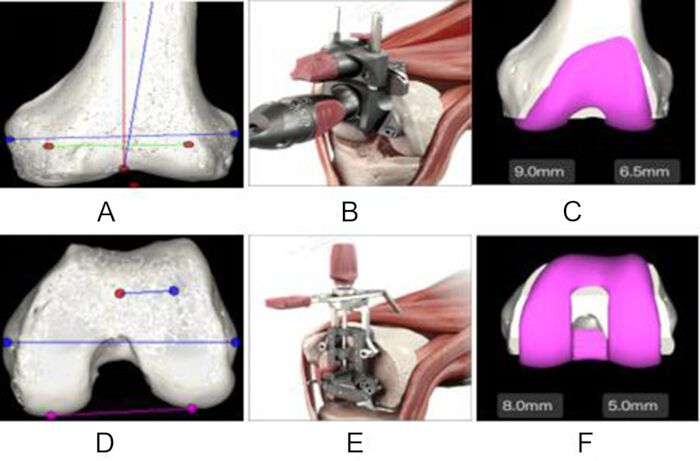
Figure 1. Three-Dimensional Preoperative Planning Workflow Using the AIKNEE System for Total Knee Arthroplasty. Representative workflow of the AIKNEE three-dimensional preoperative planning system for total knee arthroplasty (TKA). (A) Automatic identification of distal femoral anatomical landmarks for planning the distal femoral osteotomy, including the target valgus angle. (B) Generation of the virtual distal femoral cutting guide based on the planned resection. (C) Virtual implantation of the femoral component following the planned distal femoral osteotomy, demonstrating component coverage and planned distal resection thicknesses (9.0 mm and 6.5 mm). (D) Planning of the posterior femoral osteotomy using the posterior femoral condyles to establish the target external rotation. (E) Generation of the corresponding virtual posterior femoral cutting guide. (F) Final virtual simulation of femoral component implantation after completion of the planned distal and posterior femoral resections, confirming the planned component fit, rotational alignment, and posterior condylar resection thicknesses (8.0 mm and 5.0 mm). Please click here to view a larger version of this figure.
Surgical Procedure
A standard TKA was performed using an anteromedial parapatellar approach. All procedures were performed by a single senior orthopedic surgeon with more than 15 years of experience to minimize inter-surgeon variability. Femoral and tibial osteotomies were performed according to the preoperative plan using conventional intramedullary femoral and extramedullary tibial alignment guides. Planned operative parameters, including a tibial posterior slope of 3° and a femoral distal valgus angle of 5°–6°, were followed, as was the planned posterolateral rotation of the femoral component relative to the femoral condyles. The ATTUNE PS RP prosthesis was implanted in all patients, and the final implant size was determined intraoperatively using trial components. The surgeon was not obliged to implant the planned size: when trial reduction indicated that a different size provided better cortical coverage or flexion–extension gap balance, that size was implanted. The size actually implanted was recorded and used for the agreement analysis; therefore, the reported matching rates reflect the plan generated by the software rather than a plan modified to match the operative result. Any intraoperative departure from the preoperative plan was documented in the operative record and implant log at the time of surgery, and the implanted sizes analyzed here were extracted from those records. Only the component size could be changed intraoperatively; the planned resection thicknesses and angles were executed with the alignment guides as planned and were not modified.
Outcome Evaluation
Prosthesis Size Matching:
The primary outcome was the accuracy of prosthesis size prediction by the AIKNEE system (3D preoperative planning software). A complete match was defined as the planned prosthesis size being identical to the implanted prosthesis size. A general match was defined as a difference of ±1 prosthesis size between the planned and implanted components. The overall agreement rate was calculated as the percentage of cases classified as either complete or general matches. The ±1-size margin was considered clinically acceptable because the difference in the anteroposterior dimension between adjacent implant sizes is approximately 2–3 mm and is not expected to adversely affect prosthesis fit, stability, or short-term functional outcomes. Both the exact-match rate (deviation of 0) and the agreement rate within ±1 size are reported for each component, together with the full distribution of deviation grades (0, ±1, and ±2 sizes); the exact-match rate is treated as the more conservative indicator of algorithm accuracy because the ±1 criterion accepts a size that the algorithm did not predict.
Radiographic and Clinical Evaluation:
Secondary outcomes included radiographic evaluation and assessment of knee joint function using the Hospital for Special Surgery (HSS) score at 1 week preoperatively and 1 month postoperatively. The 1-month time point was prespecified because the aim of this study was to verify that a plan generated by the AIKNEE system could be executed safely and could restore coronal alignment, not to characterize functional recovery or implant durability. One month corresponds to the routine first postoperative review at our institution, by which time wound healing and early complications can be assessed and postoperative full-length radiographs are available for every patient. It is not an interval at which meaningful functional recovery or implant survival can be judged, and the HSS data are accordingly reported as a description of the early postoperative course rather than as an outcome of the planning method. Anteroposterior and lateral knee radiographs, together with full-length lower-limb radiographs, were obtained to evaluate the coronal hip–knee–ankle (HKA) angle on postoperative day 1. The radiographic measurements were performed as part of routine clinical assessment; the number and qualifications of the assessors were not recorded in the study documentation, the measurements were not performed under conditions blinded to the AIKNEE plan, and no inter-rater reliability assessment was undertaken. Postoperative wound healing and adverse events, including infection, dislocation, fracture, and deep venous thrombosis (DVT), were also assessed.
Statistical Analysis
Statistical analyses were performed using SPSS version 25.0. Continuous variables were assessed for normality using the Shapiro–Wilk test. Normally distributed data (e.g., HKA angle and HSS score) are presented as the mean ± standard deviation. Comparisons of preoperative and postoperative continuous variables were performed using paired t-tests, and the mean within-patient difference is reported with its 95% confidence interval (CI). Categorical variables (e.g., prosthesis matching rates) are presented as frequencies and percentages. Two-sided 95% CIs were calculated for all proportions—the primary outcome (overall agreement rate) and the component-specific exact-match and ±1-size agreement rates alike—using the Wilson score method, which is preferred to the normal approximation for small samples and for proportions close to 1. Confidence intervals are therefore reported for both the primary and secondary outcomes. Statistical significance was defined as P < 0.05. No adjustment for multiple comparisons was applied because the secondary analyses were exploratory, and the corresponding P values should be interpreted descriptively. Because of the limited published evidence regarding the accuracy of the planning software when the study was designed, this study was conducted as a preliminary validation study comprising all eligible knees treated during the recruitment period (28 knees), and no formal sample size or statistical power calculation was performed. The cohort size was therefore determined by case availability rather than by a target precision, which is a recognized weakness of preliminary validation studies: 28 observations estimate a proportion of approximately 90% with a 95% CI half-width of roughly 11 percentage points, which is sufficient to establish whether performance is broadly consistent with previously reported AI templating accuracy but not to detect modest differences between planning methods. Larger studies will be required to provide definitive validation of the planning software.
Résultats
Patient Demographics
Thirty-two patients with Kellgren–Lawrence grade 3 or 4 end-stage KOA were enrolled between June 2020 and July 2021. Following assessment according to the inclusion and exclusion criteria, two patients were excluded because of heart failure, one patient was excluded because the preoperative imaging did not meet the planning criteria, and five patients did not undergo surgical treatment for KOA. Ultimately, 28 knees from 24 patients met the eligibility criteria and underwent AIKNEE evaluation followed by surgical intervention for KOA. The final cohort comprised eight (33.3%) male and sixteen (66.7%) female patients, with a mean age of 71.9 ± 5.6 years (range, 62–80 years). The mean body mass index was 28.4 ± 3.2 kg/m2. Twelve procedures (42.9%) were performed on the left knee and sixteen (57.1%) on the right knee. All patients completed the 1-month postoperative follow-up.
AIKNEE Preoperative Planning
The AIKNEE system generated individualized preoperative plans using 3D CT image data. The overall planning workflow is illustrated in Figure 1, including automatic anatomical landmark identification, virtual osteotomy planning, and prosthesis simulation (Figure 1A–F). Representative outputs of the prosthesis-matching algorithm are shown in Figure 1C and Figure 1F, with planned resection thicknesses displayed in millimeters (distal femoral resection: 9.0 mm and 6.5 mm; posterior femoral condylar resection: 8.0 mm and 5.0 mm). These representative examples demonstrate the generation of patient-specific surgical plans based on individual anatomy. Figure 1D shows the anatomical landmarks and parameters used for prosthesis sizing and alignment assessment.
Accuracy of Prosthesis Size Matching
Agreement between the preoperative AIKNEE planning system and the implanted prosthesis sizes was assessed as described in the Protocol section; both exact agreement and agreement within ±1 implant size are reported. For the femoral component, exact agreement was achieved in 15 of 28 cases (53.57%; 95% CI, 35.8%–70.5%), agreement within ±1 implant size in 24 of 28 cases (85.71%; 95% CI, 68.5%–94.3%), and a deviation of ±2 sizes occurred in 4 of 28 cases (14.29%). For the tibial component, exact agreement was achieved in 13 of 28 cases (46.43%; 95% CI, 29.5%–64.2%), agreement within ±1 implant size in 27 of 28 cases (96.43%; 95% CI, 82.3%–99.4%), and a deviation of ±2 sizes occurred in 1 of 28 cases (3.57%). Considering the 56 components (28 femoral and 28 tibial) together, 28 components matched exactly (50.00%; 95% CI, 37.3%–62.7%), 23 deviated by one size (41.07%), and 5 deviated by two sizes (8.93%), giving an overall agreement within ±1 size of 51 of 56 components (91.07%; 95% CI, 80.7%–96.1%). Exact agreement was therefore considerably lower than agreement within ±1 size, and the exact-match rate should be regarded as the more conservative measure of algorithm performance. Detailed comparisons between the planned and implanted femoral and tibial component sizes for all 28 cases, together with the distribution of deviation grades, are presented in Table 1.
| Case | Femoral Component | Tibial Component | ||||
| AIKNEE Planned | Implanted | Deviation | AIKNEE Planned | Implanted | Deviation | |
| Case 1 | 4N | 3 | 1 | 2 | 3 | −1 |
| Case 2 | 4N | 3 | 1 | 2 | 3 | −1 |
| Case 3 | 5N | 3 | 2 | 5 | 5 | 0 |
| Case 4 | 5N | 3 | 2 | 5 | 5 | 0 |
| Case 5 | 8 | 6 | 2 | 8 | 6 | 2 |
| Case 6 | 4 | 5N | −1 | 3 | 4 | −1 |
| Case 7 | 7 | 6 | 1 | 6 | 6 | 0 |
| Case 8 | 5N | 4 | 1 | 4 | 4 | 0 |
| Case 9 | 6 | 6 | 0 | 6 | 6 | 0 |
| Case 10 | 4N | 4N | 0 | 3 | 4 | −1 |
| Case 11 | 5 | 6N | −1 | 6 | 5 | 1 |
| Case 12 | 4N | 4 | 0 | 3 | 3 | 0 |
| Case 13 | 4N | 4 | 0 | 3 | 3 | 0 |
| Case 14 | 4N | 4 | 0 | 3 | 3 | 0 |
| Case 15 | 4 | 4 | 0 | 3 | 4 | −1 |
| Case 16 | 4N | 4 | 0 | 4 | 4 | 0 |
| Case 17 | 4N | 4 | 0 | 4 | 4 | 0 |
| Case 18 | 4 | 5N | −1 | 5 | 4 | 1 |
| Case 19 | 4 | 4 | 0 | 5 | 4 | 1 |
| Case 20 | 6 | 6N | 0 | 6 | 5 | 1 |
| Case 21 | 5N | 5 | 0 | 4 | 4 | 0 |
| Case 22 | 6 | 6 | 0 | 6 | 6 | 0 |
| Case 23 | 6N | 4N | 2 | 5 | 4 | 1 |
| Case 24 | 3 | 4 | −1 | 3 | 4 | −1 |
| Case 25 | 5N | 4N | 1 | 4 | 4 | 0 |
| Case 26 | 4N | 4 | 0 | 3 | 4 | −1 |
| Case 27 | 4 | 4N | 0 | 4 | 3 | 1 |
| Case 28 | 4 | 4N | 0 | 4 | 3 | 1 |
| Exact match (deviation 0), n (%) | 15 (53.57%) | 13 (46.43%) | ||||
| Deviation of 1 size, n (%) | 9 (32.14%) | 14 (50.00%) | ||||
| Deviation of 2 sizes, n (%) | 4 (14.29%) | 1 (3.57%) | ||||
Table 1: Comparison of Planned and Implanted Prosthesis Sizes for Femoral and Tibial Components. Comparison of prosthesis sizes generated by the AIKNEE preoperative planning system with the prosthesis sizes implanted during total knee arthroplasty (TKA) for each of the 28 cases. N denotes the narrow femoral component; a numeral alone denotes the standard femoral component. Tibial components have no narrow option and are designated by numeral alone. Deviation was calculated as the planned size minus the implanted size, with the narrow designation disregarded when the numerical difference was computed; 0 indicates an exact match, whereas ±1 and ±2 indicate differences of one and two implant sizes, respectively. Percentages are based on the 28 cases. Femoral components matched exactly in 15 cases (53.57%), deviated by one size in 9 cases (32.14%), and deviated by two sizes in 4 cases (14.29%). Tibial components matched exactly in 13 cases (46.43%), deviated by one size in 14 cases (50.00%), and deviated by two sizes in 1 case (3.57%).
Functional and Radiographic Outcomes
Postoperative radiographic evaluation demonstrated the position of the femoral and tibial implants on the follow-up radiographs. The mean HKA angle increased from 173.0° ± 3.9° preoperatively to 178.2° ± 1.2° postoperatively, a mean correction of 5.2° (95% CI, 3.7°–6.7°; P < 0.001). Representative anteroposterior and lateral radiographic views are presented in Figure 2, illustrating the postoperative appearance of the femoral and tibial components.
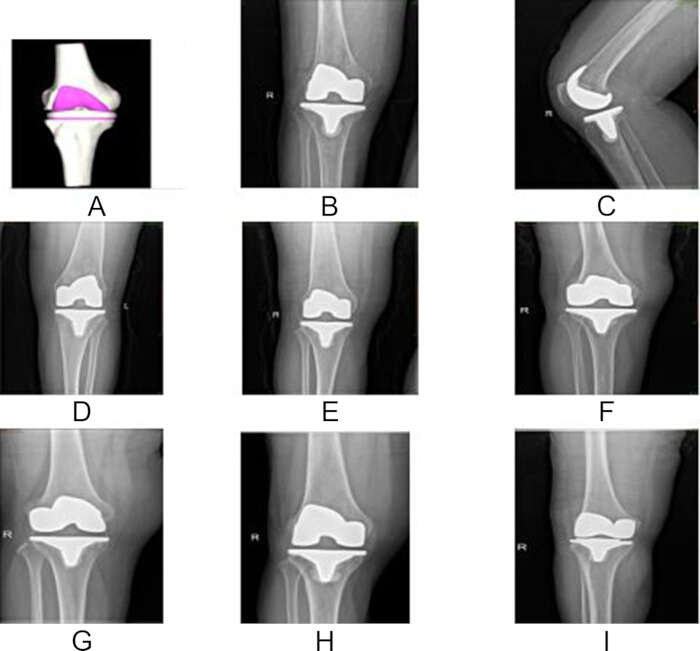
Figure 2. Representative Preoperative Planning and Postoperative Radiographic Evaluation Following Total Knee Arthroplasty. Representative images from nine different patients who underwent total knee arthroplasty (TKA) using the AIKNEE preoperative planning system. Each panel corresponds to a different patient. (A) Three-dimensional preoperative surgical planning model generated by the AIKNEE system. (B) Postoperative anteroposterior radiograph. (C) Postoperative lateral radiograph. (D–I) Additional representative postoperative anteroposterior radiographs obtained during routine follow-up, demonstrating the implanted femoral and tibial components. Please click here to view a larger version of this figure.
Knee function improved following surgery. The mean HSS score increased from 39.7 ± 2.2 preoperatively to 80.8 ± 1.3 at the 1-month postoperative follow-up, a mean improvement of 41.1 points (95% CI, 40.3–41.9; P < 0.001). A summary of the preoperative and postoperative HKA angles, HSS scores, and statistical analyses is presented in Table 2.
| Outcome | Preoperative | Postoperative | Mean Difference (95% CI) | t | P Value |
| HKA angle (°) | 173.0 ± 3.9 | 178.2 ± 1.2 | 5.2 (3.7–6.7) | 7.078 | <0.001 |
| HSS score | 39.7 ± 2.2 | 80.8 ± 1.3 | 41.1 (40.3–41.9) | 104.636 | <0.001 |
Table 2: Comparison of Hip–Knee–Ankle Angle and Hospital for Special Surgery Score Before and After Total Knee Arthroplasty. Comparison of the preoperative and postoperative hip–knee–ankle (HKA) angle and Hospital for Special Surgery (HSS) score in patients who underwent total knee arthroplasty (TKA). Data are presented as the mean ± standard deviation (SD). Statistical comparisons were performed using paired t-tests. The mean within-patient difference and its 95% confidence interval (CI) are reported for each outcome.
Early Postoperative Complications and Clinical Evaluation
All patients completed a minimum follow-up period of 1 month. At the 1-month postoperative assessment, all surgical wounds demonstrated primary intention healing. No postoperative complications, including deep vein thrombosis, periprosthetic fracture, dislocation, or infection, were observed during the follow-up period. A representative case comparing the preoperative 3D planning model with postoperative imaging is shown in Figure 3. The figure includes the preoperative planning model together with postoperative 3D reconstructed and radiographic images, illustrating the implanted femoral and tibial components following implementation of the surgical plan. The absence of early complications is consistent with an uneventful early postoperative course. With 28 knees and only 1 month of follow-up, however, this cohort had very limited power to detect uncommon adverse events, and the complication data should be interpreted as descriptive rather than as evidence of safety.
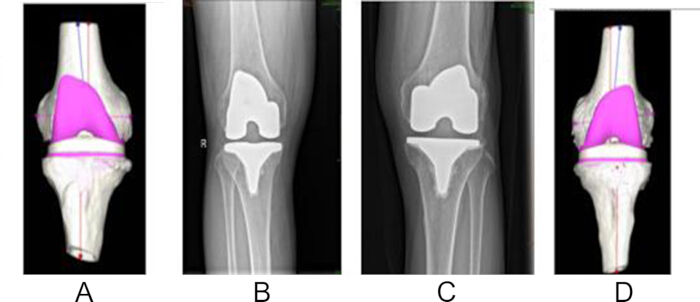
Figure 3. Comparison of Preoperative Three-Dimensional Planning and Postoperative Imaging Following Total Knee Arthroplasty. Comparison of the preoperative three-dimensional surgical planning model generated by the AIKNEE system with postoperative imaging obtained after total knee arthroplasty (TKA). (A) Preoperative three-dimensional planning model generated by the AIKNEE system. (B, C) Postoperative anteroposterior radiographs. (D) Postoperative three-dimensional reconstruction of the distal femur and the implanted prosthesis. The comparison illustrates the relationship between the planned and the final implanted femoral component and demonstrates postoperative implant positioning following intraoperative implementation of the surgical plan. Please click here to view a larger version of this figure.
Data Availability:
The de-identified participant-level data supporting the quantitative findings of this study are made available with the article. The dataset, comprising demographic and baseline characteristics, the planned and implanted femoral and tibial component sizes underlying Table 1, the preoperative and postoperative hip–knee–ankle (HKA) angles and Hospital for Special Surgery (HSS) scores underlying Table 2, and complication data, is provided as Supplementary File 1. A data dictionary defining each variable, its units, and its permitted values is provided as Supplementary File 2. Individual computed tomography (CT) and radiographic images are not included because they constitute potentially identifiable patient imaging; requests for access to these images will be considered by the Institutional Review Board of Shenzhen People’s Hospital in accordance with applicable data-protection regulations.
Supplementary File 1. De-identified Participant-Level Dataset. De-identified participant-level data for the 28 operated knees included in the study. The dataset contains demographic and baseline characteristics, operative information, preoperative and postoperative Hospital for Special Surgery knee scores, preoperative and postoperative hip–knee–ankle angles, planned and implanted femoral and tibial component sizes, prosthesis size deviations, polyethylene insert sizes, and complications assessed within 1 month after surgery. Each row represents one operated knee. No direct patient identifiers or individual imaging files are included.Please click here to download this file.
Supplementary File 2. Data Dictionary for the Participant-Level Dataset. Data dictionary accompanying Supplementary File 1. The file defines each variable, data type, units, permitted values, derived variables, de-identification procedures, and notes required to interpret the participant-level dataset.Please click here to download this file.
Discussion
This study evaluated the accuracy and reliability of the AIKNEE preoperative planning system for TKA in patients with end-stage KOA. The system predicted the implanted component size exactly in 50.00% of the 56 components analyzed and to within ±1 implant size in 91.07% (95% CI, 80.7%–96.1%), and the procedures performed using these plans were followed by improved postoperative mechanical alignment and early functional scores. The agreement rate met the prespecified threshold of >85% and is consistent with the hypothesis that AI-assisted 3D preoperative planning can predict prosthesis size with useful accuracy. Because the study included no control group, however, the observed alignment and functional improvements cannot be attributed to the AIKNEE system: they are the expected consequence of a technically successful TKA irrespective of how it was planned, and only the sizing-agreement data speak directly to the performance of the planning algorithm.
The high agreement observed with the AIKNEE system may be attributable to its use of AI algorithms applied to 3D CT datasets16,22,23, which avoid the image magnification and rotational variation that limit conventional two-dimensional templating. The system generates an individualized anatomical model from patient-specific imaging, thereby reducing manual estimation during osteotomy planning and prosthesis size prediction24,25. In addition, the planning algorithm incorporates supervised and unsupervised machine-learning approaches to predict prosthesis size and component positioning based on individual anatomy26. Consistent with this, a CT-based AI planning and patient-specific instrumentation system reported component-size accuracy of 92.9% for the femoral and tibial components, compared with 42.9% and 47.6%, respectively, for conventional planning in the same cohort23.
Compared with previously reported accuracy rates of approximately 60%–75% for conventional two-dimensional templating10,11, the agreement observed in the present study is encouraging, and it falls within the range of 88.3%–99.7% (femoral) and 90.0%–99.9% (tibial) within one implant size reported in a systematic review of AI sizing models18. Like should be compared with like, however: the exact-match rates observed here (53.57% femoral and 46.43% tibial) are close to the 39.5% and 43.2% reported for a deep-learning templating model validated against the components actually implanted17, which indicates that current AI tools identify the correct size band reliably but still predict the exact implanted size in fewer than two-thirds of cases. Previous reports have also demonstrated high accuracy with robotic and navigation-assisted systems9,19; those platforms couple planning with intraoperative navigation and allow the resection to be adjusted using real-time feedback, whereas the AIKNEE system delivers only a preoperative plan that is then executed with conventional intramedullary and extramedullary guides27. A recent prospective controlled study comparing AI-based 3D planning with conventional template measurement reported significantly higher complete-matching rates, shorter operative times, and less intraoperative blood loss in the AI group28; the present single-arm design cannot reproduce such a comparison. Direct comparisons between these approaches therefore cannot be made on the basis of this study because no robotic, navigation-assisted, or conventional templating control group was included, and no claim of superiority over any of these methods is made here. The generation of a 3D planning model in less than five minutes may improve preoperative workflow efficiency27.
Accurate preoperative prediction of prosthesis size may facilitate surgical preparation by allowing surgeons to anticipate implant requirements before surgery, potentially reducing the number of instrument trays required during the procedure29. These remain potential rather than demonstrated benefits: the present study did not record tray usage, sterilization burden, operating-room turnover, or cost, and no economic analysis was performed. A randomized trial of AI-planned patient-specific instrumentation reported more accurate distal femoral resection and coronal alignment than conventional instrumentation but also longer operative times30, which illustrates that planning accuracy and operative efficiency do not necessarily improve together. Although postoperative HSS scores improved in this study, these improvements should not be interpreted as evidence that they resulted directly from the AIKNEE planning system because all patients underwent TKA and no comparison group was available. Future studies should determine whether improved planning accuracy translates into improved long-term functional outcomes, prosthesis survival, reduced revision rates, patient-reported outcome measures, or greater operative efficiency and should compare AI planning directly with both conventional templating and robotic-assisted systems.
Although the overall agreement rate was high, discrepancies between the planned and implanted prosthesis sizes occurred in a subset of cases, including five components that deviated by two sizes. Potential contributing factors include intraoperative surgical decision-making, such as modification of the osteotomy to achieve satisfactory flexion–extension gap balancing, anatomical variation, and limitations of the AI model itself. These explanations remain inferential within the present dataset because the reason for each intraoperative size change was not recorded prospectively; they are, however, consistent with published evidence. Deviation of the femoral intramedullary alignment rod alters coronal and sagittal component position and can require intraoperative adjustment of the resection31, and imprecise component sizing and positioning remain among the recognized mechanisms of early TKA failure32,33. Reported interobserver agreement for AI templating is substantial rather than near-perfect (Cohen’s kappa 0.60 for femoral and 0.70 for tibial components)17, and a scoping review of AI 3D templating specifically identified incomplete data handling, model development, and external testing as sources of variability in reported accuracy16. Differences from previously published studies may therefore reflect variation in algorithm design as well as differences between the populations used to train the AIKNEE model and the present study population, since knee anthropometry differs between Chinese and White patients34.
Several limitations should be considered when interpreting these findings. First, this retrospective, single-center study included only 28 knees from 24 patients, which limits statistical power and generalizability and produces wide confidence intervals around every reported proportion. Second, the absence of a conventional templating, navigation, or robotic control group precludes any direct comparison between planning methods; the study therefore characterizes planning accuracy only, and no conclusion about the relative effectiveness of AI-based planning can be drawn from these data. Third, patients were identified retrospectively, and 8 of the 32 screened patients were not analyzed; because baseline and outcome data were not collected for those patients, selection bias cannot be excluded. Fourth, prosthesis matching was not assessed under blinded conditions—the operating surgeon was aware of the AIKNEE prediction when trial components were selected, so the agreement rate may be biased upward—and the radiographic measurements were not performed independently by two assessors with formal inter-rater reliability testing. Fifth, the follow-up period of one month was chosen to verify safe execution of the plan and restoration of coronal alignment and is insufficient to evaluate implant survival, revision rates, or sustained functional improvement; the HSS data should accordingly be interpreted as a description of the early postoperative course. Sixth, the cohort was too small to support the subgroup analyses that would establish whether prediction accuracy varies with sex, body mass index, or the severity of the preoperative deformity; such analyses are planned for a larger prospective series. Finally, all procedures used a single prosthesis model and were performed by one surgeon in a population of predominantly one ethnicity, which may limit generalizability to other implant systems, surgeons, and populations34. These findings should therefore be considered preliminary. Larger multicenter prospective controlled studies, with blinded outcome assessment, formal inter-rater reliability testing, and follow-up long enough to capture implant survival and patient-reported outcomes, are required to validate the clinical utility of the AIKNEE system.
Déclarations de divulgation
Conflicts of Interest:
The authors declare that they have no competing interests.
Author Contributions:
Qi Luo: Conceptualization, definition of intellectual content, manuscript editing.
Hua Wang: Study supervision, guarantor of the integrity of the entire study, manuscript review.
Haoyuan Du: Study design, data acquisition, statistical analysis, manuscript preparation.
Dayi Chen: Literature review, data analysis.
Song Jiang: Clinical investigations.
Wenjun Huang: Experimental investigations.
All authors read and approved the final manuscript.
Remerciements
This research received no external funding.
Matériaux
| Nom | Entreprise | Numéro de catalogue | Commentaires |
|---|---|---|---|
| ATTUNE PS RP knee prosthesis | Johnson & Johnson DePuy Synthes | Not available | N/A |
| DICOM-compatible image transfer software | Not available | Not available | N/A |
| Extramedullary tibial alignment guide | Not available | Not available | N/A |
| Full-length lower-limb radiography system | Not available | Not available | N/A |
| Intramedullary femoral alignment guide | Not available | Not available | N/A |
| SPSS Statistics version 25.0 | IBM | Version 25.0 | RRID:SCR_002865 |
| Three-dimensional preoperative planning software (AIKNEE) | Longwood Valley Medical Technology Co., Ltd., Beijing, China | Not available | Not available |
| Trial prosthesis components | Johnson & Johnson DePuy Synthes | Not available | N/A |
| uCT 860 computed tomography scanner | United Imaging Healthcare, Beijing, China | Not available | N/A |
Références
- Feng B et al. China artificial joint annual data report. Chin Med J (Engl). 2020;134(6):752-753. doi:10.1097/CM9.0000000000001196.
- Xiao-jia T et al. Prevalence of knee osteoarthritis in the middle-aged and elderly in China: A meta-analysis. Chin J Tissue Eng Res. 2018;22(4):650-656. doi:10.3969/j.issn.2095-4344.0105.
- Lu R et al. The biological association between programmed cell death function and osteoarthritis using multi-omic Mendelian randomization. Biomed Technol. 2025;12:100102. doi:10.1016/j.bmt.2025.100102.
- Gong Z et al. MXene-based photothermal-responsive injectable hydrogel microsphere modulates physicochemical microenvironment to alleviate osteoarthritis. Smart Med. 2025;4(2):e70006. doi:10.1002/smmd.70006.
- Fiolin J et al. Early low-grade knee osteoarthritis in sheep (Ovis aries) after 6-weeks of total unilateral meniscectomy: A radiographic evaluation. Int J Vet Sci. 2024;13(1):94-99. doi:10.47278/journal.ijvs/2023.065.
- Pontoh LA et al. Low-grade osteoarthritis T2-relaxation map values on Ovis aries stifle joint: An ex-vivo study. Int J Vet Sci. 2024;13(6):1009-1016. doi:10.47278/journal.ijvs/2024.186.
- Kobayashi S et al. Rheumatoid arthritis patients achieve better satisfaction but lower functional activities as compared with osteoarthritis patients after total knee arthroplasty. J Arthroplasty. 2019;34(3):478-482. doi:10.1016/j.arth.2018.11.003.
- Kim HJ et al. Preoperative planning using the picture archiving and communication system technique in high tibial osteotomy. J Orthop Surg (Hong Kong). 2017;25(1):2309499016684701. doi:10.1177/2309499016684701.
- Vaidya NV et al. Robotic-assisted TKA leads to better prosthesis alignment and better joint-line restoration than conventional TKA: A prospective randomized controlled trial. Knee Surg Sports Traumatol Arthrosc. 2022;30(2):621-626. doi:10.1007/s00167-020-06353-2.
- Del Gaizo D, Soileau ES, Lachiewicz PF. Value of preoperative templating for primary total knee arthroplasty. J Knee Surg. 2009;22(4):284-293. doi:10.1055/s-0030-1247765.
- Trickett RW, Hodgson P, Forster MC, Robertson A. The reliability and accuracy of digital templating in total knee replacement. J Bone Joint Surg Br. 2009;91(7):903-906. doi:10.1302/0301-620X.91B7.21476.
- Almog YA et al. Deep learning with electronic health records for short-term fracture risk identification: Crystal Bone algorithm development and validation. J Med Internet Res. 2020;22(10):e22550. doi:10.2196/22550.
- Yeh YC et al. Deep learning approach for automatic landmark detection and alignment analysis in whole-spine lateral radiographs. Sci Rep. 2021;11(1):7618. doi:10.1038/s41598-021-87141-x.
- Kim KB, Kim GB, Kim JH, Lee SM. Artificial intelligence in total knee arthroplasty: Clinical applications and implications. Knee Surg Relat Res. 2025;37(1):44. doi:10.1186/s43019-025-00295-0.
- Rodriguez HC, Rust BD, Roche MW, Gupta A. Artificial intelligence and machine learning in knee arthroplasty. Knee. 2025;54:28-49. doi:10.1016/j.knee.2025.02.014.
- Velasquez Garcia A et al. Artificial intelligence-based three-dimensional templating for total joint arthroplasty planning: A scoping review. Int Orthop. 2024;48(4):997-1010. doi:10.1007/s00264-024-06088-6.
- Park J et al. A deep learning based automatic two-dimensional digital templating model for total knee arthroplasty. Knee Surg Relat Res. 2024;36(1):38. doi:10.1186/s43019-024-00240-7.
- Salman LA et al. Reliability of artificial intelligence in predicting total knee arthroplasty component sizes: A systematic review. Eur J Orthop Surg Traumatol. 2024;34(2):747-756. doi:10.1007/s00590-023-03784-8.
- Demirtas Y et al. A novel robot-assisted knee arthroplasty system (ROSA) and 1-year outcome: A single center experience. Medicine (Baltimore). 2023;102(42):e35710. doi:10.1097/MD.0000000000035710.
- Ping S et al. A case of total knee arthroplasty assisted by an artificial intelligence three-dimensional planning system. Orthopaedics. 2021;12(3):281-283. doi:10.3969/j.issn.1674-8573.2021.03.017.
- Chao W et al. Application of an artificial intelligence-assisted surgical planning system in precise implantation of individualized total hip prostheses. Orthopaedics. 2022;13(3):204-211. doi:10.3969/j.issn.1674-8573.2022.03.003.
- Yuanjie L, Xu L. Research progress of the iASSIST intelligent-assisted navigation system in total knee arthroplasty. Orthop J China. 2020;28(4):328-331. doi:10.3977/j.issn.1005-8478.2020.04.09.
- Li S et al. Development and validation of an artificial intelligence preoperative planning and patient-specific instrumentation system for total knee arthroplasty. Bioengineering (Basel). 2023;10(12):1417. doi:10.3390/bioengineering10121417.
- Lee IS et al. Reliability analysis of 16-MDCT in preoperative evaluation of total knee arthroplasty and comparison with intraoperative measurements. AJR Am J Roentgenol. 2006;186(6):1778-1782. doi:10.2214/AJR.05.1191.
- Song X, Zhewei Y. Application status and prospect of artificial intelligence in orthopedics. Chin J Med. 2019;54(2):117-119. doi:10.3969/j.issn.1008-1070.2019.02.001.
- Andrews SN et al. Fixed distal femoral cut of 6° valgus in total knee arthroplasty: A radiographic review of 788 consecutive cases. J Arthroplasty. 2019;34(4):755-759. doi:10.1016/j.arth.2018.12.013.
- Li Z et al. Deep learning approach for guiding three-dimensional computed tomography reconstruction of lower limbs for robotically assisted total knee arthroplasty. Int J Med Robot. 2021;17(5):e2300. doi:10.1002/rcs.2300.
- Min M et al. Comparison of traditional template measurements and artificial intelligence preoperative planning in total knee arthroplasty. Front Surg. 2025;12:1573148. doi:10.3389/fsurg.2025.1573148.
- Han-sheng H et al. Prosthesis size in total knee arthroplasty predicted using digital preoperative planning. Chin J Tissue Eng Res. 2014;18(40):6432-6437. doi:10.3969/j.issn.2095-4344.2014.40.007.
- Liao G et al. Efficiency assessment of intelligent patient-specific instrumentation in total knee arthroplasty: A prospective randomized controlled trial. J Orthop Surg Res. 2024;19(1):593. doi:10.1186/s13018-024-05010-5.
- Haruta Y et al. Deviation of the femoral intramedullary alignment rod influences coronal and sagittal alignment during total knee arthroplasty. Knee. 2018;25(4):644-649. doi:10.1016/j.knee.2018.04.011.
- Sharkey PF et al. Why are total knee arthroplasties failing today—has anything changed after 10 years? J Arthroplasty. 2014;29(9):1774-1778. doi:10.1016/j.arth.2013.07.024.
- Khan M, Osman K, Green G, Haddad FS. The epidemiology of failure in total knee arthroplasty: Avoiding your next revision. Bone Joint J. 2016;98-B(1 Suppl A):105-112. doi:10.1302/0301-620X.98B1.36293.
- Yue B et al. Differences in knee anthropometry between Chinese and White men and women. J Arthroplasty. 2011;26(1):124-130. doi:10.1016/j.arth.2009.11.020.