Ce protocole décrit des approches in vivo et in vitro pour étudier la manière dont la N-lactoyl-phénylalanine affecte la cardiomyopathie diabétique, le métabolisme lipidique cardiaque et la synthèse du cholestérol, en ciblant particulièrement la voie de la protéine kinase activée par l'adénosine monophosphate alpha 1/réductase de l'hydroxy-3-méthylglutaryl-coenzyme A.
Un abonnement JoVE est requis pour visualiser ce contenu. Connectez-vous ou commencez votre période d'essai gratuite.
Article de recherche
La N-lactoyl-phénylalanine améliore la fonction cardiaque dans un modèle murin de cardiomyopathie diabétique en régulant le métabolisme lipidique
Dans cet article
Résumé
Résumé
La cardiomyopathie diabétique (DCM) est l'une des complications les plus graves du diabète. La N-lactoyl-phénylalanine (Lac-Phe), un métabolite endogène, peut favoriser la perte de poids et améliorer l'homéostasie glucidique. Cette étude visait à évaluer l'effet thérapeutique de la Lac-Phe sur la DCM et à explorer davantage le mécanisme sous-jacent. Des souris diabétiques de type 2 présentant une DCM ont été traitées par Lac-Phe. La Lac-Phe a amélioré la fonction contractile cardiaque, atténué le remodelage pathologique et réduit l'accumulation lipidique dans le cœur. In vitro, les effets de la Lac-Phe ont été étudiés dans des cellules H9c2 stimulées par une concentration élevée de glucose et d'acide palmitique. La Lac-Phe a réduit l'accumulation lipidique en diminuant la synthèse du cholestérol dans les cellules H9c2. Sur le plan mécanistique, la Lac-Phe a favorisé la phosphorylation et l'activation de la protéine kinase activée par l'AMP (AMPKα1). Ensuite, l'AMPKα1 activée a phosphorylé et inhibé sa cible en aval, la 3-hydroxy-3-méthylglutaryl-coenzyme A réductase (HMGCR), entraînant une réduction de la synthèse du cholestérol et, en fin de compte, une amélioration du déséquilibre du métabolisme lipidique dans les cellules H9c2. Ces résultats indiquent que la Lac-Phe améliore le métabolisme lipidique dans les cellules H9c2 en cas de DCM via la voie AMPKα1/HMGCR, améliorant ainsi la fonction contractile cardiaque et atténuant le remodelage pathologique. La Lac-Phe pourrait représenter une approche thérapeutique potentielle pour la cardiomyopathie diabétique.
Introduction
Le diabète est une maladie métabolique caractérisée par une hyperglycémie persistante1Au cours des deux dernières décennies, le diabète est devenu l'une des dix principales causes de décès dans le monde, plus de six millions de personnes décédant chaque année du diabète et de ses complications.2. La cardiomyopathie diabétique (DCM), une affection cardiaque pathologique résultant du diabète, représente l'une des complications les plus graves associées au diabète3,4Il fonctionne comme un facteur de risque indépendant d'insuffisance cardiaque et se caractérise par des altérations structurelles et fonctionnelles du myocarde.5,6, notamment la fibrose cardiaque et l'hypertrophie des cardiomyocytes, qui conduisent finalement à une dysfonction diastolique et systolique. Bien que plusieurs thérapies cardiovasculaires conventionnelles, telles que βles bêta-bloquants, les inhibiteurs de l'enzyme de conversion de l'angiotensine et les bloqueurs du récepteur de type 1 de l'angiotensine II sont actuellement utilisés dans la prise en charge de la MCD7,8, leur efficacité reste sous-optimale en milieu clinique. Étant donné que les mécanismes sous-jacents à la MDC n'ont pas été étudiés de manière approfondie9, il n'existe actuellement aucune stratégie de traitement claire ciblant cette maladie10,11Les manifestations cliniques de la MCD évoluent d'une dysfonction diastolique asymptomatique au stade précoce à une dysfonction systolique et une insuffisance cardiaque clinique au stade avancé, pouvant même entraîner la mort.12,13Il est donc urgent d'explorer et de développer des options thérapeutiques efficaces pour cette affection.
Un métabolisme lipidique déséquilibré est une caractéristique clé de la MDC14. Dans la MDC, l'augmentation des niveaux d'acides gras libres (AGL) dans le sang peut entraîner une absorption excessive d'acides gras par les cardiomyocytes15,16. Le métabolisme des acides gras dans les cardiomyocytes dépend principalement de l'oxydation des acides gras. Avec le temps, l'oxydation des acides gras dans les cardiomyocytes est insuffisante pour métaboliser complètement tous les acides gras absorbés, et des acides gras en excès ainsi que leurs métabolites intermédiaires s'accumulent dans les cardiomyocytes17. Cette surcharge lipidique induit une lipotoxicité, perturbe l'approvisionnement énergétique myocardique et favorise le stress oxydatif cardiaque ainsi que les réponses inflammatoires, provoquant finalement des lésions sévères des cardiomyocytes18,19. Par conséquent, réguler activement le métabolisme lipidique cardiaque pourrait représenter une cible thérapeutique potentielle pour la MDC20.
Le N-lactoyl-phénylalanine (Lac-Phe) est un métabolite endogène dont la concentration augmente rapidement après l'exercice21. D'un point de vue mécanistique, le Lac-Phe est synthétisé par l'enzyme cytosolique carnosine dipeptidase 2 (CNDP2) via la condensation du lactate et du phénylalanine. Cette voie biosynthétique est largement répartie dans divers types cellulaires, notamment les macrophages, les cellules épithéliales et les cellules souches mésenchymateuses, qui sécrètent le Lac-Phe dans la circulation après une activité physique22. Une administration chronique de Lac-Phe s'est révélée efficace pour réduire l'apport alimentaire, diminuer l'obésité et le poids corporel, ainsi qu'améliorer l'homéostasie du glucose21. Une étude récente a montré que le Lac-Phe peut améliorer la capacité du métabolisme lipidique des microglies/macrophages après une lésion de la moelle épinière23. Fait intéressant, des études indiquent que l'administration aiguë et chronique de métformine, un traitement de première intention pour le diabète de type 2, peut augmenter les niveaux de Lac-Phe et que ce dernier médie les effets anti-obésité de la métformine22. De plus, Sha et al. ont récemment démontré que le Lac-Phe atténue la mort des cellules myocardiques en soulageant le dysfonctionnement mitochondrial, améliorant ainsi l'insuffisance cardiaque induite par la constriction aortique transversale (TAC)24. L'hyperglycémie prolongée et l'obésité sont des facteurs importants contribuant à la dysrégulation du métabolisme lipidique dans la cardiomyopathie diabétique (DCM)25. Dans leur ensemble, ces données suggèrent que le Lac-Phe pourrait avoir un effet thérapeutique potentiel sur la DCM. Cependant, à ce jour, le rôle spécifique du Lac-Phe dans la DCM n'a pas été étudié.
Dans cette étude, nous avons constaté que l'administration exogène de Lac-Phe à des souris atteintes de cardiomyopathie diabétique améliorait efficacement la fonction contractile cardiaque et atténuait le remodelage pathologique cardiaque. Nous avons découvert que Lac-Phe améliorait la fonction cardiaque chez les souris atteintes de CMD en régulant le déséquilibre du métabolisme lipidique. Lac-Phe réduisait l'accumulation de gouttelettes lipidiques (LD) dans les cardiomyocytes des souris atteintes de CMD et diminuait la teneur en cholestérol du cœur. Sur le plan mécanistique, Lac-Phe favorisait la phosphorylation et l'activation de la protéine kinase activée par l'adénosine monophosphate alpha 1 (AMPKα1), ce qui induisait la phosphorylation de la 3-hydroxy-3-méthylglutaryl-coenzyme A réductase (HMGCR). La phosphorylation de HMGCR diminue son activité, entraînant une réduction de la production de cholestérol et, par conséquent, une amélioration du déséquilibre du métabolisme lipidique dans les cardiomyocytes. Ces résultats fournissent une base théorique pour le traitement potentiel de la CMD par Lac-Phe.
Accès restreint. Veuillez vous connecter ou commencer un essai pour afficher ce contenu.
Protocole
The animal study protocol was approved by the Institutional Ethics Committee of Nanjing Drum Tower Hospital (Approval Number: 2025AE1065, 26 September 2025) and was conducted in accordance with the guidelines outlined in the Guidelines for the Care and Use of Laboratory Animals (8th Edition), published by the National Institutes of Health of the United States.
Animals
Thirty 5-week-old male C57BL/6J mice were used in this study. After 1 week of adaptive feeding, all mice were housed with access to food and water under an alternating 12 h day-night cycle at a temperature of 22°C ± 2°C and humidity of 40%–60%. An HFD combined with low-dose STZ was used to establish the DCM mouse model (Figure 1A). Four weeks after initiation of high-fat diet (HFD; 60% fat, 20% protein, and 20% carbohydrate) feeding, mice were fasted overnight and subsequently administered streptozotocin (STZ; 8 mg/mL dissolved in citrate buffer, pH 4.5) via intraperitoneal injection at a dosage of 35 mg/kg/day for three consecutive days. Control group mice were fed a control diet (10% fat, 20% protein, and 70% carbohydrate) and received equivalent volumes of citrate buffer. Following 15 additional weeks of high-fat diet maintenance, mice meeting both criteria, random blood glucose of ≥13.3 mmol/L and left ventricular ejection fraction (LVEF) of <55%, were defined as successfully established DCM models. These validated DCM mice were numbered and randomly assigned to the DCM and DCM + Lac-Phe groups using a random number table. Approximately half of the mice failed to develop the model; these animals were euthanized in accordance with animal ethics requirements. In brief, mice were divided into three groups: Control, DCM, and DCM + Lac-Phe (n = 10 for each group). All 10 mice per group underwent echocardiography, body weight measurement, and OGTT. Following the 28-day treatment period, hearts were collected for subsequent analyses. There were 10 mice in each group. Of these, three mice per group were used for transcriptome sequencing, three were used for transmission electron microscopy and histological staining, and three were used for protein expression analysis. The remaining mouse in each group was reserved as a backup. After successful establishment of the DCM model, Lac-Phe was dissolved in normal saline to a final concentration of 10 mg/mL. Mice in the DCM + Lac-Phe group received intraperitoneal Lac-Phe at 50 mg/kg/day in an injection volume of 5 mL/kg, once daily for 28 consecutive days. Mice in the Control and DCM groups were administered an equivalent volume of normal saline as vehicle control.
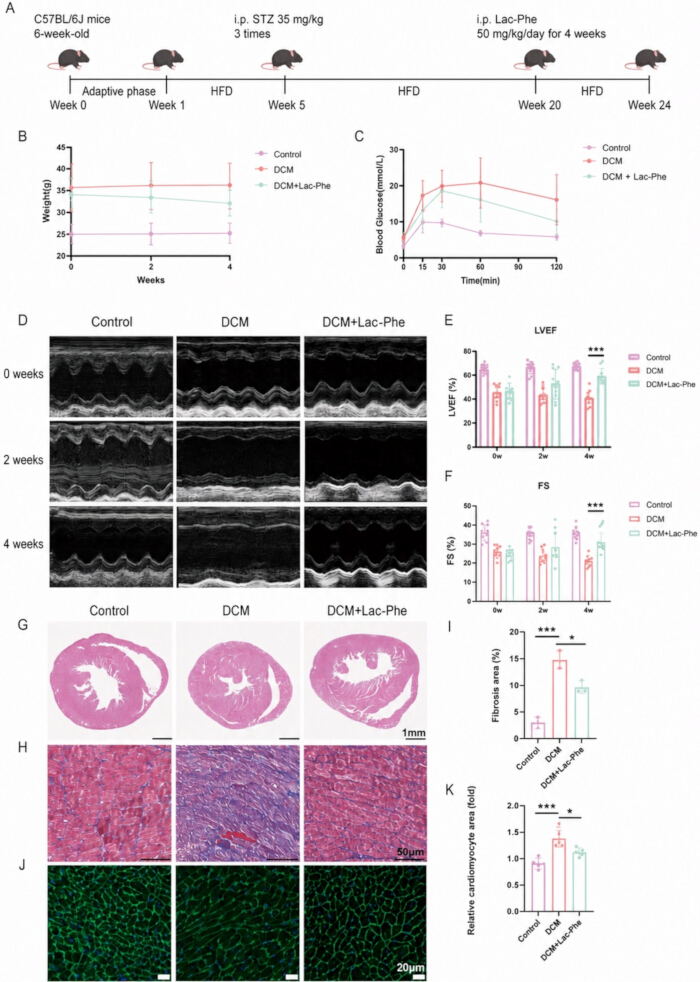
Figure 1. Lac-Phe improves cardiac function and pathological remodeling in mice with diabetic cardiomyopathy. (A) Schematic of the HFD/STZ-induced DCM mouse model and Lac-Phe treatment protocol. (B) Body weights of mice in the Control, DCM, and DCM + Lac-Phe groups during the 4-week treatment period; n = 10 per group. (C) Oral glucose tolerance test (OGTT) in the indicated groups; n = 10 per group. (D) Representative echocardiographic images at 0, 2, and 4 weeks of treatment. (E,F) Quantification of left ventricular ejection fraction (LVEF) (E) and fractional shortening (FS) (F); n = 10 per group. (G) Representative hematoxylin and eosin (H&E)-stained heart sections. Scale bar = 1 mm. (H,I) Representative Masson’s trichrome staining of heart sections (H) and quantification of fibrotic area (I); n = 3 per group. Scale bar = 50 μm. (J,K) Representative wheat germ agglutinin (WGA) staining of heart sections (J) and quantification of relative cardiomyocyte area (K); n = 3 per group. Scale bar = 20 μm. Data are presented as the mean ± standard deviation. P < 0.05, **P < 0.001. Please click here to view a larger version of this figure.
Cardiac function
Following anesthesia with isoflurane inhalation, mice were secured in a supine position on a temperature-controlled platform (37°C). Left ventricular dimensions and mitral valve blood flow velocity during diastole and systole were measured using an echocardiography machine equipped with a 40 MHz transducer, from which LVEF and shortening fraction (FS) were calculated. Three consecutive cardiac cycles were collected from each mouse.
Cell treatment
H9c2 cells were cultured in Dulbecco’s modified Eagle’s medium supplemented with 10% fetal bovine serum and 1% penicillin–streptomycin at 37°C in a humidified atmosphere containing 5% CO₂. Cells were passaged every 2–3 days upon reaching 70%–80% confluence. For experiments, cells were seeded in 10 cm dishes and then divided into three groups: Control, high glucose/palmitic acid (HG/PA), and HG/PA + Lac-Phe. Cells in the HG/PA and HG/PA + Lac-Phe groups were first exposed to 0.25 mM palmitic acid and 50 mM glucose for 24 h. Thereafter, cells in the HG/PA + Lac-Phe group were treated with 10 μg/mL Lac-Phe for an additional 24 h while HG/PA exposure was maintained; cells in the HG/PA group received an equivalent volume of PBS under the same HG/PA conditions. In the p-AMPK inhibition experiments, 10 μM AMPK-IN-3 (dissolved in DMSO) was added simultaneously with Lac-Phe for 24 h, and the corresponding control groups received an equal volume of DMSO. For the atorvastatin experiments, H9c2 cells under HG/PA conditions were treated with 10 μM atorvastatin for 24 h, either alone or in combination with 10 μg/mL Lac-Phe.
Histological staining
After 28 days of Lac-Phe administration, mouse hearts were harvested and immersion-fixed in 4% paraformaldehyde (pH 7.4) for 24 h. Fixed cardiac tissues were paraffin-embedded and sectioned into 6-μm-thick slices. Tissue sections were stained with hematoxylin and eosin, wheat germ agglutinin, and Masson’s trichrome. All staining procedures were performed strictly following the manufacturers’ protocols. Whole-slide imaging was performed at 20× magnification using a high-resolution brightfield microscope equipped with a digital camera system.
Western blot analysis
Protein concentration was determined using the Bradford assay. Tissue lysates were resolved by SDS-PAGE on 10% (w/v) acrylamide gels and electrophoretically transferred to polyvinylidene difluoride membranes. Nonspecific binding sites were blocked with 5% bovine serum albumin for 2 h at room temperature. Membranes were then incubated overnight at 4°C with primary antibodies (diluted 1:1,000), followed by six washes with TBST (5 min each) on a shaker. The membranes were then incubated with horseradish peroxidase-conjugated secondary antibodies (diluted 1:5,000) for 2 h at room temperature, followed by another six washes with TBST (5 min each). Protein bands were visualized using an enhanced chemiluminescence reagent kit. Quantification of western blot results was performed by densitometric analysis using ImageJ software. All antibodies used in this study are listed in the Table of Materials.
Transcriptomics
Total RNA was isolated from cardiac tissue of C57BL/6J mice using TRIzol Reagent and RNeasy mini kits. RNA quality was evaluated using a 2100 bioanalyzer, demonstrating high RNA purity and integrity. RNA-seq libraries were prepared according to the VAHTS Universal V10 RNA-seq Library Prep Kit and sequenced using an Illumina NovaSeq 6000 System (single-read, 150 bp). Differentially expressed genes were identified using DESeq2, with an adjusted P value < 0.05 and an absolute log₂ fold change > 1 considered statistically significant. Gene Ontology (GO) enrichment analysis was conducted on differentially expressed genes, and the significance of enrichment of differentially expressed genes in GO terms was calculated using the hypergeometric distribution algorithm.
Oil Red O staining and LD540 lipid staining
Cardiac tissue was embedded in OCT compound and then cut into 10-μm-thick sections. The frozen sections were equilibrated at room temperature for 30 min and fixed with 4% paraformaldehyde for 10 min. After washing with PBS, the sections were placed in 60% isopropyl alcohol for 15 s and covered with Oil Red O working solution for 30 min. The sections were then treated with 60% isopropyl alcohol for 15 s and washed three times with PBS. For LD540 lipid staining, H9c2 cells were washed with PBS and fixed with 4% paraformaldehyde for 10 min at room temperature. The cells were then incubated with 10 μM LD540 for 30 min at room temperature.
Transmission electron microscopy (TEM)
Fresh mouse heart tissues were cut into 1–2 mm3 pieces, fixed in electron microscope fixative at 4°C for 4 h, then washed with double-distilled water and immersed in ethanol solutions of progressively increasing concentrations. The samples were embedded, sectioned, and then observed under a transmission electron microscope.
Total cholesterol (TC) content
Total cholesterol (TC) levels in serum and H9c2 cell samples were measured using the Amplex Red Cholesterol and Cholesteryl Ester Assay Kit according to the manufacturer’s instructions.
Oral Glucose Tolerance Test (OGTT)
Mice were fasted for 14 h (from 19:00 to 9:00) and gavaged with glucose (20% stock, 2 g/kg). Blood glucose levels were determined using blood collected from the tail vein at 0, 15, 30, 60, and 120 min after gavage.
Cell counting kit-8 (CCK-8) measurement
CCK-8 was used to measure cell viability. H9c2 cells were seeded into 96-well plates at an initial density of 3 × 10⁴ cells/well. After treatment with different concentrations of Lac-Phe under HG/PA conditions for 24 h, 10 μL of the kit reagent was added to 100 μL of culture medium per well, followed by incubation at 37°C for 4 h. The absorbance was measured at 450 nm using a multimode microplate reader to obtain the optical density (OD) value.
Molecular docking
The crystal structures of Lac-Phe and AMPKα1 were downloaded from PubChem26. The molecular docking process was carried out using CB-DOCK227.
Statistical analysis
All echocardiographic measurements, histological staining, and image quantifications were performed by investigators blinded to group assignment. All data analyses were performed using Prism and SPSS 20.0. Each experiment was repeated at least three times, and the data were presented as the mean ± standard deviation. Homogeneity of variance was assessed using Levene’s test. Normality was confirmed by graphical inspection of residuals. Comparisons among multiple groups were conducted using one-way analysis of variance, followed by Tukey's post hoc test for pairwise comparisons. For OGTT data, two-way repeated-measures ANOVA was used, with group as the between-subjects factor and time as the within-subjects factor, followed by Bonferroni's post hoc test. P < 0.05 was considered statistically significant.
Accès restreint. Veuillez vous connecter ou commencer un essai pour afficher ce contenu.
Résultats
Lac-Phe améliore la fonction cardiaque chez des souris atteintes de cardiomyopathie diabétique
Nous avons induit une cardiomyopathie dilatée (DCM) chez des souris C57BL/6J à l'aide d'un régime riche en graisses (HFD) combiné à des injections de streptozotocine (STZ) (Figure 1A) et ont réparti aléatoirement les souris DCM correctement établies en un groupe non traité (groupe DCM) et un groupe traité au Lac-Phe, les souris C57BL/6J témoins servant d...
Accès restreint. Veuillez vous connecter ou commencer un essai pour afficher ce contenu.
Discussion
Dans cette étude, nous fournissons des preuves soutenant un effet thérapeutique du Lac-Phe sur la MCD. Le Lac-Phe a amélioré le remodelage cardiaque et la dysfonction cardiaque dans la MCD tout en réduisant la production de cholestérol dans les cardiomyocytes et en corrigeant le déséquilibre du métabolisme lipidique. Sur le plan mécanistique, le Lac-Phe a augmenté la phosphorylation de l'AMPKα1. Par la suite, l'augmentation de la phosphorylation de l'AMPKα1 a été associée à une augmentation de la phosphorylation et à l'i...
Accès restreint. Veuillez vous connecter ou commencer un essai pour afficher ce contenu.
Déclarations de divulgation
Conflit d'intérêts :
Les auteurs n'ont rien à divulguer.
Remerciements
Nous tenons à exprimer notre profonde gratitude aux chercheurs et au personnel du Collège clinique de l'hôpital Nanjing Drum Tower et de l'hôpital affilié de la faculté de médecine de l'Université de Nanjing pour leur soutien technique. Cette recherche a été financée par des subventions de la Fondation nationale des sciences naturelles de Chine (n° de subvention 81870291 et 82300384), de la Fondation chinoise des sciences postdoctorales (n° de subvention 2023M731625) et de la Fondation des sciences naturelles de la province du Jiangsu (n° de subvention BK20220175). Nous remercions également l'Institut d'innovation en synthèse avancée de l'Université Nanjing Tech pour les ressources et le soutien collaboratif fournis.
Accès restreint. Veuillez vous connecter ou commencer un essai pour afficher ce contenu.
Matériaux
| Nom | Entreprise | Numéro de catalogue | Commentaires |
|---|---|---|---|
| AMPK-IN-3 (inhibiteur de p-AMPK) | MedChemExpress (MCE) | HY-132921 | Utilisé à 10 μM au cours d'expériences d'inhibition de l'AMPK afin d'inhiber la signalisation de l'AMPK dans les cellules traitées par le Lac-Phe. |
| Kit d'analyse du cholestérol et des esters de cholestérol Amplex Red | Beyotime | S0211S | Utilisé pour déterminer les taux de cholestérol total dans des échantillons de sérum et de cellules H9c2. |
| Anti-AMPKα1 | Cell Signaling Technology | 2532 ; RRID : AB_330331 | Anticorps primaire utilisé pour l'analyse par immunotransfert de la protéine kinase activée par l'AMPα1. |
| Anti-GAPDH | Cell Signaling Technology | 5174 ; RRID : AB_10622025 | Anticorps primaire utilisé pour l'analyse par immunotransfert de GAPDH. |
| Anti-HMGCR | Abcam | ab174830 ; RRID : AB_2749818 | Anticorps primaire utilisé pour l'analyse par immunotransfert de HMGCR. |
| Anti-p-AMPKα1 (Thr172) | Cell Signaling Technology | 2535 ; RRID : AB_331250 | Anticorps primaire utilisé pour l'analyse par immunotransfert de l'AMPK phosphoryléeα1. |
| Anti-p-HMGCR (Ser872) | Abcam | ab124350 | Anticorps primaire utilisé pour l'analyse par immunotransfert de HMGCR phosphorylée. |
| anticorps anti-IgG de lapin marqué à la HRP | Cell Signaling Technology | 7074 ; RRID : AB_2099233 | Utilisé à une dilution de 1:5 000 pour la détection par immunoblotting. |
| Anti-β-tubuline | Cell Signaling Technology | 2128 ; RRID : AB_823664 | Anticorps primaire utilisé pour l'analyse par immunotransfert de β-tubuline |
| Atorvastatine | MedChemExpress (MCE) | HY-17379 | Utilisé seul ou en combinaison avec Lac-Phe pour évaluer les effets sur l'accumulation lipidique, les taux de cholestérol total et la phosphorylation de HMGCR dans les cellules H9c2 traitées au HG/PA. |
| albumine sérique bovine | Sigma-Aldrich | A7906 | Utilisé à 5 % pour bloquer la liaison non spécifique lors de l'analyse par immunotransfert. |
| Réactif ou kit de dosage de Bradford | Thermo Fisher Scientific | 23200 | Utilisé pour déterminer la concentration en protéines avant l'analyse par immunotransfert. |
| Souris C57BL/6J (mâles, âgées de 5 semaines) | Centre de recherche sur les animaux modèles de l'Université de Nanjing | N/A | Utilisé pour établir le modèle murin de cardiomyopathie diabétique induite par un régime riche en graisses (HFD) et la streptozotocine (STZ). |
| Kit de comptage cellulaire-8 (CCK-8) | Sharebio | SB-CCK8S | Utilisé pour mesurer la viabilité des cellules H9c2 après traitement. |
| Tampon citrate | Préparé en interne | N/A | Préparé à pH 4,5 et utilisé pour dissoudre la streptozotocine (STZ) ainsi que comme témoin véhicule correspondant. |
| Régime témoin (10 % de lipides, 20 % de protéines, 70 % de glucides) | Research Diets, Inc. | D12450J | Utilisé comme aliment pour les souris du groupe témoin. |
| D-(+)-Glucose | Sigma-Aldrich | N/A | Utilisé pour le traitement des cellules HG/PA et pour le test de tolérance orale au glucose. |
| Diméthylsulfoxyde (DMSO) | Sigma-Aldrich | D2650 | Utilisé comme solvant pour l'AMPK-IN-3 et comme contrôle véhicule correspondant. |
| Dulbecco’s modifié de Eagle’milieu s | Gibco, Thermo Fisher Scientific | 11965092 | Utilisé comme milieu de culture de base pour les cellules H9c2. |
| Appareil d'échocardiographie équipé d'un transducteur de 40 MHz | FUJIFILM VisualSonics | Vevo 3100 LT ; transducteur de 40 MHz | Utilisé pour mesurer les dimensions du ventricule gauche et la vélocité du flux sanguin au niveau de la valve mitrale, et pour déduire la fraction d'éjection du ventricule gauche (LVEF) et la fraction de raccourcissement (FS). |
| Fixateur pour microscope électronique | ServiceBio | G1102 | Utilisé pour fixer un tissu cardiaque de souris frais en vue d'une microscopie électronique en transmission. |
| Éthanol | Sigma-Aldrich | E7023 | Utilisé à des concentrations progressivement croissantes pour la déshydratation lors de la préparation d'échantillons en microscopie électronique en transmission. |
| sérum de veau fœtal | Gibco, Thermo Fisher Scientific | 10099141 | Utilisé à 10 % pour compléter le milieu de culture des cellules H9c2. |
| Ligne cellulaire H9c2 | Sunncell | RRID : CVCL_0286 | Utilisé comme modèle cellulaire cardiaque in vitro pour les expériences de traitement avec HG/PA et Lac-Phe. |
| Coloration à l'hématoxyline et à l'éosine | ServiceBio | G1005-1/2 | Utilisé pour l'évaluation histologique du tissu cardiaque. |
| Régime riche en lipides (60 % des kcal sous forme de lipides) | Research Diets, Inc. | D12492 | Utilisé avec une faible dose de STZ pour établir le modèle murin de cardiomyopathie diabétique. |
| Microscope en champ clair haute résolution | Leica | DM2500 | Utilisé pour l'imagerie complète de coupes de tissu cardiaque coloré à un grossissement de 20× grossissement |
| ImageJ | Instituts nationaux de la santé | N/A | Utilisé pour la quantification densitométrique des résultats de western blot. |
| Isoflurane | Sigma-Aldrich | 792632 | Utilisé pour l'anesthésie lors de l'échocardiographie chez la souris. |
| Alcool isopropylique | Sigma-Aldrich | I9516 | Utilisé à 60 % lors de la coloration par le rouge O sudan des coupes cardiaques congelées. |
| Coloration lipidique LD540 | Beyotime | C2050S-1 | Utilisé à 10 μM pour colorer les lipides intracellulaires. |
| Masson’coloration trichrome | ServiceBio | G1006 | Utilisé pour la coloration histologique du tissu cardiaque. |
| N-lactoyl-phénylalanine (Lac-Phe) | MedChemExpress (MCE) | HY-146098 | Administré à des souris DCM et utilisé pour traiter des cellules H9c2 exposées au HG/PA. |
| Solution de travail au Oil Red O | ServiceBio | G1015-100ML | Utilisé pour colorer les lipides dans des coupes de tissu cardiaque congelé. |
| Kit Omni-ECL de chimiluminescence efficace | EpiZyme | SQ203L | Utilisé pour la visualisation chimiluminescente des bandes protéiques après transfert western. |
| Acide palmitique | Sigma-Aldrich | P0500 | Utilisé à 0,25 mM avec du glucose élevé pour établir le modèle de cellules H9c2 traitées au HG/PA. |
| Paraformaldéhyde | Sigma-Aldrich | P6148 | Préparé sous forme de solution à 4 % et utilisé pour fixer les tissus et cellules cardiaques avant une coloration histologique ou lipidique. |
| Pénicilline-streptomycine | Gibco, Thermo Fisher Scientific | 15140122 | Utilisé à 1 % dans le milieu de culture des cellules H9c2. |
| Solution saline tamponnée au phosphate (PBS) | Gibco, Thermo Fisher Scientific | 10010023 | Utilisé pour les lavages au cours des procédures de coloration et comme véhicule correspondant dans les expériences de traitement des cellules. |
| Prism | GraphPad Software | Version 8.0 | Utilisé pour l'analyse statistique des données expérimentales. |
| membrane de transfert en PVDF, 0.45 μm | Thermo Fisher Scientific | 88518 | Utilisé pour le transfert électrophorétique des protéines lors de l'analyse par immunotransfert. |
| RNeasy Mini Kit | QIAGEN | 74104 | Utilisé pour l'isolement/la purification d'ARN total à partir de tissu cardiaque de souris. |
| Solution de chlorure de sodium à 0,9 % (sérum physiologique) | Sigma-Aldrich | S8776 | Utilisé pour dissoudre le Lac-Phe et comme contrôle véhicule pour les souris témoins et DCM. |
| SPSS | IBM | Version 20.0 | Utilisé pour l'analyse statistique des données expérimentales. |
| Streptozotocine (STZ) | Sigma-Aldrich | S0130 | Administré avec un régime riche en graisses (HFD) pour établir le modèle murin de cardiomyopathie diabétique. |
| Tampon TBS Tween-20 (20×) | Thermo Fisher Scientific | 28360 | Utilisé pour laver les membranes après l'incubation avec les anticorps primaires et secondaires lors de l'analyse par immunotransfert (western blot). |
| Tissue-Tek O.C.T. Compound | Sakura Finetek | 4583 | Utilisé pour inclure le tissu cardiaque avant la préparation de coupes congelées destinées à la coloration par le rouge Oil O. |
| Microscope électronique en transmission | HITACHI | HT7800 | Utilisé pour examiner les modifications ultrastructurales du tissu cardiaque de souris. |
| TRIzol Réactif | Invitrogen | 15596026 | Utilisé pour l'isolement d'ARN total à partir de tissu cardiaque de souris. |
| Kit de préparation de bibliothèque pour RNA-séq VAHTS Universal V10 | Vazyme | NR616-01 | Utilisé pour préparer les bibliothèques d'ARN-séq destinées à l'analyse transcriptomique. |
| Lectine de germe de blé (WGA) | ServiceBio | W7024 | Utilisé pour l'évaluation histologique du tissu cardiaque. |
Références
- Pan KL, Hsu YC, Chang ST, Chung CM, Lin CL. The role of cardiac fibrosis in diabetic cardiomyopathy: from pathophysiology to clinical diagnostic tools. Int J Mol Sci. 2023;24(10):8604.
- Saeedi P, et al. Global and regional diabetes prevalence estimates for 2019 and projections for 2030 and 2045: results from the International Diabetes Federation Diabetes Atlas, 9th edition. Diabetes Res Clin Pract. 2019;157:107843.
- Zou R, et al. PGAM5-mediated PHB2 dephosphorylation contributes to diabetic cardiomyopathy by disrupting mitochondrial quality surveillance. Research. 2022;2022:0001.
- Jia G, DeMarco VG, Sowers JR. Insulin resistance and hyperinsulinaemia in diabetic cardiomyopathy. Nat Rev Endocrinol. 2016;12(3):144–53.
- Low Wang CC, Hess CN, Hiatt WR, Goldfine AB. Clinical update: cardiovascular disease in diabetes mellitus: atherosclerotic cardiovascular disease and heart failure in type 2 diabetes mellitus—mechanisms, management, and clinical considerations. Circulation. 2016;133(24):2459–502.
- Liu P, Zhang Z, Chen H, Chen Q. Pyroptosis: mechanisms and links with diabetic cardiomyopathy. Ageing Res Rev. 2024;94:102182.
- Park JJ. Epidemiology, pathophysiology, diagnosis and treatment of heart failure in diabetes. Diabetes Metab J. 2021;45(2):146–57.
- Gilca GE, et al. Diabetic cardiomyopathy: current approach and potential diagnostic and therapeutic targets. J Diabetes Res. 2017;2017:1310265.
- Nakamura K, et al. Pathophysiology and treatment of diabetic cardiomyopathy and heart failure in patients with diabetes mellitus. Int J Mol Sci. 2022;23(7):3587.
- Han X, et al. Cardiomyocyte OTUD1 drives diabetic cardiomyopathy via directly deubiquitinating AMPKα2 and inducing mitochondrial dysfunction. Nat Commun. 2025;16(1):666.
- Jia G, Hill MA, Sowers JR. Diabetic cardiomyopathy: an update of mechanisms contributing to this clinical entity. Circ Res. 2018;122(4):624–38.
- Yao Y, Yang B, Shi J. TiO(x)(OH)(4-2x) nanosheets with catalytic antioxidative activity alleviate oxidative injury in diabetic cardiomyopathy. J Am Chem Soc. 2025;147(4):3885–95.
- Seferovic PM, et al. Diabetic myocardial disorder: a clinical consensus statement of the Heart Failure Association of the ESC and the ESC Working Group on Myocardial & Pericardial Diseases. Eur J Heart Fail. 2024;26(9):1893–903.
- Wang H, et al. Inhibition of fatty acid uptake by TGR5 prevents diabetic cardiomyopathy. Nat Metab. 2024;6(6):1161–77.
- Zhao Y, et al. Ferroptosis: roles and molecular mechanisms in diabetic cardiomyopathy. Front Endocrinol. 2023;14:1140644.
- Nakamura M. Lipotoxicity as a therapeutic target in obesity and diabetic cardiomyopathy. J Pharm Pharm Sci. 2024;27:12568.
- Nakamura M, et al. Glycogen synthase kinase-3α promotes fatty acid uptake and lipotoxic cardiomyopathy. Cell Metab. 2019;29(5):1119–34.e12.
- Ritchie RH, Abel ED. Basic mechanisms of diabetic heart disease. Circ Res. 2020;126(11):1501–25.
- Thakur M, Tupe RS. Lipoxin and glycation in SREBP signaling: insight into diabetic cardiomyopathy and associated lipotoxicity. Prostaglandins Other Lipid Mediat. 2023;164:106698.
- Dhar A, et al. A comprehensive review of the novel therapeutic targets for the treatment of diabetic cardiomyopathy. Ther Adv Cardiovasc Dis. 2023;17:17539447231210170.
- Li VL, et al. An exercise-inducible metabolite that suppresses feeding and obesity. Nature. 2022;606(7915):785–90.
- Xiao S, et al. Lac-Phe mediates the effects of metformin on food intake and body weight. Nat Metab. 2024;6(4):659–69.
- Ying W, et al. N-lactoyl-phenylalanine modulates lipid metabolism in microglia/macrophage via the AMPK-PGC1α-PPARγ pathway to promote recovery in mice with spinal cord injury. J Neuroinflammation. 2025;22(1):167.
- Sha L, et al. N-Lac-Phe ameliorates myocardial cell death by improving mitochondrial dysfunction, ultimately improving TAC-induced heart failure. Cardiovasc Drugs Ther. 2026;40:1391–401.
- Ke J, Pan J, Lin H, Gu J. Diabetic cardiomyopathy: a brief summary on lipid toxicity. ESC Heart Fail. 2023;10(2):776–90.
- PubChem. PubChem. Available from: https://pubchem.ncbi.nlm.nih.gov/. Accessed August 15, 2026.
- Liu Y, Yang X, Gan J, et al. CB-Dock2: improved protein-ligand blind docking by integrating cavity detection, docking and homologous template fitting. Nucleic Acids Res. 2022;50(W1):W159–W164.
- GeneCards. GeneCards: the Human Gene Database. Version 6.1, June 17, 2026.
- Daina A, Michielin O, Zoete V. SwissTargetPrediction: updated data and new features for efficient prediction of protein targets of small molecules. Nucleic Acids Res. 2019;47(W1):W357–W364.
- Jo Y, DeBose-Boyd RA. Post-translational regulation of HMG CoA reductase. Cold Spring Harb Perspect Biol. 2022;14(12):a041253.
- Steinberg GR, Hardie DG. New insights into activation and function of the AMPK. Nat Rev Mol Cell Biol. 2023;24(4):255–72.
- Istvan ES, Deisenhofer J. Structural mechanism for statin inhibition of HMG-CoA reductase. Science. 2001;292(5519):1160–4.
- Beaudry D, et al. Statin therapy in cardiovascular diseases other than atherosclerosis. Curr Atheroscler Rep. 2007;9(1):25–32.
- Koch CG. Statin therapy. Curr Pharm Des. 2012;18(38):6284–90.
- Dewanjee S, et al. Autophagy in the diabetic heart: a potential pharmacotherapeutic target in diabetic cardiomyopathy. Ageing Res Rev. 2021;68:101338.
- Madonna R, et al. Empagliflozin inhibits excessive autophagy through the AMPK/GSK3β signalling pathway in diabetic cardiomyopathy. Cardiovasc Res. 2023;119(5):1175–89.
- Madhavi YV, et al. Targeting AMPK in diabetes and diabetic complications: energy homeostasis, autophagy and mitochondrial health. Curr Med Chem. 2019;26(27):5207–29.
- Fang C, et al. The AMPK pathway in fatty liver disease. Front Physiol. 2022;13:970292.
- Liu S, et al. AICAR-induced activation of AMPK inhibits TSH/SREBP-2/HMGCR pathway in liver. PLoS One. 2015;10(5):e0124951.
- Zhou H, et al. Empagliflozin rescues diabetic myocardial microvascular injury via AMPK-mediated inhibition of mitochondrial fission. Redox Biol. 2018;15:335–46.
- Lu QB, et al. METRNL ameliorates diabetic cardiomyopathy via inactivation of cGAS/STING signaling dependent on LKB1/AMPK/ULK1-mediated autophagy. J Adv Res. 2023;51:161–79.
- Wang D, et al. FGF1(ΔHBS) prevents diabetic cardiomyopathy by maintaining mitochondrial homeostasis and reducing oxidative stress via AMPK/Nur77 suppression. Signal Transduct Target Ther. 2021;6(1):133.
- He L. Metformin and systemic metabolism. Trends Pharmacol Sci. 2020;41(11):868–81.
- Yang F, et al. Metformin inhibits the NLRP3 inflammasome via AMPK/mTOR-dependent effects in diabetic cardiomyopathy. Int J Biol Sci. 2019;15(5):1010–9.
- Regitz-Zagrosek V, Gebhard C. Gender medicine: effects of sex and gender on cardiovascular disease manifestation and outcomes. Nat Rev Cardiol. 2023;20(4):236–47.
- Evrony GD, Hinch AG, Luo C. Applications of single-cell DNA sequencing. Annu Rev Genomics Hum Genet. 2021;22:171–97.
- Verboom K, et al. Smarter single cell total RNA sequencing. Nucleic Acids Res. 2019;47(16):e93.
Accès restreint. Veuillez vous connecter ou commencer un essai pour afficher ce contenu.
Réimpressions et autorisations
Cet article a été publié
Vidéo bientôt disponible