Dans cette étude rétrospective portant sur 125 patientes présentant une infection persistante par le VPH à haut risque et un tableau de déficience du pancréas, le traitement par WDT associé à l'IFN-α-2b recombinant humain était lié à des résultats plus favorables en ce qui concerne les paramètres liés au VPH, la microécologie vaginale, les sous-ensembles de lymphocytes T périphériques et les symptômes, par rapport à l'IFN-α-2b recombinant humain seul, sans différence significative concernant le nombre global d'événements indésirables enregistrés.
Article de recherche
Étude rétrospective de la décoction Wandai associée à l'interféron alpha-2b humain recombinant dans les infections persistantes à haut risque Papillomavirus humain Infection
Dans cet article
Résumé
Résumé
Cette étude rétrospective a évalué les résultats cliniques associés à la décoction Wandai (WDT) associée à l'interféron α-2b humain recombinant (rhIFN-α-2b) chez des patientes présentant une infection persistante par le papillomavirus humain à haut risque (HR-HPV) et un tableau de déficience du pancréas, en accordant une attention particulière à la micro-écologie vaginale et aux sous-ensembles de lymphocytes T périphériques. Les données cliniques de 125 patientes traitées entre mars 2024 et septembre 2025 ont été analysées. Selon le régime thérapeutique, 57 patientes ont reçu la décoction WDT par voie orale associée à des suppositoires vaginaux de rhIFN-α-2b, tandis que 68 patientes ont reçu uniquement le rhIFN-α-2b. Les deux groupes ont suivi trois cures consécutives de traitement. Après le traitement, le groupe d'observation a présenté un taux d'efficacité total supérieur à celui du groupe témoin (89,47 % contre 72,06 %, p = 0,015) et un délai plus court jusqu'à la première conversion du VPH (P = 0,028), tandis que la distribution globale des quatre catégories de résultats pour le VPH (P = 0,060) et le taux de conversion spécifique pour les VPH16/18 (P = 0,138) ne différaient pas de manière significative. Des résultats plus favorables concernant la micro-écologie vaginale comprenaient un pH plus bas, une moindre positivité à l'esterase leucocytaire et au test à l'amine, ainsi que des taux plus élevés de statut normal de peroxyde d'hydrogène, de propreté vaginale de grade I-II et de prédominance de Lactobacillus (P < 0,05). La détection de champignons, les anomalies liées à la vaginose bactérienne et les infections mixtes étaient également moins fréquentes (P < 0,05). Le pourcentage de lymphocytes T CD4+ et le rapport CD4+/CD8+ étaient plus élevés après le traitement dans le groupe d'observation, tandis que le pourcentage de lymphocytes T CD8+ était plus bas (P < 0,05). Le score total des symptômes en médecine traditionnelle chinoise, la coloration anormale du col utérin et le saignement au contact présentaient également des résultats plus favorables. Le taux global d'événements indésirables enregistrés ne différait pas de manière significative entre les groupes (P = 0,057). L'association de la WDT au rhIFN-α-2b était liée à des résultats plus favorables en ce qui concerne le VPH, la micro-écologie vaginale, les sous-ensembles de lymphocytes T périphériques et les symptômes ; toutefois, la conception rétrospective de l'étude et les facteurs de confusion résiduels empêchent toute interprétation causale.
Introduction
Le cancer du col de l'utérus est l'un des tumeurs malignes courants du système reproducteur féminin, et une infection persistante par le papillomavirus humain à haut risque (HPV-HR) constitue une base importante de son apparition et de sa progression1. Des données épidémiologiques ont montré qu'environ 600 000 nouveaux cas de cancer du col de l'utérus et 340 000 décès associés ont été recensés dans le monde en 20202. Après une infection persistante par l'HPV-HR, les protéines précoces virales E6 et E7 peuvent perturber des voies liées aux suppresseurs de tumeurs telles que P53 et RB, favoriser une prolifération incontrôlée des cellules épithéliales du col de l'utérus et ainsi augmenter le risque de lésions intraépithéliales cervicales et de cancer du col de l'utérus3. Par conséquent, favoriser l'élimination de l'HPV-HR avant le développement de lésions cervicales reste une étape importante pour réduire le risque de progression de la maladie.
En pratique clinique, l'interféron α-2b humain recombinant (rhIFN-α-2b) est un médicament antiviral topique couramment utilisé contre l'infection par le VPH à haut risque (HR-HPV). Son action ne consiste pas simplement à tuer directement le virus, mais à inhiber la réplication virale et l'infection persistante en induisant l'expression de protéines antivirales, en renforçant les réponses immunitaires cellulaires et en régulant les réactions inflammatoires4. L'administration vaginale permet au médicament de se concentrer au niveau des lésions cervicales et vaginales. Elle est relativement facile à réaliser, assure une forte concentration locale du médicament et provoque moins d'effets indésirables systémiques5. Toutefois, certains patients présentent toujours une conversion lente vers un résultat négatif, une positivité persistante ou une récidive après traitement. Des administrations vaginales répétées peuvent également perturber l'équilibre micro-écologique local, entraînant une augmentation du pH vaginal, une réduction de la prédominance des Lactobacillus, une diminution de la production de peroxyde d'hydrogène, ainsi que des anomalies de l'esterase leucocytaire et de la sialidase. Dans les cas plus graves, cela peut augmenter le risque de candidose vulvo-vaginale, de vaginose bactérienne (BV) et d'infections mixtes6,7. Une fois que la micro-écologie vaginale est déséquilibrée, la barrière muqueuse et la défense immunitaire locale sont affaiblies, ce qui rend l'élimination du VPH plus difficile8.
Les études pertinentes de médecine traditionnelle chinoise (MTC) interprètent souvent les manifestations cliniques associées à l'infection persistante par le VPH à haut risque (VPH-HR) sous l'angle du pathogène humidité, des leucorrhées anormales et de l'insuffisance du qi sain, et les associent généralement à une augmentation des leucorrhées, à une couleur et une texture anormales des sécrétions, à de la fatigue, à une mauvaise appétit, à une distension abdominale et à des selles molles9. La décoction Wandai (WDT) est une formule gynécologique couramment utilisée. Dans cette étude, elle a été administrée selon la pathogenèse d'une déficience du pancréas associée à une accumulation d'humidité et à un dysfonctionnement du vaisseau ceinture. Des études récentes ont montré que la WDT peut améliorer la structure de la flore vaginale chez les patientes atteintes de candidose vulvo-vaginale de type déficience du pancréas et accumulation d'humidité, suggérant son rôle potentiel dans la régulation de la micro-écologie vaginale10. Du point de vue de la pharmacologie moderne, les composants médicinaux présents dans la formule possèdent des effets anti-inflammatoires et immunomodulateurs et pourraient améliorer la barrière muqueuse et inhiber la prolifération microbienne anormale. Ces effets pourraient contribuer à rétablir l'homéostasie vaginale locale, à soulager les symptômes de leucorrhée et à améliorer la réponse immunitaire faible associée à l'infection persistante par le VPH-HR11.
Les rôles du rhIFN-α-2b et de certaines préparations médicinales chinoises ou formules à base de plantes dans le traitement des infections par le VPH à haut risque ont été rapportés12,13. L'interféron agit principalement par des effets antiviraux locaux et une activation immunitaire, tandis que le WDT vise à renforcer le pancréas, éliminer l'humidité, soutenir le qi sain, éliminer les agents pathogènes, améliorer les leucorrhées et réguler la micro-écologie. Théoriquement, la combinaison des deux est bien complémentaire. Elle pourrait contribuer à réduire les effets indésirables du traitement local unique sur la micro-écologie vaginale, favoriser le rétablissement du pouvoir prédominant des Lactobacilles, corriger le déséquilibre des sous-ensembles de lymphocytes T périphériques et soulager simultanément les syndromes liés à la leucorrhée par déficience du pancréas. Toutefois, les preuves directement en faveur de cette hypothèse restent limitées.
Sur cette base, la présente étude a inclus des patientes présentant une infection persistante par le VPH à haut risque de type déficience du pancréas, et a comparé l'efficacité clinique, les résultats relatifs au VPH, la micro-écologie vaginale et d'autres aspects de la thérapie combinée par WDT et l'IFN-α-2b recombinant humain (rhIFN-α-2b) par rapport au rhIFN-α-2b seul, afin de fournir des preuves cliniques pour améliorer l'élimination du VPH à haut risque, corriger le déséquilibre micro-écologique vaginal, soulager les symptômes de leucorrhée liés à la déficience du pancréas, et optimiser les stratégies thérapeutiques intégrant la médecine chinoise et la médecine occidentale.
Protocole
Le protocole de l'étude a été examiné et approuvé par l'Hôpital de santé maternelle et infantile du comté de Changxing (numéro d'approbation : kyl1-1x-2023 (045)). Étant donné qu'il s'agissait d'une analyse rétrospective de dossiers cliniques existants, l'exigence de consentement éclairé a été levée. Les outils de recherche utilisés dans ce protocole sont répertoriés dans le Tableau des matériaux.
1. Sujets de l'étude
Des données cliniques provenant de patientes atteintes d'une infection persistante par le papillomavirus humain à haut risque (HPV-HR) et présentant un tableau de déficience du pancréas, traitées au Maternity and Child Healthcare Hospital du comté de Changxing de mars 2024 à septembre 2025, ont été recueillies de manière rétrospective. Selon le traitement réellement administré, les patientes ayant reçu une décoction orale de Wandai (WDT) en complément d'un traitement par interféron humain recombinant α-2b (rhIFN-α-2b) ont été affectées au groupe d'observation (n = 57), tandis que celles ayant reçu uniquement le traitement par rhIFN-α-2b ont été affectées au groupe témoin (n = 68). Toutes les données des cas ont été extraites des dossiers médicaux électroniques des consultations externes, du système d'information de laboratoire et d'autres bases de données hospitalières.
2. Critères diagnostiques et de différenciation des tableaux
Une infection persistante par VPH-HR a été définie de manière opérationnelle par la détection d'au moins un génotype identique de VPH-HR dans deux prélèvements cervicaux consécutifs obtenus à au moins trois mois d'intervalle avant le traitement. Chez les patientes présentant des infections multiples, la persistance a été définie par la présence d'au moins un génotype de VPH-HR aux deux points temporels14. Les patientes pouvaient présenter un écoulement vaginal anormal, des manifestations inflammatoires cervicales locales ou une cytologie cervicale anormale ; toutefois, les patientes présentant des lésions cervicales de haut grade ou une malignité cervicale nécessitant une chirurgie immédiate, un traitement physique ou une prise en charge oncologique n'ont pas été incluses.
La différenciation des syndromes en médecine traditionnelle chinoise (MTC) a été réalisée conformément aux critères diagnostiques du syndrome de « leucorrhée » énoncés dans les Principes directeurs pour la recherche clinique de nouveaux médicaments chinois15. Un syndrome de déficience du pancréas était diagnostiqué en présence d'au moins deux des trois manifestations majeures suivantes : augmentation des leucorrhées, écoulement blanc ou jaune pâle, écoulement liquide, ainsi que d'au moins une manifestation secondaire parmi les suivantes : teint pâle ou terne, fatigue ou œdème des membres, perte d'appétit, selles molles ou inconfort épigastrique ou hypochondriaque, avec des signes linguistiques et des pouls compatibles. La classification des syndromes n'utilisait pas de seuil numérique basé sur un score total. Pour l'évaluation des résultats, le score total du syndrome MTC comprenait huit items — quantité des leucorrhées, couleur, consistance, teint, fatigue ou œdème des membres, appétit, consistance des selles et inconfort épigastrique ou hypochondriaque — chacun noté de 0 à 3 selon des critères de gravité prédéfinis (Tableau supplémentaire 1), ce qui donnait un score total variant de 0 à 24 ; des scores plus élevés indiquaient une sévérité symptomatique plus importante.
3. Critères d'inclusion et de exclusion
Les critères d'inclusion étaient les patientes âgées de 18 à 65 ans ; la positivité au VPH-HR avant le traitement et le respect de la définition d'une infection persistante ; une différentiation du syndrome selon la MTC compatible avec un écoulement vaginal dû à une déficience du pancréas ; un traitement par l'IFN-α-2b rh ou par la WDT associée à l'IFN-α-2b rh ; la disponibilité d'au moins les résultats des tests de dépistage du VPH, d'un examen microécologique vaginal, d'une évaluation des symptômes selon la MTC et d'une évaluation de l'efficacité avant et après le traitement ; ainsi que des dossiers médicaux et des données de suivi suffisants pour l'analyse des résultats principaux.
Les critères d'exclusion étaient la grossesse ou l'allaitement ; les lésions intraépithéliales cervicales de haut grade, le cancer du col de l'utérus ou d'autres lésions cervicales nécessitant une intervention chirurgicale immédiate ; une maladie sévère du cœur, du foie, des reins ou du système hématopoïétique, une tumeur maligne ou une maladie d'immunodéficience ; l'utilisation récente d'immunosuppresseurs, de glucocorticoïdes ou d'autres médicaments pouvant affecter significativement la fonction immunitaire ; l'administration concomitante d'autres traitements anti-HPV, de préparations de micro-écologie vaginale, d'antibiotiques ou d'autres traitements pouvant influencer l'évaluation de l'efficacité pendant le traitement ; une maladie mentale rendant impossible la coopération au traitement ou au suivi ; ainsi que la perte de principaux indicateurs d'observation empêchant la détermination des résultats liés au VPH ou de l'efficacité clinique.
4. Méthodes de traitement
Le groupe témoin a reçu des suppositoires vaginaux de rhIFN-α-2b. Avant le coucher, la vulve et les mains étaient nettoyées, une gaine digitale en film était portée, et le suppositoire était introduit dans le cul-de-sac vaginal postérieur, près du col de l'utérus. Chaque cycle de traitement par le rhIFN-α-2b comprenait neuf administrations vaginales, effectuées une fois tous les deux jours. Trois cycles consécutifs, correspondant à 27 administrations prévues au total, ont été prescrits. Les patientes ayant des règles régulières ont commencé le traitement le troisième jour suivant la fin des menstruations, et l'administration a été suspendue pendant les règles. Les patientes ayant des règles irrégulières ont utilisé le médicament selon le cycle de traitement, avec une suspension pendant les menstruations. Les patientes postménopausées ont commencé le traitement le jour suivant la réception du médicament. Pendant le traitement, les patientes ont été invitées à réduire la fréquence des rapports sexuels et à utiliser correctement des préservatifs. L'efficacité a été évaluée après trois cycles de traitement consécutifs.
Le groupe d'observation a reçu le WDT en complément du traitement susmentionné. La prescription comprenait Codonopsis Radix (15 g), Atractylodis Macrocephalae Rhizoma (15 g), Dioscoreae Rhizoma (30 g), Paeoniae Radix Alba (10 g), Atractylodis Rhizoma (10 g), Plantaginis Herba (10 g), Schizonepetae Spica Carbonisata (5 g), Citri Reticulatae Pericarpium (5 g), Bupleuri Radix (10 g) et Glycyrrhizae Radix et Rhizoma (6 g). Les morceaux destinés à la décoction herbale étaient fournis par la pharmacie chinoise ambulatoire de l'Hôpital de soins de santé maternelle et infantile du comté de Changxing. Chaque prescription quotidienne était mise à tremper dans de l'eau potable pendant 30 minutes, le niveau d'eau se situant approximativement à 2–5 cm au-dessus des herbes, puis décoctée deux fois après ébullition, pendant 25 minutes pour la première décoction et 20 minutes pour la seconde. Les deux extraits étaient combinés et ajustés à un volume final de 400 mL, avec 200 mL pris le matin et 200 mL le soir. L'identification des drogues brutes, le poids délivré et la conformité de la prescription étaient vérifiés par des pharmaciens agréés en médecine traditionnelle chinoise conformément à la procédure opérationnelle normalisée de la pharmacie hospitalière, et les dossiers du fournisseur/lot, de la préparation et de la délivrance étaient conservés. Chaque cure comprenait 14 jours de traitement, et le traitement se poursuivait pendant trois cures, avec une suspension de l'administration pendant les règles. L'observance était évaluée rétrospectivement à partir des dossiers de prescription et de suivi. L'achèvement des trois cures prescrites sans interruption prématurée du traitement enregistrée était considéré comme une bonne observance, tandis que la suspension définie par le protocole pendant les règles n'était pas considérée comme une non-observance. Toute interruption prématurée était conservée comme un critère de sécurité enregistré séparément.
5. Indicateurs d'observation
- Efficacité clinique et résultats liés au VPH
La détection de l'ADN du VPH à haut risque (VPH-HR) et le génotypage ont été réalisés à l'aide d'un test commercial de génotypage du VPH. Une amplification par réaction en chaîne par polymérase a été suivie d'une hybridation en flux. Ce test détecte les VPH 6, 11, 16, 18, 31, 33, 35, 39, 42, 43, 44, 45, 51, 52, 53, 56, 58, 59, 66, 68 et 81. Dans cette étude, le VPH-HR a été défini comme une positivité pour l'un des génotypes VPH 16, 18, 31, 33, 35, 39, 45, 51, 52, 56, 58, 59, 66 ou 68.
Des prélèvements de cellules exfoliées du col utérin ont été recueillis au moment du bilan initial, dans les 7 jours précédant le premier cycle de traitement. Des tests de suivi du VPH ont été effectués après chaque cycle de traitement, à intervalles d'environ un mois, afin de déterminer le délai jusqu'à la première conversion, et le dernier prélèvement post-traitement a été effectué environ 4 semaines après la fin du troisième cycle. Après un retrait doux de l'excès de mucus cervical, une brosse cervicale stérile a été insérée au niveau de l'orifice cervical et tournée cinq fois, puis immédiatement placée dans le milieu de conservation fourni. Les échantillons ont été étiquetés avec un identifiant unique du patient et la date de prélèvement, conservés à 4 °C et analysés dans les 48 heures. Les prélèvements initiaux et de suivi ont été traités dans le même laboratoire, en utilisant le même test, la même plateforme et les mêmes critères d'interprétation.
Chaque série d'analyses comprenait des contrôles positifs et négatifs spécifiés par le test, ainsi qu'un contrôle interne d'amplification et un contrôle d'hybridation à la biotine. Les résultats n'étaient acceptés que si tous les contrôles requis étaient valides. Les échantillons présentant un contrôle interne défaillant ou un profil d'hybridation indéterminé étaient réextraits et retravaillés. Si les analyses répétées restaient invalides, un nouvel échantillon était demandé. Le laboratoire a participé au programme d'évaluation externe de la qualité du Centre national des laboratoires cliniques pour le génotypage du VPH pendant la période de l'étude. La classification par groupe d'étude a été effectuée rétrospectivement lors de l'extraction des données et n'était donc pas disponible pour le personnel du laboratoire au moment de l'interprétation des résultats du VPH.
Les résultats post-traitement du VPH-HR ont été classés en quatre catégories mutuellement exclusives : conversion complète en négatif, conversion partielle en négatif, positivité persistante ou génotype du VPH nouvellement positif. Chez les patientes présentant des infections multiples, une conversion complète exigeait que tous les génotypes du VPH-HR détectés au départ deviennent indétectables ; une conversion partielle nécessitait l'élimination d'au moins un génotype de départ, mais pas de tous ; une positivité persistante indiquait la détection continue d'un ou plusieurs génotypes de départ sans détection d'un nouveau génotype ; enfin, si un nouveau génotype du VPH-HR était détecté lors du suivi, le cas était classé dans la catégorie « nouvellement positif » pour l'analyse en quatre catégories. Le taux d'efficacité total a été défini comme la proportion de patientes ayant présenté une conversion complète ou partielle. Chez les patientes positives pour le VPH16 et/ou le VPH18 au départ, la conversion spécifique au VPH16/18 exigeait que le ou les génotypes correspondants du VPH16/18 au départ deviennent indétectables, indépendamment de la persistance d'un autre génotype du VPH-HR. Le délai jusqu'à la première conversion du VPH a été calculé à partir du début du traitement jusqu'à la première conversion complète ou partielle documentée. - Indicateurs physicochimiques, enzymatiques et de score de la micro-écologie vaginale
Des échantillons de sécrétion vaginale ont été recueillis avant et après le traitement pour l'examen de la micro-écologie vaginale, incluant le pH vaginal, le peroxyde d'hydrogène, l'estérase leucocytaire, la sialidase, le test à l'amine et la propreté vaginale. Le score de Nugent16, le score de Donders17, ainsi que la détermination d'une micro-écologie normale ou perturbée ont également été extraits. D'après les rapports de micro-écologie vaginale, la prédominance de Lactobacillus, la détection de champignons, la détection de Trichomonas, les anomalies liées à la vaginose bactérienne (VB) et les infections mixtes ont été notées. La récupération de la prédominance de Lactobacillus après le traitement a été évaluée chez les patientes qui n'en présentaient pas au départ. L'examen micro-écologique de routine classait la prédominance de Lactobacillus sans identification au niveau de l'espèce et ne distinguait pas les souches productrices de H₂O₂ de celles qui n'en produisent pas. - Indicateurs de la fonction immunitaire périphérique
Un prélèvement de sang veineux périphérique a été effectué avant et après le traitement. Les pourcentages de lymphocytes T CD4+ et CD8+ ont été mesurés par cytométrie en flux à l'aide d'un réactif à quatre couleurs pour les sous-populations de lymphocytes T, et le rapport CD4+/CD8+ a été calculé. - Signes locaux au col utérin et résultats de l'examen gynécologique
Les signes locaux au col utérin ont été extraits des comptes rendus d'examen gynécologique, notamment l'éctropion de l'épithélium cylindrique du col, la coloration anormale du col, l'hypertrophie du col, la présence de polypes ou de lésions ressemblant à un néoplasme, et les saignements au contact. - Amplitude de l'amélioration des principaux résultats
Les réductions du score de Nugent, du score de Donders et du score total du syndrome selon la médecine traditionnelle chinoise (MTC) ont été calculées. La récupération de la prédominance de Lactobacillus a été évaluée chez les patientes qui n'en présentaient pas au départ, et la normalisation micro-écologique a été déterminée d'après la classification intégrée finale figurant dans le rapport de micro-écologie vaginale de routine.
6. Sécurité
Les réactions indésirables survenues pendant et après le traitement ont été extraites des dossiers médicaux et des comptes rendus de suivi, notamment les démangeaisons vaginales, la sensation de brûlure vaginale et d'autres symptômes. Les anomalies microécologiques vaginales détectées par examens de laboratoire n'ont pas été classées comme des événements indésirables, sauf si un diagnostic clinique ou un symptôme correspondant était documenté dans le dossier médical ou de suivi.
7. Méthodes statistiques
Les analyses statistiques ont été effectuées à l'aide d'un logiciel statistique. Les données quantitatives ont d'abord été testées pour la normalité. Les données normalement distribuées ont été exprimées sous la forme moyenne ± écart-type, et les comparaisons entre groupes ont été réalisées à l'aide du test t pour échantillons indépendants, tandis que les comparaisons intra-groupe avant et après le traitement ont été effectuées à l'aide du test t apparié. Les données non normalement distribuées ont été exprimées sous la forme médiane (intervalle interquartile), et les comparaisons entre groupes ont été réalisées à l'aide du test U de Mann-Whitney, tandis que les comparaisons intra-groupe avant et après le traitement ont été effectuées à l'aide du test de Wilcoxon. Les données de dénombrement ont été exprimées en nombre de cas et en pourcentage, et les comparaisons entre groupes ont été réalisées à l'aide du test χ2 ou du test exact de Fisher. Les données ordinales ont été analysées à l'aide du test de somme des rangs.
Afin d'évaluer la robustesse de l'association entre le traitement et le taux d'efficacité total en fonction des différences mesurées au départ, une régression de Poisson modifiée avec variance robuste a été ajustée, incluant comme covariables le groupe de traitement, l'âge, la durée de la maladie, l'indice de masse corporelle, le nombre initial de génotypes positifs pour le VPH et le statut initial pour le VPH16/18. Les risques relatifs ajustés (RR) et les intervalles de confiance à 95 % (IC) ont été rapportés. L'association post-traitement entre la prédominance de Lactobacillus et un statut normal de peroxyde d'hydrogène a été explorée à l'aide du test χ2, des tableaux de contingence spécifiques à chaque groupe de traitement étant utilisés pour évaluer la cohérence du sens de l'association. Une valeur de P < 0,05 a été considérée comme statistiquement significative.
Résultats
Comparison of baseline characteristics
Before treatment, no statistically significant differences were observed between the two groups in age, disease duration, body mass index (BMI), menstrual status, number of HPV-infected genotypes, or other baseline characteristics (P > 0.05; Table 1).
| Observation group (n=57) | Control group (n=68) | Statistic | P value | |
| Age (years) | 41.37±8.21 | 42.07±8.75 | t=-0.461 | 0.645 |
| Disease duration (months) | 14.82±5.76 | 15.26±6.14 | t=-0.410 | 0.682 |
| BMI (kg/m²) | 22.67±2.58 | 22.94±2.64 | t=-0.573 | 0.567 |
| Regular menstruation | 42 (73.68) | 50 (73.53) | χ2=0.120 | 0.942 |
| Irregular menstruation | 10 (17.54) | 13 (19.12) | ||
| Menopause | 5 (8.77) | 5 (7.35) | ||
| Single genotype infection | 36 (63.16) | 42 (61.76) | χ2=0.026 | 0.873 |
| Multiple genotype infection | 21 (36.84) | 26 (38.24) | ||
| HPV16/18 positive | 20 (35.09) | 25 (36.76) | χ2=0.038 | 0.846 |
| Number of HPV-positive genotypes | 1.39±0.53 | 1.41±0.58 | t=-0.259 | 0.796 |
| TCT NILM | 42 (73.68) | 50 (73.53) | χ2=0.000 | 1 |
| TCT ASC-US | 10 (17.54) | 12 (17.65) | ||
| TCT LSIL | 5 (8.77) | 6 (8.82) | ||
| Baseline vaginal pH | 5.18±0.43 | 5.22±0.45 | t=-0.489 | 0.626 |
| Baseline CD4+/CD8+ | 1.17±0.25 | 1.15±0.27 | t=0.441 | 0.66 |
| Baseline total TCM syndrome score (points) | 18.46±4.09 | 18.22±4.36 | t=0.309 | 0.758 |
Table 1: Baseline characteristics of the two groups. Baseline demographic and clinical characteristics of the observation and control groups, including age, disease duration, body mass index, menstrual status, HPV infection characteristics, cervical cytology findings, vaginal pH, CD4+/CD8+ ratio, and total traditional Chinese medicine syndrome score.
Comparison of clinical efficacy and HPV outcomes
After treatment, the total effective rate was higher in the observation group than in the control group (89.47% vs. 72.06%; χ2 = 5.878, P = 0.015), and the association remained after adjustment for measured baseline covariates (adjusted RR = 1.23, 95% CI 1.08–1.40, P = 0.002). Complete conversion to negative occurred in 66.67% and 45.59% of patients, respectively; however, the overall four-category HPV outcome distribution did not reach statistical significance (χ2 = 7.406, P = 0.060). The time to first HPV conversion was shorter in the observation group (P = 0.028), whereas the HPV16/18-specific conversion rate did not differ significantly between groups (70.00% vs. 48.00%, P = 0.138; Table 2). In exploratory analyses stratified by baseline HPV16/18 status, complete HR-HPV conversion occurred in 1/20 (5.00%) versus 0/25 (0.00%) HPV16/18-positive patients (Fisher’s exact P = 0.444) and in 37/37 (100.00%) versus 31/43 (72.09%) HPV16/18-negative patients (Fisher’s exact P < 0.001) in the observation and control groups, respectively. Most HPV16/18-positive infections were multiple-type infections at baseline (17/20 and 24/25, respectively; Supplementary Table 1).
| Observation group (n=57) | Control group (n=68) | Statistic | P value | |
| Total effective rate | 51 (89.47) | 49 (72.06) | χ2=5.878 | 0.015 |
| Complete conversion to negative | 38 (66.67) | 31 (45.59) | χ2=7.406 | 0.06 |
| Partial conversion to negative | 13 (22.81) | 18 (26.47) | ||
| Persistent positivity | 5 (8.77) | 15 (22.06) | ||
| Newly positive HPV genotype | 1 (1.75) | 4 (5.88) | ||
| HPV16/18 conversion to negative | 14/20 (70.00) | 12/25 (48.00) | χ2=2.204 | 0.138 |
| Time to first HPV conversion (months, effective cases) | 2.25±0.74 | 2.59±0.76 | t=-2.238 | 0.028 |
Table 2: Clinical efficacy and HPV outcomes after treatment. Post-treatment clinical efficacy and HPV outcomes in the observation and control groups, including complete conversion to negative, partial conversion to negative, persistent positivity, newly positive HPV genotype, total effective rate, HPV16/18-specific conversion, and time to first HPV conversion. The overall comparison across the four HPV outcome categories was χ2 = 7.406, P = 0.060.
Comparison of physicochemical and enzymatic indicators of vaginal microecology
Before treatment, no differences were observed in vaginal microecological examination results between the two groups (P > 0.05). After treatment, vaginal pH was lower in the observation group than in the control group (P < 0.001), and the reduction in vaginal pH was greater in the observation group (P = 0.004). In addition, the rate of normal hydrogen peroxide status and the proportion of vaginal cleanliness grade I–II were higher in the observation group than in the control group (P = 0.015 and P = 0.007, respectively), whereas leukocyte esterase positivity and amine-test positivity were lower (P = 0.022 and P = 0.026, respectively). The difference in sialidase positivity between the two groups was not statistically significant (P = 0.055; Table 3).
| Observation group (n=57) | Control group (n=68) | Statistic | P value | |
| Vaginal pH (before treatment) | 5.18±0.43 | 5.22±0.45 | t=-0.489 | 0.626 |
| Vaginal pH (after treatment) | 4.54±0.31 | 4.78±0.34 | t=-4.150 | <0.001 |
| Reduction in vaginal pH | 0.63±0.36 | 0.43±0.41 | t=2.906 | 0.004 |
| Normal hydrogen peroxide (before treatment) | 19 (33.33) | 21 (30.88) | χ2=0.086 | 0.77 |
| Normal hydrogen peroxide (after treatment) | 43 (75.44) | 37 (54.41) | χ2=5.950 | 0.015 |
| Leukocyte esterase positive (before treatment) | 41 (71.93) | 50 (73.53) | χ2=0.040 | 0.841 |
| Leukocyte esterase positive (after treatment) | 17 (29.82) | 34 (50.00) | χ2=5.226 | 0.022 |
| Sialidase positive (before treatment) | 31 (54.39) | 39 (57.35) | χ2=0.111 | 0.739 |
| Sialidase positive (after treatment) | 12 (21.05) | 25 (36.76) | χ2=3.673 | 0.055 |
| Amine test positive (before treatment) | 29 (50.88) | 35 (51.47) | χ2=0.004 | 0.947 |
| Amine test positive (after treatment) | 10 (17.54) | 24 (35.29) | χ2=4.934 | 0.026 |
| Vaginal cleanliness grade I-II (before treatment) | 18 (31.58) | 20 (29.41) | χ2=0.069 | 0.793 |
| Vaginal cleanliness grade I-II (after treatment) | 45 (78.95) | 38 (55.88) | χ2=7.394 | 0.007 |
Table 3: Vaginal physicochemical and enzymatic indicators before and after treatment. Comparison of vaginal pH, hydrogen peroxide status, leukocyte esterase positivity, sialidase positivity, amine-test positivity, and vaginal cleanliness grade before and after treatment in the observation and control groups.
Comparison of vaginal flora and pathogenic microorganism detection
After treatment, Lactobacillus predominance was more frequent in the observation group than in the control group (P = 0.008), whereas fungal detection, bacterial vaginosis (BV)-related abnormalities, and mixed infection were less frequent (P < 0.05). Trichomonas detection did not differ between groups (P = 0.500; Table 4). Across all patients, normal post-treatment hydrogen peroxide status was more frequent when Lactobacillus predominance was present than when it was absent (62/81 [76.54%] vs. 18/44 [40.91%]; χ2 = 15.714, P < 0.001). The same direction was observed in the observation group (84.09% vs. 46.15%) and the control group (67.57% vs. 38.71%).
| Observation group (n=57) | Control group (n=68) | Statistic | P value | |
| Lactobacillus predominance (before treatment) | 20 (35.09) | 22 (32.35) | χ2=0.104 | 0.747 |
| Lactobacillus predominance (after treatment) | 44 (77.19) | 37 (54.41) | χ2=7.055 | 0.008 |
| Fungal detection (before treatment) | 7 (12.28) | 9 (13.24) | χ2=0.025 | 0.874 |
| Fungal detection (after treatment) | 3 (5.26) | 12 (17.65) | χ2=4.503 | 0.034 |
| Trichomonas detection (before treatment) | 2 (3.51) | 3 (4.41) | Fisher | 1 |
| Trichomonas detection (after treatment) | 0 (0.00) | 2 (2.94) | Fisher | 0.5 |
| BV-related abnormalities (before treatment) | 30 (52.63) | 36 (52.94) | χ2=0.001 | 0.972 |
| BV-related abnormalities (after treatment) | 9 (15.79) | 23 (33.82) | χ2=5.295 | 0.021 |
| Mixed infection (before treatment) | 13 (22.81) | 16 (23.53) | χ2=0.009 | 0.924 |
| Mixed infection (after treatment) | 4 (7.02) | 14 (20.59) | χ2=4.633 | 0.031 |
Table 4: Vaginal flora and microorganism detection before and after treatment. Comparison of Lactobacillus predominance, fungal detection, Trichomonas detection, bacterial vaginosis-related abnormalities, and mixed infection before and after treatment in the observation and control groups.
Comparison of peripheral T-cell subset indicators
Before treatment, no between-group differences were observed in T-cell subset measures (P > 0.05). After treatment, the CD4+ T-cell percentage was higher in the observation group than in the control group (P = 0.006), the CD8+ T-cell percentage was lower (P = 0.024), and the CD4+/CD8+ ratio was higher (P < 0.001). The increase in CD4+ T cells, the decrease in CD8+ T cells, and the increase in the CD4+/CD8+ ratio were also greater in the observation group (P < 0.001, P = 0.004, and P < 0.001, respectively; Figure 1).
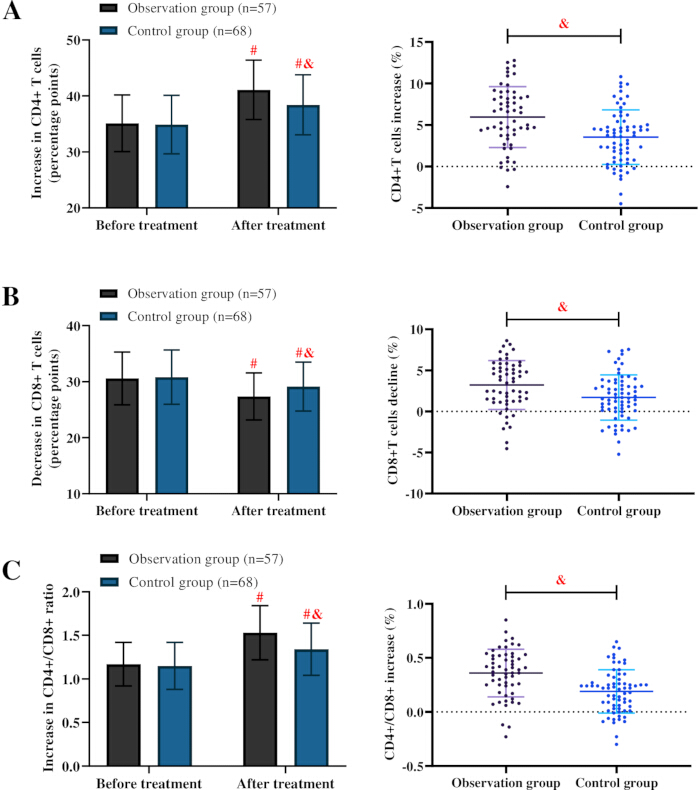
Figure 1: Peripheral T-cell subset measures before and after treatment. (A) CD4+ T-cell percentages before and after treatment and the corresponding increase. (B) CD8+ T-cell percentages before and after treatment and the corresponding decrease. (C) CD4+/CD8+ ratios before and after treatment and the corresponding increase. Changes in CD4+ and CD8+ T cells are expressed as percentage points, whereas changes in the CD4+/CD8+ ratio are unitless. #P < 0.05 versus the corresponding pretreatment value; &P < 0.05 versus the observation group. Please click here to view a larger version of this figure.
Comparison of local cervical signs and gynecological examination findings
After treatment, the incidences of abnormal cervical color and contact bleeding were lower in the observation group than in the control group (P = 0.015 and P = 0.038, respectively). No between-group differences were observed in cervical columnar epithelial ectropion, cervical hypertrophy, or cervical polyps/neoplasm-like changes (P > 0.05; Table 5).
| Observation group (n=57) | Control group (n=68) | Statistic | P value | |
| Cervical columnar epithelial ectropion (before treatment) | 34 (59.65) | 42 (61.76) | χ2=0.058 | 0.809 |
| Cervical columnar epithelial ectropion (after treatment) | 15 (26.32) | 27 (39.71) | χ2=2.492 | 0.114 |
| Abnormal cervical color (before treatment) | 46 (80.70) | 55 (80.88) | χ2=0.001 | 0.98 |
| Abnormal cervical color (after treatment) | 14 (24.56) | 31 (45.59) | χ2=5.950 | 0.015 |
| Cervical hypertrophy (before treatment) | 22 (38.60) | 25 (36.76) | χ2=0.044 | 0.833 |
| Cervical hypertrophy (after treatment) | 9 (15.79) | 19 (27.94) | χ2=2.634 | 0.105 |
| Cervical polyps/neoplasm-like changes (before treatment) | 5 (8.77) | 7 (10.29) | χ2=0.083 | 0.774 |
| Cervical polyps/neoplasm-like changes (after treatment) | 3 (5.26) | 5 (7.35) | Fisher | 0.726 |
| Contact bleeding (before treatment) | 26 (45.61) | 32 (47.06) | χ2=0.026 | 0.872 |
| Contact bleeding (after treatment) | 6 (10.53) | 17 (25.00) | χ2=4.326 | 0.038 |
Table 5: Local cervical examination findings before and after treatment. Comparison of cervical columnar epithelial ectropion, abnormal cervical color, cervical hypertrophy, cervical polyps or neoplasm-like changes, and contact bleeding before and after treatment in the observation and control groups.
Comparison of improvement magnitude in major outcomes
The reductions in Nugent score, Donders score, and total TCM syndrome score were greater in the observation group than in the control group (all P < 0.001). The recovery rate of Lactobacillus predominance and the rate of microecological normalization were also higher in the observation group (81.08% vs. 58.70%, P = 0.029; 70.18% vs. 50.00%, P = 0.022; Table 6).
| Observation group (n=57) | Control group (n=68) | Statistic | P value | |
| Reduction in Nugent score (points) | 3.21±1.68 | 2.16±1.55 | t=3.628 | <0.001 |
| Reduction in Donders score (points) | 3.05±1.44 | 2.03±1.37 | t=4.056 | <0.001 |
| Reduction in total TCM syndrome score (points) | 11.74±3.91 | 8.38±3.78 | t=4.865 | <0.001 |
| Recovery of Lactobacillus predominance | 30/37 (81.08) | 27/46 (58.70) | χ2=4.777 | 0.029 |
| Microecological normalization | 40 (70.18) | 34 (50.00) | χ2=5.226 | 0.022 |
Table 6: Additional change-score and microecological normalization outcomes. Comparison of reductions in Nugent score, Donders score, and total traditional Chinese medicine syndrome score, together with recovery of Lactobacillus predominance and microecological normalization, between the observation and control groups.
Safety and adverse reactions
During treatment, recorded adverse events occurred in 15/57 (26.32%) patients in the observation group and 29/68 (42.65%) patients in the control group; the between-group difference did not reach statistical significance (P = 0.057). Increased vaginal discharge, vulvovaginal candidiasis, and bacterial vaginosis were recorded less frequently in the observation group (P = 0.040, P = 0.034, and P = 0.049, respectively), whereas gastrointestinal discomfort was numerically more frequent (12.28% vs. 2.94%; Fisher’s exact P = 0.078). These individual comparisons should not be interpreted as evidence of an overall safety advantage (Table 7).
| Adverse reaction/safety indicator | Observation group (n=57) | Control group (n=68) | Statistic | P value |
| Vaginal itching | 6 (10.53) | 14 (20.59) | χ2=2.336 | 0.126 |
| Vaginal burning sensation | 4 (7.02) | 11 (16.18) | χ2=2.463 | 0.117 |
| Lower abdominal distension | 5 (8.77) | 12 (17.65) | χ2=2.079 | 0.149 |
| Increased vaginal discharge | 8 (14.04) | 20 (29.41) | χ2=4.218 | 0.04 |
| Abnormal vaginal bleeding | 1 (1.75) | 3 (4.41) | Fisher | 0.625 |
| Vulvovaginal candidiasis | 3 (5.26) | 12 (17.65) | χ2=4.503 | 0.034 |
| Bacterial vaginosis | 4 (7.02) | 13 (19.12) | χ2=3.864 | 0.049 |
| Gastrointestinal discomfort | 7 (12.28) | 2 (2.94) | Fisher | 0.078 |
| Treatment discontinuation | 1 (1.75) | 4 (5.88) | Fisher | 0.375 |
| Total adverse reactions | 15 (26.32) | 29 (42.65) | χ2=3.626 | 0.057 |
Table 7: Recorded adverse events during treatment. Comparison of recorded adverse events in the observation and control groups, including vaginal itching, vaginal burning sensation, lower abdominal distension, increased vaginal discharge, abnormal vaginal bleeding, vulvovaginal candidiasis, bacterial vaginosis, gastrointestinal discomfort, treatment discontinuation, and total adverse reactions.
Data Availability
The deidentified participant-level raw data supporting the conclusions of this study are provided in Supplementary File 1.
Supplementary Table 1: Scoring criteria for the traditional Chinese medicine syndrome score.
Scoring criteria for the eight items included in the total traditional Chinese medicine syndrome score. Each item is scored from 0–3 based on symptom severity, with higher scores indicating greater severity. Please click here to download this file.
Supplementary Table 2: Exploratory HPV outcomes stratified by baseline HPV16/18 status.
Exploratory comparison of HPV outcomes according to baseline HPV16/18 status. HPV16/18-negative patients had HR-HPV infection involving one or more of the other HR-HPV genotypes included in the assay. Individual non-16/18 genotype labels were not retained in the deidentified analytic dataset; therefore, type-specific clearance estimates for individual non-16/18 genotypes were not reconstructed. These analyses were exploratory. Please click here to download this file.
Supplementary File 1: The deidentified participant-level raw data for the protocol. Please click here to download this file.
Discussion
Cette étude rétrospective a révélé que le traitement par WDT associé à du rhIFN-α-2b était lié à des résultats plus favorables concernant la microécologie vaginale liée au VPH et aux paramètres courants, par rapport au rhIFN-α-2b seul, ainsi qu'à des différences dans les mesures des sous-ensembles de lymphocytes T périphériques, tandis que le taux global d'événements indésirables enregistrés ne différait pas de manière significative entre les groupes. Ces résultats justifient une évaluation prospective supplémentaire du WDT en tant que traitement adjuvant et doivent être interprétés à la lumière de la conception non randomisée et de l'évaluation rétrospective des résultats.
Du point de vue virologique, le taux d'efficacité total plus élevé et le délai plus court jusqu'à la première conversion ont favorisé le groupe d'observation, mais la distribution des résultats HPV à quatre catégories n'a pas différé de manière statistiquement significative. L'analyse de sensibilité ajustée a révélé une association similaire pour le taux d'efficacité total, bien que la conception rétrospective n'établisse pas de lien de causalité. Cela pourrait être en partie dû au fait que le rhIFN-α-2b, en tant que traitement antiviral topique, a démontré une valeur clinique, et que des études sur la médecine chinoise associée au rhIFN-α-2b dans l'infection cervicale par le VPH ou les lésions associées suggèrent également des bénéfices potentiels pour l'élimination du VPH et les indicateurs liés à l'immunité18,19. Toutefois, l'élimination de l'infection persistante par les VPH à haut risque ne dépend pas uniquement d'un traitement antiviral local, mais est également influencée par le statut immunitaire de l'hôte, l'inflammation locale au niveau du col utérin et du vagin, ainsi que par la stabilité du micro-écosystème20. Même avec un traitement standardisé par interféron, une conversion lente vers un résultat négatif ou une positivité persistante peut encore survenir en raison d'une altération des barrières locales, d'une inflammation chronique ou de réponses immunitaires cellulaires insuffisantes21. L'ajout du WDT pourrait améliorer l'environnement local d'action de l'interféron en corrigeant la déficience du pancréas associée à une accumulation d'humidité, en réduisant les leucorrhées anormales et en atténuant l'irritation inflammatoire locale. Des études antérieures ont rapporté que la médecine chinoise combinée à l'interféron peut améliorer l'efficacité clinique du traitement de l'infection par les VPH à haut risque et améliorer les sécrétions vaginales anormales ainsi que les symptômes associés22,23, ce qui est conforme aux résultats actuels. La proportion de conversion spécifique aux VPH16/18 était numériquement plus élevée dans le groupe d'observation que dans le groupe témoin, mais la différence n'était pas statistiquement significative. La majorité des patients positifs pour les VPH16/18 présentaient une infection à plusieurs types au moment du diagnostic ; par conséquent, la conversion complète du VPH à haut risque dans ce sous-groupe dépendait non seulement de l'élimination des génotypes concomitants, mais aussi des VPH16/18. Dans le sous-groupe exploratoire négatif pour les VPH16/18, la conversion complète du VPH à haut risque était plus fréquente dans le groupe d'observation ; toutefois, l'étude n'avait pas la puissance nécessaire pour des comparaisons stratifiées par génotype, aucune analyse d'interaction n'avait été prévue, et les étiquettes individuelles des génotypes non-16/18 n'étaient pas disponibles dans le jeu de données analytiques anonymisées. Ces résultats obtenus dans les sous-groupes doivent donc être interprétés avec prudence et ne permettent pas d'établir une efficacité différentielle selon le génotype du VPH.
Les résultats relatifs à la microécologie vaginale ont également montré une amélioration plus marquée après le traitement dans le groupe d'observation. Le Lactobacillus vaginal est une composante clé de l'homéostasie microécologique vaginale et contribue au maintien d'un environnement acide par la production d'acide lactique, de peroxyde d'hydrogène et de substances antibactériennes, limitant ainsi la prolifération excessive des pathogènes opportunistes24. Lorsque le pH augmente ou que le Lactobacillus diminue ou perd sa fonction, la barrière locale s'affaiblit, et le risque d'infection par la flore associée à la vaginose bactérienne (VB), d'infection fongique et d'infection mixte augmente ; cela peut également favoriser une infection persistante par le VPH25. L'association entre la prédominance du Lactobacillus et un statut normal de production de peroxyde d'hydrogène était cohérente dans les deux groupes de traitement, ce qui soutient une relation interne entre ces indicateurs microécologiques courants. Toutefois, le test n'a pas permis d'identifier les espèces ou les souches de Lactobacillus productrices de H₂O₂ ; par conséquent, ces résultats ne peuvent pas démontrer le rétablissement d'une communauté de Lactobacillus spécifiquement protectrice. Des études sur l'intervention par le WDT dans les cas de vaginite et de symptômes vaginaux locaux ont montré une amélioration des symptômes vaginaux et une régulation de l'environnement local26, en accord avec la restauration de la prédominance du Lactobacillus et l'amélioration de la microécologie observées dans la présente étude. Néanmoins, bien que le taux de positivité de la sialidase ait montré une tendance à la baisse, la différence n'a pas atteint la signification statistique. Cela pourrait être lié à la gravité de la VB, aux moments de prélèvement et à la sensibilité de la méthode de détection.
Les modifications des sous-populations de lymphocytes T périphériques doivent être interprétées comme des altérations de la composition immunitaire systémique plutôt que comme une preuve directe d'une immunité anti-HPV renforcée. Bien que le groupe observé ait présenté un rapport CD4+/CD8+ post-traitement plus élevé et une diminution plus marquée du pourcentage de lymphocytes T CD8+ périphériques, les lymphocytes T CD8+ cytotoxiques jouent un rôle important dans les réponses antivirales, et un pourcentage périphérique plus bas n'est pas nécessairement bénéfique. La fonction des lymphocytes T spécifiques de l'HPV et l'immunité muqueuse cervico-vaginale n'ont pas été mesurées ; par conséquent, la relation entre ces modifications périphériques et l'élimination locale du virus reste incertaine. Les changements parallèles observés dans les paramètres virologiques et immunitaires périphériques doivent donc être considérés comme générant des hypothèses, plutôt que comme une preuve d'un mécanisme immunitaire causal. Le taux globalement plus faible, en valeur numérique, d'événements indésirables enregistrés dans le groupe observé n'était pas statistiquement significatif et ne doit pas être interprété comme un effet protecteur du WDT. La fréquence réduite de plusieurs événements vaginaux locaux était en accord directionnel avec les résultats microbiologiques de routine, tandis que les troubles gastro-intestinaux étaient numériquement plus fréquents dans le groupe observé. Toutefois, la détection des événements indésirables reposait sur une documentation clinique rétrospective ; par conséquent, une sous-déclaration des événements légers ou transitoires, ainsi qu'une documentation inégale, ne peuvent être exclues. Des études prospectives avec une surveillance préétablie des événements indésirables sont nécessaires pour préciser le profil de sécurité.
Bien que les caractéristiques de base mesurées aient été comparables et que l'analyse de sensibilité ait été ajustée en fonction des covariables de base enregistrées, la fréquence des rapports sexuels, la méthode contraceptive, le statut VPH du partenaire, les antécédents de vaginite récidivante, le tabagisme, la consommation d'alcool et d'autres facteurs de mode de vie n'étaient pas systématiquement disponibles dans les dossiers rétrospectifs et n'ont donc pas pu être pris en compte. Un biais résiduel demeure ainsi possible, et les associations observées entre les groupes ne doivent pas être interprétées comme des effets causaux du traitement. De plus, les étiquettes individuelles des génotypes non-16/18 n'ont pas été conservées dans le jeu de données analytique dé-identifié, limitant ainsi des analyses plus détaillées spécifiques aux types en termes de clairance et de persistance. La durée de suivi était relativement limitée et insuffisante pour évaluer la négativité prolongée au VPH, le taux de récurrence ou la progression des lésions cervicales. Des études prospectives, multicentriques, à grand échantillon et avec un suivi prolongé sont nécessaires pour confirmer davantage ces résultats.
Conclusion :
Chez les patientes présentant une infection persistante au VPH à haut risque et un tableau de déficience du pancréas, l'association du WDT et de l'IFN-α-2b recombinant humain était liée à des résultats plus favorables en ce qui concerne les paramètres liés au VPH, la microécologie vaginale, les sous-ensembles de lymphocytes T périphériques et les symptômes, comparativement à l'IFN-α-2b recombinant humain seul. Aucune différence significative entre les groupes n'a été observée concernant le taux global d'événements indésirables enregistrés. Étant donné que l'attribution du traitement n'était pas aléatoire et que plusieurs facteurs de confusion potentiels n'étaient pas disponibles, ces résultats doivent être interprétés comme des associations et nécessitent une confirmation prospective.
Déclarations de divulgation
L'auteur déclare ne pas avoir de conflits d'intérêts.
Remerciements
Cette étude a été soutenue par le Bureau municipal des sciences et technologies de Huzhou (subvention no 2023GY58).
Matériaux
| Nom | Entreprise | Numéro de catalogue | Commentaires |
|---|---|---|---|
| Kits de diagnostic 21 HPV GenoArray | HybriBio Ltd., Chaozhou, Guangdong, Chine | HBGA-21PKG | Plusieurs lots cliniques, traçables dans les dossiers de laboratoire |
| Réactif BD Multitest CD3 FITC/CD8 PE/CD45 PerCP/CD4 APC | BD Biosciences | Cat. No. 340499 | Plusieurs lots cliniques, traçables dans les dossiers de laboratoire |
| Instrument rapide d'hybridation moléculaire des acides nucléiques | HybriBio Ltd., Chaozhou, Guangdong, Chine | HMM-2 | Modèle d'instrument |
| Kits de prélèvement pour femmes | HybriBio Ltd., Chaozhou, Guangdong, Chine | HBCK-F | Prélèvement de cellules exfoliées cervicales |
| Cytomètre en flux | Mindray, Shenzhen, Chine | BriCyte E6 | Modèle d'instrument |
| Analyseur d'amplification de l'ADN du VPH | Hangzhou Bioer Technology Co., Ltd., Hangzhou, Chine | TC-96/G/H6 | Modèle d'instrument |
| Suppositoires vaginaux d'interféron humain recombinant α-2b | Changchun Institute of Biological Products Co., Ltd. | 500 000 UI/pièce | N° d'homologation nationale des médicaments S19991019 ; plusieurs lots cliniques, traçables dans les dossiers pharmaceutiques |
Références
- Hewavisenti RV, Arena J, Ahlenstiel CL, Sasson SC. Human papillomavirus in the setting of immunodeficiency: Pathogenesis and the emergence of next-generation therapies to reduce the high associated cancer risk. Front Immunol. 2023;14:1112513. doi: 10.3389/fimmu.2023.1112513
- Singh D, et al. Global estimates of incidence and mortality of cervical cancer in 2020: a baseline analysis of the WHO Global Cervical Cancer Elimination Initiative. Lancet Glob Health. 2023;11(2):e197-e206.
- Basukala O, Banks L. The Not-So-Good, the Bad and the Ugly: HPV E5, E6 and E7 Oncoproteins in the Orchestration of Carcinogenesis. Viruses. 2021;13(10):1511. doi: 10.3390/v13101511
- Dalskov L, Gad HH, Hartmann R. Viral recognition and the antiviral interferon response. EMBO J. 2023;42(14):e112907. doi: 10.15252/embj.2022112907
- Tang Y, Tong Q, Dai N, Xu C. Evaluation of the clinical efficacy of vaginal treatment options for persistent high-risk human papillomavirus infection after excisional treatment of cervical high-grade squamous intraepithelial lesions: a systematic review and Bayesian network meta-analysis. Virol J. 2023;20(1):47. doi: 10.1186/s12985-023-01997-3
- Sharifian K, Shoja Z, Jalilvand S. The interplay between human papillomavirus and vaginal microbiota in cervical cancer development. Virol J. 2023;20(1):73. doi: 10.1186/s12985-023-02035-2
- Zeng M, et al. Roles of vaginal flora in human papillomavirus infection, virus persistence and clearance. Front Cell Infect Microbiol. 2022;12:1036869. doi: 10.3389/fcimb.2022.1036869
- Bautista J, Altamirano-Colina A, López-Cortés A. The vaginal microbiome in HPV persistence and cervical cancer progression. Front Cell Infect Microbiol. 2025;15:1634251. doi: 10.3389/fcimb.2025.1634251
- Ding W, Li X, Ji B, Wang Z. Functions of Traditional Chinese Medicine Combined with Recombinant Human Interferon α2b in Cervical Intraepithelial Neoplasias Patients. Evid Based Complement Alternat Med. 2021;2021:6881720. doi: 10.1155/2021/6881720
- Han Y, Shen S, Fu J, Ren Q. Mechanisms of Wandai Decoction in Improving Vaginal Flora of Vulvovaginal Candidiasis of the Spleen Deficiency and Excessive Dampness Type: A Study Based on Metagenomics and Metabolomics. Sichuan Da Xue Xue Bao Yi Xue Ban. 2025;56(1):68-73.
- You H, et al. Modulation of metabolic pathways and EndMT inhibition by a traditional Chinese herbal formula in the treatment of high-risk infections. Front Cell Infect Microbiol. 2024;14:1497965. doi: 10.3389/fcimb.2024.1497965
- He C, et al. Meta-analysis of the effect and safety of recombinant human interferon α-2b combined with Baofukang suppository in the treatment of HPV infection. Am J Transl Res. 2022;14(11):7632-7642.
- Wang ZZ, et al. Traditional Chinese Medicine Erhuang Suppository for Treatment of Persistent High-risk Human Papillomavirus Infection and Its Impact on Transcriptome of Uterine Cervix. Curr Med Sci. 2024;44(4):841-853.
- Perkins RB, et al. 2019 ASCCP Risk-Based Management Consensus Guidelines: Updates Through 2023. J Low Genit Tract Dis. 2024;28(1):3-6.
- Xiaoyu Z. Guiding principles for clinical research of new Chinese medicine. China Medical Science and Technology Press; 2002.
- Theiler T, et al. Bacterial vaginosis in pregnant women: A comparison of the Nugent Score with a multiplex PCR. Diagn Microbiol Infect Dis. 2024;110(1):116403. doi: 10.1016/j.diagmicrobio.2024.116403
- Zeng Z, et al. Characteristics and potential diagnostic ability of vaginal microflora in patients with aerobic vaginitis using 16S Ribosomal RNA sequencing. Diagn Microbiol Infect Dis. 2023;105(1):115806. doi: 10.1016/j.diagmicrobio.2022.115806
- Zhang S, Huang X, Liu X. Clinical efficacy of recombinant human interferon α-2b gel combined with LEEP conization in treating cervical intraepithelial neoplasia with comorbid high-risk HPV infection. Am J Transl Res. 2024;16(10):5649-5658.
- Ma K, et al. Network Meta-analysis of Chinese patent medicines combined with recombinant human interferon α-2b in treatment of cervical human papillomavirus infections. Zhongguo Zhong Yao Za Zhi. 2024;49(24):6784-6802.
- Schellekens HCJ, et al. Vaginal Microbiota and Local Immunity in HPV-Induced High-Grade Cervical Dysplasia: A Narrative Review. Int J Mol Sci. 2025;26(9):4321. doi: 10.3390/ijms26094321
- Lv Z, et al. Outcomes and associated factors of cervical human papillomavirus infection among 608 women in Shenzhen, China, 2018-2023. Front Public Health. 2024;12:1523839. doi: 10.3389/fpubh.2024.1523839
- Li X, et al. Jiawei Ermiao Granules (JWEMGs) clear persistent HR-HPV infection though improving vaginal microecology. J Ethnopharmacol. 2025;341:119342. doi: 10.1016/j.jep.2024.119342
- He N, et al. Clinical efficacy analysis of the Chinese medicine Paiteling applied to human papillomavirus infection: A retrospective study. PLoS One. 2024;19(12):e0315376. doi: 10.1371/journal.pone.0315376
- France M, et al. Towards a deeper understanding of the vaginal microbiota. Nat Microbiol. 2022;7(3):367-378.
- Frąszczak K, Barczyński B, Kondracka A. Does Lactobacillus Exert a Protective Effect on the Development of Cervical and Endometrial Cancer in Women? Cancers (Basel). 2022;14(19):4723. doi: 10.3390/cancers14194723
- Wu Y, Tang L. Efficacy Analysis of Wandai Decoction Combined with Traditional Chinese Medicine Fumigation and Washing in Patients with Chronic Vaginitis After Sintilimab Treatment for Small Cell Lung Cancer. Altern Ther Health Med. 2023;29(6):268-273.