Cette étude démontre que le Granulé Qiming (QMG) améliore la rétinopathie diabétique (DR) en modulant l'axe intestin–rétine. Le QMG remodèle le microbiote intestinal, supprime l'inflammation systémique et restaure le réseau régulateur centré sur CMKLR1, inversant ainsi les lésions histopathologiques rétiniennes. Ces résultats positionnent le QMG comme une stratégie thérapeutique prometteuse agissant sur l'axe intestin–rétine pour traiter la DR.
Article de recherche
Analyse corrélationnelle du Granule Qiming avec le réseau centré sur CMKLR1 et l'inflammation systémique via l'axe intestin-rétine dans la rétinopathie diabétique
Dans cet article
Résumé
Résumé
La rétinopathie diabétique (DR) est une complication neurovasculaire provoquée par une hyperglycémie chronique et une inflammation systémique, des données récentes mettant en évidence l'axe intestin–rétine comme cible thérapeutique essentielle mais sous-exploitée. Cette étude examine si le Granulé Qiming (QMG) exerce son efficacité protectrice contre la DR en modulant l'axe intestin–rétine. Des souris C57BL/6 ont été réparties aléatoirement en groupes expérimentaux et soumises à des interventions distinctes. Les modifications histopathologiques de la rétine ont été évaluées par coloration à l'hématoxyline-éosine (HE). Les taux sériques de cytokines inflammatoires (IL-1β, IL-6, TNF-α) ont été mesurés par dosage immunoenzymatique (ELISA). L'expression de protéines régulatrices clés (CMKLR1, Wnt5a, PPAR-γ, AP-1, TP53) dans les tissus rétiniens et coliques a été détectée par immunobuvardage (WB). La composition et la diversité du microbiote intestinal ont été caractérisées par séquençage complet de l'ADNr 16S. Des analyses de corrélation ont été réalisées pour évaluer les relations entre le microbiote intestinal et les facteurs inflammatoires ou les protéines clés. Le traitement par QMG a amélioré les anomalies histopathologiques rétiniennes, comme en témoigne la restauration de l'architecture laminée de la rétine, un rétablissement partiel du nombre de cellules ganglionnaires rétiniennes (P < 0,001) et l'inversion de l'amincissement rétinien (P < 0,01). Il a également fortement réduit les niveaux sériques d'IL-1β, d'IL-6 et de TNF-α (P < 0,0001). Le long de l'axe intestin–rétine, le QMG a inversé l'expression anormale des protéines régulatrices clés, notamment le réseau centré sur CMKLR1 (Wnt5a, PPAR-γ, AP-1, TP53). En outre, le QMG a restauré la composition, la diversité et la fonction du microbiote intestinal, et les analyses de corrélation ont révélé que le QMG associe l'inflammation systémique à ces protéines régulatrices pour moduler l'axe intestin–rétine. Cette étude fournit des preuves pharmacologiques préliminaires que le QMG améliore la DR en couplant le réseau régulateur centré sur CMKLR1 (incluant Wnt5a, PPAR-γ, AP-1 et TP53) et l'inflammation systémique via l'axe intestin–rétine, positionnant ainsi le QMG comme une stratégie thérapeutique prometteuse ciblant l'axe intestin–rétine dans la DR.
Introduction
La rétinopathie diabétique (DR), l'une des complications microvasculaires les plus fréquentes du diabète sucré (DM), est une cause majeure de cécité chez les adultes en âge de travailler dans le monde entier1. À l'échelle mondiale, la DR touche environ 20 à 30 % de la population diabétique2. L'hyperglycémie chronique déclenche la pathogenèse de la DR en induisant une cascade d'événements pathologiques, notamment une altération du couplage neurovasculaire, une réponse inflammatoire exacerbée et un stress oxydatif3. Récemment, des modifications de la diversité et de la composition du microbiote intestinal ont été observées chez les patients diabétiques atteints de rétinopathie par rapport à ceux qui n'en souffrent pas4,5. En conséquence, l'axe intestin–rétine — un réseau de communication bidirectionnel reliant l'homéostasie intestinale à la santé rétinienne — s'est imposé comme un facteur nouveau impliqué dans la progression de la DR. Toutefois, les médiateurs moléculaires spécifiques qui traduisent les signaux de l'axe intestin–rétine en pathologie rétinienne restent largement mal caractérisés, ce qui limite l'identification de biomarqueurs fiables et de cibles thérapeutiques.
L'axe intestin–rétine décrit un réseau complexe de communication bidirectionnelle entre le microbiote intestinal et ses métabolites avec les tissus rétiniens, via des voies immunologiques, métaboliques, neuroendocriniennes et vasculaires, modulant ainsi leur équilibre homéostatique6. Sur le plan moléculaire, l'axe intestin–rétine se caractérise par la dysrégulation de protéines clés impliquées dans la réponse au stress et la détermination du destin cellulaire, notamment AP-1 et TP537,8,9. Par ailleurs, CMKLR1, un récepteur chimiotactique essentiel, émerge comme médiateur central de la dysfonction endothéliale et de la dysrégulation métabolique, établissant un lien critique entre les altérations du microbiote intestinal et la pathogenèse de la rétinopathie diabétique10. De façon importante, la voie de signalisation Wnt orchestre des rôles régulateurs doubles dans le maintien de l'homéostasie vasculaire rétinienne et de la fonction de la barrière épithéliale intestinale11, tandis que la voie de signalisation PPAR agit comme régulateur maître des réponses inflammatoires et des processus métaboliques dans les tissus oculaires et intestinaux12,13. Ces acteurs moléculaires constituent collectivement un réseau de signalisation interconnecté au sein de l'axe intestin–rétine, offrant de nouvelles perspectives mécanistiques et des opportunités thérapeutiques pour les complications liées au diabète. Cibler les altérations structurelles et fonctionnelles le long de cet axe représente donc une stratégie prometteuse pour la prise en charge de la rétinopathie diabétique (DR).
La médecine traditionnelle chinoise (MTC) a joué historiquement un rôle important dans le traitement du diabète et de la rétinopathie associée, les décisions thérapeutiques étant fondées sur la différenciation des syndromes14. Granulé Qiming (QMG), composé de Astragalus membranaceus, Pueraria lobata, Rehmannia glutinosa, Lycium barbarum, Senna obtusifolia, Leonurus japonicus, Typha angustifolia, et Whitmania pigra, est largement utilisé dans le traitement de la rétinopathie diabétique. Approuvé par l'Administration nationale chinoise des produits médicaux (n° d'approbation Z20090036), le QMG a successfully mené à bien des essais cliniques et obtenu une autorisation de mise sur le marché. Le QMG exerce des effets protecteurs en empêchant l'épaississement de la membrane basale des capillaires rétiniens, réduction des lésions des péricytes et du microvasculaire rétinien, et maintien de la morphologie pathologique locale de l'œil15, ce qui en fait une thérapie prometteuse pour traiter la rétinopathie diabétique. En ciblant des protéines clés et des facteurs inflammatoires, les composants actifs du QMG exercent effets anti-inflammatoires, antioxydants et anti-apoptotiques, fournissant une base mécanistique à sa modulation de la axe intestin–rétine16Ces propriétés fournissent une base mécanistique à la modulation potentielle par le QMG de l'axe intestin–rétine, mais peu d'études ont exploré ce lien. Cette étude vise donc à valider l'efficacité du QMG dans la modulation de l'axe intestin–rétine, en fournissant des preuves expérimentales de son potentiel thérapeutique dans la rétinopathie diabétique.
Cette étude établit un lien entre les prédictions théoriques et les données expérimentales in vivo afin de valider l'efficacité du QMG dans la modulation de l'axe intestin–rétine. Ces résultats démontrent que le QMG améliore la rétinopathie diabétique en associant un réseau régulateur centré sur CMKLR1 (incluant Wnt5a, PPAR-γ, AP-1 et TP53) à l'inflammation systémique via l'axe intestin–rétine, positionnant ainsi le QMG comme une stratégie thérapeutique ciblant l'axe intestin–rétine prometteuse pour la rétinopathie diabétique. Le résumé graphique est présenté dans Figure 1.
Protocole
Toutes les expériences animales ont été réalisées conformément aux lignes directrices ARRIVE. L'étude a été approuvée par le Comité d'éthique de Sichuan Scientist Biotechnology Co., Ltd. (IACUC ISSUE SYST-2024-011). Une chronologie expérimentale détaillée résumant la conception de l'étude est fournie dans la Figure supplémentaire 1.
Préparation et traitement des animaux
Les souris ont été profondément anesthésiées par inhalation d'isoflurane à 2 %. Sous anesthésie profonde, le sang a été prélevé par énucléation rétro-orbitaire. Immédiatement après le prélèvement sanguin, les globes oculaires ont été énucléés afin de récolter le tissu rétinien. Ensuite, une dislocation cervicale a été réalisée sous anesthésie profonde afin d'assurer l'euthanasie. Les tissus coliques ont alors été disséqués immédiatement. Les animaux présentant des événements indésirables ont été retirés rapidement de l'étude et ont reçu des soins vétérinaires appropriés.
Randomisation et aveugle
Des souris mâles C57BL/6 âgées de 5 semaines et pesant entre 20 et 30 grammes ont été logées dans des conditions strictement régulées, incluant la température et l'humidité. Après une semaine d'acclimatation, les souris C57BL/6 ont été réparties aléatoirement en trois groupes (groupe témoin, groupe modèle et groupe d'intervention) à l'aide d'une séquence de nombres aléatoires générée par ordinateur. La séquence de randomisation a été générée par un investigateur n'ayant pas participé à la manipulation des animaux ni à l'évaluation des résultats.
Pour garantir l'aveugle, tous les soins aux animaux, l'administration des médicaments et la collecte des données ont été effectués par des investigateurs ignorant l'affectation aux groupes. Les attributions codées des groupes n'ont été révélées qu'après l'achèvement de toutes les expériences et des analyses statistiques. L'aveugle concernait : le technicien réalisant la gavage oral ; le pathologiste évaluant l'histologie rétinienne ; et l'analyste quantifiant les bandes de Western blot (WB).
Calcul de la taille de l'échantillon
La taille de l'échantillon a été déterminée à partir d'une expérience préliminaire évaluant le nombre de cellules ganglionnaires rétiniennes (CGR) dans les mêmes conditions expérimentales. En supposant un seuil de significativité bilatéral (α) de 0,05 et une puissance statistique (1-β) de 0,80, un minimum de 5 souris par groupe était nécessaire pour détecter une différence cliniquement significative du nombre de CGR entre les groupes modèle et d'intervention. Compte tenu d'un taux de perte potentiel d'environ 20 %, chaque groupe a été fixé à 6 souris.
Mise en place d'animaux diabétiques
Le groupe témoin a reçu une alimentation standard, tandis que les groupes d'intervention et modèle ont reçu une alimentation riche en graisses et en sucres (HFHSD) pendant une durée de quatre semaines. À l'issue de cette période alimentaire, les groupes d'intervention et modèle ont subi une injection intrapéritonéale d'une solution à 1 % de streptozotocine (STZ) à une dose de 35 mg/kg17,18,19,20. Soixante-douze heures après l'injection, les souris dont la glycémie non jeûne dépassait 16,7 mmol/L ont été considérées comme ayant correctement induit un modèle de diabète (DM) et ont été sélectionnées pour de nouvelles expérimentations. Les animaux diabétiques ont poursuivi l'alimentation riche en graisses et en sucres pendant quatre mois supplémentaires, tandis que le groupe témoin a conservé son alimentation standard.
Validation taxonomique et évaluation de la qualité
Les huit ingrédients présents dans le QMG ont été validés sur le plan taxonomique à l'aide de la recherche modernisée des noms de plantes (MPNS, http://mpns.kew.org/mpns-portal/). La qualité de la description de la composition du QMG a été évaluée à l'aide de l'outil ConPhYMP.
Méthodes d'administration
Dans le groupe d'intervention, les animaux ont reçu par voie orale du QMG. Le QMG a été acheté auprès de la société Zhejiang Sansheng Mandi Pharmaceutical Co., Ltd. (numéro d'approbation nationale chinois Z20090036). La suspension de QMG a été préparée en mélangeant uniformément le QMG avec de l'eau distillée. Les souris du groupe d'intervention ont reçu la suspension par gavage oral à un volume équivalent à celui des groupes modèle et témoin. La dose a été calculée à partir de la dose thérapeutique unique clinique de 4,5 g pour un adulte de 60 kg (dose unitaire standard de la formulation commercialisée), en utilisant la méthode de normalisation par surface corporelle (BSA) recommandée par la FDA et Reagan-Shaw21. Le facteur de conversion entre l'homme adulte (Km = 37) et la souris (Km = 3) était de 12,33, ce qui correspond à une dose murine de 0,9 g/kg de poids corporel. Le groupe modèle et le groupe témoin ont reçu un volume équivalent de sérum physiologique par gavage oral. L'administration a été effectuée quotidiennement entre 9 h et 11 h pendant une période consécutive de 3 mois.
Observation et indicateurs de test
Surveillance générale des signes vitaux
Les signes vitaux généraux et les indicateurs physiologiques, notamment le poids corporel, les taux de glucose sanguin, la consommation d'eau et d'aliments, la diurèse, les niveaux d'activité et le comportement, la température corporelle, ainsi que l'état du pelage et de la peau, ont été systématiquement observés et enregistrés afin d'évaluer de manière complète les interventions thérapeutiques et de détecter d'éventuelles complications.
Observation des modifications morphologiques de la rétine par analyse histochimique à l'hématoxyline-éosine
Tous les échantillons ont été traités dans un déshydrateur automatique à l’aide d’une série de solutions d’éthanol et de xylène après fixation, puis inclus en paraffine. Par la suite, des coupes de 4 µm en paraffine ont été réalisées, colorées à l’HE puis montées au baume de Canada. Les images rétiniennes ont été numérisées à l’aide d’un scanner 3DHISTECH Pannoramic SCAN. L’analyse des images et la mesure des données ont été effectuées à l’aide du logiciel Image-Pro Plus.
Détection des cytokines IL-6, TNF-α et IL-1β sériques par analyse ELISA
Des échantillons sanguins ont été prélevés par énucléation rétro-orbitaire. Le sérum a été séparé par centrifugation à 1 000 × g pendant 15 min à 4 °C, puis stocké à -80 °C jusqu'à l'analyse. Les concentrations sériques d'IL-1β, d'IL-6 et de TNF-α ont été mesurées selon les procédures standard, incluant l'équilibration des réactifs, l'ajout des échantillons, l'incubation, le lavage, l'ajout du conjugué et du substrat, l'arrêt de la réaction, la mesure de la densité optique et le calcul des concentrations à partir d'une courbe standard. La densité optique a été lue à 450 nm à l'aide d'un lecteur de microplaques, et les concentrations en cytokines ont été déterminées à l'aide des courbes standards.
Détection des protéines régulatrices clés dans la rétine et le côlon par analyse WB
Trois réplicats biologiques indépendants ont été réalisés sur une même membrane et les protéines cibles ont été détectées séquentiellement. Tous les réplicats proviennent d'une seule cohorte d'animaux sacrifiés simultanément. Lorsque la masse moléculaire d'une protéine cible était trop proche de celle de la GAPDH (différence <5 kDa), les analyses ont été effectuées sur des membranes distinctes afin d'éviter tout recouvrement du signal. Chaque membrane a été utilisée exclusivement pour la détection soit de la protéine cible, soit de la GAPDH, afin de garantir une quantification précise. Les anticorps primaires suivants ont été utilisés : anticorps polyclonal dirigé contre la GAPDH polyclonal antibody (1:5000), anticorps polyclonal dirigé contre CMKLR1 (1:1000), anticorps polyclonal dirigé contre Wnt5a (1:1000), anticorps polyclonal dirigé contre TP53 (1:1000), anticorps monoclonal dirigé contre AP-1 (1:5000) et anticorps polyclonal dirigé contre PPAR gamma (PPAR-γ) (1:1000). Les protéines totales ont été obtenues par lyse cellulaire suivie d'une centrifugation. Les concentrations protéiques ont été déterminées à l'aide du dosage BCA. Les protéines extraites ont été séparées par électrophorèse SDS-PAGE sur gel de séparation à 12 %, puis transférées sur membrane. Les membranes ont été bloquées dans du TBST contenant 5 % de lait écrémé, puis incubées avec les anticorps primaires appropriés toute la nuit à 4 °C. Après lavage, les membranes ont été incubées avec des anticorps secondaires conjugués à la peroxydase (HRP) anti-lapin ou anti-souris, dilués à 1:10 000. Enfin, les bandes protéiques ont été visualisées et analysées par imagerie chimiluminescente. Lors de la visualisation et du traitement des données, les immunoblots ont été rognés horizontalement pour supprimer les régions de masses moléculaires non pertinentes, et toutes les pistes d'échantillons ont été conservées sans suppression des zones intermédiaires entre les pistes. Une légère distorsion des bords peut survenir lors du rognage destiné à éliminer les régions non pertinentes du gel.
Détection de la microflore intestinale par analyse de séquençage de l'ADNr 16S
Des échantillons fécaux frais ont été prélevés chez chaque souris avant les procédures terminales. Les souris ont été placées individuellement dans des cages stériles pendant 10 à 15 minutes afin de permettre une défécation spontanée. Les boudins fécaux ont été immédiatement recueillis à l’aide de pinces stériles, transférés dans des tubes stériles de 1,5 mL, congelés rapidement dans l’azote liquide, puis stockés à -80 °C jusqu’à l’extraction de l’ADN. Toutes les manipulations ont été effectuées dans des conditions stériles afin de minimiser les contaminations croisées. L’intervalle entre la défécation et la congélation a été maintenu inférieur à 10 minutes afin de préserver l’intégrité microbienne. Les échantillons d’ADN génomique fécal (ADNg) ont été purifiés à l’aide du kit d’extraction d’ADN génomique fécal, puis soumis à une amplification complète du gène ARNr 16S par réaction en chaîne par polymérase (PCR) à l’aide des amorces universelles 8F (5’-AGAGTTTGATCATGGCTCAG-3’) et 1492R (5’-CGGTTACCTTGTTACGACTT-3’). Les produits de PCR ont ensuite été analysés par électrophorèse sur gel d’agarose, purifiés et quantifiés pour des applications ultérieures. Un séquençage à haut débit a été réalisé sur le séquenceur Nanopore GridION. Le processus d’analyse des données a inclus le basecalling, le contrôle de qualité des données, l’annotation des espèces, la construction d’arbres phylogénétiques, l’analyse des communautés, les analyses de diversité alpha et bêta, ainsi que l’analyse des espèces différentiellement abondantes et la prédiction des fonctions communautaires. Divers outils et bases de données, tels que NanoFilt, Usearch, le langage de programmation R, Python et la base de données SILVA, ont été utilisés lors de l’analyse.
Analyse de corrélation de l'axe intestin-rétine avec l'inflammation systémique et le microbiote intestinal à plusieurs niveaux
Afin d'explorer les associations potentielles entre le microbiote intestinal multiscalaire et les cytokines inflammatoires sériques ainsi que les protéines régulatrices clés, une analyse de corrélation a été réalisée à l'aide de la plateforme Luoning Bio-Cloud. Dans un premier temps, les données d'abondance des espèces aux niveaux Règne, Phylum, Classe, Ordre, Famille, Genre et Espèce ont été extraites des résultats de séquençage. Les facteurs physicochimiques, incluant les cytokines inflammatoires sériques et les niveaux d'expression protéique, ont été regroupés dans un fichier de facteurs environnementaux. Afin d'assurer la fiabilité et la visualisation des corrélations, les données ont été normalisées pour éliminer les différences d'échelle entre l'abondance microbienne et les unités de mesure cliniques. Les coefficients de corrélation (valeurs R) et les niveaux de significativité correspondants (valeurs P) ont été calculés. Les résultats ont été visualisés à l'aide d'une carte thermique de corrélation, dans laquelle les dégradés de couleur indiquent l'intensité et le sens de la corrélation (rouge pour une corrélation positive, bleu pour une corrélation négative), et les astérisques (**) indiquent la significativité statistique (P < 0,01).
Méthodes statistiques
Toutes les analyses statistiques et visualisations ont été effectuées à l'aide de GraphPad Prism. Le test t pour comparer les moyennes a été utilisé pour les données suivant une distribution normale. Dans les cas où les données s'écartaient de la normalité, le test de Kruskal-Wallis a été appliqué. Une corrélation de Spearman ou de Pearson a été réalisée pour examiner les relations entre variables. Tous les tests statistiques ont été effectués en deux files, le seuil de significativité statistique étant fixé à 0,05.
Résultats
General situation of experimental animals
Blood glucose levels were significantly elevated in the model group (27.21 ± 6.03 mmol/L) compared with the blank group (P < 0.001), indicating the successful induction of the DM model. During the study period, the experimental animals showed stable body weight, continuous water and food intake, normal urine output, body temperature, healthy fur and skin condition, and normal behavior during the experiment.
Composition and validation of QMG
QMG, a proprietary Chinese medicine that passed Phase III clinical trials, encompasses Astragalus membranaceus (Fisch.) Bunge [Fabaceae, Astragali radix], Pueraria lobata (Willd.) Ohwi [Fabaceae, Puerariae lobatae radix], Rehmannia glutinosa (Gaertn.) Libosch. Ex Fisch. & C.A. Mey. [Orobanchaceae; Rehmanniae radix], Lycium barbarum L. [Solanaceae; Lycii fructus], Senna obtusifolia (L.) H.S. Irwin & Barneby [Fabaceae; Cassiae semen], Leonurus japonicus Houtt. [Lamiaceae, Leonuri herba], Typha angustifolia L. [Typhaceae; Typhae pollen], Whitmania pigra Whitman [Hirudinidae; Hirudo]15. The detailed information, including the Chinese name, scientific name by MPNS validation, species, family, part used, representative bioactive compounds, was summarized in Table 1, which defined the QMG and provided a transparent, scientifically grounded basis for the formulas under investigation.
| No. | Chinese name | Scientific name by MPNS validation | Species | Family | Part Used | Representative bioactive compounds | |||||||
| 1 | HuangQi | Astragalus membranaceus (Fisch.) Bunge [Fabaceae, Astragali radix] | Astragalus mongholicus (Fisch.) Bunge | Fabaceae | Radix | Astragaloside IV, Calycosin | |||||||
| 2 | GeGen | Pueraria lobata (Willd.) Ohwi [Fabaceae, Puerariae lobatae radix] | Pueraria lobata (Willd.) | Fabaceae | Radix | Puerarin, Daidzin | |||||||
| 3 | DiHuang | Rehmannia glutinosa (Gaertn.) Libosch. Ex Fisch. & C.A. Mey. [Orobanchaceae; Rehmanniae radix] | Rehmannia glutinosa (Gaertn.) Libosch. Ex Fisch. & C.A. Mey. | Orobanchaceae | Radix | Catalpol, Rehmannioside D | |||||||
| 4 | GouQiZi | Lycium barbarum L. [Solanaceae; Lycii fructus] | Lycium barbarum L. | Solanaceae | Fructus | Lycium barbarum polysaccharides, Betaine | |||||||
| 5 | JueMingZi | Senna obtusifolia (L.) H.S. Irwin & Barneby [Fabaceae; Cassiae semen] | Senna obtusifolia (L.) H.S. Irwin & Barneby | Fabaceae | Semen | Aurantio-obtusin, Emodin | |||||||
| 6 | Chong WeiZi | Leonurus japonicus Houtt. [Lamiaceae, Leonuri fructus] | Leonurus japonicus Houtt. | Lamiaceae | Fructus | Stachydrine, Leonurine | |||||||
| 7 | PuHuang | Typha angustifolia L. [Typhaceae; Typhae pollen] | Typha angustifolia L. | Typhaceae | Pollen | Isorhamnetin, Kaempferol | |||||||
| 8 | ShuiZhi | Whitmania pigra Whitman [Hirudinidae; Hirudo] | Whitmania pigra Whitman | Hirudinidae | Body | Hirudin, Calin | |||||||
Table 1: The composition and quality information of QMG ingredients. Detailed information on the composition and quality information of QMG ingredients, including the Chinese name, scientific name by MPNS validation, species, family, part used, and representative bioactive compounds.
QMG ameliorates the retinal morphology
As depicted in Figure 2A, the retina of the blank group exhibited a well-organized structure. The cellular arrangement was dense and orderly across all layers, with no evidence of structural disruption, exudation, or inflammatory infiltration. Compared with the blank group, retinal sections from the model group (Figure 2B) exhibited marked structural disorganization, characterized by disordered cellular arrangement, a significant reduction in RGC counts (P < 0.0001, Table 2, Figure 3A), and pronounced thinning of the total retinal thickness (P < 0.0001, Figure 3B). Notably, neovascular tufts penetrating the inner limiting membrane were observed (indicated by a red arrow), confirming successful establishment of the DR model. In contrast, the intervention group (Figure 2C) demonstrated significant attenuation of histopathological abnormalities relative to the model group, as evidenced by restoration of retinal laminar architecture, partial recovery of RGC numbers (P < 0.001, Table 2, Figure 3A), and reversal of retinal thinning (P < 0.01, Table 2, Figure 3B). These data provide strong evidence for QMG as an effective intervention for DR.
QMG attenuates systemic inflammatory response in DR
Compared with the blank group, the expression levels of IL-1β, IL-6, and TNF-α were significantly upregulated in the model group (P < 0.0001), confirming that the modeling procedure successfully induced a marked inflammatory response. Conversely, compared with the model group, the expression levels of IL-1β, IL-6, and TNF-α were significantly downregulated in the intervention group (p < 0.0001), indicating a potent inhibitory effect of QMG on systemic inflammation. The serum concentrations of IL-1β, IL-6, and TNF-α across the three groups are summarized in Table 3 and illustrated in Figure 4A–C.
QMG modulates the CMKLR1-centered regulatory network along the gut–retina axis
As shown in Figure 5, Figure 6, Figure 7, and Supplementary Figure 2, the results of this study showed that in DR model mice, the expression levels of five key regulatory proteins—AP-1, Wnt5a, CMKLR1, TP53, and PPAR-γ—exhibited a consistent downward trend in both colonic and retinal tissues. Following QMG intervention, the expression of these proteins showed varying degrees of recovery, with some proteins reaching statistical significance. Specifically, after QMG intervention, the expression of AP-1, Wnt5a, and CMKLR1 in colonic tissue was significantly higher than that in the model group (P < 0.05), while in retinal tissue, the expression of CMKLR1 and TP53 was significantly higher than that in the model group (P < 0.01). These findings may suggest that AP-1 and Wnt5a are more sensitive responders in the colon, whereas TP53, as an apoptosis regulator, plays a more critical role in retinal neuroprotection. Notably, CMKLR1 was the only protein that achieved significant recovery in both tissues, indicating that QMG may facilitate bidirectional communication along the gut–retina axis through systemic regulation of CMKLR1 expression.
The consistent directionality of expression changes for these five proteins in both colonic and retinal tissues holds important biological significance. As the primary habitat of the gut microbiota, changes in colonic protein expression reflect the state of the intestinal microenvironment, while the retina is the effector organ of DR. The consistency of expression patterns between these two tissues strongly supports the gut–retina axis as an important participant in the pathophysiological processes of DR.
QMG restores and improves the composition, diversity, and function of gut microbiota
The results of the community composition
Hierarchical clustering analysis revealed distinct shifts in gut microbial composition and clustering at multiple taxonomic levels following QMG intervention. At the phylum level (Figure 8A), the model group exhibited a marked reduction in Firmicutes abundance and a significant enrichment of Bacteroidetes compared with the blank group, indicating a diabetes-driven shift in the Firmicutes/Bacteroidetes ratio; notably, the intervention restored the proportions of both Firmicutes and Bacteroidetes to levels approaching those of the blank group, accompanied by an elevated relative abundance of Proteobacteria. At the class level (Figure 8B), the model group manifested an elevation in Bacteroidia and Clostridia and a lessening in Bacilli and Erysipelotrichia compared with the blank group; in contrast, the intervention group showed restoration in Bacteroidia and Erysipelotrichia to levels approaching those of the blank group, accompanied by elevated relative abundance of Clostridia and Alphaproteobacteria. At the order level (Figure 8C), the model group demonstrated an elevated proportion of Bacteroidales, and a decreased proportion of Erysipelotrichales and Lactobacillales compared with the blank group; conversely, the intervention group restored the proportions of Bacteroidales and Erysipelotrichales to levels approaching those of the blank group, accompanied by an elevated relative abundance of Clostridiales. At the family level (Figure 8D), the model group presented a growth in Odoribacteraceae, Peptostreptococcaceae, Rikenellaceae, and Tannerellaceae, and a decrease in Erysipelotrichaceae, Lactobacillaceae, Muribaculaceae, and Ruminococcaceae compared with the blank group; in contrast, the intervention group downregulated the proportions of Odoribacteraceae and Peptostreptococcaceae compared with the model group; restored the proportions of Erysipelotrichaceae and Ruminococcaceae to levels approaching those of the blank group, accompanied by an elevated relative abundance of Lachnospiraceae. At the genus level (Figure 8E), the model group exhibited an upward trend in Odoribacter, Paeniclostridium, Alistipes, Parabacteroides, and Clostridioides, and a decrease trend in Lactobacillus, Faecalibaculum, Ruminococcus, Bacteroides, and Muribaculum compared with the blank group; notably, the intervention group downregulated the proportions of Odoribacter, Clostridioides, and Paeniclostridium compared with the model group; restored the proportions of Faecalibaculum and Ruminococcus to levels approaching those of the blank group; and increased the relative abundance of Lachnoclostridium, Sphingomonas, Flavonifractor, and Blautia. At the species level (Figure 8F), the model group showed an increase in Odoribacter splanchnicus, Clostridioides difficile, and Paeniclostridium sordellii, and a decrease in Faecalibaculum rodentium, Bacteroides salanitronis, Muribaculum intestinale compared with the blank group; in contrast, the intervention group downregulated the proportion of Odoribacter splanchnicus and Clostridioides difficile compared with the model group; restored the proportions of Faecalibaculum rodentium, and Muribaculum intestinale, accompanied by elevated relative abundance of Lachnoclostridium phocaeense, and Flavonifractor plautii. Collectively, these findings indicate that QMG restored gut microbial composition across multiple taxonomic levels, shifting the community structure toward a homeostatic state.
The results of the Alpha diversity and Beta diversity
As indicated by the Alpha diversity results (Figure 9A), the intervention group exhibited the highest Chao1, PD, Simpson, and Shannon indices, while the model group displayed the lowest, with the blank group showing intermediate levels. These findings underscore the detrimental impact of DR on gut microbiota diversity and demonstrate that QMG intervention effectively restores and enhances microbial richness and evenness in DR mice.
As indicated by the Beta diversity representative results (Figure 9B,C), the principal coordinates analysis (PCoA) plots revealed a distinct separation of microbial communities across the three groups, which was statistically supported by the Permutational Multivariate Analysis of Variance (PERMANOVA). Specifically, the Bray-Curtis-based analysis indicated a significant structural divergence (PERMANOVA: R2 = 0.67, P < 0.001), suggesting that the DR model and QMG intervention accounted for a substantial proportion of the variation in microbial community composition. Consistent with this, the analysis based on Weighted unique fraction (UniFrac) distance, which incorporates phylogenetic relationships between taxa, further confirmed the significant community shift (PERMANOVA: R2 = 0.58, P < 0.01).
As displayed by the Beta diversity results (Figure 9D), the non-metric multidimensional scaling (NMDS) ordination plot demonstrated a clear spatial clustering of samples according to the respective groups, with a stress value of 0.04. Given that a stress value below 0.05 is generally considered to represent an excellent representation of the community structure in a reduced-dimensional space, these results collectively suggest that the QMG intervention significantly altered the global composition of the gut microbiota.
The results of the differential abundance analysis
According to the linear discriminant analysis effect size (LEfSe) analysis (Figure 9E), the results revealed that Clostridia, Clostridiales, Lachnospiraceae, and Lachnoclostridium were remarkably enriched in the intervention group, whereas Odoribacteraceae, Odoribacter, Peptostreptococcaceae, and Paeniclostridium were notably enriched in the model group. Therefore, the above gut microbiota might be the primary differential microbiota responsible for the intergroup differences between the model and intervention groups.
The results of community function prediction
The predicted functional profiles at Level 2 and Level 3 showed distinct clustering patterns across the three groups (Figure 9F,G). Specifically, compared with the blank group, the model group exhibited a significant deviation in the relative abundance of metabolic pathways. Notably, this functional perturbation in the model group was largely ameliorated in the intervention group. The functional composition of the intervention group showed a substantial shift back towards the profile observed in the blank group, indicating that the QMG intervention effectively modulated the gut microbial functional structure. These results suggest that the intervention not only reshaped the taxonomic composition and structure of the gut microbiota but also restored its functional metabolic capacity toward a homeostatic state.
QMG modulates the gut–retina axis by coupling systemic inflammation and key regulatory proteins
Associations at global levels
At the kingdom level (Figure 10A–C), QMG improved the CMKLR1-centered network mainly by modulating Bacteria along the gut-retina axis. Specifically, Bacteria positively correlated with retinal PPAR-γ in the blank group (P < 0.01), but this association was not observed in the model group. Following QMG intervention, bacterial abundance positively correlated with retinal CMKLR1 and Wnt5a yet negatively correlated with colonic TP53 and PPAR-γ (P < 0.01).
At the phylum level (Figure 10D–F), QMG improved the CMKLR1-centered network mainly by modulating Candidatus and Bacteroidetes along the gut-retina axis. Specifically, the positive correlation between Candidatus and colonic CMKLR1 observed in the blank group was lost following DR induction, but was restored by QMG intervention, which was accompanied by a negative correlation with serum IL-1β and TNF-α, while positively correlated with retinal PPAR-γ, AP-1, TP53, colonic AP-1, and serum IL-6 (P < 0.01). Proteobacteria in the model group negatively correlated with colonic CMKLR1 (P < 0.01), a trend that persisted following QMG intervention. Meanwhile, Firmicutes were positively correlated with retinal CMKLR1 in the model group, whereas Bacteroidetes and Tenericutes were negatively correlated with retinal CMKLR1 (P < 0.01). Following QMG intervention, Bacteroidetes shifted to positive correlations with retinal PPAR-γ, AP-1, TP53, and colonic CMKLR1 (P < 0.01). Additionally, Actinobacteria positively correlated with retinal CMKLR1 and Wnt5a (P < 0.01).
At the class level (Figure 10G–I), QMG improved the CMKLR1-centered network mainly by regulating Cytophagia and Bacteroidia along the gut-retina axis. Specifically, Cytophagia and Chitinophagia negatively correlated with retinal CMKLR1 in the blank group (P < 0.01). In the model group, Cytophagia, Bacteroidia, and Mollicutes negatively correlated with retinal CMKLR1, while colonic CMKLR1 positively correlated with Flavobacteriia and Epsilonproteobacteria, yet negatively with Tissierellia, Alphaproteobacteria, Clostridia, and Bacilli (P < 0.01). Following QMG intervention, Bacteroidia and Cytophagia positively correlated with colonic CMKLR1, retinal PPAR-γ, AP-1, TP53, colonic AP-1 and serum IL-6, whereas Mollicutes, Deltaproteobacteria, Alphaproteobacteria, and Gammaproteobacteria showed the opposite pattern (P < 0.01). Moreover, Chlamydiia, Actinobacteria, Tissierellia, Bacilli, and Negativicute negatively correlated with retinal CMKLR1 and Wnt5a, while Coriobacteriia exhibited the reverse correlation (P < 0.01).
At the order level (Figure 10J–L), QMG improved the CMKLR1-centered network mainly by modulating Bacteroidales, Bacillales, and Clostridiales along the gut–retina axis. Specifically, Cytophagales and Chitinophagales negatively correlated with retinal CMKLR1, whereas Marinilabiliales positively correlated with colonic CMKLR1 in the blank group (P < 0.01). In the model group, Mycoplasmatales, Cytophagales, Bacteroidales, and Marinilabiliales negatively correlated with retinal CMKLR1, while colonic CMKLR1 positively correlated with Flavobacteriales and Campylobacterales, yet negatively with Tissierellales, Bacillales, Sphingomonadales, Clostridiales, and Lactobacillales (P < 0.01). Following QMG intervention, Bacteroidales and Clostridiales positively correlated with colonic CMKLR1, AP-1, retinal PPAR-γ, AP-1, TP53, and serum IL-6, whereas Desulfovibrionales, Rhizobiales, Sphingomonadales, and Enterobacterales showed the opposite pattern (P < 0.01). Moreover, Eggerthellales and Coriobacteriales positively correlated with retinal CMKLR1 and Wnt5a, yet negatively with colonic TP53 and PPAR-γ, whereas Chlamydiales, Thermoanaerobacterales, Corynebacteriales, Tissierellales, and Bacillales exhibited the reverse correlation (P < 0.01).
Associations at Fine levels
At the family level (Figure 11A–C), QMG improved the CMKLR1-centered network primarily by modulating Lachnospiraceae, Bacteroidaceae, and Lactobacillaceae along the gut–retina axis. Specifically, Ruminococcaceae negatively correlated with retinal CMKLR1, whereas Lachnospiraceae positively correlated with retinal CMKLR1 in the blank group (P < 0.01). In the model group, Peptostreptococcaceae positively correlated with retinal CMKLR1, while Tannerellaceae, Bacteroidaceae, Odoribacteraceae, and Lachnospiraceae showed the opposite pattern (P < 0.01). Meanwhile, colonic CMKLR1 positively correlated with Marinilabiliaceae, Rikenellaceae, and Flavobacteriaceae, yet negatively with Lachnospiraceae and Lactobacillaceae (P < 0.01). Following QMG intervention, Enterobacteriaceae, Sphingomonadaceae, and Oscillospiraceae negatively correlated with colonic CMKLR1, AP-1, and serum IL-6, as well as retinal PPAR-γ, AP-1, and TP53, while positively correlating with serum IL-1β and TNF-α, whereas Peptococcaceae, Bacteroidaceae, Muribaculaceae, and Rikenellaceae showed the opposite pattern (P < 0.01). Moreover, Veillonellaceae, Peptostreptococcaceae, Lactobacillaceae, and Ruminococcaceae negatively correlated with retinal CMKLR1 and Wnt5a, yet positively with colonic TP53 and PPAR-γ, whereas Eggerthellaceae, Lachnospiraceae, and Hungateiclostridiaceae exhibited the reverse correlation (P < 0.01).
At the genus level (Figure 11D–F), QMG improved the CMKLR1-centered network primarily by modulating Lachnoclostridium, Clostridioides, and Bacteroides along the gut–retina axis. Specifically, Ruminococcus negatively correlated with retinal CMKLR1, whereas Lachnoclostridium showed the opposite pattern in the blank group (P < 0.01). In the model group, Lactobacillus and Sphingomonas negatively correlated with colonic CMKLR1, while Alistipes and Croceibacter positively correlated with colonic CMKLR1 (P < 0.01). Meanwhile, retinal CMKLR1 positively correlated with Paeniclostridium and Clostridioides, yet negatively with Mucinivorans, Intestinimonas, Flavonifractor, Parabacteroides, Bacteroides, Odoribacter, and Lachnoclostridium (P < 0.01). Following QMG intervention, Sphingomonas and Oscillibacter negatively correlated with colonic CMKLR1, AP-1, and serum IL-6, as well as retinal PPAR-γ, AP-1, and TP53, while positively correlating with serum IL-1β and TNF-α, whereas Bacteroides, Muribaculum, and Alistipes showed the opposite pattern (P < 0.01). Moreover, Dialister, Flavonifractor, Clostridioides, Ruminococcus, and Paeniclostridium negatively correlated with retinal CMKLR1 and Wnt5a, yet positively with colonic TP53 and PPAR-γ, whereas Pseudoclostridium, Lachnoclostridium, and Blautia exhibited the reverse correlation (P < 0.01).
At the species level (Figure 11G–I), QMG improved the CMKLR1-centered network primarily by modulating Clostridioides difficile, Alistipes shahii, and Paeniclostridium sordellii along the gut–retina axis. Specifically, Ruminococcus bicirculans and endosymbiont 'TC1' of Trimyema compressum negatively correlated with retinal CMKLR1, whereas Lactobacillus fermentum and Lactobacillus helveticus displayed the opposite pattern in the blank group (P < 0.01). In the model group, Croceibacter atlanticus, Alkalitalea saponilacus, Alistipes finegoldii, and Alistipes shahii positively correlated with colonic CMKLR1, while Sphingomonas panacis, Paeniclostridium sordellii, Clostridioides difficile, and Lactobacillus murinus positively correlated with retinal CMKLR1, yet Odoribacter splanchnicus, Mucinivorans hirudinis, Lachnoclostridium phocaense, Flavonifractor plautii, and Intestinimonas butyriciproducens showed the opposite pattern (P < 0.01). Following QMG intervention, Alistipes shahii and Muribaculum intestinale positively correlated with colonic CMKLR1, AP-1, and serum IL-6, as well as retinal PPAR-γ, AP-1, and TP53, while negatively correlating with serum IL-1β and TNF-α, whereas Sphingomonas panacis, Oscillibacter sp. PEA192, and Oscillibacter valericigenes exhibited the reverse pattern (P < 0.01). Moreover, Pseudoclostridium thermosuccinogenes, Lachnoclostridium phocaense, Bacteroides salanitronis, and Blautia sp. N6H1-15 positively correlated with retinal CMKLR1 and Wnt5a, yet negatively with colonic TP53 and PPAR-γ, whereas Paeniclostridium sordellii, Flavonifractor plautii, endosymbiont 'TC1' of Trimyema compressum, Clostridioides difficile, and Dialister pneumosintes showed the reverse correlation (P < 0.01). The detailed correlation results at kingdom, phylum, class, order, family, genus, and species levels are presented in Supplementary File 1.
DATA AVAILABILITY:
The 16S rDNA sequencing datasets generated and analyzed during the current study are available in the National Center for Biotechnology Information (NCBI) Sequence Read Archive (SRA) repository under the BioProject accession number: PRJNA1281561. All other data generated or analyzed during this study are included in this article.
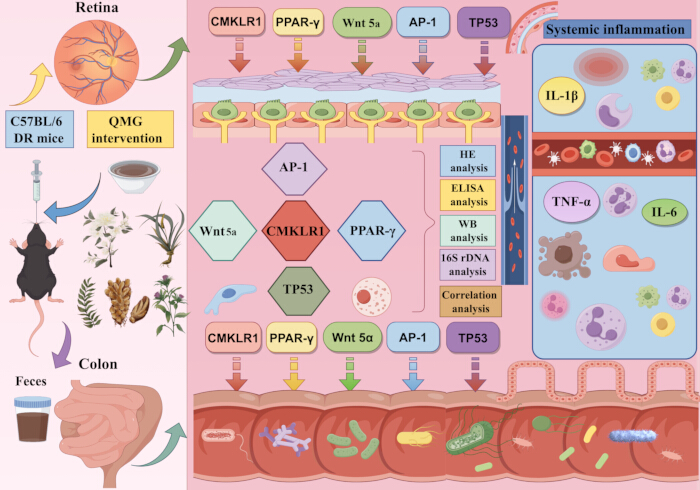
Figure 1: Graphical abstract. The graphical abstract shows the process of this study. Please click here to view a larger version of this figure.
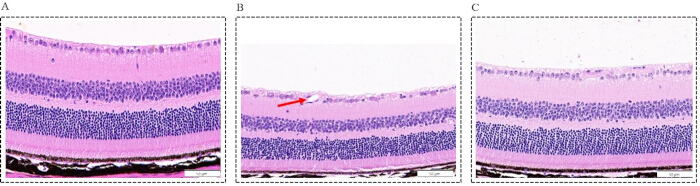
Figure 2: Morphological changes in the retina across the three groups (Scale bar = 50 µm, Magnification: ×400). (A) Blank group: representative photomicrographs of hematoxylin-eosin (HE)-stained retinal sections, showing an intact, well-organized retinal architecture with neatly arranged cellular layers; (B) Model group: representative photomicrographs of HE-stained retinal sections, showing marked structural disorganization, characterized by disordered cellular arrangement, a significant reduction in retinal ganglion cell (RGC) counts (P < 0.0001), pronounced thinning of the retinal thickness (P < 0.0001), and neovascular tufts penetrating the inner limiting membrane (indicated by a red arrow); (C) Intervention group: representative photomicrographs of HE-stained retinal sections, showing significant attenuation of histopathological abnormalities relative to the model group, as evidenced by restoration of retinal laminar architecture, partial recovery of RGC numbers (P < 0.001), and restoration of retinal thinning (P < 0.01). Please click here to view a larger version of this figure.
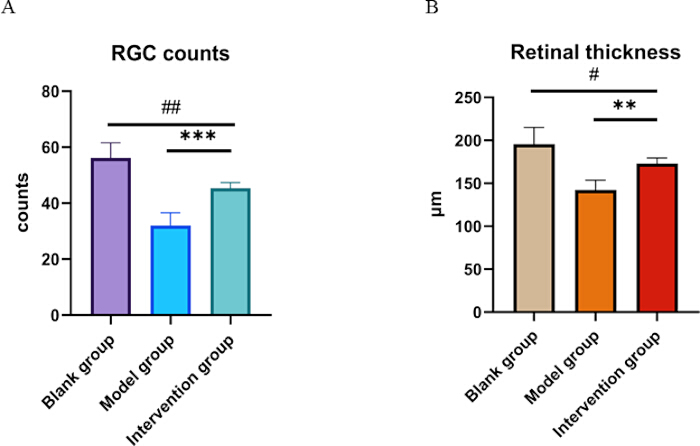
Figure 3: Histological quantification of RGC counts and retinal thickness. (A) Quantification of RGC counts in the ganglion cell layer. (B) Measurement of total retinal thickness (µm). Data are shown as mean ± SD (n = 6 per group). Compared with the blank group: #P <0.05, ##P <0.01; compared with the model group: **P <0.01, ***P <0.001. Please click here to view a larger version of this figure.
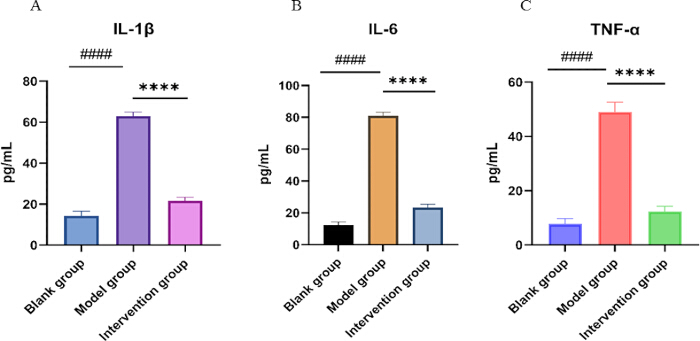
Figure 4: Serum concentrations of inflammatory cytokines in the three groups. Bar charts showing ELISA‑based quantification of serum IL‑1β (A), IL‑6 (B), and TNF‑α (C) levels in the blank control, model group, and intervention groups. Data are expressed as mean ± SD (n = 6 per group). Compared with the blank group: ####P < 0.0001; compared with the model group: ****P < 0.0001. Please click here to view a larger version of this figure.
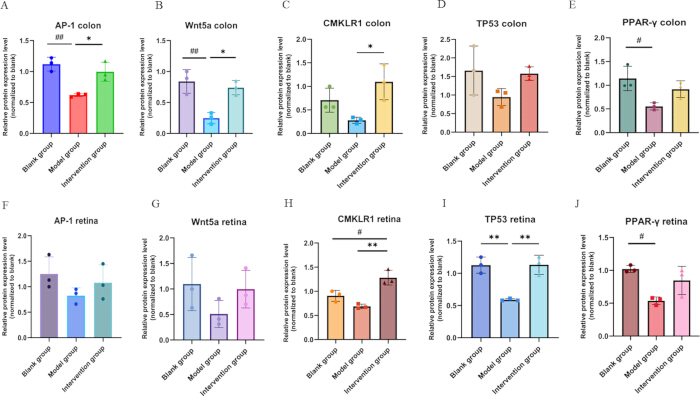
Figure 5: Bar chart of the expression levels of key regulatory proteins in the retina and colon. (A) Relative protein expression level (normalized to blank) of AP-1 in the colon (n = 3); (B) Relative protein expression level (normalized to blank) of Wnt5a in the colon (n = 3); (C) Relative protein expression level (normalized to blank) of CMKLR1 in the colon (n = 3); (D) Relative protein expression level (normalized to blank) of TP53 in the colon (n = 3); (E) Relative protein expression level (normalized to blank) of PPAR-γ in the colon (n = 3); (F) Relative protein expression level (normalized to blank) of AP-1 in the retina (n = 3); (G) Relative protein expression level (normalized to blank) of Wnt5a in the retina (n = 3); (H) Relative protein expression level (normalized to blank) of CMKLR1 in the retina (n = 3); (I) Relative protein expression level (normalized to blank) of TP53 in the retina (n = 3); (J) Relative protein expression level (normalized to blank) of PPAR-γ in the retina (n = 3). Compared with the blank group: #P < 0.05, ##P < 0.01; compared with the model group: *P < 0.05, **P < 0.01. Please click here to view a larger version of this figure.
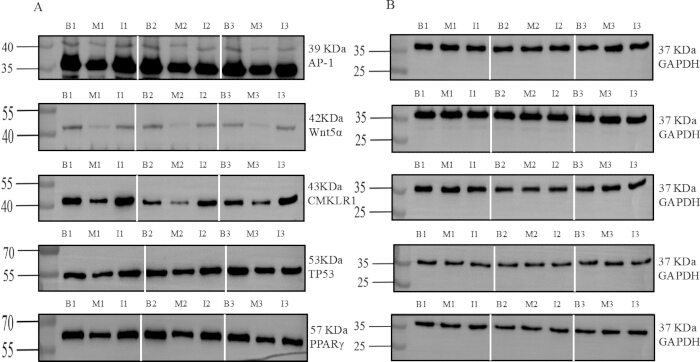
Figure 6: Representative WB grayscale blots of key regulatory proteins in the colon. (A) Target protein expression: AP-1, Wnt5a, CMKLR1, TP53, and PPAR-γ; (B) Loading control: GAPDH. Vertical white lines separate replicate sets (Rep1, Rep2, Rep3); Molecular weight markers (kDa) are indicated on the left, and protein names with corresponding kDa are shown on the right. Lanes are labeled as: B1 (Blank group 1), M1 (Model group 1), I1 (Intervention group 1); B2 (Blank group 2), M2 (Model group 2), I2 (Intervention group 2); B3 (Blank group 3), M3 (Model group 3), I3 (Intervention group 3). Full-length, uncropped Western blot (WB) images with visible molecular weight markers have been provided as Supplementary Figure 2. Please click here to view a larger version of this figure.
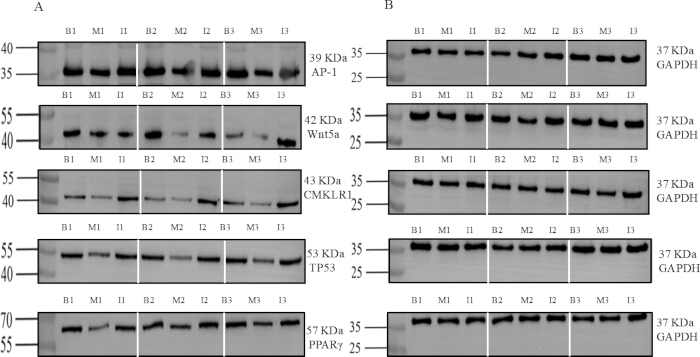
Figure 7: Representative WB grayscale blots of key regulatory proteins in the retina. (A) Target protein expression: AP-1, Wnt5a, CMKLR1, TP53, and PPAR-γ; (B) Loading control: GAPDH. Vertical white lines separate replicate sets (Rep1, Rep2, Rep3); Molecular weight markers (kDa) are indicated on the left, and protein names with corresponding kDa are shown on the right. Lanes are labeled as: B1 (Blank group 1), M1 (Model group 1), I1 (Intervention group 1); B2 (Blank group 2), M2 (Model group 2), I2 (Intervention group 2); B3 (Blank group 3), M3 (Model group 3), I3 (Intervention group 3). Full-length, uncropped WB images with visible molecular weight markers have been provided as Supplementary Figure 2. Please click here to view a larger version of this figure.
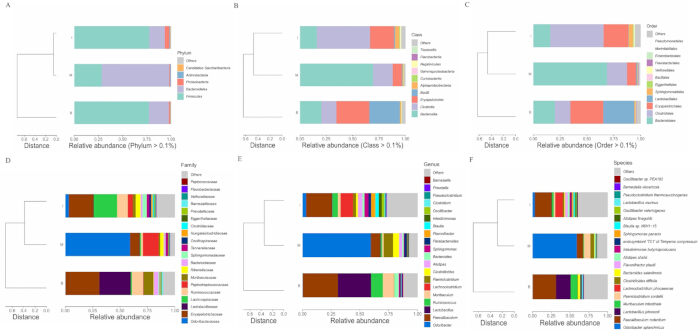
Figure 8: Hierarchical clustering of gut microbiota composition at different levels. Hierarchical clustering dendrogram based on Bray-Curtis dissimilarity among the blank control (B), model group(M), and intervention group (I). The branch length represents the degree of structural divergence. Stacked bar chart depicting the relative abundances of dominant phyla across the three groups. Phyla falling below the threshold are aggregated as “Others”. (A) Qiming granule (QMG) rebalances the gut microbiota composition at the phylum level; (B) QMG rebalances the gut microbiota composition at the class level; (C) QMG rebalances the gut microbiota composition at the order level; (D) QMG rebalances the gut microbiota composition at the family level; (E) QMG rebalances the gut microbiota composition at the genus level; (F) QMG rebalances the gut microbiota composition at the species level. Abbreviation: B, blank group; M, model group; I, intervention group. Please click here to view a larger version of this figure.
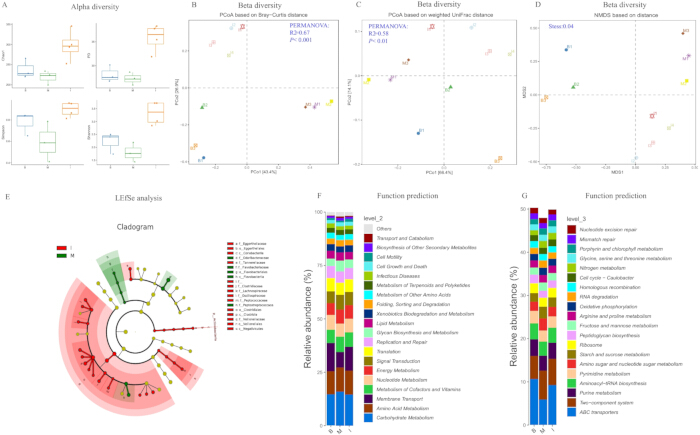
Figure 9: Analysis of gut microbiota diversity, differential abundance, and predicted functional pathways. (A) Alpha diversity analysis assessed by Chao1, PD, Simpson, and Shannon indices revealed that the intervention group exhibited higher microbial diversity than the model group, indicating that QMG treatment effectively restores gut microbial richness and evenness. (B) Beta diversity analysis assessed by principal coordinates analysis (PCoA) based on Bray-Curtis distance revealed significant differences among groups (PERMANOVA: R2=0.67, P < 0.001), indicating that the DR model and QMG intervention accounted for a substantial proportion of the variation in microbial community composition. (C) Beta diversity analysis assessed by PCoA based on weighted unique fraction (UniFrac) distance further confirmed the significant community shift (PERMANOVA: R2= 0.58, P < 0.01). (D) Beta diversity analysis assessed by non-metric multidimensional scaling (NMDS) ordination demonstrated a stress value of 0.04, suggesting that the QMG intervention significantly altered the global composition of the gut microbiota. (E) Cladogram of differential abundance analysis assessed by linear discriminant analysis effect size (LEfSe) revealed the primary differential microbiota between the model and intervention groups. Functional prediction of the gut microbiota at KEGG Level 2 (F) and KEGG Level 3 (G) suggested that the intervention not only reshaped the taxonomic composition and structure of the gut microbiota but also restored its functional metabolic capacity toward a homeostatic state. Please click here to view a larger version of this figure.
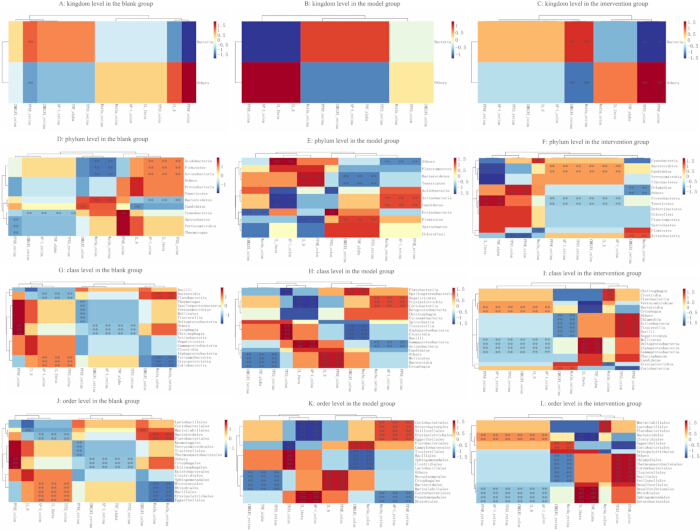
Figure 10: Global association of gut microbiota with inflammatory and regulatory factors. (A) Association of gut microbiota at kingdom level in the blank group; (B) Association of gut microbiota at kingdom level in the model group; (C) Association of gut microbiota at kingdom level in the intervention group; (D) Association of gut microbiota at phylum level in the blank group; (E) Association of gut microbiota at phylum level in the model group; (F) Association of gut microbiota at phylum level in the intervention group; (G) Association of gut microbiota at class level in the blank group; (H) Association of gut microbiota at class level in the model group; (I) Association of gut microbiota at class level in the intervention group; (J) Association of gut microbiota at order level in the blank group; (K) Association of gut microbiota at order level in the model group; (L) Association of gut microbiota at order level in the intervention group. Please click here to view a larger version of this figure.
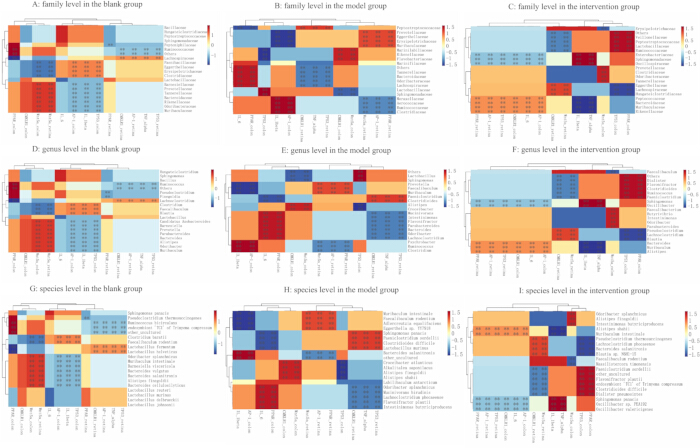
Figure 11: Fine association of gut microbiota with inflammatory and regulatory factors. (A) Association of gut microbiota at the family level in the blank group; (B) Association of gut microbiota at the family level in the model group. (C) Association of gut microbiota at family level in the intervention group; (D) Association of gut microbiota at genus level in the blank group; (E) Association of gut microbiota at genus level in the model group; (F) Association of gut microbiota at genus level in the intervention group; (G) Association of gut microbiota at species level in the blank group; (H) Association of gut microbiota at species level in the model group;(I) Association of gut microbiota at species level in the intervention group. Please click here to view a larger version of this figure.
| Groups (n = 6) | RGCs counts | Retinal thickness |
| Blank group | 56.17 ± 5.382 | 195.50 ± 19.54 μm |
| Model group | 32.00 ± 4.561#### | 142.30 ± 11.34 μm#### |
| Intervention group | 45.33 ± 2.066 ##*** | 173.00 ± 6.575 μm#** |
| p | <0.0001 | <0.0001 |
Table 2: Quantitative analysis of RGC counts and retinal thickness in the three experimental groups. Data are presented as Mean ± SD (n = 6 per group). Compared with the blank group: #P <0.05, ##P <0.01, ####P <0.0001; compared with the model group: **P <0.01, ***P <0.001.
| Groups (n = 6) | IL-1β | IL-6 | TNF-α |
| Blank group | 14.31 ± 2.28 | 12.48 ± 1.774 | 7.728 ± 2.048 |
| Model group | 62.88 ± 2.01#### | 80.95 ± 2.247#### | 49.00 ± 3.647#### |
| Intervention group | 21.7 ± 1.654**** | 23.27 ± 2.074**** | 12.35 ± 1.891**** |
| P | <0.0001 | <0.0001 | <0.0001 |
Table 3: Serum expression levels of IL-1β, IL-6, and TNF-α in the three experimental groups. Data are presented as Mean ± SD (n = 6 per group). Cytokine concentrations were determined by enzyme‑linked immunosorbent assay (ELISA) and are reported in pg/mL. Compared with the blank group: ####P < 0.0001; compared with the model group: ****P < 0.0001.
Supplementary Figure 1: Experimental Design and Study Timeline. Schematic overview of the experimental design.Please click here to download this file.
Supplementary Figure 2: Original, full-length, uncropped WB images corresponding to Figure 6 and Figure 7. Raw images without modification contain all molecular weight markers in colon and retina blots for AP-1, Wnt5a, TP53, CMKLR1, PPAR-γ, and loading control GAPDH. Molecular weight markers (kDa) are indicated. Lanes are labeled: B1 (Blank group 1), M1 (Model group 1), I1 (Intervention group 1); B2 (Blank group 2), M2(Model group 2), I2 (Intervention group 2); B3 (Blank group 3), M3 (Model group 3), I3 (Intervention group 3). The original blots were not subjected to high-contrast adjustments.Please click here to download this file.
Supplementary File 1: Detailed correlation analyses of gut microbiota with inflammatory and regulatory factors.Please click here to download this file.
Discussion
La rétinopathie diabétique (DR) est une complication neurovasculaire complexe provoquée par une hyperglycémie chronique, une inflammation et une dysrégulation métabolique22. L'Académie américaine d'ophtalmologie classe la DR en rétinopathie diabétique non proliférative et rétinopathie diabétique proliférative, caractérisée par l'apparition d'une néovascularisation23. Compte tenu des limites des stratégies thérapeutiques actuelles, l'exploration de nouveaux mécanismes s'est imposée comme une piste prometteuse pour traiter la DR. Récemment, des avancées notables ont identifié l'axe intestin–rétine comme une cible thérapeutique essentielle, mais encore sous-exploitée, dans la DR. L'axe intestin–rétine, initialement introduit et décrit par Sheldon Rowan en 20176, suscite un intérêt croissant dans les processus physiopathologiques des maladies oculaires. Toutefois, les mécanismes moléculaires spécifiques sous-jacents au rôle de l'axe intestin–rétine dans la pathogenèse et la progression de la DR restent mal compris, ce qui freine le développement et l'application clinique de stratégies thérapeutiques ciblant cet axe.
Dans cette étude, nous avons évalué systématiquement l'efficacité et les mécanismes sous-jacents du QMG contre la RD. Ces résultats fournissent des preuves préliminaires que le QMG atténue les lésions histopathologiques rétiniennes, supprime l'inflammation systémique, restaure l'homéostasie du microbiote intestinal et module de manière bidirectionnelle des protéines régulatrices clés (le réseau régulateur centré sur CMKLR1) dans le côlon et la rétine, établissant ainsi le QMG comme un modulateur potentiel de l'axe intestin–rétine. L'inflammation systémique chronique et de faible intensité est une caractéristique marquante du DT et un facteur majeur de dommages microvasculaires rétiniens et de progression de la RD24. Les résultats de l'ELISA ont démontré que les concentrations sériques d'IL-1β, d'IL-6 et de TNF-α étaient significativement élevées chez les souris modèles de RD (P < 0,0001), confirmant la présence d'une réponse inflammatoire systémique marquée dans l'état de RD. La libération incontrôlée de ces cytokines peut perturber la barrière hématorétinienne, favoriser l'apoptose des cellules ganglionnaires rétiniennes (RGC) et induire une néovascularisation pathologique. Après l'administration de QMG, les niveaux de ces cytokines ont été significativement réduits (P < 0,0001), tandis que l'intégrité structurelle rétinienne a été restaurée, la survie des RGC augmentée et l'épaisseur rétinienne préservée. Ces résultats indiquent que les effets protecteurs rétiniens du QMG sont étroitement associés à son activité anti-inflammatoire systémique puissante. Notamment, cet effet anti-inflammatoire systémique ne se produit pas de manière isolée, mais est associé à la modulation par le QMG du microbiote intestinal et à la restauration de protéines régulatrices clés dans le côlon, suggérant que le QMG pourrait exercer ses effets thérapeutiques via un axe « intestin–inflammation systémique–rétine ».
Afin de mieux élucider le mécanisme moléculaire par lequel le QMG exerce ses effets anti-DR selon l'axe intestin–rétine, l'expression protéique du réseau régulateur centré sur CMKLR1 (incluant CMKLR1, Wnt5a, TP53, AP-1 et PPAR-γ) a été examinée dans les tissus coliques et rétiniens. Les résultats ont montré qu'après l'induction du modèle de DR, les cinq protéines présentaient une tendance à la baisse dans le colon et la rétine, suggérant que la communication signalétique entre l'intestin et la rétine pourrait être bloquée de manière systémique dans les conditions de DR. Après l'administration de QMG, CMKLR1 était significativement surexprimé à la fois dans le colon et la rétine (P < 0,05 et P < 0,01), indiquant que le QMG pourrait restaurer la communication bidirectionnelle le long de l'axe intestin–rétine par une activation systémique de CMKLR1. En outre, le QMG a significativement restauré l'expression de AP-1 et de Wnt5a dans le colon, ainsi que l'expression de TP53 dans la rétine, suggérant que différentes protéines pourraient jouer des rôles fonctionnels spécifiques selon les tissus le long de cet axe : AP-1 et Wnt5a seraient des effecteurs plus sensibles au QMG dans le colon, tandis que TP53, en tant que régulateur de l'apoptose, jouerait un rôle plus critique dans la neuroprotection rétinienne. Une analyse de corrélation supplémentaire a révélé que l'expression colique de AP-1, CMKLR1, PPAR-γ et Wnt5a était significativement négativement corrélée aux niveaux systémiques de cytokines inflammatoires (IL-1β, IL-6, TNF-α) (P < 0,05 à P < 0,001), tandis qu'aucune corrélation directe n'était observée entre les cytokines sériques et l'expression protéique rétinienne. Cette divergence revêt des implications mécanistiques importantes : le QMG pourrait agir principalement sur le microenvironnement intestinal en restaurant l'expression de protéines régulatrices clés dans le colon, supprimant ainsi l'inflammation systémique ; en revanche, la restauration de l'expression des protéines rétiniennes pourrait s'effectuer par des voies indirectes, telles que la translocation de métabolites dérivés de la microflore intestinale dans la circulation, régulant ainsi à distance les cascades de signalisation rétiniennes, plutôt que d'être directement médiée par des facteurs inflammatoires systémiques. Cette découverte soutient un modèle régulateur axial « intestin–inflammation systémique–rétine » et fournit des preuves mécanistiques clés de l'effet thérapeutique du QMG sur la DR via l'axe intestin–rétine. Parmi les cibles étudiées, CMKLR1 présentait des modifications significatives dans les tissus rétiniens et coliques, émergeant ainsi comme un biomarqueur potentiel reliant l'axe intestin–rétine. Des études antérieures ont impliqué CMKLR1 dans le métabolisme des glycolipides, la gravité de la DR et la modulation de la microflore intestinale25,26,27,28,29,30, suggérant que son expression différentielle le long de l'axe intestin–rétine pourrait refléter son implication dans plusieurs processus pathologiques. Ces résultats positionnent CMKLR1 comme un biomarqueur candidat prometteur pour le diagnostic et l'intervention thérapeutique de la DR, justifiant des validations mécanistiques supplémentaires.
Bien que CMKLR1 fonctionne comme un nœud central dans l'axe intestin–rétine, l'effet thérapeutique du QMG est obtenu grâce à un réseau régulateur multidimensionnel dans lequel Wnt5a, TP53, AP-1 et PPAR-γ fournissent un soutien synergique essentiel. La signalisation Wnt est cruciale pour l'homéostasie de l'épithélium intestinal et la santé colique, notamment par ses rôles dans l'intégrité épithéliale, la modulation de l'inflammation et la protection muqueuse médiée par le microbiote31,32,33,34. PPAR-γ régule les réponses inflammatoires et s'est révélé capable d'inhiber les phagocytes activés par les lipides dans la rétinopathie diabétique (DR) et de favoriser la survie des photorécepteurs par modulation des microglies35,36,37. AP-1 agit comme un facteur de transcription par lequel les métabolites microbiens intestinaux, tels que l'acide désoxycholique, influencent l'homéostasie inflammatoire et immunitaire38,39,40,41. TP53 est impliqué dans l'autophagie, l'apoptose et les lésions neuronales rétiniennes dans des conditions d'hyperglycémie42,43,44,45. Collectivement, ces nœuds de signalisation forment un réseau interconnecté qui relie la dynamique microbienne intestinale à la pathologie rétinienne, ce qui nous amène à étudier si le QMG module ce réseau le long de l'axe intestin–rétine.
Un mécanisme essentiel de régulation de l'inflammation systémique provient de l'écosystème intestinal. L'analyse par séquençage de l'ADNr 16S a révélé une dysbiose structurelle induite par le diabète dans le groupe modèle, caractérisée par un déséquilibre significatif du rapport Firmicutes/Bacteroidetes, un enrichissement en taxons potentiellement pathogènes (par exemple, Odoribacter et Clostridioides) et une raréfaction de taxons bénéfiques (par exemple, Lactobacillus et Faecalibaculum). De manière remarquable, le traitement par QMG a agi comme un agent de restauration de la microflore en inversant ces altérations pathologiques par : (i) la restauration de l'homéostasie microbienne : normalisation des proportions des familles et genres clés (Faecalibaculum, Ruminococcus, Erysipelotrichaceae) vers les valeurs de référence du groupe témoin ; (ii) la modulation ciblée des pathobiontes : réduction de la surcroissance associée au diabète de Odoribacter splanchnicus et de Clostridioides difficile ; (iii) la promotion de l'assemblage d'une communauté bénéfique : induction de la prolifération de taxons anti-inflammatoires ou producteurs de métabolites, tels que Lachnoclostridium, Blautia et Flavonifractor plautii. En outre, les analyses de diversité et les analyses de corrélation de Spearman à plusieurs niveaux ont indiqué que l'intervention par QMG rééquilibre efficacement la composition centrale à plusieurs niveaux, favorisant ainsi des interactions protectrices entre l'hôte et les microbes le long de l'axe intestin–rétine. Ce résultat confirme non seulement l'effet régulateur du QMG sur la microflore intestinale, mais révèle également une stratégie thérapeutique potentielle par laquelle le QMG coordonne le remodelage de la microflore avec l'activité de protéines régulatrices clés (par exemple, IL-6, TP53) afin de supprimer conjointement l'inflammation systémique et ainsi atténuer la rétinopathie diabétique.
Études récentes avoir a vérifié que la médecine traditionnelle chinoise exerce une régulation multi-cibles sur l'axe microbiote-métabolisme-immunité, ce qui la distingue des agents pharmaceutiques à cible unique46. Des preuves croissantes ont démontré le potentiel thérapeutique du QMG dans la rétinopathie diabétique (DR) et les affections oculaires connexes. Une étude contrôlée randomisée multicentrique a montré que le QMG réduisait de manière significative le temps de circulation artério-veineuse rétinienne chez les patients atteints de rétinopathie diabétique, suggérant une amélioration du débit sanguin rétinien et de l'hypoxie47. Des méta-analyses ont en outre confirmé que le QMG combiné au traitement conventionnel améliorait de manière significative l'épaisseur maculaire centrale, l'acuité visuelle et le taux d'efficacité global dans l'œdème maculaire diabétique48, ainsi qu'une prolongation du temps de rupture du film lacrymal et une augmentation de la sécrétion lacrymale chez les patients atteints de sécheresse oculaire49Chez les patients présentant une atteinte nerveuse associée à la RPDN, le QMG a démontré une non-infériorité par rapport au dobesilate de calcium pour la préservation de l'épaisseur de la couche des fibres nerveuses rétiniennes et de la zone avasculaire fovéale50Des études mécanistiques ont révélé que le QMG protège contre les lésions rétiniennes par l'intermédiaire de plusieurs voies, notamment l'inhibition de la pyroptose des cellules de Müller et de l'inflammation immunitaire via la voie P2X7R/NLRP3.51, l'activation de la voie de signalisation PI3K/Akt pour réduire l'apoptose et la modulation des protéines des jonctions serrées afin de préserver l'intégrité de la barrière hématorétinienne52. Les analyses de pharmacologie en réseau ont identifié plusieurs composés bioactifs dans le QMG qui agissent de manière synergique sur les cibles liées au DR16, et des études cliniques n'ont signalé aucun événement indésirable grave, indiquant un profil de sécurité favorable50. L'efficacité thérapeutique du QMG est attribuée aux actions synergiques de ses composants actifs, notamment la quercétine, le kaempférol, l'isorhamnétine, la formononétine et β‑sitostérol, qui exercent collectivement des effets anti-inflammatoires, antioxydants et anti-apoptotiques en ciblant l'IL‑6 et le TNF‑α, TP53 et AP-153,54,55,56,57,58,59La présente étude approfondit ces connaissances en démontrant que les effets protecteurs de la QMG sont également médiés par une modulation de l'axe intestin–rétine, notamment en restaurant l'homéostasie du microbiote intestinal et en régulant le réseau moléculaire centré sur le CMKLR1 afin de supprimer l'inflammation systémique et d'atténuer les lésions rétiniennes.
Plusieurs limites de cette étude doivent être soulignées et justifient des recherches supplémentaires dans des travaux futurs. Premièrement, la relation causale entre les modifications du microbiote intestinal et l'amélioration de la fonction rétinienne nécessite une validation approfondie. Bien que de fortes corrélations aient été observées entre la remodélisation du microbiote induite par le QMG et les phénotypes protecteurs au niveau de la rétine, des expériences permettant une inférence causale directe, telles que la transplantation fécale de microbiote, l'utilisation de modèles animaux axéniques ou l'épuisement du microbiote induit par antibiotiques, seraient utiles pour confirmer cette relation dans des études ultérieures. Deuxièmement, le séquençage de l'ADNr 16S a été utilisé pour analyser la composition microbienne, méthode qui offre une résolution taxonomique adéquate au niveau du genre et au-dessus, mais dont la capacité à fournir des informations fonctionnelles au niveau des souches ou un potentiel métabolique précis est limitée. Des analyses par séquençage métagénomique ou métabolomique seront entreprises dans des études ultérieures afin d'identifier les principales voies fonctionnelles microbiennes régulées par le QMG. Troisièmement, les modifications microbiennes n'ont été évaluées qu'au point final de l'expérience, empêchant ainsi un suivi dynamique de l'évolution temporelle de la reconstruction du microbiote durant l'intervention par le QMG. Des prélèvements longitudinaux dans des études futures permettront de préciser la cinétique du remaniement du microbiote induit par le QMG ainsi que sa relation temporelle avec la protection rétinienne. Quatrièmement, bien que l'analyse histopathologique ait révélé un amincissement rétinien, une perte des cellules ganglionnaires rétiniennes (RGC) et la présence de touffes néovasculaires, des études futures devraient explorer des protocoles d'injection multiple de STZ ainsi que des modèles génétiques de diabète, et fournir une caractérisation plus complète du phénotype de la rétinopathie diabétique (DR).
En résumé, cette étude démontre que le QMG améliore la rétinopathie diabétique (DR) en couplant le réseau moléculaire centré sur CMKLR1 à l'inflammation systémique via l'axe intestin–rétine. Le mécanisme d'action du QMG se manifeste à trois niveaux : au niveau microbien, le QMG inverse la dysbiose intestinale induite par le diabète (par exemple, en restaurant le ratio Firmicutes/Bacteroidetes, en supprimant Odoribacter et Clostridioides, et en favorisant des bactéries bénéfiques telles que Faecalibaculum) ; au niveau moléculaire, le QMG régule la voie CMKLR1/Wnt5a/PPAR-γ/AP-1/TP53 et atténue l'inflammation systémique ; au niveau tissulaire, le QMG protège la morphologie rétinienne. Ces résultats soutiennent l'utilisation du QMG comme stratégie thérapeutique prometteuse ciblant l'axe intestin–rétine dans la DR et fournissent une base mécanistique à l'application de la médecine traditionnelle chinoise dans le traitement des complications diabétiques.
Déclarations de divulgation
Les auteurs déclarent qu’ils n’ont aucun intérêt financier concurrent connu ni aucune relation personnelle susceptible d’avoir influencé le travail rapporté dans cet article.
Remerciements
L'auteur tient à remercier tous les membres de son équipe qui ont apporté un soutien et une aide considérables pour mener à bien cette recherche.
Cette recherche a été soutenue par la National Natural Science Foundation of China (numéro de subvention : 82474580) et par le projet d'exploration libre du fonds hospitalier de l'Hôpital de l'Université de médecine traditionnelle chinoise de Chengdu (n° 23ZYTS1601).
Matériaux
| Nom | Entreprise | Numéro de catalogue | Commentaires |
|---|---|---|---|
| Anticorps monoclonaux AP-1 | Proteintech | 66313-1-IG | 1:5000 |
| Anticorps polyclonaux CMKLR1 | Affinity | AF5291 | 1:1000 |
| Anticorps polyclonaux GAPDH | Affinity | AF7021 | 1:5000 |
| GoatAnti-Mouse IgG(H+L) HRP | MULTI SCIENCES | GAM0072 | 1:10000 |
| GoatAnti-Rabbit IgG(H+L) HRP | MULTI SCIENCES | GAR0072 | 1:10000 |
| GraphPad Prism | / | version 9.5 | |
| Image-Pro Plus | Media Cybernetics, Inc., Rockville, MD, USA | version 6.0 | |
| Plateforme Luoning Bio-Cloud | http://www.biomediv.cn/login.html | ||
| Kit ELISA Mouse IL-1β (interleukine 1 bêta) | Elabscience | E-EL-M0037 | Détection des cytokines sériques |
| Kit ELISA Mouse IL-6 (interleukine-6) | Elabscience | E-EL-M0044 | Détection des cytokines sériques |
| Kit ELISA Mouse TNF-α (facteur de nécrose tumorale alpha) | Elabscience | E-EL-M3063 | Détection des cytokines sériques |
| NanoFilt | / | version 2.7.1 | |
| Séquenceur Nanopore GridION | Oxford Nanopore Technologies | https://store.nanoporetech.com/gridion.html | |
| Pannoramic SCAN II | Scanner 3DHISTECH Pannoramic SCAN | https://www.3dhistech.com/scanners/pannoramic-scan-ii-digital-scanner/ | |
| Anticorps polyclonaux PPAR gamma (PPAR-γ) | ImmunoWay | bs-0530R | 1:1000 |
| Python | / | version 3.7.4 | |
| Granulé Qiming | Société pharmaceutique Zhejiang Sansheng Mandi Co., Ltd. | No. d'agrément national chinois Z20090036 | 0,9 g/kg, administration par gavage oral |
| Langage de programmation R | / | version 4.0.3 | |
| Base de données SILVA | / | version 138 | |
| Streptozotocine (STZ) | Sigma-Aldrich | S0130 | 35 mg/kg, i.p. |
| Anticorps polyclonaux TP53 | Abcam | ab131442 | 1:1000 |
| Usearch | / | version 10.0.240 | |
| Anticorps polyclonaux Wnt5a | Proteintech | 55184-1-AP | 1:1000 |
| Kit Zymo Research BIOMICS DNA Microprep | Zymo Research | D4301 | Extraction de l'ADNg fécal |
Références
- Lei C, et al. Homocysteine and diabetic retinopathy. Exp Eye Res. 2026;262:110729.
- Owens DR, et al. IDF diabetes Atlas: A worldwide review of studies utilizing retinal photography to screen for diabetic retinopathy from 2017 to 2024 inclusive. Diabetes Res Clin Pract. 2025;226:112346.
- Zhu J, Huang J, Sun Y, Xu W, Qian H. Emerging role of extracellular vesicles in diabetic retinopathy. Theranostics. 2024;14(4):1631–1646.
- Xie L, Lin W. The role of gut microbiota dysbiosis in the inflammatory pathogenesis of diabetic retinopathy. Front Immunol. 2025;16:1604315.
- Niu J, Liu Y, Peng H, Chen J, Chen L. Early-stage diabetic retinopathy: gut-metabolic triggers, immune-neurodegeneration, and interventions. Graefes Arch Clin Exp Ophthalmol. 2025;263(10):2723–2736.
- Rowan S, et al. Involvement of a gut-retina axis in protection against dietary glycemia-induced age-related macular degeneration. Proc Natl Acad Sci U S A. 2017;114(22):E4472–E4481.
- Rzeczycki P, Pęciak O, Plust M, Droździk M. Gut Microbiota in the Regulation of Intestinal Drug Transporters: Molecular Mechanisms and Pharmacokinetic Implications. Int J Mol Sci. 2025;26(24):11897.
- Yang H, et al. Mediating role of aging and obesity in the relationship between dietary index for gut microbiota and metabolic syndrome and its potential regulatory mechanisms. Eur J Med Res. 2025;31(1):137.
- Zahavi EE, et al. Repeat-element RNAs integrate a neuronal growth circuit. Cell. 2025;188(16):4350–4365.e22.
- Dander E, et al. The chemerin/CMKLR1 axis regulates intestinal graft-versus-host disease. JCI Insight. 2023;8(5):e154440.
- Zhang J, et al. Therapeutic targets in the Wnt signaling pathway: Treating cancer with specificity. Biochem Pharmacol. 2025;236:116848.
- Liu M, Lim ST, Song W, Coffman TM, Wang X. Beyond lipids: fenofibrate in diabetic retinopathy and nephropathy. Trends Pharmacol Sci. 2026;47(3):325–341.
- Wu Y, et al. The active ingredient β-sitosterol in the anti-inflammatory agents alleviates perianal inflammation in rats by inhibiting the expression of Srebf2, activating the PPAR signaling pathway, and altering the composition of gut microbiota. Int Immunopharmacol. 2025;152:114470.
- Lin T, Chen C, Zhao LC, Zhu HY, Li W. The beneficial effects of Traditional Chinese Medicine on diabetic retinopathy: mechanisms, therapeutics, and prospects. Acupunct Herb Med 2026;6(2):188–204.
- Huo J, et al. Evaluation of individualized treatment of nonproliferative diabetic retinopathy: a multicenter, randomized, parallel-controlled study. J Tradit Chin Med. 2022;42(1):90–95.
- Huang Y, et al. Pharmacological mechanism and clinical study of Qiming granules in treating diabetic retinopathy based on network pharmacology and literature review. J Ethnopharmacol. 2023;302(Pt A):115861.
- Salma B, et al. Ameliorative Efficacy of the Cassia auriculata Root Against High-Fat-Diet + STZ-Induced Type-2 Diabetes in C57BL/6 Mice. ACS Omega. 2020;6(1):492–504.
- Srinivasan K, Viswanad B, Asrat L, Kaul CL, Ramarao P. Combination of high-fat diet-fed and low-dose streptozotocin-treated rat: a model for type 2 diabetes and pharmacological screening. Pharmacol Res. 2005;52(4):313–320.
- Liu Y, Deng J, Fan D. Ginsenoside Rk3 ameliorates high-fat-diet/streptozocin-induced type 2 diabetes mellitus in mice via the AMPK/Akt signaling pathway. Food Funct. 2019;10(5):2538–2551.
- Hu RY, et al. AFG Ameliorates Diabetic Retinopathy through AMPK-Dependent Autolysosomal Pathway: From Network Pharmacology to In Vivo and In Vitro Validation. J Agric Food Chem. 2026;74(2):2124–2139.
- Reagan-Shaw S, Nihal M, Ahmad N. Dose translation from animal to human studies revisited. FASEB J. 2008;22(3):659–661.
- Zou Q, et al. Oxidative stress in diabetic retinopathy. Clin Chim Acta. 2026;584:120871.
- Clements JN, Mesawich J, Twisdale C. Current and Emerging Pharmacologic Therapies for Diabetic Retinopathy. Pharmacotherapy. 2026;46(3):e70119.
- Rezvani Z, Khani F, Afarid M, Asadian F, Takhshid MA. Clinical values of systemic inflammatory indices in diabetic retinopathy. Clin Exp Optom. 2026;109(3):371–385.
- Zhu Z, et al. Targeting the CMKLR1-Mediated Signaling Rebalances Immunometabolism State in Middle-Age Testicular Macrophages. Adv Sci (Weinh). 2026;13(14):e15166.
- Lin Y, et al. Epithelial chemerin-CMKLR1 signaling restricts microbiota-driven colonic neutrophilia and tumorigenesis by up-regulating lactoperoxidase. Proc Natl Acad Sci U S A. 2022;119(29):e2205574119.
- Puthanmadhom Narayanan S, et al. Epigenetic Alterations Are Associated With Gastric Emptying Disturbances in Diabetes Mellitus. Clin Transl Gastroenterol. 2020;11(3):e00136.
- Wang L, et al. Chemerin/CMKLR1 Axis Promotes the Progression of Proliferative Diabetic Retinopathy. Int J Endocrinol. 2021;2021:4468625.
- Zheng C, et al. α-NETA down-regulates CMKLR1 mRNA expression in ileum and prevents body weight gains collaborating with ERK inhibitor PD98059 in turn to alleviate hepatic steatosis in HFD-induced obese mice but no impact on ileal mucosal integrity and steatohepatitis progression. BMC Endocr Disord. 2023;23(1):9.
- Dranse HJ, et al. The impact of chemerin or chemokine-like receptor 1 loss on the mouse gut microbiome. PeerJ. 2018;6:e5494.
- Flores-Hernández E, et al. Canonical and non-canonical Wnt signaling are simultaneously activated by Wnts in colon cancer cells. Cell Signal. 2020;72:109636.
- Qi Y, et al. Heat-inactivated Bifidobacterium adolescentis ameliorates colon senescence through Paneth-like-cell-mediated stem cell activation. Nat Commun. 2023;14(1):6121.
- Ou W, et al. Cooperation of Wnt/β-catenin and Dll1-mediated Notch pathway in Lgr5-positive intestinal stem cells regulates the mucosal injury and repair in DSS-induced colitis mice model. Gastroenterol Rep (Oxf). 2024;12:goae090.
- Dong Y, et al. Berberine ameliorates DSS-induced intestinal mucosal barrier dysfunction through microbiota-dependence and Wnt/β-catenin pathway. Int J Biol Sci. 2022;18(4):1381–1397.
- Escandon P, et al. The role of peroxisome proliferator-activated receptors in healthy and diseased eyes. Exp Eye Res. 2021;208:108617.
- Blot G, et al. Perilipin 2-positive mononuclear phagocytes accumulate in the diabetic retina and promote PPARγ-dependent vasodegeneration. J Clin Invest. 2023;133(19):e161348.
- Zhou W, et al. TREM2-dependent activation of microglial cell protects photoreceptor cell during retinal degeneration via PPARγ and CD36. Cell Death Dis. 2024;15(8):623.
- Bala Kumar S, et al. Gut microbial metabolites targeting JUN in renal cell carcinoma via IL-17 signaling pathway: network pharmacology approach. Mol Divers. 2026;30(1):613–632.
- Wang L, et al. Gut microbial bile acid metabolite skews macrophage polarization and contributes to high-fat diet-induced colonic inflammation. Gut Microbes. 2020;12(1):1–20.
- Hagan T, et al. Antibiotics-Driven Gut Microbiome Perturbation Alters Immunity to Vaccines in Humans. Cell. 2019;178(6):1313–1328.e13.
- Meng Y, et al. Jinlida ameliorates diabetic kidney disease via gut microbiota-dependent production of pyridoxamine targeting renal AGEs/RAGE and TGF-β pathways. Phytomedicine. 2026;150:157744.
- Zhou H, Zhang L, Ding C, Zhou Y, Li Y. Upregulation of HMOX1 associated with M2 macrophage infiltration and ferroptosis in proliferative diabetic retinopathy. Int Immunopharmacol. 2024;134:112231.
- Mohammad HMF, et al. Neuroprotective effect of levetiracetam in mouse diabetic retinopathy: Effect on glucose transporter-1 and GAP43 expression. Life Sci. 2019;232:116588.
- Peng H, et al. Autophagy and senescence of rat retinal precursor cells under high glucose. Front Endocrinol (Lausanne). 2023;13:1047642.
- Ding Y, Chen L, Xu J, Feng Y, Liu Q. APAF1 Silencing Ameliorates Diabetic Retinopathy by Suppressing Inflammation, Oxidative Stress, and Caspase-3/GSDME-Dependent Pyroptosis. Diabetes Metab Syndr Obes. 2024;17:1635–1649.
- Yang T, et al. Clinical study on the modulating effects of Jiaotaiwan on the modulating effects of microbiota–SCFAs–neurotransmitter/immune axis in patients with depression. Acupunct Herb Med 2025;5(4):456–468.
- Luo XX, et al. Effect of qiming granule on retinal blood circulation of diabetic retinopathy: a multicenter clinical trial. Chin J Integr Med. 2009;15(5):384–388.
- Hu Z, et al. Add-on effect of Qiming granule, a Chinese patent medicine, in treating diabetic macular edema: A systematic review and meta-analysis. Phytother Res. 2021;35(2):587–602.
- Yang M, et al. The Efficacy and Safety of Qiming Granule for Dry Eye Disease: A Systematic Review and Meta-Analysis. Front Pharmacol. 2020;11:580.
- Ma XF, et al. Efficacy and Safety of Qiming Granule for Nerve Injury Associated with Non-proliferative Diabetic Retinopathy: A Multicenter, Randomized, Non-inferiority, Active-Controlled Clinical Trial. Chin J Integr Med. 2026;32(3):195–203.
- Zhou Q, et al. Qiming granules regulate Müller cell pyroptosis and the P2X7R/NLRP3 immune inflammatory pathway in diabetic retinopathy. Chin Med. 2026;21(1):89.
- Zhou L, Qin T, Lv Y, Wu Z. Qiming Granules Ameliorate Diabetic Retinopathy by Regulating the PI3K/Akt Signaling Pathway. J Ocul Pharmacol Ther. 2026;42(3):202–212.
- Li HD, Li MX, Zhang WH, Zhang SW, Gong YB. Effectiveness and safety of traditional Chinese medicine for diabetic retinopathy: A systematic review and network meta-analysis of randomized clinical trials. World J Diabetes. 2023;14(9):1422–1449.
- Chen F, et al. Isorhamnetin promotes functional recovery in rats with spinal cord injury by abating oxidative stress and modulating M2 macrophages/microglia polarization. Eur J Pharmacol. 2021;895:173878.
- Naudhani M, Thakur K, Ni ZJ, Zhang JG, Wei ZJ. Formononetin reshapes the gut microbiota, prevents progression of obesity and improves host metabolism. Food Funct. 2021;12(24):12303–12324.
- Qu Y, et al. Kaempferol Alleviates Murine Experimental Colitis by Restoring Gut Microbiota and Inhibiting the LPS-TLR4-NF-κB Axis. Front Immunol. 2021;12:679897.
- Saikia L, et al. Therapeutic Potential of Quercetin in Diabetic Neuropathy and Retinopathy: Exploring Molecular Mechanisms. Curr Top Med Chem. 2024;24(27):2351–2361.
- Yao H, et al. Kaempferol Protects Blood Vessels From Damage Induced by Oxidative Stress and Inflammation in Association With the Nrf2/HO-1 Signaling Pathway. Front Pharmacol. 2020;11:1118.
- Zhang HX, Li YY, Liu ZJ, Wang JF. Quercetin effectively improves LPS-induced intestinal inflammation, pyroptosis, and disruption of the barrier function through the TLR4/NF-κB/NLRP3 signaling pathway in vivo and in vitro. Food Nutr Res. 2022;66:10.