This study presents a structured ocular vestibular evoked myogenic potential (oVEMP) protocol for categorizing response patterns and an exploratory study-specific oVEMP abnormality-burden grade in peripheral vestibular disorders, and relates these electrophysiological findings to short-term residual dizziness.
Article de recherche
Ocular Vestibular Evoked Myogenic Potential Response Patterns for Characterizing Vestibular Dysfunction in Peripheral Vestibular Disorders
Dans cet article
Résumé
Résumé
Ocular vestibular evoked myogenic potential (oVEMP) testing provides electrophysiological information on otolithic and superior vestibular pathway function, but its clinical interpretation often remains limited to a binary normal-or-abnormal judgment. This study developed and applied a structured oVEMP response-pattern protocol, together with an exploratory, study-specific composite abnormality-burden grade, to characterize vestibular dysfunction in patients with peripheral vestibular disorders. From February 2024 to December 2025, 110 adults with Ménière’s disease, benign paroxysmal positional vertigo, sudden sensorineural hearing loss with vertigo, vestibular neuritis, or other peripheral vestibular injury underwent standardized clinical assessment and bilateral oVEMP testing. Parameters included N10 latency, P15 latency, N10–P15 amplitude, response threshold, interaural amplitude asymmetry ratio, 1,000/500 Hz amplitude ratio, waveform absence, and the composite grade. Abnormal oVEMP responses were found in 62.7% of patients. Ménière’s disease showed a higher 1,000/500 Hz amplitude ratio, while the small heterogeneous vestibular neuritis/other peripheral vestibular injury composite group showed more absent responses and higher composite grades. Across all four analytical groups, response-pattern and grade distributions differed; however, sensitivity analyses restricted to the three larger diagnostically homogeneous groups attenuated these between-group differences. At 4 weeks, abnormal oVEMP responses, marked interaural asymmetry, and higher exploratory grades were associated with residual dizziness. These findings support structured oVEMP response-pattern analysis as a functional descriptive framework, but they do not establish diagnostic accuracy or validate the proposed grade as a universal severity scale.
Introduction
Vestibular symptoms rarely map neatly onto a single anatomical lesion. Patients with vertigo, positional dizziness, sudden hearing loss with vestibular symptoms, or persistent imbalance may share overlapping complaints, yet the underlying vestibular structures involved can differ substantially. Conventional clinical diagnosis remains essential, but it does not always capture the functional extent of involvement of the otolithic and vestibular pathways. This gap is especially relevant in peripheral vestibular disorders, where symptom intensity, hearing status, vestibular compensation, and residual dizziness may not move in parallel. Vestibular-evoked myogenic potential testing has become an important adjunctive method because it provides electrophysiological information about otolith-mediated vestibular reflex pathways, rather than relying solely on symptom descriptions or positional signs1.
Ocular vestibular evoked myogenic potential (oVEMP) testing records short-latency extraocular myogenic responses to vestibular stimulation, most commonly from electrodes placed below the eyes during upward gaze. The response is generally interpreted as reflecting utricular and superior vestibular pathway function, although amplitude is influenced by stimulus type, gaze angle, age, and laboratory-specific recording conditions2. This makes oVEMP clinically useful, but also easy to oversimplify. A present waveform, a delayed latency, a reduced amplitude, a high response threshold, an absent response, and an altered frequency response do not necessarily carry the same implication. Practice guidance has therefore emphasized standardized acquisition, cautious interpretation, and the use of oVEMP as part of a broader vestibular assessment rather than as an isolated diagnostic test3.
Ménière’s disease (MD), benign paroxysmal positional vertigo (BPPV), sudden sensorineural hearing loss with vertigo (SSHL), and vestibular neuritis (VN) represent common clinical settings in which oVEMP may add information beyond the diagnostic label. Ménière’s disease is diagnosed according to recurrent vertigo, fluctuating aural symptoms, and audiometrically documented sensorineural hearing loss, but the functional vestibular involvement can vary across patients and disease stages4. In this disease context, changes in vestibular-evoked myogenic potential tuning, including a shift in the 1,000/500 Hz amplitude relationship, have been explored as markers of endolymphatic hydrops rather than simple response loss5. For that reason, frequency-pattern interpretation may be more informative than a single-threshold abnormality in selected patients.
Benign paroxysmal positional vertigo is different. Its diagnosis depends primarily on positional testing and canal-specific nystagmus patterns, not on oVEMP testing6. Even so, some patients with BPPV show cervical or oVEMP abnormalities, suggesting that otolithic dysfunction may coexist with canalithiasis in a subset of cases7. This is clinically important because residual dizziness after repositioning is common in practice, and not all persistent symptoms can be explained by unresolved positional nystagmus alone. In this setting, oVEMP should not replace positional testing, but it may help identify accompanying otolithic or vestibular pathway vulnerability.
Sudden sensorineural hearing loss with vertigo presents another problem. The cochlea and vestibular end organs are anatomically close, and acute cochlear injury may be accompanied by vestibular dysfunction. Previous studies have shown that vestibular abnormalities in sudden sensorineural hearing loss are associated with more extensive inner-ear involvement and may relate to hearing recovery or clinical prognosis8. Patients with vertigo during sudden hearing loss, therefore, represent a clinically meaningful subgroup, not merely a hearing-loss population with an additional symptom. In such patients, oVEMP may help describe whether vestibular involvement is limited, mixed, or severe.
Vestibular neuritis also illustrates why response-pattern interpretation matters. Depending on whether the superior, inferior, or both vestibular nerve divisions are involved, different vestibular tests may show different abnormal profiles. Ocular vestibular evoked myogenic potential testing is particularly relevant when superior vestibular pathway involvement is suspected, and recent reviews have described vestibular evoked myogenic potentials as useful adjunctive tools for topographic assessment in VN9. However, clinical use still requires a practical classification system that distinguishes among absent response, amplitude reduction, asymmetry, frequency shift, and severe combined abnormality, rather than merging all findings into a single abnormal category.
Despite the growing use of oVEMP, two issues remain under-addressed in applied clinical studies. The first is interpretive granularity. Many studies report oVEMP as normal or abnormal, but this binary framing may hide clinically meaningful differences among reduced-amplitude, delayed-latency, high-threshold, frequency-shift, and absent-response patterns. The second is short-term clinical relevance. Residual dizziness after the acute episode is common across vestibular disorders, but it is not always well explained by the diagnostic category alone. Work on vestibular assessment in sudden sensorineural hearing loss has suggested that vestibular test findings may provide additional information about prognosis and disease extent10. A similar logic may apply across peripheral vestibular disorders when oVEMP findings are summarized using a structured response-pattern framework and an explicitly exploratory composite grade rather than interpreted as a single positive or negative result.
This study, therefore, developed and applied a structured oVEMP response-pattern protocol in adults with common peripheral vestibular disorders, with emphasis on MD, BPPV, SSHL, and a small composite group of VN or other peripheral vestibular injury. The protocol classified oVEMP findings according to waveform presence, N10 latency, P15 latency, N10–P15 amplitude, response threshold, interaural amplitude asymmetry ratio, 1,000/500 Hz amplitude ratio, and a pre-specified, study-specific abnormality burden grade. The study was designed to describe disease-related oVEMP response profiles and to explore whether protocol-defined oVEMP abnormality or the ordinal composite grade was associated with residual dizziness at 4 weeks. It was not designed as a diagnostic-accuracy validation study because no independent gold-standard classification of vestibular dysfunction severity was available. The broader aim was to provide a reproducible framework for using oVEMP as a functional assessment tool rather than as a stand-alone diagnostic marker11.
Protocole
This protocol describes a single-center observational study with a 4-week follow-up. The study protocol was reviewed and approved by Qinhuai Medical District, General Hospital of Eastern Theater Command (Approval No. SZITCM-EC-2024-017). All procedures involving human participants were conducted in accordance with the Declaration of Helsinki and the institutional requirements for human-subject research. Written informed consent was obtained from all participants before vestibular testing, audiological examination, and clinical data collection.
Study design and participant enrollment
This single-center observational study was conducted from February 2024 to December 2025 in the Department of Otolaryngology–Head and Neck Surgery of General Hospital of Eastern Theater Command. The study was designed to characterize oVEMP response patterns and their relationship with clinical vestibular dysfunction in patients with peripheral vestibular disorders.
Consecutive adult patients were screened if they presented with vertigo, dizziness, positional vertigo, fluctuating aural symptoms, sudden hearing loss with vertigo, or clinically suspected peripheral vestibular dysfunction. Eligible participants were 18–80 years old, completed standardized neuro-otological assessment, underwent bilateral oVEMP testing, and had a final clinical diagnosis of MD, BPPV, sudden sensorineural hearing loss (SSNHL) with vertigo, VN, or another clinically defined peripheral vestibular injury.
MD was diagnosed according to the Bárány Society criteria, which classify definite and probable MD according to recurrent vertigo, sensorineural hearing loss, tinnitus, and/or aural fullness not better explained by another vestibular disorder12. BPPV was diagnosed when positional vertigo was accompanied by canal-specific positional nystagmus on the Dix–Hallpike test or supine roll test. Posterior-canal BPPV was defined by transient upbeat torsional nystagmus provoked by the Dix–Hallpike test, while horizontal-canal BPPV was defined by geotropic or apogeotropic horizontal nystagmus during the supine roll test13. SSNHL with vertigo was defined as acute sensorineural hearing loss developing within 72 h, accompanied by vertigo or persistent dizziness after exclusion of conductive hearing loss, retrocochlear lesion, and obvious central nervous system causes14. VN was diagnosed when acute, prolonged vertigo was accompanied by spontaneous peripheral vestibular signs without acute cochlear symptoms or central neurological signs.
The following patients were excluded: those with active middle ear disease, external auditory canal obstruction preventing acoustic stimulation, previous inner-ear surgery, vestibular schwannoma, acute stroke, demyelinating disease, vestibular migraine, persistent postural-perceptual dizziness, severe ocular movement limitation, inability to maintain upward gaze, incomplete clinical records, or technically unreliable oVEMP traces after repeated acquisition. Technically unreliable traces were excluded from waveform-parameter analyses, while the corresponding participants remained represented in the study flow. The participant screening, diagnostic grouping, oVEMP acquisition, follow-up, and final analysis workflow is summarized in Figure 1.
Clinical assessment and diagnostic grouping
Age, sex, affected side, symptom duration, vertigo type, hearing loss, tinnitus, aural fullness, history of recurrent vertigo, vascular risk factors, and medication exposure were recorded at enrollment. Otoscopy, bedside neuro-otological examination, pure-tone audiometry, and positional testing were performed when clinically indicated. Pure-tone average (PTA) was calculated as the mean air-conduction threshold at 0.5, 1, 2, and 4 kHz. Hearing loss was classified as mild, moderate, severe, or profound according to the measured PTA in the affected ear.
Participants were assigned to one of four analytical groups before statistical analysis: MD BPPV, SSNHL with vertigo, and VN or other clinically defined peripheral vestibular dysfunction. The fourth category was retained as a pragmatic descriptive composite because it included only 15 patients, and the study was not designed to estimate stable disease-specific outcomes within this small stratum. It should therefore not be interpreted as a homogeneous disease entity or as a VN-specific effect estimate. Diagnostic groups were not reassigned according to oVEMP results. This approach prevented circular interpretation when evaluating the association between oVEMP response patterns and vestibular dysfunction.
The clinically affected side was defined according to the final diagnosis. For MD and SSNHL with vertigo, the affected side was defined by audiometry and physician diagnosis. For BPPV, the affected side was defined according to the canal and side indicated by positional nystagmus. For VN and other peripheral vestibular injury, the affected side was defined according to spontaneous nystagmus, bedside vestibular signs, video head impulse test findings, caloric weakness, or combined clinical judgment when available. If the affected side remained uncertain, the side was coded as "uncertain," and the participant was included only in bilateral or group-level analyses. Cases with an uncertain affected side were excluded from the side-specific sensitivity analysis.
Equipment
The same calibrated evoked-potential recording system equipped with a vestibular evoked myogenic potential (VEMP) module was used throughout the study. The system delivered air-conducted tone-burst stimuli up to 105 dB nHL. Acoustic output was calibrated every 6 months and after equipment maintenance. A calibrated clinical audiometer was used for pure-tone audiometry, and tympanometry was performed when middle-ear dysfunction was suspected. Video nystagmography was performed when available to document spontaneous, gaze-evoked, and positional nystagmus.
Caloric weakness and horizontal video head impulse test (vHIT) gain were recorded, when clinically available, as supportive vestibular function variables. These measures were used for descriptive between-group comparisons and to support clinical lateralization, but were not used to define the binary oVEMP abnormality category or the study-specific oVEMP abnormality burden grade. The manufacturers and model numbers of all equipment are provided in the Table of Materials.
oVEMP recording preparation
oVEMP testing was performed in a quiet electrophysiology room. Participants were seated in a semi-recumbent position with the head supported. The skin below both lower eyelids, on the cheek, and on the forehead was cleaned before electrode placement. The active electrode was placed approximately 1 cm below the center of each lower eyelid, the reference electrode was placed 1–2 cm inferior to the active electrode on the ipsilateral cheek, and the ground electrode was placed on the forehead. Electrode impedance was maintained below 5 kΩ, and the inter-electrode impedance difference was maintained below 2 kΩ before acquisition.
Participants were instructed to maintain an upward gaze at a fixed visual target positioned approximately 25°–30° above the horizontal line. A short practice run was performed before formal recording. If a participant was unable to maintain upward gaze because of fatigue, acquisition was stopped, and the recording was repeated after a 2–3 min rest. Because oVEMP amplitude depends on activation of the inferior oblique muscle, the gaze angle, body position, electrode position, and recording environment were kept consistent between the two ears and across stimulus frequencies15.
The electrode montage, patient posture, upward-gaze target, acoustic stimulation pathway, and representative N10–P15 waveform-marking process are shown in Figure 2. In Figure 2D, the waveform schematic follows the same polarity convention used throughout the study: N10 represents the first negative peak and P15 the subsequent positive peak.
Acoustic stimulation and waveform acquisition
Monaural air-conducted tone-burst stimuli were delivered through insert earphones. Bilateral extraocular myogenic responses were recorded during stimulation of each ear. A 500 Hz tone burst was used as the primary stimulus frequency, and a 1,000 Hz tone burst was used for frequency-tuning assessment. The initial stimulus intensity was set at 95 dB nHL. Stimuli were presented with a 2 ms rise time, 2 ms plateau, and 2 ms fall time at a rate of 5.1/s. A band-pass filter of 1–1,000 Hz and an analysis window extending from 20 ms before to 80 ms after stimulus onset were used.
At least 100 artifact-free sweeps were acquired for each trace. At least two reproducible traces were obtained for each ear and each stimulus frequency. If the first two traces were inconsistent, a third trace was acquired, and the two most reproducible waveforms were retained for final marking. Individual sweeps were rejected when eye-movement artifact, baseline drift, excessive electromyographic noise, or poor electrode contact obscured the N10–P15 waveform. Acquisition was repeated when residual noise exceeded 0.5 µV, baseline drift prevented peak marking, or the participant failed to maintain the required gaze angle.
No stimulus intensity above 105 dB nHL was used. Testing was discontinued if the participant reported intolerable discomfort, marked nausea, worsening vertigo, or inability to cooperate. The reason for test discontinuation was recorded in the case report form.
Peak identification and parameter extraction
The first negative peak occurring approximately 10 ms after stimulus onset was identified as N10, and the subsequent positive peak occurring approximately 15 ms after stimulus onset was identified as P15. N10 latency was measured from stimulus onset to the N10 negative peak, and P15 latency was measured from stimulus onset to the P15 positive peak. N10–P15 amplitude was measured as the peak-to-peak voltage difference between these two oppositely directed peaks. N10 and P15 were marked manually by two trained examiners blinded to the final statistical results. If the two examiners disagreed by >1.0 ms for latency or >15% for amplitude, the waveform was reviewed jointly, and consensus was reached before data entry.
Before consensus resolution, N10 and P15 were identified independently by the two trained examiners using the same prespecified peak definitions and disagreement limits. Pre-consensus inter-examiner agreement was excellent: the two-way random-effects, absolute-agreement single-measure intraclass correlation coefficient, ICC(2,1), was 0.94 (95% CI, 0.91-0.96) for N10 latency, 0.93 (95% CI, 0.89-0.95) for P15 latency, and 0.91 (95% CI, 0.87-0.94) for N10–P15 amplitude. As an additional quality-control check, all accepted waveforms were reviewed against the prespecified polarity convention (N10 as the first negative peak and P15 as the subsequent positive peak), and no changes to the consensus-resolved measurements were required. Disagreements exceeding the predefined latency or amplitude limits were resolved jointly before final data entry.
The following oVEMP parameters were extracted for each stimulated ear and each frequency: N10 latency, P15 latency, N10–P15 peak-to-peak amplitude, response threshold, waveform presence, waveform absence, interaural amplitude asymmetry ratio (IAAR), and the 1,000/500 Hz amplitude ratio. Response threshold was defined as the lowest stimulus intensity that produced a reproducible N10–P15 waveform in two repeated traces. If no reproducible waveform was obtained at 105 dB nHL, the response was classified as absent, and the threshold was recorded as >105 dB nHL for descriptive analysis.
IAAR was calculated using the following formula:
IAAR (%) = |larger N10–P15 amplitude − smaller N10–P15 amplitude| / (larger N10–P15 amplitude + smaller N10–P15 amplitude) × 100.
The frequency amplitude ratio was calculated using the following formula:
1,000/500 Hz amplitude ratio = N10–P15 amplitude at 1,000 Hz / N10–P15 amplitude at 500 Hz.
If the 500 Hz response was absent, the 1,000/500 Hz amplitude ratio was not calculated for that ear. If the 500 Hz response was present but the 1,000 Hz response was absent, the ratio was recorded as 0. If both responses were absent, the ratio was coded as missing. The extracted oVEMP variables, waveform definitions, formulas, units, coding rules, and abnormality thresholds are summarized in Table 1.
Definition of abnormal oVEMP response patterns
A normal oVEMP response was defined as a reproducible N10–P15 waveform at 500 Hz that met all of the following local operational reference-range criteria: N10 latency ≤ 13.0 ms, P15 latency ≤ 18.0 ms, N10–P15 amplitude ≥ 2.5 µV, and an interaural amplitude asymmetry ratio (IAAR) < 30.0%. Response threshold and frequency-tuning pattern were reported separately and did not, by themselves, determine the binary normal/abnormal classification. IAAR values of 30.0%–34.9% were classified as borderline asymmetry rather than normal or protocol-defined abnormal.
A protocol-defined abnormal oVEMP response was defined as the presence of at least one of the following criteria: absent reproducible N10–P15 waveform at 105 dB nHL; N10–P15 amplitude < 2.5 µV; IAAR ≥ 35.0%; N10 latency > 13.0 ms; or P15 latency > 18.0 ms. A response threshold > 95 dB nHL was retained as a separate functional descriptor and regression predictor rather than being included in the binary abnormal-oVEMP definition. Borderline IAAR values of 30.0%–34.9% were not included in the abnormal group in the primary analysis but were included in the pre-specified sensitivity analysis.
Because oVEMP amplitude, latency, threshold, and asymmetry depend on age, gaze activation, stimulus method, transducer, recording system, and laboratory conditions, these boundaries were treated as local operational reference ranges rather than universal diagnostic cutoffs. For this study, the laboratory reference boundaries were N10 ≤ 13.0 ms, P15 ≤ 18.0 ms, N10–P15 amplitude ≥ 2.5 µV, IAAR < 30.0% (30.0%–34.9% borderline; ≥35.0% abnormal), and response threshold ≤ 95 dB nHL. These values had been prespecified before outcome analysis based on published VEMP methodology and clinical guidance together with the laboratory's internal reference practice, and the same recording system, air-conducted tone-burst paradigm, gaze angle, and electrode montage were used throughout the study15˒16. The reference ranges should be recalibrated before application in other laboratories, device platforms, age distributions, or stimulation protocols.
The frequency-tuning pattern was defined according to the 1,000/500 Hz amplitude ratio. A ratio <0.80 indicated a 500 Hz-dominant response, a ratio of 0.80–0.99 indicated a borderline frequency shift, and a ratio ≥1.00 indicated a 1,000 Hz-dominant response. Frequency tuning and response threshold were treated as response-pattern descriptors rather than automatic determinants of the binary abnormal-oVEMP category. In MD, a 1,000 Hz-dominant pattern was interpreted as a frequency-tuning shift rather than as an independent marker of severe vestibular dysfunction.
oVEMP abnormality-burden grading
Protocol-defined oVEMP abnormality burden was graded according to a pre-specified, study-specific composite classification developed for structured descriptive analysis rather than as an externally validated diagnostic staging system. Grade 0 indicated no protocol-defined abnormality; Grade 1 indicated exactly one abnormal dimension with the waveform preserved, excluding isolated marked IAAR ≥ 35.0%; Grade 2 indicated at least two abnormal dimensions with the waveform preserved or IAAR ≥ 35.0% even when isolated; and Grade 3 indicated response absence or a predefined severe combined pattern. A high-threshold response contributes to Grade 3 only when it occurs together with marked asymmetry and delayed latency; a high threshold alone does not define a binary oVEMP abnormality or increase the grade. For mutually exclusive assignments, the highest grade that met the criteria took precedence (Grade 3 > Grade 2 > Grade 1 > Grade 0).
This composite grading framework integrates waveform presence, amplitude, latency, response threshold, and interaural asymmetry as complementary descriptors of oVEMP response integrity. Published guidance supports standardized acquisition and multi-parameter interpretation of oVEMP findings but does not provide a universally validated ordinal abnormality burden scale. Accordingly, the present grade was used only to summarize protocol-defined electrophysiological abnormality burden within this cohort; the labels do not constitute established mild, moderate, or severe clinical stages. If bilateral abnormalities are present, the case was graded according to the worse ear, and bilateral involvement was recorded separately. If the clinically affected side was uncertain, the grade was assigned according to the worst-oVEMP side, and a sensitivity analysis was performed by excluding cases with an uncertain side. Treatment response, symptom improvement, and follow-up outcome were not used to determine the baseline grade. The prespecified oVEMP response categories and abnormality-burden grades are provided in Table 2 to ensure consistent interpretation across examiners.
Clinical treatment exposure recording
This study did not assign treatment. All treatments were determined by the treating physician according to diagnosis, symptom severity, contraindications, patient preference, and routine clinical practice. Treatment variables were recorded only as clinical exposure variables for subgroup description and statistical adjustment. The diagnosis-specific treatment-exposure categories, dose-recording rules, timing windows, and coding structure are provided in Supplementary Table S1.
For BPPV, treatment exposure was recorded according to the canalith repositioning maneuver performed. Posterior-canal BPPV was coded as Epley maneuver, Semont maneuver, repeated repositioning, or no repositioning. Horizontal-canal BPPV was coded as barbecue-roll maneuver, Gufoni maneuver, repeated repositioning, or no repositioning. Vestibular suppressants were not coded as routine BPPV treatment. If vestibular suppressants were used for severe nausea or vomiting, the drug name, dose, frequency, start date, stop date, and duration were recorded separately.
For MD, treatment exposure was coded as dietary and lifestyle counseling, acute vestibular-symptom control, oral maintenance therapy, intratympanic steroid therapy, intratympanic gentamicin therapy, vestibular rehabilitation, or no recorded treatment. Betahistine exposure was coded as 12 mg three times daily, 16 mg three times daily, 24 mg twice daily, or other recorded regimen. Diuretic exposure was coded as hydrochlorothiazide 25 mg once daily, spironolactone 20 mg once daily, combined diuretic therapy, or other recorded regimen. These variables were recorded as clinical exposure variables and were not assigned by the study protocol.
For SSNHL with vertigo, treatment exposure was coded as systemic corticosteroid therapy, intratympanic corticosteroid therapy, combined systemic and intratympanic therapy, salvage intratympanic therapy, or no corticosteroid therapy. Oral prednisone exposure was coded as 60 mg once daily for 14 days, followed by a 5-day taper when this regimen was documented. Intratympanic methylprednisolone exposure was coded as 40 mg/mL administered four times over 14 days when this regimen was documented. Treatment delay was calculated as the interval from hearing-loss onset to treatment initiation and categorized as ≤7 days, 8–14 days, 15–42 days, or >42 days. Salvage intratympanic corticosteroid therapy was coded separately when it was documented after incomplete recovery following initial therapy17.
For VN or other peripheral vestibular injury, treatment exposure was coded as systemic corticosteroid therapy, vestibular suppressant therapy, antiemetic therapy, vestibular rehabilitation, combined therapy, or no recorded treatment. When the classical methylprednisolone regimen was documented, it was coded as 100 mg once daily for 3 days followed by tapering over the next 19 days. Vestibular suppressant exposure was coded as ≤3 days or >3 days. Vestibular rehabilitation was coded as absent, home-based exercise, outpatient therapist-guided rehabilitation, or combined rehabilitation.
Follow-up and clinical outcome assessment
Follow-up was performed 4 weeks after baseline oVEMP testing, allowing a window of ±7 days. Outpatient records, repeat audiometry, vestibular clinic records, or structured telephone follow-up were used to assess outcomes. Residual dizziness was defined as persistent dizziness, imbalance, motion-provoked dizziness, visually induced dizziness, or postural unsteadiness that persisted beyond the acute episode and affected daily activities at the 4-week assessment. Residual dizziness was operationalized as a prespecified binary clinical outcome. The Dizziness Handicap Inventory (DHI) was collected separately as a standardized continuous measure of dizziness-related handicap and was not used to define the binary outcome. The 4-week residual-dizziness assessment was performed by a follow-up clinician who was not involved in baseline oVEMP waveform interpretation and was blinded to the baseline oVEMP response-pattern category and abnormality-burden grade. Outcome status was assigned according to the prespecified clinical definition before linkage to the oVEMP predictor variables.
For BPPV, positional vertigo recurrence, resolution of positional nystagmus, and the need for repeated repositioning were recorded. For SSNHL with vertigo, pure-tone average (PTA) was recorded at follow-up, and hearing outcome was classified as complete recovery, partial recovery, slight recovery, or no recovery according to the predefined audiometric criteria used by the clinical department. For MD, recurrent vertigo attacks, persistent tinnitus, persistent aural fullness, and subjective hearing fluctuation were recorded. For VN and other peripheral vestibular injury, persistent imbalance, resolution of spontaneous nystagmus, and vestibular rehabilitation status were recorded.
Data management and quality control
All data were entered into a structured spreadsheet using anonymized study identification numbers. Double-entry verification was performed for age, sex, diagnosis, affected side, N10 latency, P15 latency, N10–P15 amplitude, response threshold, IAAR, the 1,000/500 Hz amplitude ratio, oVEMP abnormality-burden grade, treatment exposure, and 4-week residual dizziness. All values were checked before analysis.
Absent oVEMP responses were treated as categorical absence rather than as zero amplitude in the primary analysis. For continuous amplitude analyses, absent responses were coded as missing. For threshold analyses, an absent response at 105 dB nHL was coded as >105 dB nHL and analyzed categorically. Missing waveform values were not imputed in the primary analysis. Sensitivity analyses were conducted after excluding technically unreliable recordings, borderline IAAR cases, and cases with an uncertain affected side.
N10 latency repeatability was considered acceptable when the between-run difference was ≤1.0 ms, and amplitude repeatability was considered acceptable when the between-run difference was ≤20%. If repeatability remained unacceptable after three acquisition attempts, the trace was classified as technically unreliable. The participant was retained in the enrollment flowchart, and the reason for exclusion from waveform analysis was recorded. The variable-coding structure, missing-data rules, quality-control boundaries, and sensitivity-analysis definitions are listed in Supplementary Table S2.
Statistical analysis
Data were analyzed using IBM SPSS Statistics version 29.0.2.0. R version 4.4.1 was used only for sensitivity analyses and to verify the plotted values. Continuous variables were summarized as mean ± standard deviation when normally distributed and as median (interquartile range) when non-normally distributed. Categorical variables were summarized as numbers and percentages.
Normality was assessed using the Shapiro–Wilk test and histogram inspection. Continuous oVEMP parameters were compared among diagnostic groups using one-way analysis of variance when assumptions were met, and the Kruskal–Wallis test when they were not. Categorical variables were compared using the chi-square test or Fisher's exact test. For sparse multi-row × multi-column contingency tables, exact P values were estimated using Monte Carlo sampling rather than relying solely on asymptotic chi-square probabilities. Post hoc pairwise comparisons were conducted only when the global test was significant, and Bonferroni correction was applied only to these comparisons. In response to the heterogeneity of the smallest analytical group, an additional sensitivity analysis was performed using only the three larger diagnostically homogeneous groups (MD, BPPV, and SSNHL with vertigo; n = 95).
Binary logistic regression was used to examine whether a protocol-defined abnormal oVEMP response (IAAR ≥ 35%, response threshold > 95 dB nHL, a 1,000 Hz-dominant response, and the oVEMP abnormality-burden grade) was associated with residual dizziness at 4 weeks. The primary adjusted model included age, sex, and diagnosis to preserve model stability with 40 outcome events. Affected side, hearing-loss severity, treatment exposure, and baseline symptom severity were considered clinically relevant covariates but were not entered simultaneously into the primary model because doing so would have over-parameterized the available event count. Secondary sensitivity models included individual additional covariates when model convergence and event support were adequate.
All statistical tests were two-sided. A P value < 0.05 was considered statistically significant, whereas a P value of 0.05–0.10 was interpreted as a borderline finding requiring cautious interpretation. Odds ratios, 95% confidence intervals, and exact P values were reported. Borderline findings were not described as statistically significant.
No a priori power calculation determined enrollment, as the study was a consecutive observational cohort assembled over a fixed study period. To characterize the detectable effect size of the available sample without retrospectively redefining recruitment, a sample-size sensitivity calculation was performed for the four-group × four-grade contingency comparison. With N = 110, a two-sided α = 0.05, and 9 degrees of freedom, the available sample provided approximately 80% power to detect a Cohen's w of 0.38, indicating that smaller between-group distribution effects and subgroup analyses might have been underpowered.
Sensitivity, specificity, and receiver operating characteristic (ROC) analyses were not used to validate the proposed abnormality-burden grade because the study lacked an independent gold-standard measure of the severity of vestibular dysfunction. Using the oVEMP-derived grade as the reference standard would have been circular. Therefore, the grade was treated as an exploratory ordinal exposure, and its short-term clinical relevance was evaluated through its association with independently assessed residual dizziness rather than through diagnostic-accuracy analyses.
Résultats
Clinical assessment and diagnostic grouping
A total of 132 patients were screened for eligibility. Twenty-two were excluded before final inclusion: eight did not meet the diagnostic/inclusion criteria, five had a central or non-peripheral vestibular disorder, three had an active middle-ear or external-canal condition interfering with testing, two had previous inner-ear surgery or vestibular schwannoma, two had incomplete clinical records, and two declined participation. The final cohort comprised 110 adults who completed clinical assessment and bilateral ocular vestibular evoked myogenic potential (oVEMP) testing: 35 with MD, 32 with BPPV, 28 with sudden sensorineural hearing loss (SSNHL) with vertigo, and 15 in the VN/other peripheral vestibular injury composite group. The composite group comprised 11 patients with VN and 4 with other clinically defined peripheral vestibular injury. Diagnostic grouping was completed before oVEMP interpretation, and no patient was reassigned according to waveform results.
The mean age of the overall cohort was 51.2 ± 12.2 years. Patients with BPPV were older than those in the other diagnostic groups, whereas patients with SSNHL with vertigo showed the highest pure-tone average (PTA), reflecting the cochlear component of this subgroup. Baseline Dizziness Handicap Inventory (DHI) scores and vertigo visual analog scale (VAS) scores also differed across groups, with relatively higher symptom burden in the SSNHL with vertigo and VN/other peripheral vestibular injury groups. The demographic and baseline clinical characteristics of the four diagnostic groups are summarized in Table 3.
oVEMP waveform acquisition and response-pattern distribution
Preconsensus inter-examiner agreement for manual peak identification was excellent (ICC(2,1) = 0.94 for N10 latency, 0.93 for P15 latency, and 0.91 for N10–P15 amplitude). Quality-control re-review confirmed the prespecified polarity convention for all accepted waveforms, with no changes required to the consensus-resolved measurements. Among the 110 included patients, 98 had measurable affected-side N10–P15 waveforms that met the technical reliability criteria, while 12 showed absent oVEMP responses at the maximum allowed stimulus intensity. Overall, 69 patients (62.7%) had protocol-defined abnormal oVEMP findings. The abnormality rate was 68.6% in MD, 46.9% in BPPV, 60.7% in SSNHL with vertigo, and 86.7% in the VN/other peripheral vestibular injury composite group. The difference in overall oVEMP abnormality rate among diagnostic groups was borderline rather than definitively significant (P = 0.053), indicating that abnormal oVEMP responses were common across peripheral vestibular disorders but were not restricted to a single diagnosis.
The distribution of oVEMP response-pattern categories differed across the four analytical groups (Monte Carlo exact P = 0.007). These categories describe mutually exclusive dominant response patterns and are distinct from the binary abnormal-oVEMP definition. In MD, reduced-amplitude and frequency-shift patterns were common. In BPPV, normal responses were more frequent, although reduced-amplitude, delayed-latency, and absent-response patterns were still observed in a subset of patients. In SSNHL with vertigo, both reduced-amplitude and mixed patterns were present. In the small heterogeneous VN/other peripheral vestibular injury composite group, absent-response and mixed patterns accounted for a larger proportion of findings; this comparison is descriptive and should not be interpreted as a disease-specific VN estimate. When more than one non-absence abnormal feature was present, the case was assigned to the mixed-pattern category; absent response took precedence over all other pattern categories. The distribution of oVEMP response-pattern categories is shown in Figure 3.
oVEMP parameter extraction and between-group comparison
The affected-side N10 latency did not differ among diagnostic groups (P = 0.984), suggesting that N10 timing alone was not sufficient to distinguish disease categories in this cohort. P15 latency showed a weak between-group tendency but did not reach statistical significance (P = 0.066). Affected-side 500 Hz amplitude also showed a non-significant trend toward lower values in the VN/other peripheral vestibular injury composite group (P = 0.092), consistent with the higher proportion of absent and higher-grade oVEMP abnormalities observed descriptively in this heterogeneous group.
In contrast, 1,000 Hz amplitude and the 1,000/500 Hz amplitude ratio differed more clearly among diagnostic groups. MD showed the highest 1,000/500 Hz amplitude ratio, supporting a frequency-tuning shift pattern in this subgroup. The mean 1,000/500 Hz ratio was 1.28 ± 0.46 in MD, 0.80 ± 0.26 in BPPV, 0.91 ± 0.29 in SSNHL with vertigo, and 0.99 ± 0.31 in the VN/other peripheral vestibular injury composite group (P < 0.001). Interaural amplitude asymmetry ratio (IAAR) did not differ significantly among groups (P = 0.174), indicating that asymmetry should be interpreted alongside response absence, frequency pattern, and abnormality burden grade rather than as an isolated marker. Elevated or absent-threshold response was frequent across diagnostic groups but did not differ significantly among them (P = 0.312). The extracted oVEMP parameters and between-group comparisons are presented in Table 4.
oVEMP response categories and abnormality-burden grading
The distribution of the pre-specified, study-specific oVEMP abnormality burden grades differed among analytical groups (P < 0.001). Grade 0 findings were most frequent in BPPV, whereas Grade 2 findings were common in MD and SSNHL with vertigo. The small heterogeneous VN/other peripheral vestibular injury composite group showed the highest proportion of Grade 3 findings, mainly due to absent responses or predefined severe combined patterns. Specifically, Grade 3 was assigned to 1 patient with MD, 3 patients with BPPV, 3 patients with SSNHL with vertigo, and 8 patients in the VN/other composite group. Because the fourth group combines diagnostically distinct peripheral vestibular conditions, these values are descriptive and should not be interpreted as a VN-specific severity estimate.
Compared with the binary normal/abnormal classification, the pre-specified ordinal abnormality-burden grade produced a more differentiated description of oVEMP response burden across the four analytical groups. This finding should not be interpreted as validation of the grading system or as evidence of diagnostic accuracy. The distribution of study-specific oVEMP abnormality-burden grades is shown in Figure 4.
Clinical treatment exposure and 4-week follow-up outcomes
Clinical treatment was not assigned by the study protocol. Treatment exposure was recorded as part of real-world clinical management and was available for subgroup description and sensitivity adjustment when model stability permitted. BPPV cases were documented according to the canalith repositioning maneuver performed. MD cases were coded for lifestyle counseling, oral maintenance therapy, intratympanic treatment, or vestibular rehabilitation, as documented. SSNHL with vertigo cases were coded according to systemic corticosteroid exposure, intratympanic corticosteroid exposure, combined therapy, salvage therapy, and treatment delay. VN/other peripheral vestibular injury cases were coded according to corticosteroid exposure, vestibular suppressant exposure, antiemetic use, and vestibular rehabilitation status. Treatment-exposure variables were not used to define oVEMP abnormality or oVEMP abnormality-burden grade.
At the 4-week follow-up window, residual dizziness was reported in 40 of 110 patients (36.4%). The residual dizziness rate was similar across diagnostic groups: 37.1% in MD, 37.5% in BPPV, 35.7% in SSNHL with vertigo, and 33.3% in VN/other peripheral vestibular injury (P = 0.993). However, residual dizziness was more frequent among patients with abnormal oVEMP responses than among those with normal oVEMP responses. Residual dizziness was present in 33 of 69 patients with abnormal oVEMP findings and in 7 of 41 patients with normal oVEMP findings.
DHI scores decreased from baseline to 4 weeks in the overall cohort. The mean score decreased from 50.9 ± 14.4 at baseline to 35.1 ± 16.9 at follow-up, corresponding to a mean reduction of 15.8 ± 8.8 points. Improvement was observed across all four diagnostic groups, although patients with SSNHL with vertigo and VN/other peripheral vestibular injury had higher follow-up DHI scores than those with BPPV. The 4-week clinical outcomes and their relationship with oVEMP abnormality are summarized in Table 5.
Association between oVEMP abnormalities and residual dizziness
In unadjusted logistic regression, abnormal oVEMP response was associated with a higher likelihood of residual dizziness at 4 weeks (odds ratio, 4.45; 95% confidence interval, 1.74–11.41; P = 0.002). IAAR ≥35% was also associated with residual dizziness (odds ratio, 4.98; 95% confidence interval, 2.16–11.51; P < 0.001). The oVEMP abnormality-burden grade showed an ordinal association with residual dizziness, with each one-grade increase associated with higher odds of residual dizziness (odds ratio, 1.70; 95% confidence interval, 1.16–2.47; P = 0.006).
After adjustment for age, sex, and diagnosis, abnormal oVEMP response remained associated with residual dizziness (adjusted odds ratio, 5.99; 95% confidence interval, 2.12–16.91; P < 0.001). IAAR ≥35% also remained associated with residual dizziness after adjustment (adjusted odds ratio, 6.66; 95% confidence interval, 2.60–17.08; P < 0.001). In contrast, elevated or absent-threshold response and 1,000 Hz-dominant frequency shift were not independently associated with residual dizziness after adjustment. The adjusted association between the oVEMP abnormality-burden grade and residual dizziness is illustrated in Figure 5. Because 40 residual-dizziness events were available, the prespecified reduced adjustment set (age, sex, and diagnosis) was used for the primary adjusted analyses to limit overfitting and unstable estimates.
Sensitivity analysis excluding the heterogeneous VN/other composite group
Because the VN/other peripheral vestibular injury group was small (n = 15) and diagnostically heterogeneous, an additional analysis was restricted to MD, BPPV, and SSNHL with vertigo (n = 95). In this restricted cohort, the between-group difference in overall protocol-defined oVEMP abnormality was not statistically significant (Monte Carlo exact P = 0.200). The response-pattern distribution (Monte Carlo exact P = 0.345) and abnormality-burden grade distribution (Monte Carlo exact P = 0.258) were also not significantly different among these three groups. These sensitivity findings indicate that the stronger four-group separation of response patterns and ordinal grades was substantially influenced by the small, heterogeneous VN/other composite group and should therefore be interpreted with caution.
DATA AVAILABILITY:
The dataset for this work has been uploaded to https://doi.org/10.6084/m9.figshare.33244404.v1 “Ocular Vestibular Evoked Myogenic Potential Response Patterns for Characterizing Vestibular Dysfunction in Peripheral Vestibular Disorders.”
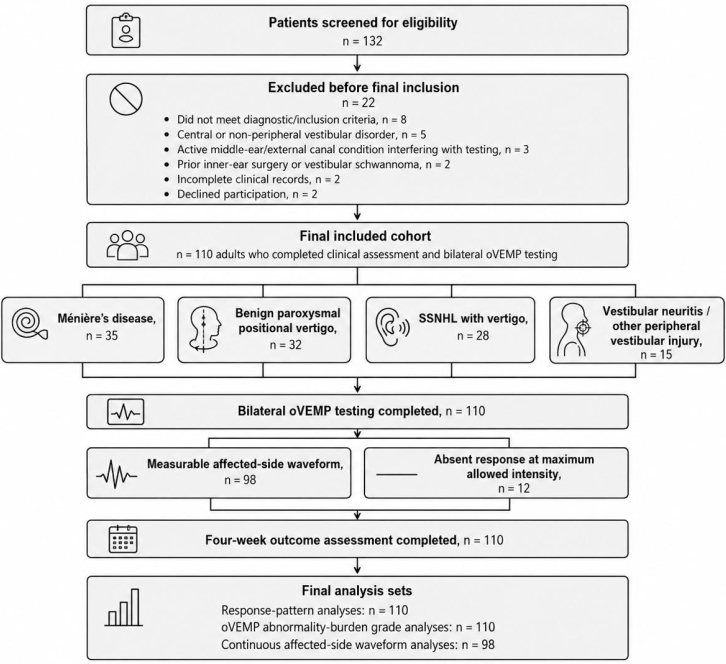
Figure 1: Study design, participant screening, and analysis workflow. The workflow summarizes eligibility assessment, diagnostic grouping, bilateral oVEMP testing, waveform quality control, parameter extraction, oVEMP abnormality-burden grading, 4-week follow-up, and final statistical analysis. A total of 132 patients were screened, and 22 were excluded before final inclusion (8 did not meet diagnostic/inclusion criteria, 5 had a central or non-peripheral vestibular disorder, 3 had an active middle-ear/external-canal condition interfering with testing, 2 had previous inner-ear surgery or vestibular schwannoma, 2 had incomplete clinical records, and 2 declined participation). The final analytic cohort comprised 110 patients: 35 with MD, 32 with BPPV, 28 with SSHL, and 15 with VN or other peripheral vestibular injury. All 110 patients completed bilateral oVEMP testing and the 4-week outcome assessment. Measurable affected-side N10-P15 waveforms were available in 98 patients, while 12 patients had absent responses at the maximum allowed stimulus intensity. Response-pattern and abnormality-burden grade analyses included all 110 patients; continuous affected-side waveform analyses used the 98 patients with measurable waveforms. Abbreviation: oVEMP = ocular vestibular evoked myogenic potential. Please click here to view a larger version of this figure.
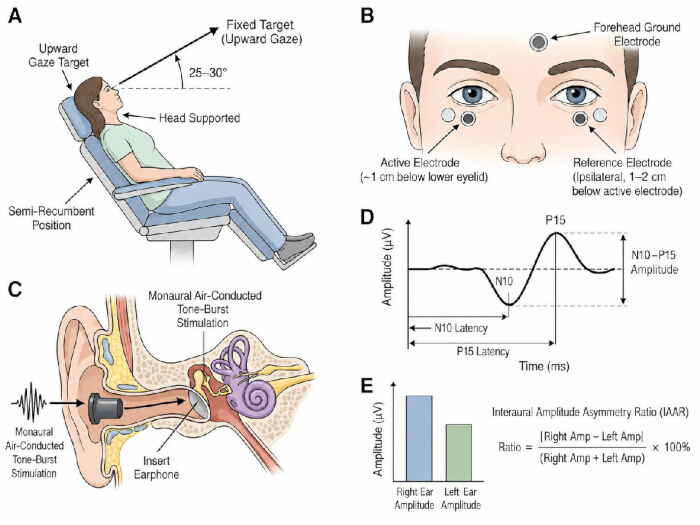
Figure 2: Ocular vestibular evoked myogenic potential recording setup, acoustic stimulation, and waveform interpretation. The schematic illustrates patient positioning, upward-gaze fixation, electrode placement below the lower eyelids, monaural air-conducted tone-burst stimulation, bilateral extraocular myogenic recording, and identification of the N10-P15 waveform complex. (D) N10 is the first negative peak, and P15 is the subsequent positive peak; N10 and P15 latencies are measured from stimulus onset to their respective peaks, and N10–P15 amplitude is measured as the peak-to-peak voltage difference between the oppositely directed peaks. (E) Calculation of the interaural amplitude asymmetry ratio. Please click here to view a larger version of this figure.
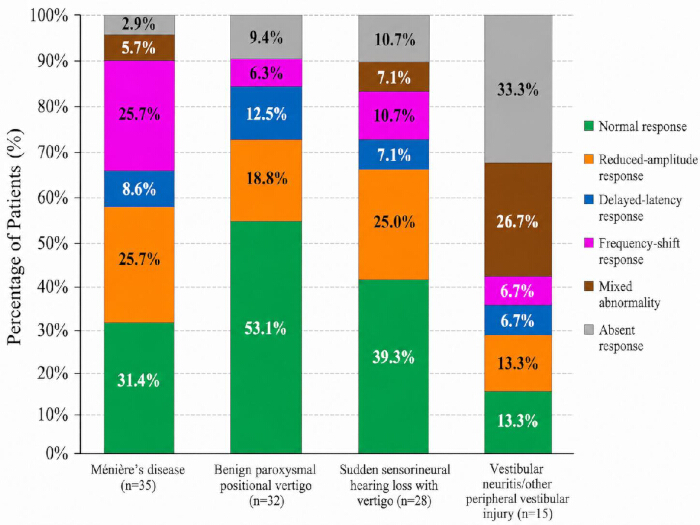
Figure 3: Distribution of ocular vestibular evoked myogenic potential response patterns across diagnostic groups. The stacked bar chart shows the mutually exclusive proportions of normal response, reduced-amplitude response, delayed-latency response, frequency-shift response, mixed abnormality, and absent response in each analytical group. The response-pattern distribution differed across the four groups (Monte Carlo exact P = 0.007). Ménière's disease showed more frequency-shift patterns, whereas the small heterogeneous VN/other peripheral vestibular injury composite group showed more absent or mixed responses. When more than one non-absence abnormal feature was present, the case was assigned to the mixed category; absent response took precedence. The fourth-group comparison is descriptive and is not intended as a vestibular-neuritis-specific estimate. Please click here to view a larger version of this figure.
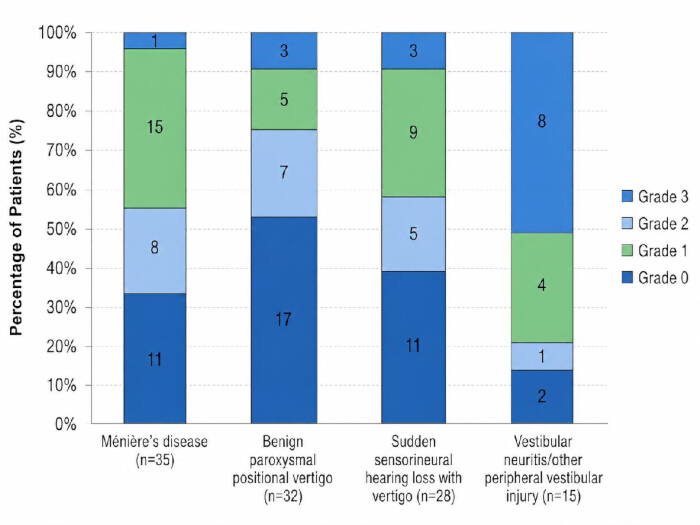
Figure 4: Ocular vestibular evoked myogenic potential abnormality-burden grades across diagnostic groups. The stacked bar chart shows the distribution of study-specific oVEMP abnormality-burden grades 0–3 according to the pre-specified composite classification. Grade 0 findings were more frequent in BPPV, whereas Grade 3 findings were more frequent in the small heterogeneous vestibular neuritis/other peripheral vestibular injury composite group. The ordinal categories are an exploratory summary of the protocol-defined burden of oVEMP abnormalities and should not be interpreted as a validated diagnostic staging system. Abbreviation: oVEMP = ocular vestibular evoked myogenic potential. Please click here to view a larger version of this figure.
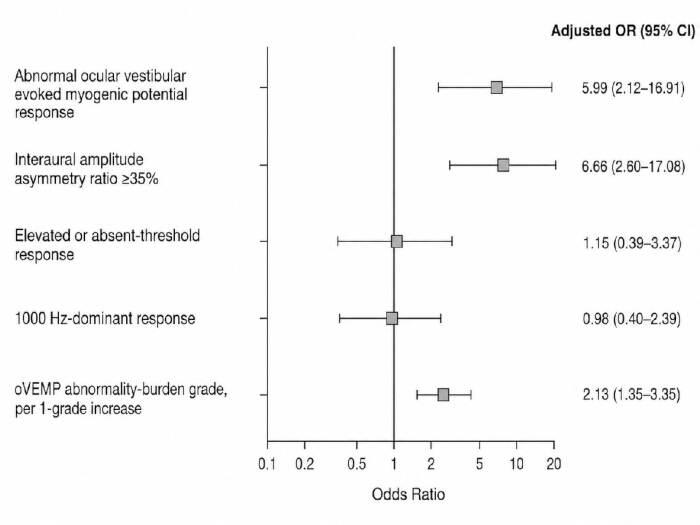
Figure 5: Adjusted association between ocular vestibular evoked myogenic potential abnormalities and residual dizziness at 4 weeks. The forest plot presents adjusted odds ratios and 95% confidence intervals for the association between oVEMP-related variables and residual dizziness at 4 weeks. Adjusted models included age, sex, and diagnostic group. Abnormal oVEMP response, interaural amplitude asymmetry ratio ≥ 35%, and higher oVEMP abnormality-burden grade were associated with a higher likelihood of residual dizziness, whereas elevated or absent-threshold response and 1,000 Hz-dominant response were not independently associated with residual dizziness. Abbreviation: oVEMP = ocular vestibular evoked myogenic potential. Please click here to view a larger version of this figure.
Table 1: Ocular vestibular evoked myogenic potential parameter definitions, measurement rules, and abnormality thresholds. This table defines the protocol-specified oVEMP parameters, including waveform presence, N10 latency, P15 latency, N10–P15 amplitude, response threshold, interaural amplitude asymmetry ratio, 500 Hz amplitude, 1,000 Hz amplitude, and 1,000/500 Hz amplitude ratio. The listed normal/acceptable ranges are the local laboratory operational reference ranges used for this recording system and protocol; they are not universal normative cutoffs and should be recalibrated for other devices, age distributions, gaze conditions, or stimulation methods. The table also provides the abnormality thresholds, borderline rules, and technical reliability criteria used before statistical analysis. Abbreviations: oVEMP = ocular vestibular evoked myogenic potential; IAAR = interaural amplitude asymmetry ratio. Please click here to download this file.
Table 2: Ocular vestibular evoked myogenic potential response patterns and abnormality-burden grading. This table summarizes the prespecified oVEMP response categories and the study-specific composite abnormality burden grades used to ensure consistent interpretation across examiners. The grade was constructed by ordering preserved single-parameter abnormality, preserved multi-parameter/marked-asymmetry abnormality, and absent or severe combined responses into mutually exclusive hierarchical categories. Response threshold > 95 dB nHL and frequency-tuning patterns are reported as response descriptors and do not, by themselves, define binary oVEMP abnormality. The grading framework is exploratory, is not an externally validated diagnostic staging system, and requires independent validation before clinical use as a severity scale. Abbreviations: oVEMP = ocular vestibular evoked myogenic potential; IAAR = interaural amplitude asymmetry ratio. Please click here to download this file.
Table 3: Baseline demographic and clinical characteristics by diagnostic group. This table presents the baseline characteristics of patients with MD, BPPV, SSHL, and VN or other peripheral vestibular injury. Continuous variables are reported as mean ± standard deviation, and categorical variables are reported as n (%). Between-group comparisons were performed using appropriate parametric or non-parametric tests for continuous variables and chi-square or Fisher’s exact tests for categorical variables. Abbreviations: MD = Ménière's disease; BPPV = benign paroxysmal positional vertigo; SSNHL = sudden sensorineural hearing loss; VN = vestibular neuritis; DHI = Dizziness Handicap Inventory; VAS = visual analog scale. Please click here to download this file.
Table 4: Affected-side ocular vestibular evoked myogenic potential parameters and between-group comparisons. This table presents affected-side oVEMP waveform parameters and supportive vestibular-function measures across diagnostic groups. Continuous waveform parameters were summarized among patients with measurable affected-side waveforms (MD n = 34; BPPV n = 29; SSNHL with vertigo n = 25; VN/other n = 10). A response threshold > 95 dB nHL was analyzed as a separate functional descriptor and did not independently define a binary abnormal oVEMP. Variables include measurable waveform rate, abnormal oVEMP rate, N10 latency, P15 latency, 500 Hz amplitude, 1,000 Hz amplitude, 1,000/500 Hz amplitude ratio, interaural amplitude asymmetry ratio, elevated or absent-threshold response, caloric weakness, and horizontal video head impulse test gain. Abbreviations are defined in the table footnote. IAAR and frequency-ratio denominators may be smaller when bilateral or 500-Hz responses were unavailable. Abbreviations: oVEMP = ocular vestibular evoked myogenic potential; IAAR = interaural amplitude asymmetry ratio; MD = Ménière's disease; BPPV = benign paroxysmal positional vertigo; SSNHL = sudden sensorineural hearing loss; VN = vestibular neuritis; DHI = Dizziness Handicap Inventory; VAS = visual analog scale. Please click here to download this file.
Table 5: Four-week clinical outcomes and associations between oVEMP abnormalities and residual dizziness. This table summarizes 4-week clinical outcomes and logistic-regression associations with residual dizziness. The table presents follow-up Dizziness Handicap Inventory scores, Dizziness Handicap Inventory score reduction, and residual dizziness by diagnostic group. Also shown are unadjusted and adjusted odds ratios, along with 95% confidence intervals, for oVEMP-related predictors of residual dizziness at 4 weeks. Adjusted models included age, sex, and diagnostic group. Abbreviations: oVEMP = ocular vestibular evoked myogenic potential; OR = odds ratio; CI = confidence interval; IAAR = interaural amplitude asymmetry ratio. Please click here to download this file.
Supplementary Table S1: Diagnosis-specific clinical treatment-exposure coding dictionary. This supplementary table provides the coding structure for real-world treatment exposure by diagnostic group. Treatment variables were recorded only as clinical exposure variables and were not assigned by the study protocol. The table includes canalith repositioning procedures, vestibular suppressant exposure, Ménière’s disease maintenance therapy, corticosteroid exposure in sudden sensorineural hearing loss with vertigo, vestibular neuritis treatment exposure, treatment delay, and vestibular rehabilitation categories. Please click here to download this file.
Supplementary Table S2: Variable coding, missing-data rules, quality-control boundaries, and statistical-analysis definitions. This supplementary table provides the variable-coding structure, missing-data handling rules, technical reliability criteria, sensitivity-analysis definitions, and statistical-analysis boundaries used in the study. It specifies how absent responses, technically unreliable traces, borderline interaural amplitude asymmetry, missing waveform values, follow-up windows, and logistic-regression event rules were handled. Please click here to download this file.
Discussion
This study applied a structured ocular-vestibular evoked myogenic potential (oVEMP) response-pattern approach to characterize vestibular system involvement across common peripheral vestibular disorders. The principal descriptive findings were a higher 1,000/500 Hz amplitude ratio in MD; mixed oVEMP abnormalities in SSHL; a substantial proportion of normal responses in BPPV; and more absent/higher-grade findings in the small, heterogeneous VN/other peripheral vestibular injury composite group. Importantly, sensitivity analyses restricted to MD, BPPV, and SSNHL with vertigo did not show statistically significant between-group differences in overall abnormality, response-pattern distribution, or abnormality-burden grade distribution. Therefore, the apparent four-group pattern separation was substantially influenced by the small, heterogeneous fourth group and should not be generalized as a stable, disease-specific signature. The higher 1,000/500 Hz amplitude ratio in Ménière’s disease remains consistent with the concept that inter-frequency amplitude ratio may capture altered VEMP tuning in endolymphatic hydrops rather than only response loss18.
The results also illustrate the potential value and the limits of moving beyond a binary normal/abnormal interpretation. Reduced amplitude, absent response, frequency-tuning shift, delayed latency, and marked asymmetry are distinct electrophysiological features, but combining them into an ordinal score does not, by itself, validate a clinical severity scale. The present study-specific abnormality-burden grade was therefore used as an exploratory composite descriptor rather than as a diagnostic classifier. No independent gold-standard label for the severity of vestibular dysfunction was available, so sensitivity, specificity, and ROC analyses would have required a circular reference standard and were therefore not used to claim diagnostic accuracy. In BPPV, previous clinical studies have reported inconsistent VEMP differences compared with healthy controls, suggesting that otolithic dysfunction may exist in only part of the population rather than defining the disease itself19,20. The present findings are compatible with that interpretation and support the use of oVEMP as an adjunctive functional measure rather than a replacement for disease-specific diagnostic testing.
The findings in SSHL and the heterogeneous VN/other peripheral vestibular injury composite group further illustrate the value of describing waveform patterns rather than relying only on a binary result. Sudden sensorineural hearing loss can involve both cochlear and vestibular structures, and vestibular test abnormalities have been associated with more extensive inner-ear involvement and less favorable clinical recovery in previous studies21. Other work has also suggested that VEMP abnormalities may carry prognostic information in unilateral idiopathic sudden sensorineural hearing loss, especially when otolithic or semicircular canal dysfunction is present22. In the present study, SSNHL with vertigo showed mixed oVEMP abnormalities rather than a single dominant pattern, which fits the clinical heterogeneity of this condition. The VN/other composite group showed the highest proportion of Grade 3 findings, primarily due to absent responses or combined abnormalities; however, because this analytical category encompasses diagnostically distinct conditions, it cannot support a VN-specific inference. The observation remains compatible with the known role of oVEMP in assessing utricular and superior vestibular nerve pathway involvement in VN, where differential cervical and ocular VEMP findings may help localize the affected vestibular division23.
The results showed that structured oVEMP response patterns provided functional information that was not captured by the diagnostic label alone, but the magnitude of between-group differences depended on the analytical grouping. MD showed a higher 1,000/500 Hz amplitude ratio, supporting a disease-contextual frequency-tuning shift. The small heterogeneous VN/other peripheral vestibular injury composite group showed more frequent absent responses and Grade 3 findings; however, sensitivity analyses excluding this group attenuated the overall differences in response pattern and abnormality burden grade among the remaining three diagnostic groups. SSNHL with vertigo showed mixed oVEMP patterns, while BPPV retained a substantial proportion of normal responses.
The binary oVEMP abnormality rate alone provided only borderline separation among the four groups, and the exploratory ordinal abnormality-burden grade should not be interpreted as a validated severity scale. Abnormal oVEMP response, marked IAAR, and higher ordinal grade were associated with residual dizziness at 4 weeks, but these observational associations do not establish causality or diagnostic accuracy. The findings support further evaluation of structured oVEMP response-pattern analysis and justify external validation of the proposed composite grade in larger, diagnostically homogeneous cohorts.
The association between oVEMP abnormality and residual dizziness at 4 weeks should also be interpreted cautiously. The study was observational and cannot establish that oVEMP abnormalities cause persistent symptoms. Abnormal oVEMP response, marked interaural amplitude asymmetry, and higher exploratory grades were associated with residual dizziness, whereas diagnosis alone did not separate residual-dizziness rates well across groups. These findings suggest a possible relationship between the burden of electrophysiological abnormalities and short-term symptom persistence, but they do not establish individual-level predictive performance. Similar reasoning has been raised in sudden hearing loss research, where vestibular evoked myogenic potential findings have been examined as indicators of functional prognosis24,25,26. Larger prospective studies with prespecified prediction models, calibration assessment, and independent validation are needed before oVEMP grading can be used for clinical risk prediction or rehabilitation triage.
Several limitations should be acknowledged. First, the study was conducted at a single center with 110 patients; the diagnostic groups were unequal in size, and no a priori power calculation determined enrollment. The sample-size sensitivity calculation indicated approximately 80% power only for a Cohen’s w of about 0.38 in the four-group × four-grade comparison; smaller effects and subgroup contrasts may therefore have been missed. Second, the VN/other peripheral vestibular injury group contained only 15 patients and combined diagnostically distinct conditions; therefore, all findings for this composite group are descriptive. The restricted three-group sensitivity analysis showed that response-pattern and grade differences were no longer statistically significant after this group was excluded, underscoring that the four-group comparisons should be considered exploratory. Third, the proposed abnormality-burden grade is a study-specific composite descriptor and has no independent gold-standard severity reference; consequently, this study does not establish sensitivity, specificity, ROC performance, or diagnostic validity for the grade. Fourth, the operational oVEMP thresholds were based on published guidance and local laboratory practice and are device-, stimulus-, gaze-, age-, and laboratory-dependent rather than universal normative cutoffs. Fifth, oVEMP responses depend on stable upward gaze and extraocular muscle activation. Although severe ocular movement limitation was excluded, the protocol did not include a dedicated ophthalmologic characterization of subtler visual or oculomotor conditions. oVEMP differences have been reported in amblyopia, illustrating that ocular conditions can influence measured responses. Neurological disorders may also alter vestibulo-ocular reflex pathways; abnormalities of the vestibulo-ocular reflex have been described in multiple sclerosis, even in the absence of optic neuritis. Although known demyelinating diseases and major central neurological causes were excluded, subclinical neurological influences cannot be completely ruled out. Finally, treatment exposure was observational, the 4-week follow-up captured only short-term residual dizziness, and the single-center thresholds and grading rules require prospective external validation.
Déclarations de divulgation
The author has no conflicts of interest to declare.
Remerciements
The author thanks the patients and clinical staff involved in assessing peripheral vestibular disorders for their support of this study. The author also acknowledges the ENT Outpatient Clinic, Qinhuai Medical District, General Hospital of Eastern Theater Command, for providing the clinical setting for this work.
Matériaux
| Nom | Entreprise | Numéro de catalogue | Commentaires |
|---|---|---|---|
| Caloric irrigation system | Interacoustics | Air Fx | Used, when clinically available, to measure caloric weakness as a supportive vestibular-function variable. Not used to define oVEMP abnormality or abnormality-burden grade. |
| Clinical audiometer | Interacoustics | AC40 | Used for pure-tone audiometry. |
| Disposable surface electrodes | Ambu | BlueSensor | Disposable Ag/AgCl electrodes used for oVEMP recording (active, reference, and ground electrodes). |
| Evoked-potential recording system with VEMP module | Interacoustics | Eclipse EP15/EP25 | Used for all oVEMP recordings. Delivered air-conducted tone-burst stimuli up to 105 dB nHL. Acoustic output was calibrated every 6 months and after equipment maintenance. |
| GraphPad Prism | GraphPad Software | Version 10.2.2 | Used for figure preparation and graphical presentation of results. |
| IBM SPSS Statistics | IBM Corp. | Version 29.0.2.0 | Used for primary statistical analyses. |
| Insert earphones | Interacoustics | EARtone 3A | Used for monaural air-conducted tone-burst stimulation during oVEMP testing. |
| R | R Foundation for Statistical Computing | Version 4.4.1 | Used for sensitivity analyses and verification of plotted values. |
| Tympanometer | Interacoustics | Titan | Used when middle-ear dysfunction was clinically suspected. |
| Video head impulse test system | Interacoustics | EyeSeeCam vHIT | Used, when clinically available, to record horizontal vHIT gain as a supportive vestibular-function variable. Not used to define oVEMP abnormality or abnormality-burden grade. |
| Video nystagmography system | Interacoustics | VisualEyes 525 | Used, when clinically available, to document spontaneous, gaze-evoked, and positional nystagmus. |
Références
- Murofushi T. Clinical application of vestibular evoked myogenic potential (VEMP). Auris Nasus Larynx. 2016;43(4):367-76.
- Kantner C, Gürkov R. Characteristics and clinical applications of ocular vestibular evoked myogenic potentials. Hear Res. 2012;294(1-2):55-63.
- Colebatch JG, Rosengren SM, Welgampola MS. Vestibular-evoked myogenic potentials. Handb Clin Neurol. 2016;137:133-55.
- Basura GJ, et al. Clinical practice guideline: Ménière’s disease. Otolaryngol Head Neck Surg. 2020;162(2 Suppl):S1-55.
- Singh NK, Barman A. Frequency-amplitude ratio of ocular vestibular-evoked myogenic potentials for detecting Meniere’s disease: a preliminary investigation. Ear Hear. 2016;37(3):365-73.
- Bhattacharyya N, et al. Clinical practice guideline: benign paroxysmal positional vertigo (update). Otolaryngol Head Neck Surg. 2017;156(3 Suppl):S1-47.
- Chen G, et al. Ocular vs. cervical vestibular evoked myogenic potentials in benign paroxysmal positional vertigo: a systematic review and meta-analysis. Front Neurol. 2020;11:596454.
- Yu H, Li H. Vestibular dysfunctions in sudden sensorineural hearing loss: a systematic review and meta-analysis. Front Neurol. 2018;9:45.
- Manzari L, Tedesco A, Burgess AM, Curthoys IS. Ocular vestibular-evoked myogenic potentials to bone-conducted vibration in superior vestibular neuritis show utricular function. Otolaryngol Head Neck Surg. 2010;143(2):274-80.
- Castellucci A, et al. Vestibular assessment in sudden sensorineural hearing loss. Front Neurol. 2023;14:1127008.
- Yang TH, Young YH. Clinical usefulness of vestibular-evoked myogenic potential testing: a review. J Formos Med Assoc. 2025;124(12):1120-7.
- Lopez-Escamez JA, et al. Diagnostic criteria for Menière’s disease. J Vestib Res. 2015;25(1):1-7.
- von Brevern M, et al. Benign paroxysmal positional vertigo: diagnostic criteria. J Vestib Res. 2015;25(3-4):105-17.
- Chandrasekhar SS, et al. Clinical practice guideline: sudden hearing loss (update). Otolaryngol Head Neck Surg. 2019;161(1 Suppl):S1-45.
- Rosengren SM, et al. Vestibular evoked myogenic potentials in practice: methods, pitfalls and clinical applications. Clin Neurophysiol Pract. 2019;4:47-68.
- Fife TD, et al. Practice guideline: cervical and ocular vestibular evoked myogenic potential testing. Neurology. 2017;89(22):2288-96.
- Rauch SD, et al. Oral vs intratympanic corticosteroid therapy for idiopathic sudden sensorineural hearing loss: a randomized trial. JAMA. 2011;305(20):2071-9.
- Singh NK, et al. Utility of inter-frequency amplitude ratio of vestibular-evoked myogenic potentials in identifying Meniere’s disease: a systematic review and meta-analysis. Ear Hear. 2023;44(5):940-8.
- Drabkin S, et al. Assessment of the inter-frequency amplitude ratio (1,000/500 Hz) in cVEMP and oVEMP for the diagnosis of Ménière’s disease. Audiol Res. 2024;14(6):1126-35.
- Rosa MS, et al. Clinical and prognostic implications of cervical and ocular vestibular evoked myogenic potentials (cVEMP and oVEMP) in benign paroxysmal positional vertigo (BPPV): a prospective study. Audiol Res. 2023;13(5):700-9.
- Guan R, Zhao Z, Guo X, Sun J. The semicircular canal function tests contribute to identifying unilateral idiopathic sudden sensorineural hearing loss with vertigo. Am J Otolaryngol. 2020;41(3):102461.
- Liang M, et al. Vestibular evoked myogenic potential may predict the hearing recovery in patients with unilateral idiopathic sudden sensorineural hearing loss. Front Neurol. 2022;13:1017608.
- Piatti D, et al. Vestibular evoked myogenic potentials to diagnose vestibular neuritis: a scoping review. Laryngoscope. 2026;136(4):1635-44.
- Maia NPD, Lopes KC, Ganança FF. Vestibular evoked myogenic potentials in the prognosis of sudden hearing loss: a systematic review. Braz J Otorhinolaryngol. 2020;86(2):247-54.
- Sharifi M, et al. Ocular vestibular evoked myogenic potentials in different types of amblyopia. Clin Exp Optom. 2025;108(2):191-5.
- Heravian Shandiz J, et al. Vestibulo ocular reflex in multiple sclerosis patients without any optic neuritis. J Optom. 2021;14(3):282-6.