This protocol enables the reproducible, cost-effective, and highly efficient generation of human neuromyocardial organoids containing neural crest-derived proprioceptive-biased neurons, and their application to real-time mitochondrial function monitoring and to modelling neuro-cardiac diseases, such as Friedreich's ataxia in vitro.
Article de méthode
Generation of Spontaneously Beating Neuromyocardial Organoids with Neural Crest-Derived Proprioceptive-Biased Neurons and Real-Time Respirometry
Dans cet article
Résumé
Résumé
The neural crest gives rise to diverse cell types, including the proprioceptive sensory neurons that relay limb and organ position to the central nervous system. Studying how these neurons interact with their peripheral targets in a human context has been constrained by the lack of integrated in vitro models that combine neural crest derivatives with functional effector tissue. Here, we present a protocol for generating spontaneously beating neuromyocardial organoids from human pluripotent stem cells (hPSCs), incorporating neural crest-derived proprioceptive-biased neurons. Differentiation proceeds under defined conditions that reproducibly co-specify cardiac and neural crest lineages, yielding organoids that contract rhythmically within 7–8 days and harbor proprioceptive-biased sensory neuron populations. We further describe how to integrate these organoids with continuous oxygen consumption rate (OCR) monitoring, enabling non-invasive measurement of mitochondrial respiration over days to weeks. This longitudinal readout captures dynamic shifts in respiration that are inaccessible to endpoint assays, providing a sensitive functional metric of metabolic health and stress. The combined model is broadly applicable to questions in human cardiac and neural crest development, neuromuscular and sensorimotor integration, and the metabolic basis of disease. We illustrate its utility in Friedreich's ataxia (FRDA), a mitochondrial disorder affecting both proprioceptive neurons and cardiac tissue, in which real-time OCR monitoring reveals respiratory deficits. The protocol offers a reproducible, scalable system for interrogating neural crest biology alongside cardiac function and for evaluating metabolic phenotypes and pharmacological interventions in a physiologically relevant, multi-lineage human context. Notably, the entire differentiation sequence runs on chemically defined, animal-free media, and organoids form directly in standard U-bottom 96-well plates, without ultra-low-attachment surfaces, matrix embedding, pre-coating, or orbital shaking, and each organoid is formed and maintained in 100 µL of medium, keeping reagent, consumable and equipment costs low and the workflow straightforward to adopt.
Introduction
Neural Crest Cells (NCCs) are a population of migratory multipotent cells that give rise to a variety of tissue types throughout the body. Their derivatives include components of the peripheral nervous system, such as neurons and glial cells, as well as melanocytes, endocrine and adipose cells, and a range of mesenchymal structures including cartilage, bone, connective tissue, and tendons1. NCCs derive from the neurectoderm, which, during gastrulation, is localized at the edge of the prospective neural plate1,2,3,4,5,6,7. During neurulation, the NCCs are formed within the dorsal-most part of the neuroepithelium, at the ‘neural plate border’8.
In response to inductive signals, such as Bone Morphogenetic Protein (BMP), Fibroblast Growth Factor (FGF), Wnt, and Notch signaling, expressed in a spatiotemporal manner from neighboring cell populations2,3,4,7,9,10, neural crest cells undergo an epithelial-to-mesenchymal transition, which allows them to delaminate from the neuroepithelium and to migrate8. During mammalian embryogenesis, NCC induction and emigration begin at the midbrain level and continue towards the tail, allowing NCC formation along the length of the neuraxis8. Based on their place of origin, NCCs are categorized into separate axial groups: cranial, cardiac, vagal, trunk, and sacral, each differentiating into distinct types of cell populations8.
The cardiac Neural Crest Cells (cNCCs) originate in the transitional region between the cranial and trunk NCC populations2,4. The cNCCs migrate into the developing cardiovascular system, where they contribute to the development of the arteries of the head and neck, the aortic and pulmonary myocardium of the outflow tract, and the cardiac ganglia10. Similarly, during embryogenesis, a subset of progenitor cells differentiates into trunk Neural Crest Cells (tNCCs), which primarily give rise to secretory cells of the endocrine system, pigment cells of the skin, as well as neurons and glia of the peripheral nervous system, including the Dorsal Root Ganglia (DRGs)2,8,11. The DRGs are composed of heterogeneous populations of mechanoreceptor, thermoreceptor, nociceptor, and proprioceptor neurons that transmit information related to touch, temperature, pain, movement, and spatial position, respectively8.
Their migratory nature and the cross-talk between them and neighboring cell populations render it difficult to generate and study NCCs in vitro. Here, we present an experimental protocol for the generation of NCCs in a neuromyocardial organoid (NMO) model derived from hPSCs. To demonstrate the efficiency and reproducibility of the protocol, we first apply it to an H9 human embryonic stem cell line engineered to express green fluorescent protein (GFP) under the control of the SOX10 promoter, a marker of NCCs and their subsequent glial derivatives12. SOX10 expression is switched on immediately before the epithelial-to-mesenchymal transition of tNCCs and is maintained through migration and, in many neural crest-derived lineages, even after differentiation13. The SOX10::GFP reporter therefore provides a real-time, spatiotemporal readout of neural crest specification and migration throughout organoid differentiation, allowing the efficiency of NCC generation to be visualized and confirmed directly, without endpoint fixation or staining.
A key advantage of the protocol is its low cost and simplicity. It uses chemically defined, animal-free media and standard plasticware, with no specialized coatings or attachment surfaces and no orbital shaking during organoid formation. Organoids form in an ordinary U-bottom 96-well plate, so the anti-adhesive, pre-coated or ultra-low-attachment plates and the anti-adherence coating solutions used by comparable protocols are not needed, nor is the coating, incubation and washing time they require, nor a shaker or bioreactor. The protocol yields spontaneously beating cardiomyocytes alongside neural cell populations within a single organoid in 7–8 days. The presence of both neuronal and cardiac cell types within a single organoid provides a platform for investigating cellular interactions between the nervous and cardiovascular systems, making it an ideal model for studying disorders that affect both. One such example is FRDA, a rare inherited mitochondrial disease caused by decreased levels of frataxin (FXN) protein and characterized by progressive neurodegeneration and cardiomyopathy. In FRDA, degeneration of DRG neurons contributes to peripheral sensory deficits, while cardiac pathology is associated with structural abnormalities of the ventricular wall14. The ability of the NMO model to generate both neural crest-derived sensory populations and cardiac cells offers a promising approach for investigating the disease mechanisms underlying neuro-cardiac disorders such as FRDA. In this protocol, FRDA patient-derived NMOs along with isogenic control organoids were generated and, using a real-time OCR monitoring system, the resulting metabolic phenotypes were evaluated. Mitochondrial function in the NMOs was also assessed by performing a mitochondrial stress test at the end of the differentiation protocol, which demonstrated differences in oxidative phosphorylation and respiratory capacity associated with FRDA.
Protocole
The research described in this protocol was approved by the Research Ethics and Deontology Committee of the Aristotle University of Thessaloniki (EHDE AUTh) under protocol numbers 137164/2024 and 19329/2024, for the hiPSCs and SOX10::GFP hESC lines, respectively. The protocol uses established, de-identified human pluripotent stem cell lines only. No human participants were recruited, and no primary human tissue was obtained by the authors. Written informed consent for the derivation of the donor material and for its use in research was obtained from the donors at the time of derivation, by the laboratories that established the lines15. All experiments were performed in accordance with the policies of the Aristotle University of Thessaloniki and with the relevant national and European Union legislation governing research with human pluripotent stem cells.
NOTE: The hPSC lines used in this protocol were the H9 (WA09) SOX10::GFP bacterial artificial chromosome (BAC) reporter line and an FRDA patient-derived line together with its isogenic control. The SOX10::GFP reporter line was generated and characterized previously in the H9 background12. Experiments involving the FRDA patient-derived and isogenic control lines were carried out in collaboration with the Papadopoulou laboratory (Department of Pharmacy, School of Health Sciences, Aristotle University of Thessaloniki), which holds the Material Transfer Agreement for these lines with the Friedreich's Ataxia Cell Line Repository (Napierala Laboratory, UT Southwestern, established in collaboration with the Friedreich's Ataxia Research Alliance, FARA). The FRDA line used here is the F4676 iPSC line, clone #2, derived from a male donor and reported to carry 867 GAA repeats in both alleles. The derivation of these lines, donor consent, and the corresponding ethical and biosafety approvals have been described previously15.
CAUTION: All procedures need to be performed in accordance with institutional laboratory safety and biosafety requirements. Before use, consult the manufacturer’s safety data sheet (SDS) for all reagents and use appropriate personal protective equipment. Dispose of chemical and biological waste according to institutional and local regulations.
The details of all the reagents and the equipment used are listed in the Table of Materials.
1. Differentiation protocol
- Cell culture
CAUTION: Handle all human-derived cell lines and associated culture materials in accordance with institutional biosafety procedures and applicable regulations. Use appropriate personal protective equipment and containment procedures.- Seed hPSCs at a concentration of 30–60 x 103 cells/mL (depending on the specific cell line) in one well of a basement membrane matrix-coated 12-well plate.
- Expand hPSCs for 4 days in xeno-free maintenance medium, with 80% of the medium changed daily.
- On day 4, confirm that the hPSCs have formed compact, discrete colonies with smooth edges and have reached 80% confluency. At this point, they are ready for the differentiation experiment.
NOTE: Before initiating differentiation, hPSC cultures should exhibit healthy stem-cell-like morphology. hPSCs should form compact, discrete colonies with smooth and well-defined edges and should exhibit minimal spontaneous differentiation. Cultures that do not display these characteristics should not be used to initiate the differentiation protocol. Perform alkaline phosphatase staining to verify the pluripotent state. Undifferentiated cells should exhibit high alkaline phosphatase activity. Cell line identity and status should also be documented before differentiation: confirm the identity of each line e.g. by short tandem repeat (STR) profiling against the reference profile supplied by the provider, confirm a normal karyotype, and confirm that cultures are free of mycoplasma. Pluripotency can be verified further by immunostaining or flow cytometry for OCT4, NANOG, and SSEA-4. After thawing, passage the cells at least twice with the cell detachment solution before initiating differentiation, and use them for no more than 10 consecutive passages thereafter. In the experiments described here, the lines were used at overall passage numbers between 25 and 90; the limit of 10 consecutive passages refers to passages after each thaw.
- Stem cell detachment
- In a microcentrifuge tube, prepare 0.5 mL of a 1:1 mixture of a cell detachment solution and D-PBS, and pre-warm it to 37 °C.
- Remove the spent medium from the well and add the cell detachment solution: D-PBS mixture.
- Place the plate in the incubator (37 °C) for 5 min.
- At the same time, prepare 5 mL of DMEM/F12 containing 2 µM ROCK inhibitor (Thiazovivin) in a 15-mL conical centrifuge tube.
- Once the 5 min have elapsed, remove the plate from the incubator. Gently pipette the cells 2–3 times before transferring them to the DMEM/F12 + ROCK inhibitor solution. Then, gently pipette again 5–7 times.
- Centrifuge at 200 x g for 3 min.
- Discard the supernatant and resuspend the cells in 0.5 mL of DMEM/F12 with 2 µM ROCK inhibitor.
- Stem cell counting and seeding
- Count the cells in a hemocytometer.
- Prepare a solution of 30–60 x 103 cells/mL in 1 mL of xeno-free maintenance medium with 2 µM ROCK inhibitor. Seed 1 mL of this suspension per well, corresponding to 3 x 10⁴–6 x 10⁴ cells per well of a 12-well plate.
- In one well of a basement membrane matrix-coated 12-well plate, aspirate the basement membrane matrix solution and add the prepared cell solution.
- Shake gently to distribute the cell suspension evenly across the well.
- Place the plate back in the incubator (37 °C, 5% CO2) and maintain the culture for future experiments.
- Prepare a solution of 30–60 x 103 cells/mL in differentiation medium I and add ice-cold 3D suspension supplement at a 1:1000 dilution.
NOTE: The seeding concentrations described were established through titration experiments using the pluripotent stem cell lines routinely cultured in our laboratory. When applying the protocol to a different stem cell line, these concentrations may require re-optimization. In these experiments, where 60 x 103 cells/mL were seeded, the organoids’ diameter should reach approximately 0.6 mm on day 2 of differentiation. Because each well receives the same volume of medium, and therefore the same amount of morphogen, the number of cells seeded determines the morphogen-to-cell ratio and thus the effective strength of the inductive signal that each cell receives. Seeding too few cells raises this ratio and yields organoids smaller than this at day 2, whereas seeding too many lowers it and yields larger organoids. In either case the cardiac and neural crest lineages are specified under an inappropriate morphogen dose, and the cultures become heterogeneous in size and morphology with progressively increasing cell death; the practical readout of a failed differentiation is the loss of spontaneously contracting regions at the end of the protocol. - From this solution, seed 100 µL per well in a 96-well plate (non-treated, U-bottom), corresponding to 3–6 x 10³ cells per well.
NOTE: Standard polystyrene U-bottom 96-well plates with a non-tissue-culture-treated surface (sold by suppliers as a suspension surface; maximum working volume 310 µL) are used in place of ultra-low-attachment or anti-adherence-coated plates. Under these conditions the cells reproducibly coalesce into a single spheroid per well without attaching to the plastic, the plate geometry is compatible with the sensing lid of the real-time OCR monitoring system, and both the consumable cost and the hands-on time per organoid are lower: no anti-adhesive surface, coating solution or basement membrane matrix is purchased, the coating, incubation and washing steps those solutions require are avoided, no orbital shaker or bioreactor is needed, and each organoid is formed and maintained in 100 µL of medium. Ultra-low-attachment plates may be substituted but are not required here. - Centrifuge plate at 200 x g for 3 min, so that all the cells form a pellet in the center of the well.
- Place the plate in the incubator (37 °C, 5% CO2), and leave for 48 h.
- Differentiation
- On day 2 of the differentiation protocol (48 h after seeding), confirm that a single spheroid has formed in each well.
- Carefully remove all the medium from each well, using a 100 µL pipette, taking care not to disturb the spheroid.
- Wash each well with 100 µL of D-PBS to ensure that no differentiation medium I is left behind.
- Prepare differentiation medium II by mixing the differentiation medium II supplement and the differentiation medium II diluent at a ratio of 1:1. For example, for a full 96-well plate, mix 4.8 mL of differentiation medium II supplement and 4.8 mL of differentiation medium II diluent for a total volume of 9.6 mL differentiation medium II.
- Remove the D-PBS from the wells and add 100 µL of the prepared differentiation medium II to each well.
- Place the plate back in the incubator.
- On day 3, remove 50 µL of medium from each well, and add 50 µL of fresh differentiation medium II supplement (without any prior dilution with the diluent).
- Place the plate back in the incubator.
- On day 4 (96 h after seeding), the organoids begin to polarize. Remove the spent medium again and wash each well with 100 µL of D-PBS.
- Remove the D-PBS and add 100 µL of differentiation medium III to each well.
- Place the plate back in the incubator.
- On day 7, remove 80% of the spent medium in each well and replenish it with 80 µL of fresh differentiation medium III.
- On day 9, remove all the spent medium from each well and add 100 µL of basal maintenance medium to each well. Change the medium every 2–3 days to maintain organoid health.
NOTE: The timing of the media transitions is dictated by the sequence of signaling events that co-specify the cardiac and neural crest lineages. Each differentiation medium supplies a distinct combination of morphogens, and differentiation depends on activating and subsequently withdrawing these pathways within defined windows, as occurs during embryonic development. Specifically, differentiation medium I activates the WNT/β-catenin pathway, which is maintained from day 0 to day 2 of the differentiation protocol. On day 2, differentiation medium I is replaced by differentiation medium II, resulting in a suppression of the WNT/β-catenin pathway and the promotion of ERK/MAPK and PI3K/AKT/mTOR pathways. These signaling pathways are maintained until day 4, when differentiation medium II is replaced by differentiation medium III. The latter maintains ERK/MAPK and PI3K/AKT signaling, while additionally promoting VEGFR-mediated signaling. The intervals given above keep the cells in each signaling environment for the appropriate period, while the scheduled medium replacements replenish the morphogens and maintain a consistent signaling environment. Deviating from these intervals may reduce the efficiency and the reproducibility of co-specification.
2. OCR measurement using the real-time OCR monitoring system
- OCR measurement throughout differentiation
- Before beginning the experiment, incubate the sensing lid on a D-PBS plate in the cell culture incubator (37 °C, 5% CO2) for at least 1 h, since O2 measurements are temperature- and humidity-dependent.
- Set up the experiment on the OCR monitoring software platform.
- To enable OCR measurements throughout organoid development, repeat the differentiation protocol, as described above, and plate the cells in columns 3, 4, 9 and 10 of a 96-well plate on day 0. Fill any empty wells with D-PBS to slow down the rate of evaporation.
- Carefully position the 32-sensor sensing lid over the 96-well plate and into the cell culture incubator (37 °C, 5% CO2).
- Place the oxygen consumption reader on top of the magnetic sensing lid to initiate monitoring and start the experiment on the OCR monitoring software platform. O2 measurements are tracked immediately, while OCR measurements need approximately 2 h to start being recorded. No separate user calibration of the sensors is required; this interval is the time needed for the system to establish a stable oxygen gradient and to compute OCR.
- Over the following days, proceed with the protocol as described. During medium changes, keep the sensing lid in the incubator, on a D-PBS-filled 96-well plate. Track OCR changes throughout the differentiation in real time on the OCR monitoring software platform.
- Mitochondrial Stress Test (MST) using the real-time OCR monitoring system
- Prepare 1,000x stock solutions for each modulator used in the MST. Prepare oligomycin (ATP synthase/Complex V inhibitor) in DMSO at 2 mM, BAM15 (mitochondrial uncoupling agent) in DMSO at 2.5 mM, and a combined rotenone/antimycin A stock solution in DMSO containing 2 mM of each inhibitor (Complex I and Complex III inhibitors, respectively).
CAUTION: Oligomycin, BAM15, rotenone, and antimycin A are hazardous mitochondrial toxins, and DMSO promotes dermal absorption of dissolved compounds; handle with appropriate personal protective equipment and avoid skin contact.
NOTE: The three modulators resolve distinct components of respiration: oligomycin reports ATP-linked respiration and proton leak, BAM15 reports maximal respiration and spare respiratory capacity, and rotenone/antimycin A reports non-mitochondrial oxygen consumption. BAM15 is used in place of the classical protonophore FCCP because it uncouples mitochondria effectively without substantially depolarizing the plasma membrane and shows less off-target cytotoxicity over a broad concentration range. The working concentrations used here were established by titration in mature organoids and are the lowest concentrations that produced a robust and reproducible OCR response. - The day before the MST, replace the spent medium in each well with fresh basal maintenance medium and return the plate to the incubator with the sensing lid in place, so that OCR continues to be recorded overnight. OCR stabilizes within 16–24 h, and any value within the stabilized window can be used as the baseline OCR of each organoid.
- On the day of the assay, prepare 4x working solutions by diluting the 1,000x stocks in basal maintenance medium. For oligomycin and BAM15, add 4 µL of the corresponding 1,000x stock to 996 µL basal maintenance medium. For the rotenone/antimycin A mixture, add 4 µL of the combined 1,000x stock to 996 µL basal maintenance medium. Prepare a 4x vehicle control by adding 4 µL of DMSO to 996 µL basal maintenance medium.
NOTE: Before initiating the experiment, check the baseline measurements on the OCR monitoring software platform. For further validation of organoid health, examine the organoids under a microscope for minimal cell death and maintained beating before initiating the MST. Any organoid exhibiting an OCR value less than 5 fmol/mm2/s, visible cell death that affects more than 25% of the projected organoid area, or loss of beating is excluded from the experiment. Photograph the organoids to enable normalization of OCR values to organoid size. - Remove 25 µL of medium from each well and replace it with 25 µL of the appropriate 4x working solution (vehicle control, oligomycin, BAM15, or rotenone/antimycin A). This preparation ensures a consistent final DMSO concentration across all wells and conditions while minimizing DMSO exposure and reducing potential toxicity. The final concentrations of the mitochondrial modulators used in the MST are 2 µM oligomycin, 2.5 µM BAM15, and 2 µM rotenone/antimycin A.
- Monitor OCR changes for 6 h.
- Proceed with the analysis by calculating, for each organoid, the mean OCR recorded during the MST and dividing it by the baseline OCR of the same organoid (step 2.2.2). Divide this ratio further by the projected cross-sectional area of the corresponding organoid, measured from the image acquired immediately before the assay using image analysis software.
NOTE: In this experiment, organoids were imaged at 4x magnification with a scale bar of known length. The images were then opened in image analysis software, the scale bar was measured with the straight-line tool, and its known length was entered in the set-scale function of the software, converting pixel dimensions to µm. The projected cross-sectional area of each organoid was subsequently measured in µm2 and used to normalize the OCR values. Projected area was selected as a reproducible two-dimensional proxy for organoid size and should not be interpreted as a direct estimate of organoid volume. Report the number of organoids analyzed per cell line and condition, and state whether they derive from independent differentiations (biological replicates) or from a single differentiation (technical replicates). Where the number of independent replicates is too small to support inferential testing, as in the representative experiment shown here, present the individual organoid values with the mean ± SD and describe the differences descriptively.
- Prepare 1,000x stock solutions for each modulator used in the MST. Prepare oligomycin (ATP synthase/Complex V inhibitor) in DMSO at 2 mM, BAM15 (mitochondrial uncoupling agent) in DMSO at 2.5 mM, and a combined rotenone/antimycin A stock solution in DMSO containing 2 mM of each inhibitor (Complex I and Complex III inhibitors, respectively).
3. Immunocytochemical (ICC) staining for cell population evaluation within the organoid
- ICC staining for SOX10, NKX2.5, and RUNX3
- On the preferred day of differentiation, using a 1000 µL pipette, transfer the organoids to a new 96-well plate.
- Remove the spent medium and wash the organoids with 100 µL of D-PBS.
- Remove the D-PBS solution and add 100 µL of 4% PFA diluted in D-PBS.
CAUTION: Paraformaldehyde is toxic and a suspected carcinogen; prepare and handle it inside a fume hood using appropriate personal protective equipment. - Incubate organoids at 4 °C on a shaker for 1 h.
- After 1 h, remove the PFA, and wash the organoids with Tris-Buffered Saline (TBS) containing 0.5% Tween-20 (TBST 0.5%) for 10 min.
- Repeat the washing step two more times.
- Remove the TBST and add 100 µL of 1% BSA in TBS containing 1% Tween-20 (blocking solution) in each well.
- Incubate the organoids overnight at 4 °C on a shaker.
- Remove the blocking solution and add 50–60 µL of the primary antibody diluted in the blocking solution, according to the manufacturer’s instructions.
- Incubate on a shaker at 4 °C overnight.
- Remove the primary antibody, and wash the organoids with TBST 0.5% for 10 min.
- Repeat the washing step two more times.
- Remove the TBST and add 50–60 µL of the appropriate secondary antibody diluted in the blocking solution (see Table of Materials).
- Incubate for 1 h at room temperature on a shaker.
- After 1 h, remove the secondary antibody, and wash with TBST 0.5% for 10 min.
- Repeat the washing step two more times.
- Remove the TBST solution and add 100 µL of 2 µg/mL DAPI solution in each well.
CAUTION: DAPI is a DNA-binding fluorescent dye and should be handled with appropriate personal protective equipment. Avoid skin and eye contact and dispose of DAPI-containing solutions according to institutional hazardous waste procedures. - Incubate for 10 min at 4 °C.
- Remove the DAPI solution and wash with TBST 0.5%.
- Prepare a 55% w/v sucrose solution by dissolving 5.5 g of sucrose in 5 mL of glycerol and adding distilled water to reach a final volume of 10 mL. To dissolve the sucrose completely, place the solution on a stirrer with mild heat (< 50 °C).
- Dilute 1 mL of this solution with 1 mL of D-PBS.
- Remove the TBST solution and add 100 µL of the sucrose solution diluted 1:1 with D-PBS to each well.
- Incubate the organoids at room temperature for 30 min.
- Remove the diluted sucrose solution and add 100 µL of the non-diluted solution to each well.
- Incubate the organoids overnight at 4 °C.
NOTE: The clearing steps render the organoid more transparent and improve imaging of the fluorophore at depth and are therefore applied to all immunocytochemical stainings in this protocol. GFP fluorescence is retained through clearing. Clearing may be omitted where only the superficial regions of the organoid are to be imaged. - Prepare microscope slides by adding one small plasticine sphere in each of the four corners. This will prevent organoids from being compressed beneath the coverslip.
- Using a 1000 µL pipette, transfer the organoids onto the microscope glass slides, and carefully remove the excess wash solution.
- Add approximately 60 µL of mounting medium on top of the organoids on the glass slide.
- Add the coverslip and gently press down on the plasticine.
- Image the slides on a fluorescence microscope.
- ICC staining for Parvalbumin
- For the parvalbumin (PVALB) ICC staining, follow steps 3.1.1 to 3.1.30 as described above, but dilute both the primary and the secondary antibodies in TBS containing 0.3% Triton X-100.
CAUTION: Triton X-100 should be handled with appropriate personal protective equipment. Avoid skin and eye contact and dispose of Triton X-100-containing solutions according to institutional hazardous waste procedures.
NOTE: Triton X-100 is substituted for Tween-20 in the antibody diluent for the parvalbumin staining because, after troubleshooting, it was found to allow better penetration of the antibody into the organoid.
- For the parvalbumin (PVALB) ICC staining, follow steps 3.1.1 to 3.1.30 as described above, but dilute both the primary and the secondary antibodies in TBS containing 0.3% Triton X-100.
4. Validation of FXN expression in the undifferentiated cell lines
- Western blot
- Extract whole-cell protein from undifferentiated hPSC cultures with a whole-cell protein extraction kit and determine the protein concentration by the Bradford assay, in both cases, according to the manufacturers' instructions.
- Load 10 µg of protein per lane and separate the proteins on a precast 4%–12% bis-tris polyacrylamide gel in MES running buffer.
- Transfer the separated proteins onto a polyvinylidene difluoride (PVDF) membrane of 0.22 µm pore size using a wet blotting module.
- Block the membrane for 1 h at room temperature in 3% non-fat dry milk blocking reagent.
- Incubate the membrane overnight at 4 °C with the primary antibodies against frataxin (1:1000) and β-actin (1:6000) diluted in blocking reagent. Wash the membrane and then incubate it for 1 h at room temperature with the horseradish peroxidase (HRP)-linked anti-rabbit (1:2000) and anti-mouse (1:6000) secondary antibodies.
- Visualize the blots on a chemiluminescence imaging system and quantify the band intensities by densitometry using image analysis software. Normalize frataxin to β-actin and express the result relative to the isogenic corrected control.
- Quantitative PCR
- Extract total RNA from undifferentiated hPSC cultures with an RNA extraction kit and synthesize complementary DNA (cDNA) with a high-capacity reverse-transcription kit, in both cases according to the manufacturers' instructions.
- Perform quantitative PCR on a real-time PCR detection system using a universal PCR master mix together with the hydrolysis-probe assays for FXN and for the reference gene TBP following the manufacturer's instructions.
- Calculate relative FXN expression by the comparative Ct (2−ΔΔCt) method using TBP as the reference gene and express the result relative to the isogenic corrected control line.
NOTE: TBP was selected as a housekeeping gene because its expression remains stable under conditions of mitochondrial dysfunction and oxidative stress, which are observed in FRDA pathology. Unlike metabolic reference genes, such as GAPDH, TBP is a basal transcription factor, whose expression is decoupled from cellular metabolism.
Résultats
During differentiation (Figure 1A), SOX10::GFP human pluripotent stem cells aggregate to form spheroids that progressively increase in size and develop a polarized morphology (Figure 1B). GFP-positive cells first appear between days 6 and 7 of differentiation, indicating activation of the SOX10 promoter (Figure 1A–B). By days 7–8, spontaneous contractile activity is observed in discrete regions of the organoid. Specifically, across 4 independent differentiation experiments (n of total organoids = 72), 55% of the organoids (n = 40) exhibited beating on day 7, while 37.5% (n = 27) exhibited beating on day 8. Only 7% (n = 5) did not exhibit any beating. In terms of the GFP signal, across 2 independent experiments (n of total organoids = 32), 18.75% (n = 6) exhibited GFP on day 6 and 78% (n = 25) exhibited GFP on day 7, while 3% (n = 1) did not exhibit any GFP signal. In most organoids (71%, n = 34 of 48), the beating region is located opposite the GFP-positive domain, resulting in a polarized neuromyocardial organoid. This proportion was scored retrospectively, from time-lapse recordings of GFP-positive beating organoids together with NKX2.5 immunostainings of GFP-positive organoids. The fidelity of the SOX10::GFP reporter line for identifying NCC populations within the organoid is validated by SOX10 ICC staining (Figure 1C).
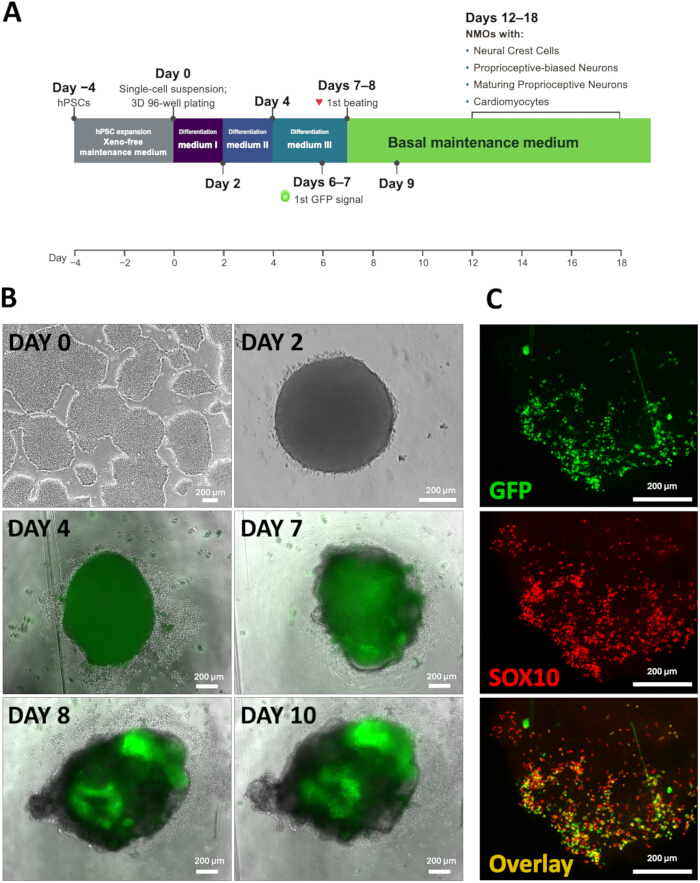
Figure 1: Generation of SOX10::GFP neuromyocardial organoids. (A) Schematic diagram of the protocol timeline. Key events, such as first appearance of GFP signal and first appearance of beating, are indicated. The different media used in each protocol step are mentioned. (B) Development of SOX10::GFP neuromyocardial organoids during differentiation. Representative brightfield and fluorescence images, drawn from 2 independent differentiation experiments, showing organoid morphology throughout differentiation. GFP-positive cells became detectable between days 6 and 7, while spontaneous contractile activity was observed by days 7–8. The dim, uniform green signal seen in the day-4 panel is autofluorescence. Scale bars: 200 µm (Days 0, 4, 7, 8, and 10: 4x magnification; Day 2: 10x magnification). (C) Co-localization of GFP and SOX10 expression in SOX10::GFP organoids. Representative ICC staining demonstrating co-localization of GFP fluorescence and SOX10 expression in GFP-positive organoids. Scale bar: 200 µm (10x magnification). Please click here to view a larger version of this figure.
To characterize the cellular populations generated by the protocol, organoids are analyzed by ICC between days 12 and 18 of differentiation. ICC staining for the cardiomyocyte marker NKX2.5 in GFP-positive beating organoids on day 12 marks cardiac cell populations in regions distinct from the GFP-positive domains (Figure 2A–D). Furthermore, staining for RUNX3 and PVALB indicates both GFP+/RUNX3+ and RUNX3+/PVALB+ double-positive cells (Figure 2E–H).
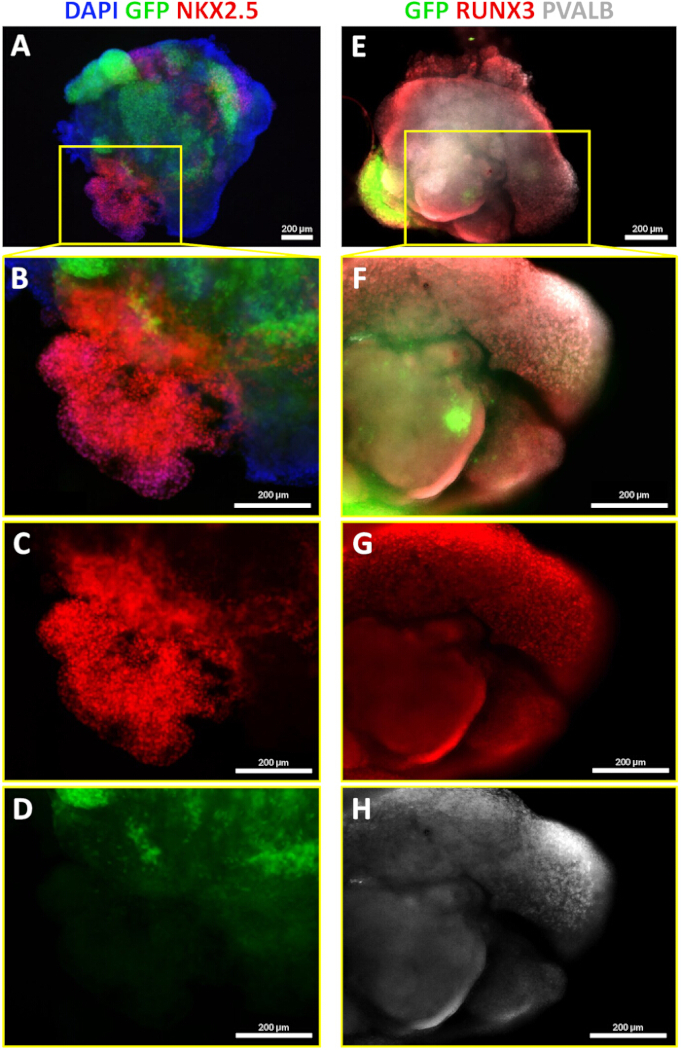
Figure 2: Cardiac and sensory neuronal populations in SOX10::GFP organoids. (A–D) Identification of cardiac populations in SOX10::GFP organoids. (A) Representative whole GFP-positive organoid on day 12 of differentiation, showing GFP reporter fluorescence together with ICC staining for NKX2.5 and a DAPI counterstain. (B) Merged image of the inset marked with a yellow box in panel A, showing the DAPI, GFP, and NKX2.5 channels. (C) NKX2.5-only channel of the inset marked with a yellow box in panel A. (D) GFP-only channel of the inset marked with a yellow box in panel A. For panels A–D, n of organoids stained = 3 and n of organoids exhibiting NKX2.5 = 3 (100%). Scale bars: 200 µm (panel A: 4x magnification; panels B–D: 10x magnification). (E–H) Identification of sensory neuronal populations in SOX10::GFP organoids. (E) Representative whole SOX10::GFP beating organoid on day 18, from a different cohort, showing GFP reporter fluorescence together with ICC staining for RUNX3 and PVALB. (F) Merged image of the inset marked with a yellow box in panel E, showing the GFP, RUNX3, and PVALB channels. (G) RUNX3-only channel of the inset marked with a yellow box in panel E. (H) PVALB-only channel of the inset marked with a yellow box in panel E. Both GFP+/RUNX3+ proprioceptive-biased sensory neurons of neural crest origin and RUNX3+/PVALB+ maturing proprioceptive-biased neurons are present in the organoid (n of organoids stained = 3, n of organoids exhibiting double-positive populations = 3, 100%). Scale bars: 200 µm (panel E: 4x magnification; panels F–H: 10x magnification). The DAPI channel is not shown in panels E–H. Please click here to view a larger version of this figure.
To assess the performance of our model in a disease-relevant context, we differentiated an FRDA patient-derived iPSC line alongside its corresponding isogenic corrected control to generate NMOs, enabling direct comparison of disease-specific phenotypes. Frataxin expression was confirmed in the two undifferentiated lines before differentiation: FXN protein was markedly reduced in the FRDA line relative to the isogenic corrected control (Figure 3A), with a corresponding reduction in FXN mRNA (Figure 3B). Using the real-time OCR monitoring system, we performed a mitochondrial stress test to compare key bioenergetic parameters of the produced organoids. Before initiating the experiment, no organoids exhibited an OCR value of less than 5 fmol/mm2/s, visible cell death that affected more than 25% of the projected organoid area, or loss of beating. Thus, no organoid was excluded from this experiment. Oxygen consumption was recorded continuously from the medium change on the preceding day until 6 h after the addition of the modulators, so that the response of every organoid is resolved in time and each value is referenced to the baseline of the same organoid (Figure 4A). The vehicle-control organoids, which received basal maintenance medium containing 0.1% DMSO, showed a transient fall in OCR at the medium exchange that recovered over the following hours. Averaged across the 6 h after the addition, OCR was 0.89–0.95 of each organoid's own pre-addition baseline in the FRDA organoids and 0.70–0.71 in the isogenic control organoids, so the vehicle perturbation was the smaller of the two in the FRDA line. In both lines OCR was recovering toward baseline by the end of the recording rather than declining further, as it also did after the routine, DMSO-free medium change on the preceding day, indicating a transient exchange-related perturbation rather than progressive toxicity of DMSO at this concentration. Throughout the vehicle response OCR remained above the 5 fmol/mm2/s exclusion threshold in every organoid, the lowest value recorded being 7.7 fmol/mm2/s. Because the isogenic vehicle condition is the reference to which every other condition is normalized, this residual perturbation acts against the difference described below rather than generating it. Compared with the isogenic control, FRDA organoids exhibit impaired mitochondrial function, as evidenced by reduced basal respiration, maximal respiration, and spare respiratory capacity (Figure 4B–C). Given the limited number of independent organoids analyzed, these data are presented descriptively and are intended to demonstrate the sensitivity of the assay rather than establish a statistically supported FRDA-specific respiratory phenotype.
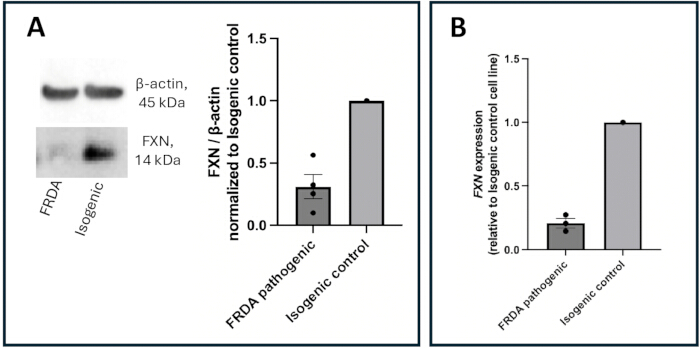
Figure 3: Validation of the FRDA patient-derived iPSC line and its isogenic corrected control. FXN expression was measured in the two undifferentiated stem cell lines (FRDA-pathogenic and isogenic corrected control) by Western blot (A), shown as a representative blot with densitometry normalized to β-actin (n = 4 independent experiments; error bars represent the SEM), and by quantitative PCR (B), shown as FXN mRNA relative to the isogenic corrected control. The error bars represent the SEM (n of biological replicates = 3, n of technical replicates = 2). In both panels every experiment is expressed relative to the isogenic corrected control, which is therefore 1.0 with no dispersion; individual data points are shown and the error bars apply to the FRDA-pathogenic line. Please click here to view a larger version of this figure.
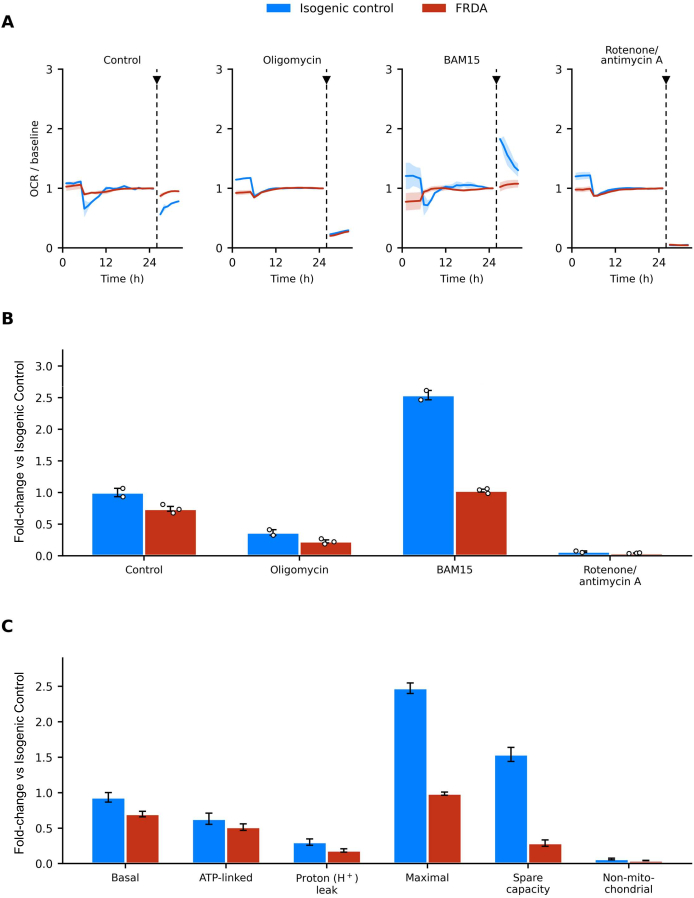
Figure 4: Real-time respirometry of FRDA and isogenic neuromyocardial organoids. Oxygen consumption rate (OCR) was measured with the real-time OCR monitoring system in response to the mitochondrial modulators oligomycin, BAM15, and rotenone/antimycin A. (A) Time-resolved OCR under each condition, expressed relative to the baseline OCR of the same organoid, with the line and the shaded band showing the mean and the SEM of the organoids in each group; the arrowhead and the dashed line mark the addition of the modulators, which in this experiment happened 26 h after the preceding medium change, within the stabilized OCR window. (B) OCR under each condition (control, oligomycin, BAM15, rotenone/antimycin A), normalized to organoid size and expressed as fold-change relative to the isogenic organoids under the control (vehicle) condition, which is therefore set to 1.0; values are compared between isogenic and FRDA organoids. (C) Basal respiration, ATP-linked respiration, proton (H⁺) leak, maximal respiration, spare respiratory capacity, and non-mitochondrial OCR, shown for each genotype. Parameters were calculated from the mean OCR values of the corresponding experimental conditions as follows: basal respiration = control − Rot/AA; ATP-linked respiration = control − oligomycin; proton leak = oligomycin − Rot/AA; maximal respiration = BAM15 − Rot/AA; spare respiratory capacity = BAM15 − control; and non-mitochondrial respiration = Rot/AA. Different organoids were used for each experimental condition, with n = 2 isogenic control and n = 3 FRDA organoids per condition. All organoids originated from a single differentiation run for each cell line and therefore represent technical replicates. Individual points represent individual organoids, and the data are presented descriptively as individual organoid values with the mean ± SD. For the derived respiratory parameters in panel C, error bars represent propagated SEM from the contributing experimental conditions. These propagated errors are descriptive uncertainty estimates and were not treated as independent observations or subjected to inferential statistical testing. Given the limited number of technical replicates for this particular experiment and the absence of independent differentiation experiments, no inferential statistical analysis is performed. Please click here to view a larger version of this figure.
Supplementary Video 1: Spontaneous contractile activity in SOX10::GFP and FRDA neuromyocardial organoids. Left, a SOX10::GFP organoid, shown first in brightfield and then in the GFP channel; right, an organoid derived from the FRDA patient line, in brightfield. Both organoids contract spontaneously and rhythmically. The FRDA recording is a 2.9 s clip looped to match the duration of the SOX10::GFP recording. Please click here to download this file.
Discussion
The NMO protocol allows the reproducible development of spontaneously beating neuromyocardial organoids from hPSCs. Using a SOX10::GFP reporter line, NCC development and migration can be monitored easily throughout differentiation. During organoid differentiation, GFP-positive cells first appear between days 6–7, while spontaneous beating begins between days 7 and 8 (Figure 1A–B). Co-localization of GFP and SOX10, via ICC staining, confirmed the fidelity of the reporter line and demonstrated that GFP expression identifies NCC populations within the organoid (Figure 1C).
Additional ICC staining for the NKX2.5 cardiomyocyte marker verified the presence of myocardial cells in the contractile region of the organoid (Figure 2A–D). Furthermore, ICC staining for RUNX3 and PVALB identified GFP+/RUNX3+ and PVALB+/RUNX3+ double-positive cells within the organoids (Figure 2E–H). RUNX3 is a key regulator of proprioceptive sensory neurons16, including those located in the DRG, while PVALB is a marker associated with their maturation17. Thus, these findings suggest the presence of neural crest-derived proprioceptive-biased sensory populations within the NMO structure.
One of the principal advantages of the NMO model is its rapid developmental timeline. The organoids mature within approximately 9 days of differentiation, representing a significant reduction in culture time compared to other in vitro models. Furthermore, in vivo animal models typically require months or even years to recapitulate developmental or disease-related phenotypes. Consequently, this differentiation protocol provides a robust platform for investigating NCC biology and associated developmental processes.
A further strength of the model is the simultaneous generation of both neuronal and cardiac cell populations within the same organoid. This multicellular composition allows the investigation of cellular interactions between the developing nervous and cardiovascular systems in a physiologically relevant context. This may be particularly valuable for modeling disorders that affect both systems, such as the case of FRDA, which is characterized by degeneration of DRG neurons together with progressive cardiomyopathy, making it difficult to model comprehensively using single-lineage culture systems. By generating both neural crest-derived sensory populations and cardiac cells within the same organoid, the NMO platform may provide a useful tool for investigating disease mechanisms and evaluating therapeutic interventions in FRDA.
By integrating our model with the real-time OCR monitoring platform, we enable continuous, real-time monitoring of OCR over days to weeks without disturbing organoid culture. Unlike standard endpoint assays, this longitudinal monitoring detects dynamic fluctuations in mitochondrial respiration, offering a precise measure of metabolic health and cellular stress. This methodology enables the study of metabolic and mitochondrial disparities between healthy and diseased organoids, thereby shedding light on patient-specific phenotypes. Our findings demonstrated that organoids derived from an FRDA patient exhibit a reduced basal OCR compared with their isogenic controls. Moreover, they displayed a marked reduction in maximal respiration, which represents the highest oxygen consumption rate achieved following pharmacological uncoupling of the electron transport chain, indicating a lower bioenergetic reservoir available during high-energy-demanding functions (Figure 4B–C). This is consistent with the known role of frataxin (FXN), the mitochondrial protein deficient in FRDA, which is required for iron–sulfur cluster biogenesis and maintenance of electron transport chain function18.
The FRDA comparison presented here is intended as a demonstration of the sensitivity of the platform rather than as a complete disease characterization. It rests on a single patient-derived line and its isogenic control and on a small number of organoids per condition. Supplementary Video 1 shows organoids of both lines contracting spontaneously; the two recordings are not offered as a quantitative morphological comparison, and the cellular composition of the FRDA and isogenic organoids was not compared by immunostaining here. As that composition was not assessed in parallel, it is possible that the observed respiratory differences reflect a combination of intrinsic metabolic alterations and potential differences in cell-type composition.
In summary, the presented protocol provides a chemically defined and reproducible strategy for generating NMOs. When paired with the real-time OCR monitoring system, this approach creates a robust platform for assessing pharmacological interventions in various disease models that involve neural crest-derived tissues. In practical terms, the workflow was designed to be economical and widely accessible. All media are chemically defined and free of animal-derived components, and the organoids are produced in inexpensive, standard tissue-culture plasticware, avoiding the ultra-low-attachment plates, matrix scaffolds, and anti-adherence pre-treatments that many organoid protocols require.
Déclarations de divulgation
K.E.H. and N.I. are co-founders and shareholders of KosBio P.C.; A.D. is its Director of Research Operations; and V.P. and K.I.-K. are staff scientists of KosBio P.C. KosBio develops and commercializes the organoid media and supplements used in this protocol; their formulations are proprietary trade secrets of KosBio and are not disclosed here. Every other element of the protocol, i.e. the plate format, the seeding densities, the medium-change schedule, OCR acquisition and analysis, immunocytochemistry, and the molecular validation of the cell lines, is described here in full and can be reproduced by any laboratory holding the media, and the signaling pathways that each medium activates or withdraws, together with the corresponding treatment windows, are given in the NOTE after step 1.4.13. M.P., E.L., and L.C.P. declare no competing interests. Qualified academic and non-profit researchers may request access to these reagents for non-commercial purposes, which KosBio provides under a Material Transfer Agreement following a reasonable request to the corresponding author. KosBio reagents are ordered by product name and carry no separate catalog number; the product name of each is given in the Table of Materials.
Remerciements
This work was carried out and financed by KosBio P.C. The authors are grateful to their colleagues at KosBio P.C. and the Aristotle University of Thessaloniki for valuable discussions and technical assistance.
Matériaux
| Nom | Entreprise | Numéro de catalogue | Commentaires |
|---|---|---|---|
| 12-well tissue-culture plate | TPP | 41122107 | Coated with Matrigel |
| 96-well plate, U-bottom, non-tissue culture treated | Sarstedt AG & Co. KG | 83.3925.500 | Suspension-culture (non-treated) plate; used for organoid formation, ready for use |
| Nuclear Extract Kit | Active Motif | 40010 | Whole-cell protein extraction from undifferentiated hPSCs (step 4.1.1) |
| Alexa Fluor 568 Donkey Anti-Mouse IgG | Thermo Fisher Scientific | A10037 | 1:500 dilution in 1% BSA TBST 1% |
| Alexa Fluor 568 Donkey Anti-Rabbit | Thermo Fisher Scientific | A10042 | 1:500 dilution in 1% BSA TBST 1% |
| Alexa Fluor 647 Donkey Anti-Rabbit IgG | Thermo Fisher Scientific | A31573 | 1:500 dilution in 1% BSA TBST 1% |
| Anti-mouse IgG, HRP-linked antibody | Cell Signaling Technology | 7076 | 1:6000 secondary antibody for Western blot (step 4.1.5) |
| Anti-rabbit IgG, HRP-linked antibody | Cell Signaling Technology | 7074 | 1:2000 secondary antibody for Western blot (step 4.1.5) |
| Antimycin A | Sigma-Aldrich | A8674 | Stock 2 mM in DMSO (1000x) |
| BAM15 | Selleck Chemicals | S0411 | Stock 2.5 mM in DMSO (1000x) |
| β-Actin (8H10D10) Mouse mAb | Cell Signaling Technology | 3700 | 1:6000 dilution, loading control for Western blot (step 4.1.5) |
| Blotto, non-fat dry milk | Santa Cruz Biotechnology, Inc. | sc-2325 | Used at 3% as blocking reagent for Western blot (step 4.1.4) |
| Bradford protein assay | Bio-Rad | 5000006 | Protein quantification (step 4.1.1) |
| BSA, Bovine Serum Albumin, Fraction V | BIOMATIK | A2134-100G | Dissolved in TBS for desired concentration |
| CO2-resistant orbital shaker | Thermo Fisher Scientific | 88881102 | Used at 4 °C and at room temperature during ICC; rubber platform 88881123 |
| DAPI Dihydrochloride Salt | Biotium | 40011 | Diluted in PBS, for final concentration 2 μg/mL |
| Dimethyl sulfoxide (DMSO) | Targetmol | T0341 | Solvent for the 1000x modulator stocks and the vehicle control |
| DMEM/F12 | Thermo Fisher Scientific | 31330038 | Ready for use |
| Dulbecco's Phosphate-Buffered Saline (D-PBS) | Biowest | L0615-1000 | Ready for use |
| ECHO Revolve Microscope | Discover ECHO | RVL2-K4-02459 | Fluorescence microscope used for all imaging |
| Frataxin (FXN) antibody | Cell Signaling Technology | 64668 | 1:1000 dilution for Western blot (step 4.1.5) |
| Glycerol | SIGMA Life Sciences | G9012-500ML | Ready for use |
| High-Capacity cDNA Reverse Transcription Kit | Applied Biosystems | 4368814 | Complementary DNA synthesis (step 4.2.1) |
| iBright imaging system | Thermo Fisher Scientific | A44116 | Chemiluminescence imaging of Western blots (step 4.1.6) |
| Idolyon Neuromyocardial Organoid Differentiation Kit | KosBio P.C. | Idolyon Neuromyocardial Organoid Differentiation Kit | Single kit supplying the components referred to in the protocol as "differentiation medium I", "differentiation medium II" (supplement and diluent), "differentiation medium III" and "basal maintenance medium"; these components are not sold separately. KosBio reagents are ordered by product name and carry no separate catalogue number. Ready for use, https://kosbio.com/shop |
| Idolyon Suspend-3D 1000X Concentrate | KosBio P.C. | Idolyon Suspend-3D | Referred to as the "3D suspension supplement". KosBio reagents are ordered by product name and carry no separate catalogue number. Ready for use, https://kosbio.com/shop |
| ImageJ | National Institutes of Health | Open source, https://imagej.net | Referred to in the Protocol as "image analysis software". Quantification of organoid area (NOTE after step 2.2.6) and densitometry of Western blots (step 4.1.6) |
| Applied Biosystems StepOne Real-Time PCR System | Thermo Fisher Scientific | 4376373 | Quantitative PCR instrument (step 4.2.2) |
| Matrigel | Corning | 354230 | Referred to in the Protocol as the "basement membrane matrix". 1:400 dilution in DMEM/F12 |
| Mini Blot Module | Thermo Fisher Scientific | B1000 | Wet transfer module for Western blot (step 4.1.3) |
| NKX2.5 (E1Y8H) Rabbit Monoclonal antibody (Alexa Fluor 647 Conjugate) | Cell Signaling Technology | 40617S | 1:1000 dilution in 1% BSA TBST 1% |
| NuPAGE 4 to 12%, Bis-Tris precast protein gel | Thermo Fisher Scientific | NP0323 | Precast gel for protein electrophoresis (step 4.1.2) |
| NuPAGE MES SDS running buffer | Thermo Fisher Scientific | NP0002 | Running buffer for protein electrophoresis (step 4.1.2) |
| Oligomycin | Targetmol | T21494 | Stock 2 mM in DMSO (1000x) |
| Paraformaldehyde tablets | PanReac AppliChem | 211511.1209 | Tablet dissolved in distilled water and NaOH, adjust pH with HCl to 7–7.4, if needed. Dilute in PBS for final concentration of 4% |
| Parvalbumin (E8N2U) Rabbit Monoclonal Antibody | Cell Signaling Technology | 80561 | 1:1000 dilution in TBS + 0.3% Triton X-100 |
| PluriKB-XF 3D (Xeno-Free) | KosBio P.C. | PluriKB-XF 3D | Referred to as the "xeno-free maintenance medium". KosBio reagents are ordered by product name and carry no separate catalogue number. Ready for use, https://kosbio.com/shop |
| PVDF membrane, 0.22 µm pore size | Thermo Fisher Scientific | LC2002 | Protein transfer membrane (step 4.1.3) |
| Resipher | Lucid Scientific | 2513-NS32-1220-AKUU | Referred to in the Protocol as the "real-time OCR monitoring system" |
| Resipher sensing lid | Lucid Scientific | NS32-108A | 32-sensor lid used with the real-time OCR monitoring system |
| RNeasy Mini Kit | Qiagen | 74106 | Total RNA extraction (step 4.2.1) |
| Rotenone | Targetmol | T2970 | Stock 2 mM in DMSO (1000x) |
| RUNX3/AML2 Mouse Antibody | Cell Signaling Technology | 13089T | 1:150 dilution in 1% BSA TBST 1% |
| SOX10 (E6B6I) Rabbit Monoclonal antibody | Cell Signaling Technology | 69661 | 1:50 dilution in 1% BSA TBST 1% |
| StemPro Accutase Cell Dissociation Reagent | Thermo Fisher Scientific | A1110501 | Referred to in the Protocol as the "cell detachment solution". Ready for use; 1:1 dilution |
| Sucrose | AMRESCO | M117-1KG | Ready for use |
| TaqMan Gene Expression Assay, FXN (Hs00175940_m1) | Thermo Fisher Scientific | 4331182 | Target gene assay (step 4.2.2) |
| TaqMan Gene Expression Assay, TBP (Hs00427621_m1) | Thermo Fisher Scientific | 4331182 | Reference gene assay (step 4.2.2) |
| TaqMan Universal PCR Master Mix (2X) | Thermo Fisher Scientific | 4304437 | Quantitative PCR master mix (step 4.2.2) |
| Thiazovivin | Biosynth | FT28209 | Referred to in the Protocol as the "ROCK inhibitor". CAS 1226056-71-8. Dissolved in DMSO; stock 2 mM, 1:1000 dilution |
| Triton X-100 | AMRESCO | M143-1L | Diluted in TBS for desired concentration |
| Tween-20 | SIGMA Life Sciences | P7949-500ML | Diluted in TBS for desired concentration |
| Vectashield Hard Set Antifade Mounting Medium with DAPI | Vector laboratories | H-1500-10 | Ready for use |
Références
- Daiou, A., Petalidou, K., Siokatas, G., Papadopoulos, E. I., Hatzistergos, K. E. Developmental and regenerative biology of cardiomyocytes. Int. J. Dev. Biol. 66 (1–3), 59–75 (2022). doi:10.1387/ijdb.210159kh.
- Hatzistergos, K. E. et al. A novel cardiomyogenic role for Isl1(+) neural crest cells in the inflow tract. Sci. Adv. 6 (49) (2020). doi:10.1126/sciadv.aba9950.
- Hatzistergos, K. E. et al. Simulated microgravity impairs cardiac autonomic neurogenesis from neural crest cells. Stem Cells Dev. 27 (12), 819–830 (2018). doi:10.1089/scd.2017.0265.
- Hatzistergos, K. E. et al. cKit+ cardiac progenitors of neural crest origin. Proc. Natl. Acad. Sci. U. S. A. 112 (42), 13051–13056 (2015). doi:10.1073/pnas.1517201112.
- Moury, J. D., Jacobson, A. G. The origins of neural crest cells in the axolotl. Dev. Biol. 141 (2), 243–253 (1990). doi:10.1016/0012-1606(90)90380-2.
- Fernandez-Garre, P., Rodriguez-Gallardo, L., Gallego-Diaz, V., Alvarez, I. S., Puelles, L. Fate map of the chicken neural plate at stage 4. Development. 129 (12), 2807–2822 (2002). doi:10.1242/dev.129.12.2807.
- Noisa, P., Raivio, T. Neural crest cells: from developmental biology to clinical interventions. Birth Defects Res. C Embryo Today. 102 (3), 263–274 (2014). doi:10.1002/bdrc.21074.
- Bhatt, S., Diaz, R., Trainor, P. A. Signals and switches in mammalian neural crest cell differentiation. Cold Spring Harb. Perspect. Biol. 5 (2) (2013). doi:10.1101/cshperspect.a008326.
- Szabo, A., Mayor, R. Mechanisms of neural crest migration. Annu. Rev. Genet. 52, 43–63 (2018). doi:10.1146/annurev-genet-120417-031559.
- Thattaliyath, B. D., Firulli, A. B. Neural crest. Adv. Exp. Med. Biol. 1441, 125–143 (2024). doi:10.1007/978-3-031-44087-8_6.
- Vega-Lopez, G. A., Cerrizuela, S., Aybar, M. J. Trunk neural crest cells: formation, migration and beyond. Int. J. Dev. Biol. 61 (1–2), 5–15 (2017). doi:10.1387/ijdb.160408gv.
- Mica, Y., Lee, G., Chambers, S. M., Tomishima, M. J., Studer, L. Modeling neural crest induction, melanocyte specification, and disease-related pigmentation defects in hESCs and patient-specific iPSCs. Cell Rep. 3 (4), 1140–1152 (2013). doi:10.1016/j.celrep.2013.03.025.
- Guth, S. I., Wegner, M. Having it both ways: Sox protein function between conservation and innovation. Cell Mol. Life Sci. 65 (19), 3000–3018 (2008). doi:10.1007/s00018-008-8138-7.
- Cook, A., Giunti, P. Friedreich's ataxia: clinical features, pathogenesis and management. Br. Med. Bull. 124 (1), 19–30 (2017). doi:10.1093/bmb/ldx034.
- Li, Y. et al. Establishment and maintenance of primary fibroblast repositories for rare diseases-Friedreich's Ataxia Example. Biopreserv. Biobank. 14 (4), 324–329 (2016). doi:10.1089/bio.2015.0117.
- Levanon, D. et al. The Runx3 transcription factor regulates development and survival of TrkC dorsal root ganglia neurons. EMBO J. 21 (13), 3454–3463 (2002). doi:10.1093/emboj/cdf370.
- Andressen, C., Blumcke, I., Celio, M. R. Calcium-binding proteins: selective markers of nerve cells. Cell Tissue Res. 271 (2), 181–208 (1993). doi:10.1007/BF00318606.
- Stemmler, T. L., Lesuisse, E., Pain, D., Dancis, A. Frataxin and mitochondrial FeS cluster biogenesis. J. Biol. Chem. 285 (35), 26737–26743 (2010). doi:10.1074/jbc.R110.118679.
Réimpressions et autorisations
Cet article a été publié
Vidéo bientôt disponible