An erratum was issued for: Quantification of Macronutrients Intake in a Thermogenetic Neuronal Screen using Drosophila Larvae. A figure was updated.
Erratum: Quantification of Macronutrients Intake in a Thermogenetic Neuronal Screen using Drosophila Larvae
441 צפיות
⸱
6 באוקטובר 2020
במאמר זה
סיכום
תקציר
An erratum was issued for: Quantification of Macronutrients Intake in a Thermogenetic Neuronal Screen using Drosophila Larvae. A figure was updated.
Figure 1 was updated from:
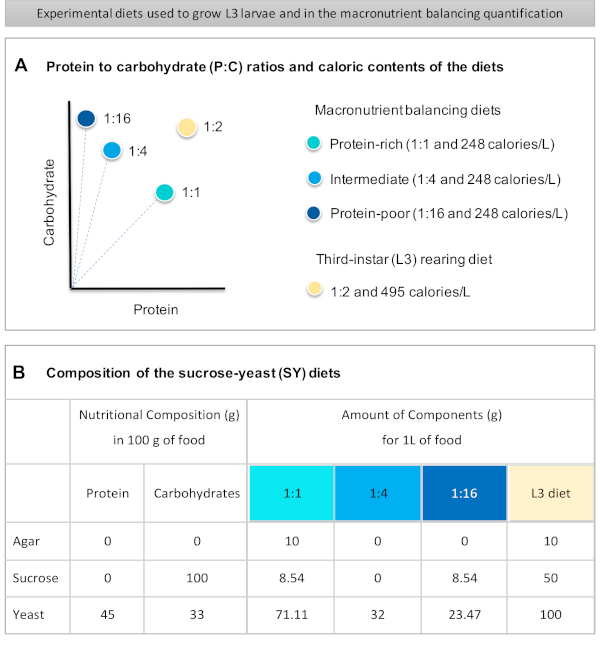
Figure 1: The sucrose-yeast (SY) diets used in our protocol. (A) The blue dots represent the isocaloric (248 calories/L) macronutrient balancing diets used in the feeding assay, which differ in the protein to carbohydrate (P:C) ratios: 1:1, 1:4 and 1:16. The beige dot represents the diet used to rear the experimental third-instar larvae (L3), which contained a P:C ratio of 1:2 and a caloric density of 495 calories/L. (B) Detailed composition and nutritional information of the sucrose-yeast (SY) based diets. The components are the same for all the diets: agar, sucrose and yeast. The amount in grams of the components needed to prepare 1 L of diet is shown. Note that 1% (v/v) of blue dye must be added to the macronutrient balancing diets and to the L3 rearing diet nipagin and propionic acid solutions must be added to a final concentration (v/v) of 3% and 0.3%, respectively. Please click here to view a larger version of this figure.
to:
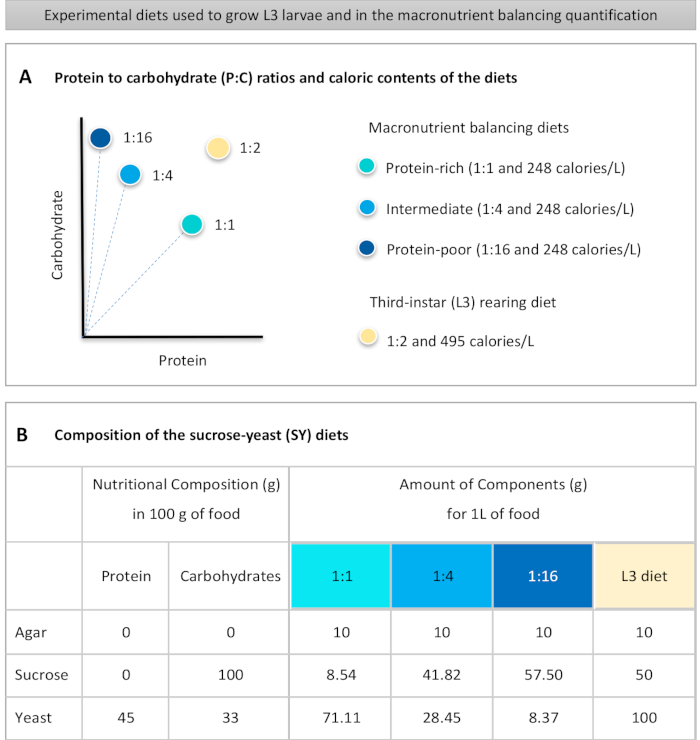
Figure 1: The sucrose-yeast (SY) diets used in our protocol. (A) The blue dots represent the isocaloric (248 calories/L) macronutrient balancing diets used in the feeding assay, which differ in the protein to carbohydrate (P:C) ratios: 1:1, 1:4 and 1:16. The beige dot represents the diet used to rear the experimental third-instar larvae (L3), which contained a P:C ratio of 1:2 and a caloric density of 495 calories/L. (B) Detailed composition and nutritional information of the sucrose-yeast (SY) based diets. The components are the same for all the diets: agar, sucrose and yeast. The amount in grams of the components needed to prepare 1 L of diet is shown. Note that 1% (v/v) of blue dye must be added to the macronutrient balancing diets and to the L3 rearing diet nipagin and propionic acid solutions must be added to a final concentration (v/v) of 3% and 0.3%, respectively. Please click here to view a larger version of this figure.
פרוטוקול
An erratum was issued for: Quantification of Macronutrients Intake in a Thermogenetic Neuronal Screen using Drosophila Larvae. A figure was updated.
Figure 1 was updated from:
Figure 1: The sucrose-yeast (SY) diets used in our protocol. (A) The blue dots represent the isocaloric (248 calories/L) macronutrient balancing diets used in the feeding assay, which differ in the protein to carbohydrate (P:C) ratios: 1:1, 1:4 and 1:16. The beige dot represents the diet used to rear the experimental third-instar larvae (L3), which contained a P:C ratio of 1:2 and a caloric density of 495 calories/L. (B) Detailed composition and nutritional information of the sucrose-yeast (SY) based diets. The components are the same for all the diets: agar, sucrose and yeast. The amount in grams of the components needed to prepare 1 L of diet is shown. Note that 1% (v/v) of blue dye must be added to the macronutrient balancing diets and to the L3 rearing diet nipagin and propionic acid solutions must be added to a final concentration (v/v) of 3% and 0.3%, respectively. Please click here to view a larger version of this figure.
to:
Figure 1: The sucrose-yeast (SY) diets used in our protocol. (A) The blue dots represent the isocaloric (248 calories/L) macronutrient balancing diets used in the feeding assay, which differ in the protein to carbohydrate (P:C) ratios: 1:1, 1:4 and 1:16. The beige dot represents the diet used to rear the experimental third-instar larvae (L3), which contained a P:C ratio of 1:2 and a caloric density of 495 calories/L. (B) Detailed composition and nutritional information of the sucrose-yeast (SY) based diets. The components are the same for all the diets: agar, sucrose and yeast. The amount in grams of the components needed to prepare 1 L of diet is shown. Note that 1% (v/v) of blue dye must be added to the macronutrient balancing diets and to the L3 rearing diet nipagin and propionic acid solutions must be added to a final concentration (v/v) of 3% and 0.3%, respectively. Please click here to view a larger version of this figure.
גילויים
No conflicts of interest declared.