This protocol describes the isolated examination of the microglial immune compartment and its secretome to investigate microglia-dependent tumor-host interactions and pharmacological interventions in a rodent glioma organotypic brain slice culture model.
מאמר שיטה
Experimental Microglial Secretome Screening in Rat Organotypic Brain Slice Cultures
במאמר זה
סיכום
תקציר
Glioblastoma (GBM) is the most common primary malignant brain tumor in adults and is characterized by extensive interactions between tumor cells and glioblastoma-associated microglia and macrophages (GAMM). In the peritumoral region, where residual glioma cells contribute to recurrence, resident microglia represent the predominant immune population within the GAMM and, in general, may shape early tumor-supportive responses. The objective of this study was to establish an ex vivo model to investigate microglia-specific responses to glioma cells in intact brain tissue. Three-dimensional organotypic brain slice cultures (OBSCs) retaining endogenous microglia were generated and compared with microglia-depleted slices produced by pharmacological CSF1R inhibition with PLX5622. OBSCs were co-cultured for seven days with fluorescently labeled rat glioma spheroids or non-tumorous astrocyte spheroids under defined treatment conditions. Conditioned media were collected for multiplex chemokine analysis, while fluorescence microscopy was used to quantify spheroid invasion and outgrowth. Following culture, OBSCs were cryosectioned and immunostained to characterize cellular and molecular changes in the peri-spheroidal tissue. The model preserved the three-dimensional brain parenchymal environment and enabled comparison of glioma-associated responses in the presence and absence of resident microglia without contributions from peripheral macrophages. Microglial depletion enabled the identification of microglia-dependent changes in chemokine profiles and spheroid behavior during the defined culture period. This experimentally tractable platform models early glioma-microglia interactions and supports mechanistic studies and evaluation of microglia-directed therapeutic strategies in a physiologically relevant tissue context.
מבוא
Glioblastoma (GBM) is the most frequent primary brain tumor in adults and remains associated with a devastating prognosis1. The immunological landscape of GBM is dominated by glioblastoma-associated microglia and macrophages (GAMM), which can constitute up to 50% of the tumor mass2. Recent studies have demonstrated that brain-resident microglia and peripheral bone marrow–derived macrophages exert distinct roles in tumor progression. Notably, within the post-surgically remaining peritumoral zone, the immune compartment is predominantly composed of microglia3,4. Residual neoplastic cells in this region give rise to tumor recurrence in approximately 90% of cases5. Consequently, early-stage immune responses arising from tumor-microglia interactions may represent a critical initial step in the shift from anti- to pro-tumorigenic polarization of the immune microenvironment.
Despite the potential importance of these early interactions, they are difficult to investigate using conventional experimental systems. Two-dimensional co-cultures and spheroid monocultures lack the cellular and structural complexity of brain parenchyma, whereas models containing both resident microglia and infiltrating peripheral macrophages make it difficult to distinguish the specific contribution of either myeloid population. An experimental system that preserves the three-dimensional architecture of brain tissue while permitting selective manipulation of resident microglia is therefore needed to investigate the microglia-dominated compartment.
Here, we present a protocol for modeling a microglia-dominated immune response to rat glioblastoma cell line spheroids in a physiologically relevant three-dimensional organotypic brain slice culture (OBSC) model6. Rat OBSCs are pretreated with or without the microglia-specific CSF1 receptor antagonist PLX5622 to generate microglia-depleted and microglia-native slice cultures, respectively. To model tumor-host interactions, 4,000-cell spheroids are generated from plasma membrane-fluorescently labeled rat glioma cell lines (S635 or 9L) and non-xenogeneic rat astrocytes, which serve as non-tumorous controls. Spheroids are placed onto OBSCs and co-cultured for seven days under various pharmacological treatment conditions. Conditioned media are collected for chemokine profiling, spheroid outgrowth is monitored by fluorescence microscopy, and the slices are subsequently cryosectioned and immunostained to characterize the peri-spheroidal microenvironment.
A principal advantage of this approach is its ability to investigate resident microglia within an intact brain tissue environment while experimentally separating their contribution from that of peripheral macrophages. This distinction is particularly relevant to GBM because the tumor core is macrophage-rich, whereas the peritumoral region is predominantly populated by microglia and represents the principal site from which recurrence originates7. Pharmacological microglial depletion with PLX5622 enables identification of microglia-dependent effects on spheroid behavior and chemokine release by direct comparison with microglia-native OBSCs. The approach extends the established rat OBSC/S635 co-culture system by combining CSF1R-antagonist pretreatment with proteome-profiler-based chemokine analysis. PLX5622 has been shown to reduce microglial numbers by more than 90% in ex vivo brain slice cultures while exhibiting limited off-target effects8, providing a basis for selectively assessing microglia-dependent responses.
The model is applicable to causal mechanistic studies of glioma-microglia interactions, characterization of microglial polarization-associated responses, and mid-throughput evaluation of candidate microglia-directed adjuvant treatments. Conditioned-media analysis enables comparison of chemokine profiles between pharmacologically treated and untreated conditions, microglia-native and microglia-depleted cultures, and tumorous and non-spheroidal OBSCs. In parallel, fluorescence-based quantification of spheroid outgrowth and immunohistochemical characterization of the peri-spheroidal tissue provide complementary readouts of tumor behavior and local cellular responses. Conversely, its defined seven-day experimental period and the system's ex vivo nature limit its suitability for investigating long-term tumor progression, systemic immune responses, or processes dependent on an intact blood–brain barrier.
Practical considerations concerning donor age and the timing of experimental manipulation are important for establishing the OBSC model. Organotypic brain slice cultures are typically generated from early postnatal rat brain, with viable donor ages reported across postnatal days 4–169. Within this interval, the developmental stage of the tissue at explantation can influence preservation of organotypic architecture and subsequent culture characteristics. In particular, tissues obtained at P10–12 have been reported to provide improved morphology and survival, as well as more consistent and homogeneous susceptibility in lesion-based experimental paradigms, compared with tissue from older animals10. This age range is also compatible with established interface culture procedures, which are commonly performed using brain tissue from P6–9 rat pups11. Microglial status represents an additional consideration when selecting the experimental timeline. Tissue slicing induces an acute activation response in resident microglia, and approximately 7–14 days in vitro may be required before these cells recover a resting, ramified morphology; allowing such a maturation period before experimental manipulation has therefore been recommended12. Collectively, these observations support the use of P6–P14 donor animals as a practical range that combines adequate slice viability and preservation of tissue organization with a feasible period for microglial compartment recovery before the application of the experimental conditions described in this protocol.
פרוטוקול
Animal use was restricted to euthanasia performed exclusively for the collection of organs and tissues, pursuant to §4(3) in conjunction with §7a(2) No. 1 TierSchG (competence and animal welfare officer oversight) of the German Animal Welfare Act (TierSchG) and Article 1(5) of Directive 2010/63/EU. Accordingly, these procedures were not classified as animal experiments subject to authorization under §8 TierSchG. Euthanasia and subsequent tissue and organ collection were carried out by appropriately trained personnel under the oversight of the institutional animal welfare officer and in compliance with the requirements specified in Annex IV of Directive 2010/63/EU.
1. Preparation of rat organotypic brain slice cultures
NOTE: This medium/agarose preparation can be performed in advance and stored.
- Brain slice culture medium
- To prepare approximately 100 mL of brain slice culture medium, combine 0.8 g MEM powder, 44.57 mL distilled water, 25 mL HBSS, 1.2 mL of 10% glucose, 2 mL of 200 mM L-glutamine, 100 µL of 4 mM ascorbic acid, 50 µL of media supplements (ITS, SITE, SPIT, SPITE, or Fatty Acid-Albumin supplement), 580 µL of 7.5% bicarbonate, and 500 µL of 1 M Tris base in the listed order. Subtotal: ≈74 mL (before serum addition - see step 1.1.2).
- Sterile-filter the mixed solution (e.g., through a 0.22 µm membrane filter) into a sterile vessel. Add 25 mL heat-inactivated horse serum, bringing the total volume to 100 mL. Adjust the pH to 7.4 by adding hydrochloric acid (HCl) dropwise while monitoring with a calibrated pH-meter.
CAUTION: Hydrochloric acid (HCl) is highly corrosive and may cause serious burns to the skin and severe eye injury, while exposure to HCl vapors can irritate the respiratory system. All handling should be performed in a chemical fume hood or an adequately ventilated workspace, using appropriate personal protective equipment, including safety goggles or a face shield, chemical-resistant gloves (e.g., nitrile), and a laboratory coat. Dispense HCl slowly and dropwise to minimize the risk of splashing. In the event of a spill, use a suitable acid-neutralizing spill material and dispose of the resulting waste in accordance with institutional hazardous chemical waste regulations. A functional eyewash station and emergency safety shower should be readily accessible whenever HCl is handled. - Aliquot the finished medium into 50 mL centrifuge tubes under sterile conditions. Store the culture medium at 4 °C for up to 3 weeks.
- Brain slice dissection medium
- To prepare 100 mL of brain slice dissection medium, combine 1.6 g of MEM powder, 100 mL of distilled water, 1 mL of 10% glucose, 1 mL of 200 mM L-glutamine, 1 mL of 1 M Tris base, and 1 mL of penicillin/streptomycin in the listed order.
NOTE: The resulting subtotal is approximately 104 mL before serum addition (see step 1.2.2). - Sterile-filter the mixed solution (e.g., through a 0.22 µm membrane filter) into a sterile vessel. Add 5 mL heat-inactivated horse serum, bringing the total volume to approximately 109 mL per 100 mL nominal batch.
- Adjust the pH to 7.4 by adding hydrochloric acid (HCl) dropwise while monitoring with a calibrated pH-meter.
CAUTION: HCl is corrosive and causes severe skin or eye damage (see above). - Aliquot the finished medium into 50 mL centrifuge tubes under sterile conditions. Store the dissection medium at 4 °C for up to 3 weeks.
- To prepare 100 mL of brain slice dissection medium, combine 1.6 g of MEM powder, 100 mL of distilled water, 1 mL of 10% glucose, 1 mL of 200 mM L-glutamine, 1 mL of 1 M Tris base, and 1 mL of penicillin/streptomycin in the listed order.
- Agarose 5% preparation
- Add 5 g of agarose powder to 95 mL of phosphate-buffered saline (PBS) to prepare 5% agarose.
- Heat the solution intermittently in a microwave until the agarose is completely dissolved, avoiding overboiling. Cool the agarose to 40 °C in a water bath before use.
CAUTION: Heated agarose solutions may suddenly boil or bump, posing a risk of serious thermal burns. Warm the solution in brief intervals and gently swirl the container between heating steps to distribute heat evenly. The vessel should never be tightly closed during heating. Wear appropriate eye protection and heat-resistant gloves when removing the container from the microwave, and allow the solution to cool to the required temperature before further handling. Avoid excessive heating, particularly in a closed container, as increased internal pressure may cause sudden vessel failure or rupture.
NOTE: Agarose 5% can be stored in a 60 °C incubator for up to 2 weeks.
- Brain tissue collection (schedule for the whole time flow, see Figure 1)
NOTE: Section 1.4 (brain tissue collection) and section 2 (cell culture, fluorescent labeling, and spheroid generation) can be performed in parallel.- Obtain postnatal day 6–14 (P6–14) Fischer 344 rats from the in-house facility.
NOTE: House animals according to institutional guidelines under a 12 h light/12 h dark cycle with ad libitum access to food and water. - Perform euthanasia by cervical dislocation using large, sterilized scissors. Rinse head with 70% isopropanol.
CAUTION: This procedure involves animal euthanasia and the use of sharp surgical instruments and must be performed only by appropriately trained and authorized personnel. Wear appropriate PPE, including gloves, a laboratory coat, and eye protection, to minimize exposure to biological materials and risk of sharp injuries. Handle scissors and other instruments carefully and decontaminate or dispose of them in accordance with institutional biosafety procedures. Euthanasia must comply with applicable institutional and legal requirements and be appropriate for the age of the animals (see Ethics Statement). Isopropanol is flammable and irritant. Handle with appropriate personal protective equipment in a ventilated area, and keep away from heat and ignition sources. - Transfer the head into a petri dish. Expose the skull with small scissors by cutting the skin along the midline from the neck toward the eyes. Reflect the skin laterally (scalp to both sides).
CAUTION: Use dissection scissors carefully, keeping fingers clear of the cutting path. - Open the skull by inserting small scissors at the foramen magnum and cutting the soft bone forward toward the eyes. Remove both halves of the skull roof using forceps.
- Remove the brain aseptically with a fine spatula and immediately transfer the brain into ice-cold dissection medium to rinse off residual blood.
- Obtain postnatal day 6–14 (P6–14) Fischer 344 rats from the in-house facility.
- Generation, cultivation, and microglia-depletion of brain slices (Figure 2)
- Keep the dissection medium on ice and transfer two brains at a time to the laboratory. Proceed immediately with slicing.
- Remove the cerebellum using a scalpel and place two brains in a row (one behind another) into a small Ø 6 cm Petri dish. Orient the brains with the ventral surface facing downward in the dish.
CAUTION: Use dissection scissors carefully, keeping fingers clear of the cutting path. Dispose of sharp objects in an approved container. - Pour warm 5% agarose at 37 °C into the dish until the brains are completely covered. Allow agarose to polymerize on ice for 2 min. After complete polymerization, remove the agarose cake containing the two embedded brains from the petri dish mold.
CAUTION: Before embedding brain tissue, agarose must be cooled down; otherwise, heat will damage/fix tissue and can burn skin on contact. - Trim excess agarose from the sides of the circular agarose block. Keep both brains completely embedded in agarose while trimming.
- Fix the agarose block containing the two embedded brains onto the vibratome plate in a rostral–caudal orientation using superglue. Cut the agarose between the two brains, keeping both brains fully embedded. Separate the blocks sufficiently to allow one brain to be sliced at a time.
CAUTION: Handle cyanoacrylate in a ventilated area and avoid skin and eye contact; follow institutional first-aid procedures after accidental exposure. - Mount the vibratome plate in the vibratome and immerse the sample in dissection medium maintained at 4 °C on ice.
- Cut the brains using a vibratome (Leica VT1200 S) with the following settings: slice thickness, 350 µm; frequency, 4.8/s; speed, 5.
CAUTION: Avoid contact with the vibratome blade and use appropriate tools for blade handling and disposal. - Transfer each slice individually into a Petri dish filled with dissection medium on ice using a spatula and brush. Allow the surrounding agarose to detach during transfer or while the slice floats in the collection dish.
- After slicing is complete, select suitable parahippocampal slices under a stereomicroscope (binocular microscope). Cut each selected slice in the middle to obtain two hippocampal slices (one from each hemisphere).
- Place two hemisphere slices onto each 0.4 µm cell culture insert in a 6-well plate containing 1 mL of culture medium. Position the slices on the insert membrane so that they are supplied with medium from below. Remove excess dissection medium from the top of the slices or from around the slices within the cell culture insert using a 200 µL pipette (Figure 2).
NOTE: Maintain a culture-medium volume of exactly 1 mL/well at each medium exchange, as volume variations will affect subsequent chemokine/cytokine concentration measurements. - Discard non-suitable or non-hippocampal slices or use them for microglial isolation if required.
NOTE: This step is optional; unsuitable or non-hippocampal slices may be discarded or used for a separate microglia isolation workflow, depending on downstream requirements. - Culture slices at 37 °C and 5% CO₂. Perform the first medium change after 24 h, then start the 10-day pretreatment phase (Figure 1).
- For the first medium change after 24 h, replace the culture medium with either PBS (microglia-native condition) or PLX5622 (microglia-depleted condition), and incubate for 72 h. For this purpose, adjust the final PLX5622 concentration to 2 µM.
CAUTION: PLX5622 is a pharmacologically active CSF1R inhibitor. Handle powder and stock solutions using appropriate personal protective equipment and local exhaust ventilation, and dispose of contaminated materials in accordance with institutional chemical waste procedures. - Exchange the culture medium by removing the old medium completely, adding 1 mL of untreated culture medium to both conditions, and incubating for 48 h (PLX-washout).
- Remove and discard the old culture medium completely, then apply 1 mL of culture medium with PBS (microglia-native condition) or 2 µM PLX5622 (microglia-depleted condition), and incubate for 72 h.
- Replace the culture medium with untreated medium under both conditions, then incubate for 48 h (PLX-washout).
- Conduct a final medium change at the end of the pretreatment phase, add medium with or without pharmacological treatment (as needed), marking d0 of the treatment phase. Remove the old culture medium completely, and this time store the collected supernatant at -80 °C for subsequent baseline (d0) secretome analysis. Add the appropriate pharmacological treatment to the culture medium before distributing to the wells (if required for different conditions), IL-10 (final concentration in medium 20 ng/mL or 60 ng/mL), Dexamethasone (final concentration in medium 0.1 µg/mL or 1.0 µg/mL) or Danirixin 10 ng/mL (also applicable for medium exchanges at d3 and d6, see step 3.1).
NOTE: Microglial depletion after PLX5622 pretreatment can be verified by Iba1 staining of d0 cryosections, while microglial repopulation can be evaluated by Iba1 staining of d7 control sections following the treatment period. Potential effects on other cellular populations, including astrocytes, can be assessed by GFAP immunofluorescence (see under step 5.). Corresponding analyses of microglial depletion and re-growth, together with preservation of GFAP-positive astrocytes, are presented in the Representative Results section. - After the medium exchange, place the prepared cell-line spheroids onto the OBSCs as described in section 2.
NOTE: Pharmacological treatment is optional and depends on the experimental question; untreated conditions should be carried along in parallel as controls.
2. Live cell fluorescence staining and preparation of rat glioma/astrocyte cell line spheroids and placement on rat OBSC
NOTE: In parallel with OBSC preparation and pretreatment (Figure 1), culture and fluorescently label the respective cell lines and generate spheroids for subsequent placement onto the OBSCs.
- For basal culture medium DMEM (Dulbecco’s Modified Eagle’s Medium) mix 500 mL (NaHCO3 3.7g/L, D-Glucose 4.5 g/L, low endotoxin) with 5 mL of Penicillin/Streptomycin (10,000 U/mL) solution, 5 mL of L-Glutamine (200 mM) solution, and 50 mL Fetal bovine serum (FBS). Incubate at 37 °C, with 5% CO₂ and humidity kept near saturation at 95% relative humidity.
- Culture cells in complete medium containing FBS until ready for labeling (at 90% confluence). Detach cells using trypsin: Wash cells gently once with 5 mL of PBS (1 min incubation at room temperature, carefully remove PBS by aspiration. Then add 5 mL of 1X trypsin/EDTA solution to cover the entire bottom of the culture flask, and incubate at 37 °C for 4 min. Detach also mechanically at the end of incubation by gently tapping the side of the culture flask. Verify complete detachment of all cells under a microscope. Count cells; take a volume to obtain 1 x 10⁶ cells; centrifuge at 350 x g for 5 min (at 4 °C); then remove the supernatant and resuspend in 1 mL PBS to obtain 1 x 10⁶ cells/mL.
- Add 5 µL of CellBrite Green (Neuro-DiO / DiIC₁₈(3)) to the cell suspension (at 1 x 10⁶ cells/mL in PBS = 1:2,000 dilution) and incubate for 30 min at 37 °C.
CAUTION: CellBrite Green is a lipophilic fluorescent dye supplied in an organic solvent carrier; avoid skin/eye contact and inhalation of concentrated stock. Wear gloves and eye protection when pipetting the concentrated dye, and work in a biosafety cabinet if handling cultured cell lines. - Wash the labeled cells by centrifuging cells at 350 x g for 5 min (at 4 °C), discard supernatant, and resuspend in PBS. Repeat the washing step once more. Verify labeling quality by fluorescence microscopy (e.g., Olympus IX70).
- Prepare 1% agarose in PBS for coating the 96-well plates. Heat the agarose solution intermittently in a microwave until completely dissolved and clear.
CAUTION: Heat the agarose intermittently to prevent sudden boiling or spillage. Follow the precautions described in the CAUTION after step 1.3.2. - Coat the wells of a 96-well plate with a non-adhesive agarose layer by adding 100 µL of hot 1% agarose solution to the bottom of each well.
- Allow agarose to solidify and incubate the coated plate for 2 days at 37 °C. Then seed cells to form spheroids.
NOTE: Keeping plates for more than 2 days can lead to unwanted results due to the degradation of the agarose coating. - Prepare a cell suspension in complete medium (medium + FBS) at a concentration that yields 4,000 cells per 100 µL.
- Add 100 µL of the cell suspension (4,000 cells/well) onto the agarose-coated wells. Incubate the plate at 37 °C and 5% CO₂ with humidity kept near saturation at 95% relative humidity. After 3 days, verify spheroid formation by microscopy: cells should have aggregated into spheroids.
- Remove the spheroids from the 96-well plate under a stereomicroscope using a 200 µL pipette and transfer them to a wide Petri dish.
- Using a fresh pipette tip, aspirate one spheroid from the Petri dish under a stereomicroscope while minimizing the volume of medium aspirated.
- Position the pipette tip above the parahippocampal area and gently dispense the spheroid onto the OBSC. Avoid contacting the OBSC with the pipette tip or dispensing excessive medium onto the tissue.
- Acquire baseline fluorescence and bright-field images using the standardized acquisition settings described in steps 3.3–3.8. Use identical exposure times and gain settings for all samples and save the images in the specified file formats.
3. Treatment and observation of spheroid outgrowth on OBSC
- Exchange culture medium (with or without pharmacological treatment, as described in step 1.5.17) during the treatment phase twice, 72 h after spheroid placement (d3) and after another 72 h (d6). Collect supernatant/conditioned medium in a 1.5 mL microcentrifuge tube and store at -80 °C.
NOTE: In general, immunostainings are performed on d7 (at the end of the treatment phase), proteome profiler analyses are conducted on supernatants from d0, d3, and d6. - Image the spheroids by fluorescence and bright-field microscopy on days 0 and 7. Retain matched d0 and d7 images of each spheroid/OBSC for subsequent quantification of tumor outgrowth using Olympus cellSens Dimension software (see Representative Results – Evaluation of outgrowth by fluorescent-area measurement).
NOTE: Imaging must be performed on d0 and d7. Quantitative image analysis may be performed later. - Switch on the Olympus IX70 microscope, camera, and fluorescence illumination source. Allow the light source to stabilize for 5–15 min, as appropriate. Start cellSens Dimension and confirm that an active camera feed is present.
- Select the 2X objective and the fluorescence filter set appropriate for CellBrite Green (excitation ~488–515 nm; emission ~515–545 nm; standard FITC/GFP filter set). Direct the optical path to the camera.
- Open the acquisition settings and set the exposure time to 1,000 µs, gain to 0/off, magnification to 2X, and binning to 1 x 1 unless another binning setting has been standardized for the complete experiment.
NOTE: Maintain identical acquisition parameters across all samples and time points used for outgrowth comparison. With exposure fixed at 1,000 µs and gain at 0, confirm before batch acquisition that fluorescence remains within the camera's dynamic range without saturation or loss of relevant signal below the threshold. Validate the 20 threshold against an appropriate negative/no-stain control for the specific imaging configuration. - Locate and center the spheroid under brightfield/transmitted illumination and bring it into focus. Use fluorescence illumination only when required to minimize photobleaching.
- Switch to the CellBrite Green fluorescence channel, perform fine-focus adjustment to obtain a clearly defined spheroid perimeter, and acquire the image using the standardized settings specified above.
- Save the raw acquisition in the native cellSens format (VSI/OIR). Export a TIFF copy for quantitative analysis and, if required, a BMP copy for visualization. Apply a consistent file-naming scheme, e.g., SampleID_Day_Timepoint_2X_1000us.
NOTE: Keep illumination, exposure, gain, magnification, and other relevant acquisition parameters constant throughout the complete imaging series. - Threshold-based quantification of fluorescent area
- Open the corresponding TIFF image in cellSens Dimension. TIFF files are preferred for quantitative analysis because they retain original pixel-intensity information.
- Open the Count and Measure module or Threshold function and select the fluorescence image/channel for segmentation.
- Apply an intensity threshold with a lower limit of 20 and an upper limit corresponding to the maximum of the applicable intensity scale (e.g., 255 for 8-bit images). Verify that the resulting overlay includes the fluorescent spheroid area while excluding the background signal.
- Apply the threshold to generate the segmented region or binary mask. Measure the selected fluorescent area using the Count and Measure function and record the resulting pixel area.
- If the 2X objective has been spatially calibrated for the specific microscope/camera configuration, report the area directly in µm2. Alternatively, calculate:
Area (µm2) = Area (pixels) × [pixel size (µm)]2
NOTE: Verify that the calibration corresponds to the specific 2X objective and camera configuration used for image acquisition. - Record the measured pixel area and, where applicable, the calculated area in µm2 for each spheroid and time point. Use the same threshold value (20) and spatial calibration throughout the dataset.
- Day 7 Tissue-Tek embedding and freezing
- Following d7 imaging, remove and discard the remaining medium/supernatant. Remove the insert containing the OBSC and dry the underside of the porous membrane. Mark the membrane adjacent to the OBSC with “A” or “B” using a black overhead marker.
- Cover the OBSC and membrane with room-temperature Tissue-Tek and immerse the assembly in liquid nitrogen for rapid freezing.
CAUTION: Liquid nitrogen (-196 °C) poses cryogenic burn and oxygen displacement hazards. Use appropriate cryogenic PPE and handling tools, work in a well-ventilated area, and never confine liquid nitrogen in a sealed container. - Maintain the sample under freezing conditions until the Tissue-Tek containing the OBSC is completely solidified.
- Using a scalpel, excise the porous plastic membrane from the insert base. Remove the surrounding membrane and release the frozen Tissue-Tek block containing the OBSC. The overhead-marker label transfers to the frozen block, permitting subsequent identification as A or B.
CAUTION: Frozen samples and scalpels present combined cold-contact and sharps hazards. Use appropriate cryogenic protection and standard sharps precautions during block removal. - Transfer the Tissue-Tek block into a labeled, pre-cooled bag. Maintain the sample on dry ice during handling or transport and subsequently store at -80 °C until cryosectioning and immunofluorescence analysis, if required.
CAUTION: Dry ice (-78.5 °C) can cause cold burns and releases CO₂. Handle with insulated gloves and use only appropriately ventilated storage and transport containers.
NOTE: This represents the final stopping point of the culture and embedding workflow. Frozen Tissue-Tek blocks may be maintained at -80 °C until subsequent cryosectioning and immunostaining.
4. Semi-quantitative screening in pooled samples with membrane-based Proteome Profiler (Rat XL Cytokine Array Kit)
NOTE: Stored supernatants may subsequently be analyzed for chemokine/cytokine profiles according to the manufacturer's protocol using the Proteome Profiler Rat Cytokine Array Kit, Panel A. For semi-quantitative screening, supernatants from replicate wells of the same condition may be pooled (see Step 4). Chemokines of interest identified by screening may subsequently be quantified by ELISA using individual-well samples (optional). Compare conditions with versus without neoplastic spheroids, microglia, and, where applicable, pharmacological treatment to identify microglia-dependent differences in chemokine/cytokine secretion.
- Prepare buffers, chemical reagents, and antibody cocktails (as stated in the manufacturer’s handbook). Dissolve the detection antibody cocktail in 200 µL distilled water.
- Mix 40 mL of 1× Wash Buffer with 960 mL of distilled water to prepare 1,000 mL of Wash Buffer. Mix Chemi Reagents 1 and 2 in equal volumes within 15 min before use.
CAUTION: Handle chemiluminescent reagents with gloves and eye protection, minimize light exposure, and dispose of residual reagent according to institutional chemical-waste procedures.
NOTE: 1 mL of the resulting mixture is required per membrane and should be protected from light. - Dilute the Streptavidin-HRP in Array Buffer 6 directly before use.
NOTE: For screening purposes, 8 samples per condition were pooled. Sample pooling is a semi-quantitative screening strategy selected for this protocol to reduce the number of arrays; it is not required if sufficient array membranes/budget are available to run samples individually. - Thaw the supernatants of interest on ice and centrifuge at 420 x g for 5 min at 4 °C. Pool 500 µL from each of eight samples from the same condition to obtain a total volume of 4 mL in a 5 mL tube. Repeat for the remaining three conditions.
- Distribute each 4 mL pooled sample equally among four 2 mL microcentrifuge tubes by adding 1 mL per tube. Repeat for each experimental condition.
- Place the microcentrifuge tubes into the rotational vacuum concentrator (RVC 2–25 CDplus) for 15 h to remove the solvent. Set the temperature to 23 °C and 24 mbar for 14 h, then to 20 °C and 24 mbar for 1 h. Set the rotation speed to 1,350 rpm.
NOTE: This is a safe stopping point; samples may remain in the rotational vacuum concentrator overnight if permitted by institutional equipment-use guidelines.
CAUTION: Operate the rotational vacuum concentrator (RVC 2–25 CDplus) according to manufacturer specifications; use vacuum-compatible tubes and avoid overfilling to minimize sample loss or cross-contamination. - Reconstitute each dried sample in 250 µL of PBS and 250 µL of Array Buffer 6, mixing until completely dissolved. Transfer 250 µL from each of the four reconstituted samples under the same conditions into a single tube to obtain a 1 mL pooled sample. Repeat for the remaining conditions.
- Preparation and blocking of the membrane: Pipette 2 mL of Array Buffer 6 into each well of the 4-Well Multi-dish (Array Buffer 6 is the block buffer). Place each membrane in a separate well, with the number facing upward.
NOTE: The blue dye in the spots will disappear upon contact with Array Buffer 6, but the capture antibodies remain at their specific locations. - Incubate the membranes for 1 h at room temperature on a horizontal platform shaker at speed 4, orienting each membrane to rock end-to-end within the well. During blocking, mix each 1 mL pooled sample prepared in the preceding reconstitution step with 0.5 mL of Array Buffer 4 in a separate tube to obtain 1.5 mL of sample mixture.
- Remove Array Buffer 6 from the wells of each 4-Well Multi-dish by aspiration and add the prepared samples. Place the lid on the 4-Well Multi-dish and incubate at 2–8 °C on a horizontal platform shaker at speed 4 overnight.
- Carefully remove the membranes and place them into individual plastic containers with 20 mL of 1X Wash buffer. Rinse the 4-Well Multi-dish with distilled water and dry thoroughly.
- Wash membrane for 10 min in 1X Wash Buffer on a horizontal platform shaker at speed 4. Wash three times in total.
- Dilute 30 µL of Detection Antibody Cocktail in 1.5 mL Buffer 6 and add 1.5 mL of diluted Detection Antibody Cocktail to each well of the 4-Well Multi-dish.
- Carefully remove each membrane from the wash container, drain excess 1X Wash Buffer 6, and put the membranes into each well of the 4-Well Multi-dish (containing the diluted Detection Antibody Cocktail); cover the lid.
- Incubate the membranes for 1 h at room temperature on a horizontal platform shaker at speed 4. After incubation, wash each membrane three times for 10 min in 20 mL of 1× Wash Buffer.
- In the meantime, dilute the Streptavidin-HRP 1:2000 in Array Buffer 6 (9 mL of Array Buffer 6 with 4.5 µL of Streptavidin-HRP from Proteome Profiler Kit) and put 2 mL of this dilution in each well of the 4-Well Multi-dish.
- Place the membrane in the 4-Well Multi-dish containing 1x Streptavidin-HRP, cover with the lid, and incubate for 30 min on a horizontal platform shaker at speed 4.
- Wash each membrane three times for 10 min in 20 mL of 1× Wash Buffer on a horizontal platform shaker at speed 4.
NOTE: Complete steps 4.19–4.24 without interruption. Prepare the Chemi Reagent Mix immediately before use by mixing Chemi Reagents 1 and 2 in equal volumes, allowing 1 mL of mixture per membrane. - Drain excess 1X Wash Buffer by blotting the lower edge onto a paper towel, and place each membrane on the bottom sheet of the plastic sheet protector with the identification number facing up.
- Pipette 1.0 mL of Chemi Reagent Mix evenly over each membrane, ensuring complete coverage.
- Place the top sheet of the plastic sheet protector evenly and without air bubbles onto the membranes, then incubate for 1 min.
- Remove excess Chemi Reagent Mix by gently placing paper towels over and around the plastic sheet protector containing the membranes.
CAUTION: Dispose of Chemi Reagent-contaminated materials as chemical waste and avoid direct contact with residual reagent. - Leaving the membranes on the bottom plastic sheet protector, cover them with plastic wrap and gently smooth out any air bubbles. Wrap excess plastic wrap around the back of the sheet protector so that the membranes and the sheet protector are completely wrapped.
- Place the membranes with the identification number facing up in an autoradiography film cassette. Expose membranes to X-ray film for 1–20 min with multiple exposure times.
- Data analysis
NOTE: Analysis may be performed after image acquisition; digitized films or exposure images can be archived for subsequent evaluation.- After chemiluminescent development, digitize the exposed X-ray film for each membrane at sufficient resolution to distinguish individual spots. Save the image in an uncompressed format, preferably TIFF.
- Open QuickSpots (Western Vision Software) and select the pre-loaded template corresponding to the Proteome Profiler Rat Cytokine Array Kit, Panel A.
- Align the template containing duplicate capture-antibody spots and positive and negative controls with the scanned membrane. Use the positive reference spots at the array corners as registration landmarks for manual or semi-automated alignment.
- Determine the mean pixel density of each spot using the predefined spot boundaries. Area-based measurement accounts for heterogeneous or ring-shaped signal distributions more reliably than single-pixel measurements.
- Background subtraction. Calculate the mean signal of the negative control spots and subtract this value from each analyte signal to correct for membrane background and non-specific signal.
- Duplicate averaging. Average the background-corrected values of the technical duplicate spots to obtain one signal value for each analyte per membrane.
- Data export and comparison. Export the resulting dataset (e.g., CSV or XLSX) for comparison between experimental conditions and subsequent statistical analysis.
NOTE: Proteome Profiler membranes contain control spots with distinct analytical functions: (A) Positive reference spots. The corner reference spots contain a defined amount of unrelated biotinylated protein and serve primarily as technical controls for detection chemistry and as landmarks for template alignment. Their pixel density is not proportional to the amount of sample protein and should not be used for analyte quantification or normalization. They therefore function as positional and assay-quality controls rather than loading controls. (B) Negative control spots. Negative controls contain no relevant capture antibody and represent a non-specific membrane background. Their mean pixel density is subtracted from analyte signals to correct for background and non-specific binding within each membrane. (C) Comparison between membranes. Proteome Profiler arrays are semi-quantitative, and signal intensities from different analytes cannot be directly compared because individual antibody pairs differ in affinity and assay response. Accordingly, analysis should be based on background-corrected signals for the same analyte across membranes or experimental conditions acquired under equivalent assay and exposure conditions. Positive reference spots should not be used as loading-normalization controls. Where absolute quantification of a selected analyte is required, array findings could be validated using a standard-curve-based ELISA (optional).
5. Cryosectioning of OBSC and immunofluorescent Iba1 and GFAP staining
- Retrieve the Tissue-Tek blocks containing the two frozen OBSCs from the -80 °C freezer and transfer them to a cryostat maintained at -20 °C. Equilibrate the blocks in the cryostat for at least 15 min.
- Apply liquid Tissue-Tek to the equilibrated sample holder and position the Tissue-Tek block on top with the exposed OBSC surface facing upward and parallel to the sample holder. Allow the Tissue-Tek to freeze completely to secure the block in position.
- Mount the sample holder with the Tissue-Tek chip into the cryostat and align the chip as parallel as possible to the blade/cutting angle. Cut cryosections from frozen tissue at 7 µm thickness using a cryostat and mount onto adhesive-coated glass slides. Store the mounted slides at −80 °C until immunofluorescence staining.
NOTE: The tumor spheroid is macroscopically visible. Preserve sections passing through the spheroid and surrounding tissue, and collect as many intact sections as possible when sectioning through the spheroid-containing region. - For further staining (e.g., Iba1 for microglia evaluation in the peritumoral area or GFAP for astroglial viability, retrieve the slides from -80 °C, thaw the sections, and allow them to air-dry. Fix sections in 4% paraformaldehyde (PFA) at room temperature for 15 min (for Iba1 staining) or 10 min (for GFAP staining).
- Wash sections in PBS, 3 x 10 min, and then permeabilize sections in 0.1% Triton X-100 in PBS for 10 min. Wash sections in PBS, 2 x 10 min.
- Block non-specific binding with 2% BSA (bovine serum albumin) for 1 h. Incubate sections with unconjugated, polyclonal Iba1 antibody, diluted 1:200, overnight at 4 °C or with unconjugated, polyclonal anti-GFAP antibody, diluted 1:200, overnight at 4 °C.
- Wash sections in PBS, 3 x 10 min. Incubate sections with donkey anti-rabbit secondary antibody conjugated to Rhodamine Red-X, diluted 1:100 in 0.1% BSA, for 2 h at room temperature.
- Wash sections in PBS, 2 x 10 min. Stain nuclei with Hoechst 33342, diluted 1:20,000, for 10 min at room temperature, then wash the sections once in PBS for 2 min. Coverslip slides using DABCO (1,4-Diazabicyclo[2.2.2]octane) as mounting medium, with Menzel Gläser coverslips.
- Acquire whole-slide images using a Nikon Eclipse Ti2 microscope in multichannel mode (DAPI, Cy3, and GFP channels) at 40x magnification using MMI CellTools software, version 6.0. Process and analyze the resulting datasets using ImageJ/Fiji.
NOTE: Immunostaining (Iba1+) should be performed not only on OBSC with spheroids at the end of the treatment phase (for quantitative and qualitative evaluation of peri-spheroidal microglia), but also on non-spheroid control OBSC with and without PLX5622 pretreatment on d0 and d7 to evaluate microglia depletion quality and microglial viability at both timepoints. GFAP staining was performed on non-spheroid control OBSC to evaluate PLX5622's impact on astroglial cells. - ImageJ/Fiji workflow for Iba1+ particle count in the peri-spheroidal area:
- Open Fiji/ImageJ and open the .tiff dataset (whole-slide multichannel) and assign channel identity by Image > Color > Channels Tool and confirm hyperstack with 3 Channels C1=DAPI, C2=Cy3, C3=GFP
- Crop the 35 Field of View (FoV) region centered around the CellBrite Green+ Spheroid by using the rectangle tool (Edit > Selection).
- Duplicate the cropped hyperstack (Image > Duplicate… Duplicate the hyperstack, select channels 1–3, and save the cropped sub-image as TIFF using File > Save as. Eventually re-open the image as shown above or proceed directly to Iba1+ particle analysis.
- Split channels (Image > Color > Split Channels) and select Cy3 channel window.
- Apply thresholding (Image > Adjust > Threshold) and select a standard default method (“Default”) applied across the dataset. Click apply to binarize.
- Run particle analysis with the updated size filter: Analyze > Analyze Particles. Size: 1-Infinity (in µm2), circularity 0.00–1.00 (default), check “Display results”, “Summarize”, “Clear results”, and click OK.
- Extract particle count from the summary window > Count (total Iba1+ particles), Total Area, Average Size, %Area.
- Save output Results Table, Summary Table, and outline/overlay image.
- ImageJ/Fiji workflow for Iba1+ cell count to evaluate microglia depletion:
- Open Fiji/ImageJ and open the .tiff dataset (whole-slide multichannel) and assign channel identity by Image > Color > Channels Tool and confirm hyperstack with 2 channels, C1 = DAPI, C2 = Cy3
- Select and crop 5 random 270 x 170 µm ROIs: Display the composite image with both channels overlaid (Image > Color > Channel Tools, set to “Composite” display mode. Then set the ROI (Edit > Selection > Specify), defining the size with width=270, height=170, and selecting the first ROI at a randomly selected X/Y coordinate within the image.
- Duplicate ROI (both channels) (Image > Duplicate, check “Duplicate hyperstack” (channel range 1–2) and press OK, and save the cropped ROI. Repeat for ROIs #2-#5.
- Re-open each file and set the image to Composite display mode, simultaneously visualizing both channels (Image > Color > Channels Tools > “Composite”. If necessary, adjust brightness and contrast in each channel (Image > Adjust > Brightness/Contrast)
- Activate the Cell Counter Plugin (Plugins > Analyze > Cell Counter)
- Manually inspect the merged image and click on each cell that shows Clear Cy3 labeling and co-localized DAPI+ nucleus, and mark each cell with the Cell Counter tool, adding numbered markers. Note the final count for this ROI.
- Save annotated image with markers (Cell Counter > Results > Save Image). Repeat for each ROI dataset.
- ImageJ/Fiji workflow for GFAP immunofluorescence analysis:
- Open Fiji/ImageJ and open the .tiff dataset (whole-slide multichannel) and assign channel identity by Image > Color > Channels Tool and confirm hyperstack with 2 channels, C1 = DAPI, C2 = Cy3
- Select and crop 3 random 270 x 170 µm ROIs: Display the composite image with both channels overlaid (Image > Color > Channel Tools, set to “Composite” display mode. Then set the ROI (Edit > Selection > Specify), defining the size with width=270, height=170, and selecting the first ROI at a randomly selected X/Y coordinate within the image.
- Duplicate ROI (both channels) (Image > Duplicate, check “Duplicate hyperstack” (channel range 1–2) and press OK, and save the cropped ROI. Repeat for ROIs #2-#3.
- Re-open each file and split channels (Image > Color > Split Channels, select Cy3 channel window). Apply thresholding to segment the GFAP signal (Image > Adjust > Threshold). Select the default method, which must be applied consistently across all ROIs/slides, then click Apply to binarize.
- Convert to binary mask (Process > Binary > Convert to Mask) and measure GFAP+ area (Analyze > Analyze Particles; with size set 0-Ininity, checking “Summarize” to get %Area directly).
- Save the summary table and save the binary masks (File > Save As > Tiff).
NOTE: The thresholding method must be kept identical across all slides in the dataset.
תוצאות
Quantification of microglial depletion, re-growth of microglia over time, and unaffected GFAP-positive cells (astrocytic)
To assess whether PLX5622 pretreatment affects the astrocytic compartment of the OBSC independent of tumor spheroid exposure, non-spheroid-seeded OBSCs were analyzed by immunofluorescence for glial fibrillary acidic protein (GFAP). Slices were cryopreserved in Tissue-Tek at either d0 (immediately following the pretreatment phase, with or without PLX5622) or d7, cryosectioned, and stained for GFAP. No differences in GFAP immunoreactivity were observed, either between d0 and d7 within each condition or between native and PLX5622-pretreated OBSCs, indicating that PLX5622 pretreatment does not alter baseline astrocyte reactivity in the absence of tumor spheroids (Figure 3).
Completeness of microglial depletion and intrinsic repopulation over time. Iba1+ immunofluorescence was performed on non-spheroid-seeded control OBSCs at d0 and d7 to quantify microglial depletion efficiency and subsequent repopulation kinetics. PLX5622-pretreated OBSCs showed significantly fewer Iba1+ cells than native OBSCs at both timepoints, confirming effective depletion. A partial repopulation was evident within the PLX5622-pretreated condition, with Iba1+ cell numbers significantly higher at d7 than at d0; however, this recovery remained incomplete, as Iba1+ cell density in PLX5622-pretreated slices remained significantly below that of native OBSCs throughout the 7-day observation period (Figure 4).
Evaluation of outgrowth with measurement of fluorescent area using a fluorescent microscope
The growth of spheroids was determined using fluorescence area measurement with digital intensity thresholds in rat OBSCs at d0 and d7 of the treatment phase (see Step 3.9 and Figure 5). For the S635 cell line, growth was significantly increased under OBSC conditions pretreated with PLX5622.
Semi-quantitative screening in pooled samples with membrane-based Proteome Profiler
Non-spheroid OBSCs serve as controls to assess baseline signals arising from serum, medium supplements, and other culture components. Despite this background, spheroid-associated changes are readily distinguishable; for example, MMP-3 is undetectable in spheroid-free controls but consistently detected in spheroid-containing conditions, demonstrating sufficient assay specificity to resolve biologically relevant differences in cytokine secretion. This approach enables comparative profiling of chemokines and cytokines, including CXCL2, whose abundance varies with spheroid presence and pharmacological modulation (e.g., microglia depletion, dexamethasone, or IL-10 treatment) (Figure 6). Differentially secreted factors can thereby be identified as candidate mediators of tumor-microenvironment interactions and prioritized for subsequent targeted validation or quantitative analysis.
Post-hoc cryosectioning of OBSC and immunofluorescent Iba1-staining: Evaluation of tumor-microglia cell interactions peritumorally
In the peri-spheroidal region, the number of Iba1+ positive particles varies significantly depending on the pretreatment. Treatment with 0.1 µg/mL dexamethasone did not reduce the Iba1+ signal, whereas treatment with 1 µg/mL dexamethasone significantly reduced the Iba1+ signal under both conditions (native and pretreated with PLX5622). Treatment with a CXCR2-inhibitor (Danirixin) also resulted in fewer Iba1+ particles in the peri-spheroidal region of native OBSCs; in combination with dexamethasone, this decrease is even more pronounced.
Morphologically, we found branched/quiescent microglia in native OBSC without spheroids on d0. In the peri-spheroidal region, we found abundant activated amoeboid microglia on d7. Despite the depletion, we also detected amoeboid microglia in the peri-spheroidal region of the PLX5622-pretreated conditions on d7, albeit to a very limited extent. Immediately after pretreatment with the CSF-1R antagonist PLX5622, only dystrophic microglia with very low Iba1+ signal are detectable (Figure 7).
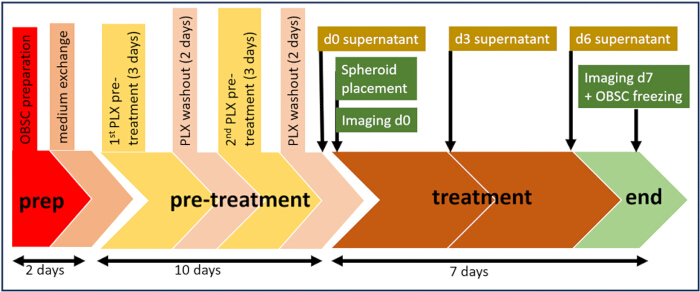
Figure 1: Time plan of pre-treatment and treatment phase. Please click here to view a larger version of this figure.
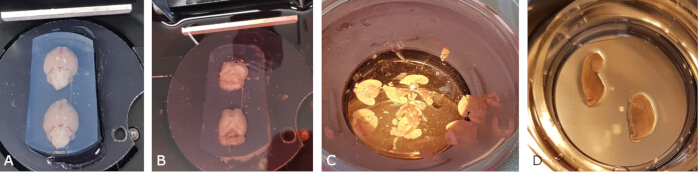
Figure 2: Preparation of rat OBSC. (A) Two agarose-embedded brains, one behind the other, were glued to the vibratome support plate. Embedded brains are separated by a cut into the agarose block. (B) Agarose-embedded brains during vibratome cutting bathed in ice-cold dissection medium. (C) Harvested 350 µm sections, transferred to a petri dish before selection of viable sections. (D) Two parahippocampal sections on the 0.4 µm insert floating on culture medium within the low-evaporation 6-well plate. Please click here to view a larger version of this figure.
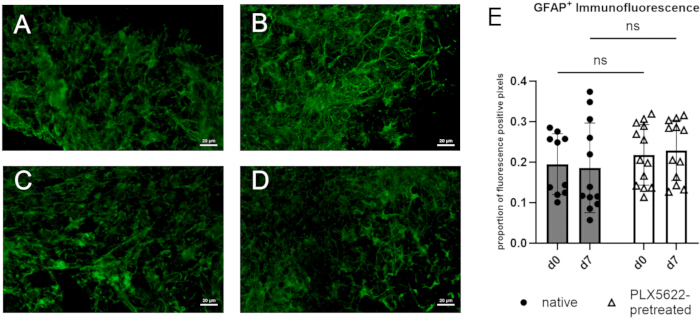
Figure 3: PLX5622 pretreatment does not affect GFAP positivity in control OBSCs (d0 vs. d7). Scale bar = 20 µm. (A) d0/native; (B) d0/PLX5622; (C) d7/native; (D) d7/PLX5622; (E) Scatter dot-plot with mean and standard deviation. Two-way ANOVA: no significant effect of timepoint (p = 0.9690) or pretreatment (p = 0.1936). Adapted from Falter et al. (2023)13. Please click here to view a larger version of this figure.
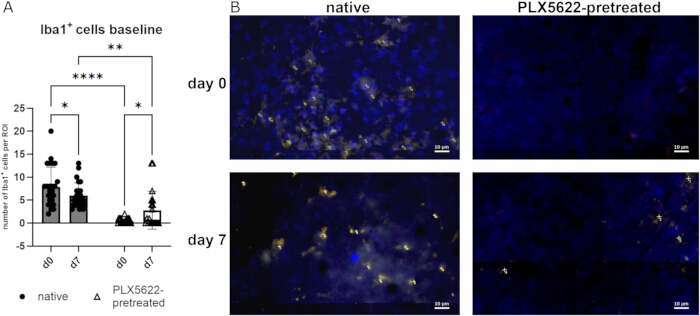
Figure 4: PLX5622 pretreatment reduces Iba1⁺ microglial density at d0 and d7. (A) Scatter dot-plot with mean and standard deviation. Two-factor ANOVA revealed no significant effect of timepoint (p = 0.6539), a significant effect of PLX5622 pretreatment (p < 0.0001), and a significant interaction between time and pretreatment (p = 0.0018). Pairwise comparisons using uncorrected Fisher’s LSD revealed a significantly reduced Iba1 cell frequency on d0 (native vs. PLX5622-pretreated) (p < 0.0001) as well as on d7 (native vs. PLX5622-pretreated) (p = 0.0012). A decrease was observed in microglia in the native condition from d0 compared to d7 (p = 0.0473), and an increase was observed in PLX5622 from d0 compared to d7 (p = 0.0137). (B) Representative images of each condition, scale bar = 10 µm. Iba1 staining (blue: Hoechst33342, yellow: Iba1+) analysis was conducted, counting Iba1+ cells per ROI (size 270 x 170 µm in 40x magnification) on d0 and d7 for native and PLX5622-pretreated microglial sections (with n = 5 sections per condition, each with 5 randomly ROI). Adapted from Falter et al. (2023)13. Please click here to view a larger version of this figure.
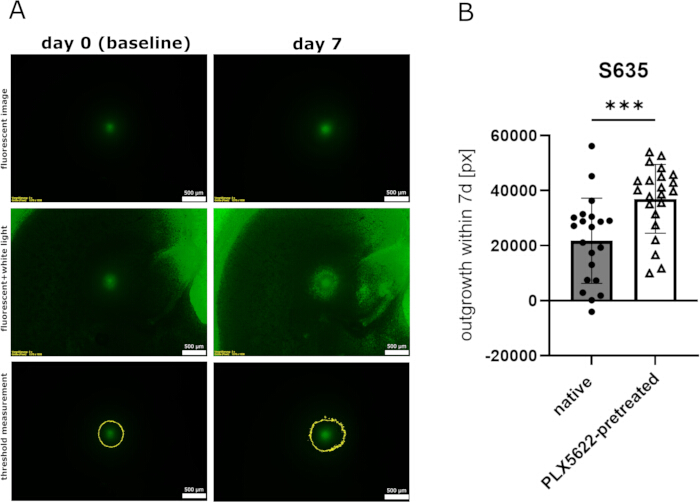
Figure 5: Effects of microglial depletion on spheroid growth. (A) Fluorescently labeled S635 spheroid on PLX5622-retreated OBSC on d0 and d7 as seen in the fluorescent channel (first row), for contextualization with white light (second row) and with thresholded measurement (third row). Scale bar = 500 µm. In this example, the area measured on d0 is 32,339 px and on d7, 48,991 px. (B) Scatter dot-plot with mean and standard deviation. Comparison of spheroid growth in S635 under native OBSC conditions and under PLX5622-pretreated conditions without any other treatment. Spheroid growth was significantly reduced in the S635 cell line under native OBSC conditions (unpaired t-test, p = 0.0010). Please click here to view a larger version of this figure.
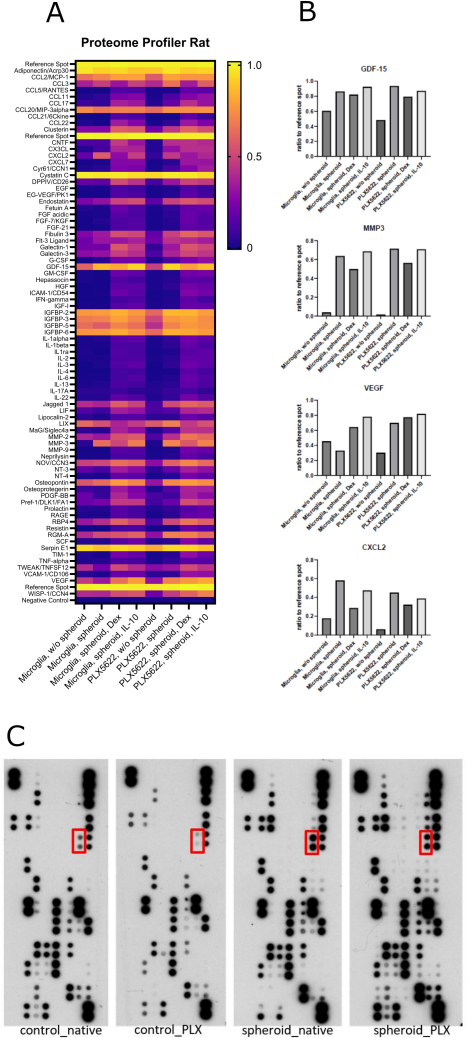
Figure 6: Semi-quantitative evaluation of chemokine secretome. (A) Heatmap of membrane-based rat cytokine array (XL Rat Cytokine, R&D Systems); pooled supernatants (n = 8/condition). Exemplary: MMP3 signal reflects spheroid presence; CXCL2 varies with spheroid presence, PLX5622, and dexamethasone treatment. (B) Exemplary selection of densitometric signal intensities for GDF-15, MMP3, VEGF, and CXCL2. (C) Membranes with differential spot signal intensities. Red square marks the spots (doublets) for CXCL2. Adapted from Falter et al. (2023)13. Please click here to view a larger version of this figure.
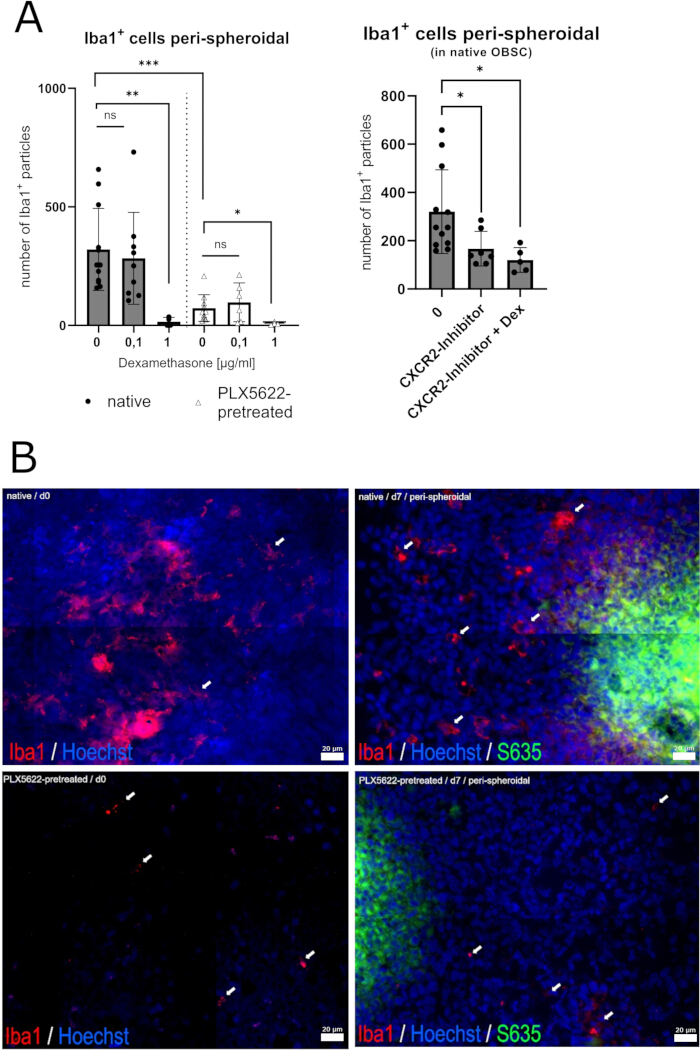
Figure 7: Frequency of Iba1+ peri-spheroidal particles and microglial morphology. (A) Scatter dot-plot with mean and standard deviation. In the peri-spheroidal region on d7 (at the end of the experiment after cryosectioning), we observed a significant effect for dexamethasone treatment and native/PLX5622 pretreatment (two-way ANOVA, no interaction, p=0.1096; effect for dexamethasone treatment, p = 0.0048; effect for native/PLX5622 pretreatment, p = 0.0017). Pairwise comparisons show no significant difference between 0 µg/mL and 0.1 µg/mL dexamethasone under either condition (unpaired t-test, p = 0.6456 [native] and p = 0.4917 [PLX5622]), whereas a comparison of 0 µg/mL and 1 µg/mL dexamethasone in native and PLX5622-pretreated slices revealed significantly fewer Iba1+ particles (unpaired t-test, p = 0.0041 [native] and p = 0.0424 [PLX5622]). When comparing native and PLX5622-pretreated OBSCs without dexamethasone treatment, significantly fewer Iba1+ particles were found in the peri-spheroidal region of PLX5622-pretreated OBSCs (unpaired t-test, p = 0.0003). Moreover, a significant reduction in Iba1+ cells was found in the peri-spheroidal region with the CXCR2 inhibitor (unpaired t-test, p = 0.0408) and after treatment with the CXCR2 inhibitor and dexamethasone (0.1 µg/mL) (unpaired t-test, p = 0.0247). (B) Representative peri-spheroidal microglial morphology, scale bar indicating 20 µm. Ramified microglia in untreated native OBSC (native/d0); amoeboid/activated microglia in native OBSC peri-spheroidal region (native/d7/peri-spheroidal); dystrophic Iba1⁺ microglia in PLX5622-pretreated OBSC (PLX5622-pretreated/d0); sparse amoeboid microglia in PLX5622-pretreated OBSC (PLX-pretreated/d7/peri-spheroidal). Adapted from Falter et al. (2023)13. Please click here to view a larger version of this figure.
דיון
In neuro-oncology, the OBSC model has become highly valued as an ex vivo model6. In addition to its use in brain metastasis research to study the border zone14, the migration and invasion behavior of brain tumors has been investigated using murine OBSC15,16.
Here, we describe the application of a CSF1-Receptor antagonist in an ex vivo rat OBSC to enable comparison of specific microglial immune factor secretion, the influence of pharmacological substances, and their effects on spheroid outgrowth, depending on the presence or absence of microglia and on pharmacological treatment. Organotypic brain slice cultures (OBSC) from postnatal (P6–P14) rats, combined with selective microglial depletion via PLX5622, offer a useful system for theoretically isolating early peritumoral microglia-tumor interactions. However, only the microglial dominance in our model can be considered comparable to the glioblastoma peritumor microenvironment; additional characteristics, such as microglial phenotypes and other immune compartments, are not comparable or validated.
Our readout comprises a semi-quantitative screening method primarily using a membrane-bound proteome profiler of chemokines and cytokines in the supernatant from the rat OBSC. Quantification of the identified chemokines of interest (e.g., by ELISA) can be performed optionally. The cryosectioned OBSC can later be examined at the cellular level with immunofluorescent staining to further evaluate the effects of the treatment phase.
Organotypic brain slice culture (OBSC) is a 3D in vitro/ex vivo model that partially mimics the tumor microenvironment and can replicate phenotypic and functional signatures of the in vivo situation in an ex vivo setting6. Decisive advantages over other 2D or 3D in vitro technologies include the preservation of the tissue's morphological properties and 3-dimensional cytoarchitecture (even without the addition of external growth factors), the preservation of neuronal electrical activity, and the mapping of genetic signatures comparable to the in vivo situation6. In addition, OBSCs are significantly less expensive than in vivo models, and their use reduces the number of animals required, limits stress on these animals, and is therefore in line with the 3R principle (reduce, refine, replace). Due to these advantages, OBSCs are used not only in neuro-oncological research, but also in the fields of neuroscience and neurophysiology (for which the method was initially designed)17, in stroke and traumatic brain injury research18, and in degenerative19, autoimmune, or demyelinating neurological diseases20.
Postnatal tissue
Juvenile brain tissue was selected because it better tolerates prolonged ex vivo culture than adult slices10. However, during this developmental period, microglia remain proliferative and morphologically and transcriptionally immature. They exhibit reduced classical TLR-mediated cytokine responses while retaining substantial plasticity and trained-immunity-like responsiveness21,22. These characteristics may favor investigation of early interactions between migrating glioblastoma cells and surrounding microglia before development of a chronically inflammatory state that could obscure initial tumor–microglia responses.
This developmental context also represents an important limitation. Juvenile microglia are not equivalent to microglia within the adult tumor microenvironment22,23, and their attenuated classical cytokine responses may underestimate the magnitude of inflammatory responses occurring in adult tissue21. Thus, the interpretation of microglia-dependent effects must account for the developmental stage of the donor tissue.
Rodent models and microglia
In addition to rodent OBSCs, human organotypic brain slice cultures and iPSC-derived organoids are increasingly used in neuro-oncological research24. Relevant species-specific differences exist between rodent and human microglia, particularly in gene programs associated with complement signaling, MHC pathways, and lipid metabolism, although comprehensive direct comparisons between rat and human microglia remain limited25.
Rodent OBSCs offer comparatively high reproducibility, broad tissue availability, and standardized experimental procedures. Moreover, selective depletion with PLX5622 allows examination of microglial contributions while retaining the surrounding tissue architecture26. Nevertheless, neither rat OBSCs, human OBSCs, nor iPSC-derived organoids fully reproduce the human peritumoral GBM microenvironment. These ex vivo systems lack functional vascularization, an intact blood–brain barrier, and physiological recruitment of peripheral immune cells, all of which contribute substantially to human disease26.
Human OBSCs retain native human tissue architecture and, when prepared from tumor specimens, preserve aspects of intratumoral heterogeneity and patient-specific treatment responses. Their application is constrained by limited tissue availability, interpatient variability, limited scalability, and relatively short viable culture periods25,6. In contrast, iPSC-derived organoids provide a human genetic background and greater scalability. Incorporation of microglia and vascular components is feasible but remains technically demanding and only partially standardized, while the functional equivalence of iPSC-derived microglia to native human microglia continues to be evaluated27,28. Thus, the different platforms involve trade-offs between experimental control in rodent OBSCs, direct human relevance in human OBSCs, and increased cellular complexity in organoid systems.
Missing cellular and systemic components
Microglial depletion leaves major components of the brain parenchyma, including neurons, astrocytes, and extracellular matrix, largely available for comparison, allowing differences in spheroid outgrowth and migration to be more specifically related to the presence or absence of microglial cells. However, OBSCs lack an intact blood–brain barrier and functional vascular circulation26. Although vascular-associated cells and structures may remain within the slices, their physiological function is altered in the absence of blood flow.
OBSCs additionally lack circulating monocytes/macrophages and other peripheral immune populations that would normally enter brain tumors in vivo. This incomplete representation of the immune tumor microenvironment is an inherent limitation, but it also provides an experimental advantage for the present application. In the absence of peripheral immune-cell recruitment, the contribution of resident microglia within the glioblastoma-associated microglia/macrophage compartment can be investigated more selectively29,30. This setting, therefore, approximates, within the limitations of an ex vivo model, a microglia-dominated peritumoral environment and permits controlled manipulation of the microglial compartment while assessing its influence on the growth and migration of rat glioblastoma spheroids.
The concept that developmental immaturity provides a less confounded representation of early tumor–microglia interactions remains a plausible but experimentally unconfirmed hypothesis. Furthermore, the rat glioblastoma cell line represents only a limited fraction of the genetic and phenotypic heterogeneity observed in human GBM, and the restricted culture period cannot reproduce chronic in vivo tumor evolution. These factors limit direct extrapolation to the human disease. Conversely, the use of species-matched rat glioblastoma cells avoids xenogeneic inflammatory responses that could otherwise confound interpretation of tumor–microglia interactions.
Moreover, limitations of our ex vivo model arise from the possible induction of microglia- or tumor microenvironment-related changes by external stimuli, or possible lasting effects of prior CSF-1R inhibition with PLX5622 on other cell types in the OBSC. Furthermore, the model is not validated for representing the peritumoral brain zone, given the above-mentioned limitations and shortcomings.
Reproducibility of the ex vivo OBSC model depends on rigorous standardization of tissue preparation, microglial depletion, and culture conditions. PLX5622-mediated microglial depletion should be validated, for example, by Iba1 immunostaining. Culture medium volume, exchange frequency, and sampling time points should also be standardized, since differences in dilution and accumulation can directly influence cytokine and chemokine measurements.
Because juvenile microglia may not fully recapitulate adult or even tumor-associated microglial phenotypes, key findings should be interpreted accordingly and, where possible, confirmed using an independent readout such as immunofluorescence analysis of cryosections. Still, it provides an opportunity to examine isolated microglial effects without inducing further peripheral immune responses, as might occur during early tumor progression in the peritumoral microenvironment. Therefore, it makes a valuable contribution to further understanding mechanisms leading to relapse in brain tumors within the peritumoral brain zone.
Future applications could extend the model beyond microglial depletion to selectively manipulate distinct cellular and molecular components of the tumor niche. For example, the system could be adapted to test microglia-modulating compounds, compare tumor spheroids with different genetic backgrounds, or investigate specific cytokine and chemokine pathways using pharmacological or genetic perturbations. Incorporating additional cell types, such as peripheral immune cells, or using alternative tumor models, could further increase its biological scope. Longitudinal live-cell imaging may also allow dynamic assessment of tumor invasion and microglia–tumor interactions rather than relying primarily on endpoint measurements. Beyond that, combining OBSCs with multiplexed secretome profiling, spatial imaging, or transcriptomic approaches could provide a more comprehensive characterization of microenvironmental responses. With appropriate optimization, the technique may therefore serve as an intermediate experimental platform between simplified in vitro systems and resource-intensive in vivo studies, supporting mechanistic investigations, therapeutic screening, and validation of candidate pathways before progression to animal models.
גילויים
The authors have no conflicts of interest to declare.
חומרים
| שם | חברה | מספר קטלוג | הערות |
|---|---|---|---|
| Name of Material/Equipment | Company | Catalog Number | Comments/Description |
| 0.4 µm pore size cell culture inserts | Corning, New York, USA | 353090 | |
| 2-Propanol 70% 1000 ml (Isopropanol) | Carl Roth, Karslruhe, Germany | 67-63-0 | |
| 6-well low evaporation plates | Corning, New York, USA | 353046 | |
| 6-well, 24-well, 96-well plates | TPP, Trasadingen, Schweiz | N/A | |
| adhesive microscope slide Superfrost Plus | Carl Roth, Karslruhe, Germany | H867.1 | |
| Agarose powder | Biozym, Oldendorf, Deutschland | 840004 | |
| Anti-Glial Fibrillary Acidic Protein (GFAP) Antikörper | DAKO, Würzburg, Deutschland | Z0334 | |
| Anti-Iba1-antibody, unconjugated, polyclonal | Thermo Fisher, Braunschweig, Germany | PA5-27436 | |
| Bovine serum albumin | PAA, Pasching, Austria | K41-001 | |
| CellBrite Cytoplasmic Membrane Dye | Biotium, Fremont, CA, USA | #30021 | |
| cellSens Dimension v4 Software | Olympus, Tokyo, Japan | N/A | |
| DABCO (1,4-Diazabicyclo[2.2.2]octane) | Carl Roth, Karslruhe, Germany | 280-57-9 | |
| Danirixin | MedChem Express, New Jersey, USA | #HY19768/CS-5465 | |
| Dexamethasone 8 mg inject | Jenapharm, Jena, Germany | EAN 4251520700888 | |
| DMEM - high glucose | Merck Biochrom, Berlin, Germany | D5671-500ML | |
| Donkey anti-rabbit, conjugated with Rhodamin Red-X | dianova, Hamburg, Germany | 711-295-152 | |
| Falcon Cell culture Inserts | Corning, New York, USA | 353 090 | |
| Fetal bovine serum - FBS 500 ml | Merck Biochrom, Berlin, Germany | 12103C-500ML | |
| Filtropur V50, vacuum filtration unit, 500 mL, PES, 0.22 µm | Sarstedt, Nümbrecht, Germany | 83,39,41,501 | |
| Glucose 10% (20 x 10 mL) | Braun, Melsungen, Deutschland | PZN 03158894 | |
| GrapPad Prism (v9-11) | GraphPad Software, Inc., San Diego, USA | N/A | |
| HBSS | Thermo Fisher, Braunschweig, Germany | 140 250 50 | |
| heat-inactivated horse serum | Life Technologies, Paisley, Vereinigtes Königreich (UK) | 26050 | |
| Hoechst 33342 | Thermo Fisher, Braunschweig, Germany | 62249 | |
| Horizontal shaker (WS-10) | Edmund Bühler, Hechingen, Germany | N/A | |
| Horse Serum | Thermo Fisher, Braunschweig, Germany | 26050-088 | |
| ImageJ (Fiji) | N/A | ||
| Insulin Transferrin NaSelenit Supplement | Sigma-Aldrich, St. Louis, USA | I 1884 | |
| L-Ascorbic Acid | Sigma-Aldrich, St. Louis, USA | A4544 | |
| Leica CM 1950, Cryostat | Leica Biosystems, Wetzlar, Deutschland | N/A | |
| L-Glutamine (200mM) 100ml | Sigma-Aldrich, St. Louis, USA | G7513-100ML | |
| Low melt Agarose | Biozym Scientific GmbH, Hessisch Oldendorf, Germany | 840 100 | |
| MEM powder | Life Technologies, Paisley, Vereinigtes Königreich (UK) | 11700-077 | |
| Menzel Gläser coverslips | Thermo Fisher, Braunschweig, Germany | N/A | |
| MMI CellTools, version 6.0 | Molecular Machines & Industries, Eching, Germany | N/A | |
| murine IL-10 | PeproTech GmbH, Hamburg, Deutschland | 1008110 | |
| Nikon Eclipse Ti2 | Nikon, Amstelveen, Netherlands | N/A | |
| Olympus IX 70, Inverted fluorescence microscope | Olympus, Tokyo, Japan | N/A | |
| Paraformaldehyde, 500 g | Carl Roth, Karslruhe, Germany | 30525-89-4 | |
| Penicillin/Streptomycin (10.000 U/ml) 100ml | Thermo Fisher, Braunschweig, Germany | 15140122 | |
| PLX5622 | MedChem Express, New Jersey, USA | HY-114153/CS-0077157 | |
| Proteome Profiler Rat Cytokine Array Kit, Panel A | R&D Systems, Minneapolis, USA | Cat.-No. ARY008 | |
| QuickSpots Image-Analysis-Software (Version 22.0.1b) | Western Vision, Inc., Layton, Utah, USA | N/A | |
| Rotational vacuum concentrator RVC 2-25 CDplus | Martin Christ Gefriertrocknungsanlagen GmbH, Germany | N/A | |
| Roticoll1 Kleber | Carl Roth, Karslruhe, Germany | 0258.1 | |
| small Ø 6 cm Petri dish | Greiner Bio-One, Schwerte, Germany | 628161 | |
| TissueTek O.C.T. compound | Sakura Finetek,Torrance, CA, USA | N/A | |
| Triton X-100, 0.1% | Sigma-Aldrich, St. Louis, USA | X100 | |
| Trypsin/EDTA solution 100ml | Merck Biochrom, Berlin, Germany | T3924-100ML | |
| Vibratom Leica VT1200 S | Leica Biosystems, Wetzlar, Deutschland | N/A |
מקורות
- Ostrom QT et al. National-level overall survival patterns for molecularly-defined diffuse glioma types in the United States. Neuro Oncol 2023; 25(4):799-807.
- González-Tablas Pimenta M et al. Tumor cell and immune cell profiles in primary human glioblastoma: Impact on patient outcome. Brain Pathol 2021; 31(2):365-80.
- Müller S et al. Single-cell profiling of human gliomas reveals macrophage ontogeny as a basis for regional differences in macrophage activation in the tumor microenvironment. Genome Biol 2017; 18(1):234.
- Wang F et al. Turning attention to tumor-host interface and focus on the peritumoral heterogeneity of glioblastoma. Nat Commun 2024; 15(1):10885.
- Bonis P de et al. The influence of surgery on recurrence pattern of glioblastoma. Clin Neurol Neurosurg 2013; 115(1):37-43.
- Steindl A, Valiente M. Potential of ex vivo organotypic slice cultures in neuro-oncology. Neuro Oncol 2025; 27(2):338-51.
- Lu J et al. Spatiotemporal and metabolic heterogeneity of tumor-associated macrophages in glioblastoma: from single-cell insights to therapeutic targeting. Front Cell Dev Biol 2026; 14:1774215.
- Stonedahl S, Leser JS, Clarke P, Tyler KL. Depletion of Microglia in an Ex Vivo Brain Slice Culture Model of West Nile Virus Infection Leads to Increased Viral Titers and Cell Death. Microbiol Spectr 2022; 10(2):e0068522.
- Thompson SM, Cai X, Dinocourt C, Nestor MW. The Use of Brain Slice Cultures for the Study of Epilepsy. In: Models of Seizures and Epilepsy. Elsevier; 2006. p. 45-58.
- Humpel C. Organotypic brain slice cultures: A review. Neuroscience 2015; 305:86-98.
- Stoppini L, Buchs P-A, Muller D. A simple method for organotypic cultures of nervous tissue. J Neurosci Methods 1991; 37(2):173-82.
- Wang Q, Andreasson K. The organotypic hippocampal slice culture model for examining neuronal injury. J Vis Exp 2010; (44).
- Falter J et al. CXCR2-Blocking Has Context-Sensitive Effects on Rat Glioblastoma Cell Line Outgrowth (S635) in an Organotypic Rat Brain Slice Culture Depending on Microglia-Depletion (PLX5622) and Dexamethasone Treatment. Int J Mol Sci 2023; 24(23).
- Blazquez R, Sparrer D, Sonbol J, Philipp J, Schmieder F, Pukrop T. Organotypic 3D Ex Vivo Co-culture Model of the Macro-metastasis/Organ Parenchyma Interface. Methods Mol Biol 2024; 2764:165-76.
- Leidgens V et al. Stattic and metformin inhibit brain tumor initiating cells by reducing STAT3-phosphorylation. Oncotarget 2017; 8(5):8250-63.
- Eyüpoglu IY et al. Malignant glioma-induced neuronal cell death in an organotypic glioma invasion model. Technical note. J Neurosurg 2005; 102(4):738-44.
- AlaylioĞlu M, Dursun E, Yilmazer S, Ak DG. A Bridge Between in vitro and in vivo Studies in Neuroscience: Organotypic Brain Slice Cultures. Noro Psikiyatr Ars 2020; 57(4):333-7.
- Li Q, Han X, Wang J. Organotypic Hippocampal Slices as Models for Stroke and Traumatic Brain Injury. Mol Neurobiol 2016; 53(6):4226-37.
- Richter M, Vidovic N, Biber K, Dolga A, Culmsee C, Dodel R. The neuroprotective role of microglial cells against amyloid beta-mediated toxicity in organotypic hippocampal slice cultures. Brain Pathol 2020; 30(3):589-602.
- Kipp M et al. Experimental in vivo and in vitro models of multiple sclerosis: EAE and beyond. Mult Scler Relat Disord 2012; 1(1):15-28.
- Carroll JA, Race B, Williams K, Striebel JF, Chesebro B. Innate immune responses after stimulation with Toll-like receptor agonists in ex vivo microglial cultures and an in vivo model using mice with reduced microglia. J Neuroinflammation 2021; 18(1):194.
- Perez-Pouchoulen M, VanRyzin JW, McCarthy MM. Morphological and Phagocytic Profile of Microglia in the Developing Rat Cerebellum. eNeuro 2015; 2(4).
- Wurm J, Konttinen H, Andressen C, Malm T, Spittau B. Microglia Development and Maturation and Its Implications for Induction of Microglia-Like Cells from Human iPSCs. Int J Mol Sci 2021; 22(6).
- Bak A et al. Human organotypic brain slice cultures: a detailed and improved protocol for preparation and long-term maintenance. J Neurosci Methods 2024; 404:110055.
- Geirsdottir L et al. Cross-Species Single-Cell Analysis Reveals Divergence of the Primate Microglia Program. Cell 2019; 179(7):1609-1622.e16.
- Petralia CCT, D'amico AG, D'Agata V, Broggi G, Barbagallo GMV. Ex Vivo Organotypic Brain Slice Models for Glioblastoma: A Systematic Review. Cancers (Basel) 2026; 18(3).
- Raguin J et al. Human cerebral organoids with microglia and vasculature model glioma stem cell interactions and radiotherapy response. Cell Rep Methods 2026; 6(6):101425.
- Sabogal-Guaqueta AM et al. Brain organoid models for studying the function of iPSC-derived microglia in neurodegeneration and brain tumours. Neurobiol Dis 2024; 203:106742.
- Delbridge ARD et al. Organotypic Brain Slice Culture Microglia Exhibit Molecular Similarity to Acutely-Isolated Adult Microglia and Provide a Platform to Study Neuroinflammation. Front Cell Neurosci 2020; 14:592005.
- Masuch A, Biber K. Replenishment of Organotypic Hippocampal Slice Cultures with Neonatal or Adult Microglia. Methods Mol Biol 2019; 2034:127-47.