This exploratory paired metagenomic study examines short-term gut microbiota changes before and after ceftizoxime treatment and clinical recovery in college students with acute enteritis, identifying temporal species-level restructuring without attributing the observed changes specifically to antibiotic exposure.
מאמר מחקר
Paired Exploratory Metagenomic Analysis of Gut Microbiota Before and After Ceftizoxime Treatment in College Students with Acute Enteritis
במאמר זה
סיכום
תקציר
This study explored the short-term changes in gut microbiota concurrent with ceftizoxime sodium therapy and clinical recovery in college students with acute enteritis. A retrospective, self-controlled before-and-after design was adopted, enrolling 10 college students (5 males, 5 females; aged 18–24 years) with acute enteritis admitted to Southwest University Hospital. Fecal samples were collected before intravenous antibiotic treatment and at the time of clinical recovery (5–7 days later). All patients received intravenous ceftizoxime sodium (1.0 g every 12 h). Metagenomic sequencing was performed to analyze microbiota composition and diversity. We hypothesized that short-term ceftizoxime therapy would induce detectable species-level restructuring without substantially altering higher-level diversity. Phylum-level analyses showed no statistically significant differences between the two groups. Also, α-diversity analysis at the genus level revealed that the Shannon, Simpson, and Chao1 showed no differences between the two groups (q = 0.054, 0.054 and 0.084, respectively). PERMANOVA based on Bray–Curtis distances at the genus level demonstrated a statistically significant difference in overall microbial community structure between the two groups before and after treatment (F = 1.81, P = 0.043), but no significant difference after adjustment (P = 0.054). ANOSIM performed on the raw full-species abundance table at the species level further detected significant separation between the two groups (R = 0.114, P = 0.016). No species remained statistically significant after false-discovery-rate correction. These exploratory, descriptive findings indicate that species-level temporal changes in the gut microbiota occurred concurrently with ceftizoxime exposure and clinical recovery, but cannot be attributed specifically to the antibiotic. The study provides hypothesis-generating data for future controlled investigations of antibiotic–microbiota interactions in young adults.
מבוא
Bacterial enteritis is an acute intestinal inflammation caused by pathogenic bacterial infection, with a high incidence during summer and autumn, characterized by an acute onset and rapid disease progression1. Its main clinical manifestations include abdominal pain, diarrhea, and fever; severe cases may develop toxic shock and even life-threatening conditions2. Among college student populations, the incidence is relatively high due to collective living environments, similar dietary habits, and high population density1. Antibiotic therapy is the primary treatment for bacterial enteritis, but antibiotics may exert extensive effects on the intestinal commensal microbiota while eliminating pathogenic bacteria3. Previous studies have shown that antibiotic therapy can decrease gut microbiota diversity, reduce beneficial bacteria, increase drug-resistant bacteria, and induce antibiotic-associated diarrhea and Clostridioides difficile infection4.
The gut microbiota is a complex ecosystem composed of trillions of microorganisms, playing a pivotal role in human health and disease5. With the development of high-throughput sequencing technology, an increasing number of studies have revealed the close association between the gut microbiota and various diseases, including infectious diseases, metabolic diseases, autoimmune diseases, and neurological diseases6,7. The gut microbiota communicates bidirectionally with the host immune system through the “microbiota-gut-immune axis”, maintaining intestinal barrier function, regulating immune responses, and participating in nutrient and drug metabolism1,8.
Despite extensive research on antibiotic-associated microbiota disturbance, several knowledge gaps remain. First, most existing studies employ cross-sectional designs or focus on severely ill or elderly populations, leaving uncertainty about short-term microbiota dynamics in healthy young adults during routine clinical recovery. Second, while the general impact of broad-spectrum antibiotics on gut microbiota has been documented, the short-term, species-level effects of ceftizoxime sodium, a third-generation cephalosporin which could be used even for children with acute bacterial enteritis9, remain poorly characterized. Third, previous studies have largely relied on 16S rRNA amplicon sequencing, which offers limited resolution for species-level identification10. Shotgun metagenomic sequencing enables finer taxonomic and functional resolution11, but its application to paired samples during acute enteritis treatment is limited.
College students feature a relatively concentrated age structure, similar living environments, and few underlying diseases, making them an ideal population for studying the effects of antibiotics on the gut microbiota12. Understanding the short-term changes in the gut microbiota of college students with acute enteritis concurrent with antibiotic therapy may help generate hypotheses regarding antibiotic–microbiota interactions. However, we emphasize that without an untreated control group or alternative-treatment arm, any observed temporal changes cannot be specifically attributed to ceftizoxime sodium.
This study aimed to analyze the compositional changes and diversity characteristics of the gut microbiota in college students with bacterial enteritis before and after a course of ceftizoxime sodium therapy via metagenomic sequencing. We hypothesized that short-term ceftizoxime sodium therapy would induce detectable species-level restructuring of the gut microbiota without substantially altering higher-level (phylum/genus) diversity or composition in young adults with acute enteritis.
פרוטוקול
Ethical statement and informed consent
This retrospective study was approved by the Institutional Review Board of Southwest University (Approval No. SWU-IRB-2026-0228) and was conducted in accordance with the Declaration of Helsinki and institutional ethical guidelines for human research. As only preserved samples were analyzed, all participants were contacted and provided written informed consent prior to participation in the study.
Study design and participants
This was a retrospective, single-center, self-controlled before-and-after (paired) study conducted at the Southwest University Hospital. Participants visited the hospital between March 1 and September 30, 2023 and remained hospitalized for treatment until clinical recovery and discharge. All fecal samples were preserved after routine laboratory testing. The study employed a paired design in which each participant served as their own control, with fecal samples collected at two time points: during active enteritis prior to antibiotic administration (infection phase, IG); and at the time of clinical recovery following antibiotic treatment and supportive care (recovery phase, RG). All samples were later sent for sequencing after informed consent was obtained from each participant. No untreated control group, alternative-treatment group, or healthy longitudinal control group was included.
Sample size
No formal a priori sample size calculation was performed because this was an exploratory, hypothesis-generating study with limited available paired samples from the target population during the enrollment period. A convenience sample of 10 participants was enrolled based on the anticipated number of eligible patients admitted during the seven-month recruitment window. We acknowledge that this sample size provides limited statistical power (e.g., for the Wilcoxon signed-rank test with α = 0.05 and a medium effect size, power ≈ 0.30–0.40) and increases the risk of both false-negative and false-positive findings. All findings should therefore be interpreted as exploratory.
Inclusion criteria
Participants were eligible if they met all of the following criteria: college students aged 18–24 years; ≥3 defecations within 24 h with loose, mucous, or watery stools, diagnosed with infectious diarrhea by the attending gastroenterologist; fecal microscopic examination showing ≥15 white blood cells per high-power field (HPF, 400× magnification) or phagocytes; intravenous ceftizoxime sodium initiated as the sole systemic anti-infective agent after admission; no known underlying chronic diseases (e.g., diabetes mellitus, chronic kidney disease, autoimmune disorders); no history of chronic gastrointestinal disease (e.g., inflammatory bowel disease, irritable bowel syndrome, celiac disease); and provision of written informed consent.
Exclusion criteria
Participants were excluded if any of the following applied: use of antibiotics, probiotics, prebiotics, or systemic corticosteroids within four weeks prior to admission; history of gastrointestinal surgery (excluding appendectomy >6 months prior); immunocompromised status (e.g., HIV infection, immunosuppressive therapy, chemotherapy) or use of immunosuppressive agents; concurrent severe systemic infection requiring antibiotics other than ceftizoxime; hospital-acquired diarrhea or antibiotic-associated diarrhea present prior to enrollment; pregnancy or lactation; refusal to provide informed consent or inability to comply with sample collection protocols; and fecal sample volume <2 g or failure to collect paired samples at both time points.
Diagnostic criteria for acute enteritis
The diagnosis of acute bacterial enteritis was established clinically based on: acute onset of diarrhea (≥3 loose stools per day) with or without abdominal pain, fever, or nausea; fecal microscopic examination demonstrating ≥15 leukocytes/HPF or presence of macrophages/phagocytes; and absence of bloody diarrhea suggestive of invasive pathogens requiring alternative management. We acknowledge that microbiological confirmation (stool culture, multiplex PCR, or pathogen-specific antigen testing) was not performed; therefore, bacterial etiology was not definitively established, and the illness may have been self-limiting or caused by non-bacterial pathogens.
Recovery criteria
Recovery was defined as: basic indicators and symptoms returned to normal after treatment: resolution of diarrhea (≤2 formed stools per day) and absence of abdominal pain, fever, or nausea for ≥24 h; routine blood tests and C-reactive protein (CRP) levels within the normal range; normal stool morphology with no white blood cells, phagocytes, or red blood cells detected by microscopic examination; and clinical judgment of recovery by the attending physician permitting discharge.
Treatment regimen
All patients received intravenous ceftizoxime sodium at a dose of 1.0 g dissolved in 100 mL of 0.9% sodium chloride solution, administered every 12 h by intravenous infusion over 30 min. The dose was escalated to 2.0 g every 8 h for patients with severe infection (body temperature >39 °C or markedly elevated inflammatory markers). The standard treatment duration was 5–7 days, determined by clinical response and normalization of laboratory parameters. In addition to ceftizoxime, all patients received standard supportive care, including intravenous fluid resuscitation, electrolyte correction, and symptomatic treatment (antipyretics and antiemetics as needed). No other systemic antibiotics were administered during hospitalization. Dietary intake during hospitalization was not standardized; patients received regular hospital meals (three meals per day, standard Chinese diet) without specific dietary restrictions, though detailed dietary logs were not collected.
Fecal sample collection
Collection
Fresh fecal samples (2–5 g) were collected by participants using disposable sterile fecal collection cups. Participants were instructed to deposit the sample directly into the cup without urine contamination, to seal the lid immediately, and to notify nursing staff within 15 min of collection.
Initial processing
Upon receipt, samples were transferred to a class II biosafety cabinet within 30 min of collection. Each sample was divided into two aliquots: a 1g aliquot for immediate metagenomic analysis, transferred to a sterile 2.0 mL cryovial; and a 1 g aliquot for backup storage. Both aliquots were snap-frozen in liquid nitrogen (-196°C) within 1 h of collection and subsequently transferred to an ultra-low temperature freezer at -80°C for long-term storage.
Metagenomic sequencing and bioinformatic analysis of fecal samples
Fecal samples were sent for Illumina paired-end 150 bp (PE150) metagenomic sequencing. The detailed experimental procedures for sequencing and bioinformatic analysis are described as follows:
Extraction of DNA
DNA extraction and quality detection
Genomic DNA was extracted from fecal samples using a commercial DNA extraction kit. The purity and integrity of the extracted DNA were analyzed by agarose gel electrophoresis (AGE), and the DNA concentration was accurately quantified. Only high-quality DNA samples (with intact bands in AGE and sufficient concentration) were used for subsequent library construction.
Library construction
Qualified DNA samples were randomly sheared into fragments of approximately 350 bp using a Covaris ultrasonic disruptor. Library construction was completed through end repair, dA-tailing, sequencing adapter ligation, purification, and PCR amplification. After initial quantification of the constructed libraries to 2 ng/μL, the effective concentration of the libraries was accurately quantified by quantitative PCR (qPCR), with a valid library concentration requirement of >3 nM to ensure library quality.
High-throughput sequencing
Qualified libraries were pooled according to their effective concentrations and the required on-machine data volume, and then subjected to Illumina PE150 sequencing on the high-throughput sequencing platform.
Raw data quality control and host filtering
Low-quality raw sequencing data (raw data) were filtered to obtain high-quality clean data (clean data), including the removal of adapter sequences, low-quality reads (Q-value < 20), and host genomic DNA sequences to eliminate background contamination10.
Metagenomic assembly and gene prediction: Metagenomic assembly was performed on the Clean data of each sample to obtain scaftigs (contigs with gaps). Open reading frames (ORFs) were predicted from scaftigs (≥500 bp), and ORFs with a length of <100 nt were filtered out to ensure the reliability of gene prediction13.
Construction of a non-redundant gene catalog
The predicted ORFs from all samples were clustered and de-redundant with the parameters: -c 0.95, -G 0, -aS 0.9, -g 1, -d 0 (95% sequence identity and 90% coverage), and the longest sequence in each cluster was selected as the representative sequence to construct a non-redundant initial gene catalog14,15. Genes with supporting read counts ≤2 in all samples were further filtered out to obtain the final gene catalog (Unigenes) for subsequent analysis.
Gene abundance calculation
Clean data of each sample were aligned to the final gene catalog with the parameters: –end-to-end, –sensitive, -I 200, -X 40013. The gene abundance in each sample was calculated based on the number of aligned reads and gene length, using the formula16:
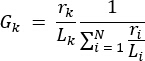
where rk is the number of reads aligned to gene k, Lk is the length of gene k, and N is the total number of genes in the catalog.
Species annotation
Unigenes were aligned to the bacterial, fungal, archaeal, and viral sequences extracted from the NCBI NR database with the blastp algorithm and an E-value threshold of ≤1e-517. For the alignment results of each sequence, only those with an E-value ≤10 × the minimum E-value were retained for subsequent analysis. The Lowest Common Ancestor (LCA) algorithm18 was used to determine the species annotation information of each sequence, taking the taxonomic level before the first branch as the final annotation result. The abundance of species at different taxonomic levels (kingdom, phylum, class, order, family, genus, species) in each sample was calculated by summing the abundances of genes annotated to the corresponding species19.
Statistical analysis
All statistical analyses were performed using R software v4.2.0. Continuous variables were tested for normality using the Shapiro-Wilk test. Medians and interquartile ranges [M (IQR)] are reported for clinical characteristics, and means with standard deviations are reported for relative-abundance data. Categorical variables are reported as counts and percentages.
The paired Wilcoxon signed-rank test was used to compare the differences in the relative abundance of major phyla, genera, and species between IG and RG, with a statistical significance level set at P < 0.05. The paired distance matrix and ANOSIM/PERMANOVA were recalculated using the original full-species abundance table, which tests whether between-group differences are greater than within-group differences. The F/B ratio was calculated for each sample and compared between groups using the paired Wilcoxon signed-rank test.
α-diversity analysis was performed at the genus level, comparing the Shannon, Simpson, and Chao1 indices between the infection and recovery groups. Statistical significance was assessed using the paired Wilcoxon signed-rank test; indices were calculated based on genus-level counts rarefied to 58,315 sequences per sample (averaged over 200 iterations). PERMANOVA based on Bray–Curtis distances was conducted with permutations restricted within subjects (9,999 permutations). At the species level, ANOSIM was performed using the full-gene complete abundance table (6,271 species).
For formal differential abundance testing, taxa present in fewer than three samples or with a mean relative abundance <0.01% were filtered out. Finally, a total of 202 species were included in the final paired Wilcoxon analysis. Given the exploratory nature of this study and the absence of established clinically meaningful thresholds for metagenomic taxonomic shifts, we did not predetermine a minimal clinically important difference (MCID). For species-level changes, an absolute abundance difference ≥0.5% was considered biologically noteworthy for reporting, though not necessarily clinically significant.
תוצאות
Basic characteristics of the study subjects
Among the 10 patients with bacterial enteritis, there were 5 males and 5 females, aged 18–24 years (median: 21 years; IQR: 20–23 years). The hospitalization duration was 5–7 days (median: 6 days; IQR: 5–7 days). The main clinical manifestations at admission were diarrhea (10/10), abdominal pain (8/10), fever (7/10), and nausea and vomiting (3/10). All patients met the recovery criteria and were discharged. No adverse reactions related to ceftizoxime sodium were observed during the treatment period.
Quality of sequencing data
The gene catalog contained a total of 1,167,777 ORFs, with 58.26% complete genes (with both start and stop codons), 16.70% genes with only stop codons, 18.72% genes with only start codons, and 6.32% genes with neither start nor stop codons (Table 1). The total length of the genes in the catalog was 845.02 Mbp, with an average length of 723.62 bp and an overall GC content of 46.98%. Core- and pan-gene rarefaction curves tended to plateau as the number of samples increased (Figure 1).
Gut microbiota composition analysis
Phylum-level composition
Phylum-level analysis showed that the main phylum composition of the gut microbiota was similar between IG and RG. The dominant phyla in both groups were Firmicutes, Bacteroidota, Actinobacteriota, and Pseudomonadota, accounting for the majority of the total relative abundance. Specifically, the average relative abundance of Firmicutes, Bacteroidota, Actinobacteriota, and Pseudomonadota in IG was 46.80% (IQR: 31.50–69.80%), 22.00% (IQR: 3.20–48.80%), 4.10% (IQR: 0.00–5.00%) and 15.0% (IQR: 2.80–27.80%), respectively; the corresponding values in RG were 47.00% (IQR: 29.50–67.50%), 27.20% (IQR: 5.00–51.00%), 9.70% (IQR: 0.00–6.50%) and 5.20% (IQR: 0.00–6.00%), respectively (Figure 2). The paired Wilcoxon signed-rank test showed no statistically significant differences in the relative abundance of all seven major phyla between the two groups (P > 0.05).
Genus-level composition
A total of 22 major genera (mean relative abundance >1% across all samples) were identified at the genus level in both groups. Hierarchical clustering of their abundance changes divided the 10 paired samples into two main groups: the left cluster (five pairs) showed increases in Faecalibacterium and Megamonas, whereas the right cluster (five pairs) exhibited more diverse patterns, with a notable +20% increase in Bifidobacterium for ZYH1–ZYH2. Functionally, the 22 genera fell into three categories: a pathogen-reduction cluster (Bacteroides, Klebsiella, Roseburia, Streptococcus, Fusobacterium, Phocaeicola) that generally decreased after treatment; an intermediate transitional cluster showing inconsistent or mild responses (e.g., Enterococcus ranged from –4% to +10%, and Escherichia from –9% to +5%); and a beneficial‑bacteria increase cluster (Faecalibacterium, Megamonas, Bifidobacterium, Prevotella, Alistipes) that predominantly increased post‑treatment (Figure 3).
α-diversity
α-diversity analysis at the genus level, calculated from the full-gene abundance table (58,315 sequences per sample), revealed that both the Shannon index (3.33 ± 0.27 vs. 3.08 ± 0.19; P = 0.037) and Simpson index (0.93 ± 0.02 vs. 0.91 ± 0.02; P = 0.037) were significantly higher in IG than in RG, but were no longer significant after adjustment (q = 0.054). The Chao1 index also showed an increasing trend in IG (606.6 ± 103.2 vs. 535.5 ± 77.8; P = 0.131, Figure 4). PERMANOVA analysis at the genus level (22 genera), with permutations restricted within subjects (9,999 permutations), demonstrated a statistically significant difference in overall microbial community structure between the two groups before and after treatment (F = 1.81, P = 0.043), but no significant difference after adjustment (P = 0.054).
Species-level composition
PERMANOVA on species-level (6271 species) abundance revealed significant overall separation between IG and RG (F=1.93, P = 0.020). ANOSIM demonstrated a clear taxonomic resolution gradient: no separation at the phylum level (R = 0.042, P = 0.182), but significant separation at the genus (R = 0.123, P = 0.011) and species (R = 0.114, P = 0.016) levels (Figure 5). At the phylum level, major taxa (e.g., Firmicutes, Bacteroidota) remained essentially unchanged between phases. In contrast, genus-level turnover involved decreased Klebsiella/Streptococcus and increased Megamonas/Faecalibacterium. Species-level changes were fine-grained replacements rather than community collapse. Notably, within-group dissimilarity of RG samples was consistently lower than that of IG across all levels, while infection-phase microbiomes displayed individualized dysbiosis.
Species-level abundance
Species-level Bray-Curtis UPGMA clustering of 6,271 species largely separated recovery (left) and infection (right) samples (Figure 6), consistent with ANOSIM (R = 0.114, P = 0.016) and PERMANOVA (F = 1.93, P = 0.020). Enterobacteriaceae (Escherichia coli, Klebsiella pneumoniae, Klebsiella aerogenes) were enriched in IG but depleted in RG, whereas Faecalibacterium prausnitzii, Bifidobacterium longum, and core commensals (Roseburia spp., [Eubacterium] rectale, Bacteroides uniformis/fragilis) were enriched in RG. Infection-phase blooms of Bacteroides sp. CAG:1076, Phocaeicola plebeius, Gemmiger qucibialis, and Fusobacterium perfoetens were individual-specific and resolved after treatment. The paired differential-abundance analysis was also performed, but no species showed significant difference after adjustment (top 10 in Table 2, full results of 202 species in Supplementary Table 1).
Full-species Bray-Curtis clustering separates infection and recovery samples
Bray-Curtis clustering of full-species abundance (6,271 species) roughly separated the 20 samples into recovery-dominated, mixed, and infection-dominated clusters (Figure 7), consistent with species-level ANOSIM (R = 0.114, P = 0.016). Paired infection/recovery samples from the same patient mostly fell into different clusters. Infection-phase samples carried higher proportions of Enterobacteriaceae (Escherichia coli, Klebsiella pneumoniae) and occasional blooms of Bacteroides sp. CAG:1076, whereas recovery-phase samples were enriched in commensal Bacteroides and Bifidobacterium longum. Mean paired Bray-Curtis distance was 0.240 ± 0.089 (Table 3).
Temporal patterns of microbiota changes during clinical recovery
The observed species-level temporal changes occurred concurrently with clinical recovery: the reduction in Klebsiella pneumoniae and Escherichia coli abundance coincided with antibiotic exposure and symptom resolution, while the appearance of Faecalibacterium prausnitzii and an increase in Bifidobacterium pseudocatenulatum coincided with the normalization of stool morphology and inflammatory markers. However, because antibiotic exposure and clinical recovery are completely confounded in this self-controlled design, these parallel temporal patterns cannot be interpreted as evidence of correlation or causation.
This paired exploratory analysis identified species-level temporal changes in the gut microbiota concurrent with ceftizoxime treatment and clinical recovery in ten college students with acute enteritis. No significant changes were observed in phylum/genus-level composition or α-diversity. These descriptive findings cannot attribute observed changes to ceftizoxime specifically, nor do they establish clinical efficacy or microbiota safety. The study generates hypotheses for future controlled investigations.
DATA AVAILABILITY:
The raw metagenomic sequencing data reported in this paper have been deposited in the NCBI Sequence Read Archive (SRA) under accession numbers SRR39993010 to SRR39993029.
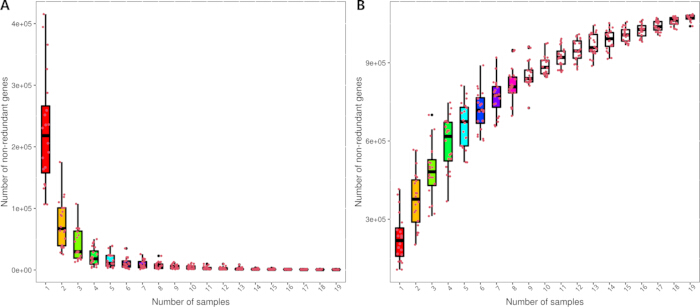
Figure 1: Core-pan gene rarefaction curves of the gut microbiota. The figure includes two rarefaction curves: (A) pan gene rarefaction curve, (B) core gene rarefaction curve. The abscissa represents the number of randomly sampled samples, and the ordinate represents the number of genes in the sample combinations. Please click here to view a larger version of this figure.
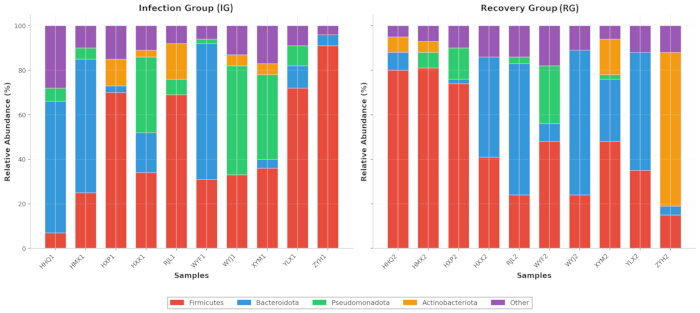
Figure 2: Phylum-level gut microbiota composition of the infection and recovery groups. The figure is a stacked bar plot showing the relative abundance of the major bacterial phyla in each sample of the infection group (IG) and recovery group (RG). The abscissa represents the individual samples, and the ordinate represents the relative abundance of each phylum (%). Please click here to view a larger version of this figure.
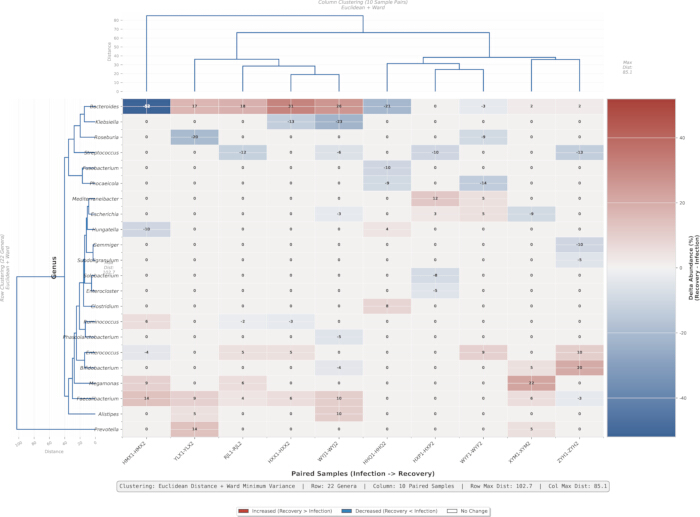
Figure 3: Heatmap of the abundance changes of key bacterial genera. The figure is a heatmap showing the absolute change in the relative abundance of 22 major bacterial genera in the recovery group compared with the infection group for each paired sample. Please click here to view a larger version of this figure.
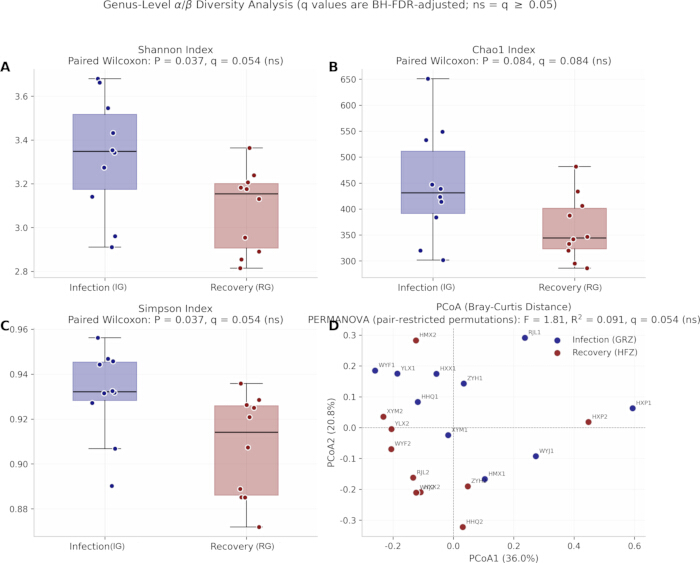
Figure 4: Paired comparison of α-diversity indices before and after treatment. The figure is a box plot showing the paired comparison of the Shannon, Simpson, Chao1, and Bray–Curtis distance indices at the phylum, genus, and species levels between the infection group and recovery group. Please click here to view a larger version of this figure.
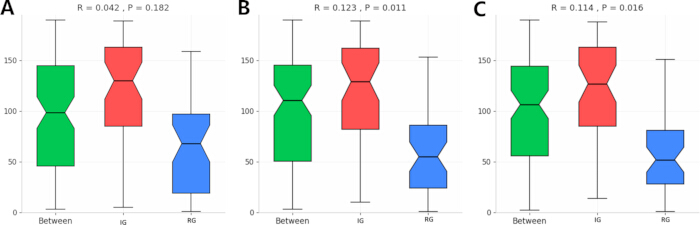
Figure 5: ANOSIM plots at the phylum, genus, and species levels. The paired distance matrix and ANOSIM/PERMANOVA were recalculated using the original full-species abundance table. Abbreviations: ANOSIM = analysis of similarities; PERMANOVA = permutational multivariate analysis of variance. Please click here to view a larger version of this figure.
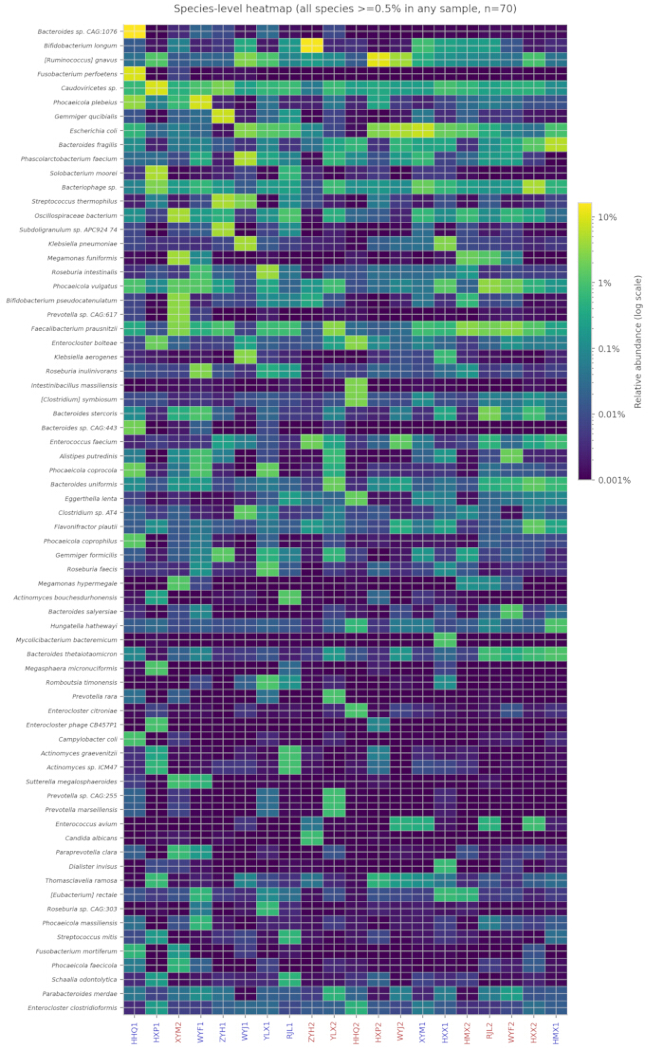
Figure 6: Species-level abundance heatmap. This heatmap is arranged according to the leaf order of the aforementioned full-species Bray–Curtis distance UPGMA clustering tree; column label colors distinguish the groups: red = recovery group, blue = infection group. Please click here to view a larger version of this figure.
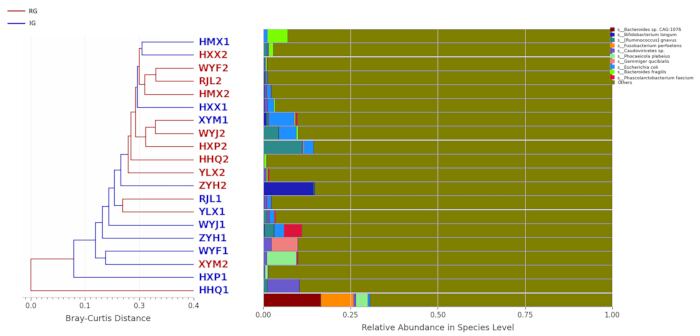
Figure 7: Bray-Curtis distance clustering analysis of full-species species-level abundance. Bray-Curtis clustering tree and species-level composition of 20 fecal samples based on full-species relative abundances. Pairwise distances were calculated using the Bray-Curtis metric, and hierarchical clustering was performed with the UPGMA method; red indicates the recovery group and blue indicates the infection group. The right panel shows a stacked bar chart of the relative abundances of the top 10 dominant species arranged in correspondence with the leaf order of the clustering tree. Please click here to view a larger version of this figure.
| Characteristics | Statistics |
| Sex, female | 5 (50.0%) |
| Age, yrs | 21 (20–23) |
| Disease course, days | 6 (5–7) |
| Antibiotics treatment duration, days | 4 (3–6) |
| Clinical manifestations | |
| Diarrhea | 10 (100%) |
| Abdominal pain | 8 (80.0%) |
| Fever | 7 (70.0%) |
| Nausea and vomiting | 3 (30.0%) |
| Gene catalogue | |
| Number of open reading frames | 1,167,777 |
| Integrity: end | 195,024 (16.7%) |
| Integrity: start | 218,569 (18.72%) |
| Integrity: none | 73,860 (6.32%) |
| Integrity: all | 680,324 (58.26%) |
| Total length (Mbp) | 845.02 |
| Average length (bp) | 723.62 |
| GC percent | 46.98 |
Table 1: Basic information of the enrolled patients and gene catalog. The table presents the general characteristics of the enrolled patients and their non-redundant gene catalog constructed from the fecal metagenomic sequencing data.
| Species | Overall_median% | GRZ_median% | HFZ_median% | HFZ_mean% | q_BH_FDR(m = 10) |
| Faecalibacterium prausnitzii | 0.6778 | 0.5221 | 1.6474 | 1.4972 | 0.327148 |
| Bilophila wadsworthia | 0.0643 | 0.0063 | 0.0805 | 0.1109 | 0.327148 |
| Bacteroides uniformis | 0.0777 | 0.0314 | 0.2127 | 0.4701 | 0.327148 |
| Caudoviricetes sp. | 0.4905 | 0.6911 | 0.3962 | 0.3869 | 0.327148 |
| Bacteroides fragilis | 0.1019 | 0.0814 | 0.2228 | 0.3358 | 0.464844 |
| [Ruminococcus] gnavus | 0.1074 | 0.1126 | 0.1074 | 1.6996 | 0.615234 |
| Oscillospiraceae bacterium | 0.1382 | 0.1382 | 0.2038 | 0.6718 | 0.615234 |
| Bacteriophage sp.CAG:1076 | 0.2003 | 0.3945 | 0.1793 | 0.6807 | 0.615234 |
| Phocaeicola vulgatus | 0.1986 | 0.1982 | 0.3449 | 0.8418 | 0.694444 |
| Escherichia coli | 0.4737 | 1.0091 | 0.0851 | 0.9555 | 0.695312 |
Table 2: Paired difference analysis of the relative abundance of major bacterial species. The table lists the mean relative abundance of major beneficial and pathogenic bacterial species in the infection group and recovery group, the average difference in abundance, the changing trend, and the corresponding FDR-adjusted P-value.
| Paired Sample | Bray-Curtis distance |
| HHQ1-HHQ2 | 0.4488 |
| HMX1-HMX2 | 0.156 |
| HXP1-HXP2 | 0.3038 |
| HXX1-HXX2 | 0.148 |
| RJL1-RJL2 | 0.2346 |
| WYF1-WYF2 | 0.222 |
| WYJ1-WYJ2 | 0.1867 |
| XYM1-XYM2 | 0.2669 |
| YLX1-YLX2 | 0.1744 |
| ZYH1-ZYH2 | 0.2605 |
| Mean ± SD | 0.2402 ± 0.0893 |
Table 3: Bray-Curtis distance of paired fecal samples (infection vs. recovery). The table shows the Bray-Curtis distance values of the 10 paired fecal samples from the infection group and recovery group, reflecting the degree of difference in gut microbiota composition between the two phases for each patient, as well as the mean and standard deviation of the Bray-Curtis distance.
Supplementary Table 1: Full differential-abundance results for the 202 species included in the final paired Wilcoxon analysis.Please click here to download this file.
דיון
`This paired exploratory analysis described temporal changes in the gut microbiota of college students with acute enteritis before and after a course of ceftizoxime sodium therapy and clinical recovery. The key finding was that no significant changes were detected in phylum- or genus-level composition or in α-diversity, whereas species-level PERMANOVA indicated significant restructuring during the treatment and recovery period. This study has several methodological strengths. The paired, self-controlled design reduces interindividual variability, which is a major confounder in microbiome studies. The use of shotgun metagenomics provided species-level resolution, offering finer granularity than 16S rRNA amplicon sequencing. The homogeneous population (young, healthy college students) reduces confounding from age-related microbiota variation and comorbidities. To our knowledge, this is the first paired shotgun metagenomic study to examine species-level microbiota dynamics concurrent with ceftizoxime treatment and clinical recovery in young adults with acute enteritis. However, these findings are descriptive and hypothesis-generating; they cannot attribute observed changes specifically to ceftizoxime sodium.
Previous studies showed that antibiotics are one of the main factors causing gut microbiota disturbance, which can induce changes in microbiota structure20. However, most studies reported a significant decrease in gut microbiota diversity after antibiotic therapy21,22. Most of these studies examined longer antibiotic courses, multiple drug classes, or elderly or hospitalized populations. Our exploratory findings of stable α-diversity at the phylum and genus levels in young, healthy individuals during short-term ceftizoxime exposure are not inconsistent with the literature, as the study population and treatment context differ substantially23. The significant species-level restructuring observed here aligns with the concept that antibiotics exert selective pressure that may reshuffle species composition even when higher-level metrics remain stable24.
Although the biological significance of the observed species-level changes is uncertain, some clinical and biological interpretations could be hypothesized. The appearance of Faecalibacterium prausnitzii during recovery is consistent with intestinal ecological restoration, as this species is a major butyrate producer associated with intestinal barrier maintenance23,24. Similarly, the reduction in Klebsiella pneumoniae and Escherichia coli coincided with clinical improvement. However, in the absence of an untreated control group, we cannot determine whether these changes reflect antibiotic-specific effects, infection resolution, supportive care, dietary shifts during hospitalization, or natural illness recovery. The clinical relevance of a 1.6% relative abundance change in a small, uncontrolled sample is unknown25.
The study has several limitations that need to be addressed in future research. First, the sample size is small (n = 10), resulting in limited statistical power and the inability to detect small changes in the microbiota. We acknowledge that the study is exploratory and that the risk of false-negative and false-positive findings is elevated. Second, the self-controlled before-and-after design cannot distinguish the effects of ceftizoxime sodium from the effects of infection resolution, hospitalization, dietary changes, supportive treatments (intravenous fluids, electrolyte correction, symptomatic medications), or spontaneous recovery. Antibiotic exposure and clinical recovery are completely confounded. Third, the diagnosis of bacterial enteritis relied on fecal microscopy and clinical presentation without microbiological confirmation (stool culture, multiplex PCR, or pathogen-specific testing); these microscopic parameters have limited specificity, and the illness may have been self-limiting or non-bacterial. Fourth, the follow-up time point was only at clinical recovery, and the long-term changes in the gut microbiota after antibiotic withdrawal were not evaluated. Fifth, detailed dietary and lifestyle information of the patients was not collected, so the impact of these factors on microbiota recovery could not be analyzed26,27.
Future research should carry out multi-center, randomized controlled trials with untreated or placebo control groups to isolate the specific effects of ceftizoxime on the gut microbiota. Such studies should incorporate detailed dietary recording, longer follow-up periods, and metabolomic profiling to assess functional consequences of species-level restructuring. The enrichment and transmission risk of antibiotic-resistance genes in the gut microbiota after therapy also warrants investigation.
גילויים
All authors declare no conflicts of interest related to this study. AI was used to correct grammar errors and polish English.
תודות
This study was funded by the National Science and Technology Major Project (2018ZX10713003-001). The funders had no role in study design, data collection and analysis, decision to publish, or preparation of the manuscript. We thank all students who agreed to participate in this study.
חומרים
| שם | חברה | מספר קטלוג | הערות |
|---|---|---|---|
| Agarose gel electrophoresis kit | Agilent Technologies | M5312AA | |
| Agilent 2100 Bioanalyzer | Agilent Technologies | G2938A | |
| Agilent High Sensitivity DNA Kit | Agilent Technologies | 5067-4626 | |
| Bowtie2 | Johns Hopkins University | v2.4.5; http://bowtie-bio.sourceforge.net/bowtie2/index.shtml | |
| CD-HIT | — | v4.8.1; https://github.com/weizhongli/cdhit | |
| Ceftizoxime sodium(Cefizox) | Fujisawa Pharmaceutical Co., Ltd. | — | |
| Covaris M220 ultrasonic disruptor | Covaris Inc. | M220 | |
| Cryovial | Corning Inc. | 430659 | |
| DIAMOND | — | v2.0.15; https://github.com/bbuchfink/diamond | |
| Disposable sterile fecal collection cup | Gongdong Medical Technology Co. | 2102001 | |
| ggplot2 package | — | v3.3.6; https://ggplot2.tidyverse.org/ | |
| Illumina NovaSeq 6000 | Illumina Inc. | SY-410-1001 | |
| MEGAN6 | University of Tübingen | v6.24.4; https://uni-tuebingen.de/fakultaeten/.../megan6/ | |
| MetaGeneMark | Georgia Institute of Technology | v3.26; http://exon.gatech.edu/GeneMark/meta_gmhmmp.cgi | |
| NCBI NR database | NCBI | Release 2023.03; ftp://ftp.ncbi.nlm.nih.gov/blast/db/ | |
| Qubit 4 Fluorometer | Thermo Fisher Scientific | Q33216 | |
| Qubit dsDNA HS Assay Kit | Thermo Fisher Scientific | Q32854 | |
| R software | R Foundation | v4.2.0; https://www.r-project.org/ | |
| TIANamp Stool DNA Kit | TIANGEN | DP328 | |
| TruSeq DNA PCR-Free Library Prep Kit | Illumina Inc. | FC-121-3001 | |
| vegan package | — | v2.6-4; https://cran.r-project.org/web/packages/vegan/ |
מקורות
- Ducarmon QR, et al. Gut microbiota and colonization resistance against bacterial enteric infection. Microbiol Mol Biol Rev. 2019;83(3):e00003–19.
- Shakoor S, Platts-Mills JA, Hasan R. Antibiotic-resistant enteric infections. Infect Dis Clin North Am. 2019;33(4):1105–23.
- Cusumano G, et al. The Impact of Antibiotic Therapy on Intestinal Microbiota: Dysbiosis, Antibiotic Resistance, and Restoration Strategies. Antibiotics (Basel). 2025;14(4):371.
- Abad CLR, Safdar N. A Review of Clostridioides difficile Infection and Antibiotic-Associated Diarrhea. Gastroenterol Clin North Am. 2021;50(2):323-340.
- McDonnell L, et al. Association between antibiotics and gut microbiome dysbiosis in children: systematic review and meta-analysis. Gut Microbes. 2021;13(1):1–18.
- Sangokunle O, Singh P, Nagpal R. Gut microbiome-derived metabolites in host health and diseases. In: Goel G, Requena T, Bansal S, editors. Human-Gut Microbiome. Academic Press; 2022. p. 81–91.
- Duan H, et al. Antibiotic-induced gut dysbiosis and barrier disruption and the potential protective strategies. Crit Rev Food Sci Nutr. 2022;62(6):1427–52.
- Liu S, et al. Gut microbiota and dysbiosis in Alzheimer’s disease: implications for pathogenesis and treatment. Mol Neurobiol. 2020;57(12):5026–43.
- Shane AL, et al. 2017 Infectious Diseases Society of America Clinical Practice Guidelines for the Diagnosis and Management of Infectious Diarrhea. Clin Infect Dis. 2017;65(12):1963-1973.
- Li J, et al. An integrated catalog of reference genes in the human gut microbiome. Nat Biotechnol. 2014;32(8):834–41.
- Mende DR, et al. Assessment of metagenomic assembly using simulated next generation sequencing data. PLoS One. 2012;7(2):e31386.
- Blake KS, et al. Gut microbiome and antibiotic resistance effects during travelers’ diarrhea treatment and prevention. mBio. 2024;15(1):e0279023.
- Qin J, et al. A human gut microbial gene catalog established by metagenomic sequencing. Nature. 2010;464(7285):59–65.
- Li W, Godzik A. CD-HIT: a fast program for clustering and comparing large sets of protein or nucleotide sequences. Bioinformatics. 2006;22(13):1658–9.
- Fu L, et al. CD-HIT: accelerated for clustering the next-generation sequencing data. Bioinformatics. 2012;28(23):3150–2.
- Le Chatelier E, et al. Richness of human gut microbiome correlates with metabolic markers. Nature. 2013;500(7464):541–6.
- Buchfink B, Xie C, Huson DH. Fast and sensitive protein alignment using DIAMOND. Nat Methods. 2015;12(1):59–60.
- Huson DH, et al. Integrative analysis of environmental sequences using MEGAN4. Genome Res. 2011;21(9):1552–60.
- Feng Q, et al. Gut microbiome development along the colorectal adenoma-carcinoma sequence. Nat Commun. 2015;6:6528.
- Fassarella M, et al. Gut microbiome stability and resilience: elucidating the response to perturbations in order to modulate gut health. Gut. 2021;70(3):595–605.
- Schwartz DJ, Langdon AE, Dantas G. Understanding the impact of antibiotic perturbation on the human microbiome. Genome Med. 2020;12(1):82.
- Fishbein SRS, Mahmud B, Dantas G. Antibiotic perturbations to the gut microbiome. Nat Rev Microbiol. 2023;21(12):772–88.
- Miquel S, et al. Faecalibacterium prausnitzii and human intestinal health. Curr Opin Microbiol. 2013;16(3):255–61.
- He X, Zhao S, Li Y. Faecalibacterium prausnitzii: a next-generation probiotic in gut disease improvement. Can J Infect Dis Med Microbiol. 2021;2021:6666114.
- Milani C, et al. The first microbial colonizers of the human gut: composition, activities, and health implications of the infant gut microbiota. Microbiol Mol Biol Rev. 2017;81(4):e00036-17.
- Zhao Y, et al. Comprehensive multi-omics exploration of the microbial function in metabolic pathway flow during altered diet. npj Sci Food. 2025;9(1):212.
- Zhao Y, et al. Genome-centric investigation of the potential succession pattern in gut microbiota and altered functions under high-protein diet. Curr Res Food Sci. 2023;7:100600.