This study presents a 24-h landmark workflow for mortality prediction in sepsis-associated acute respiratory distress syndrome. Repeated nested cross-validation showed similar discrimination for penalized and conventional logistic regression. Tree-based models did not improve discrimination, and the final regression equation requires external validation.
מאמר מחקר
Development and Internal Validation of a 24-Hour Landmark Model for 28-Day Mortality in Sepsis-Associated Acute Respiratory Distress Syndrome
במאמר זה
סיכום
תקציר
Sepsis-associated acute respiratory distress syndrome (ARDS) carries substantial short-term mortality. Differences in predictor timing, validation design, and comparators complicate evaluation of published prediction models. This single-center retrospective cohort study included 955 adults with sepsis-associated ARDS who reached a 24-h landmark after intensive care unit (ICU) admission. All-cause mortality was assessed by day 28 from ICU admission. Sequential Organ Failure Assessment (SOFA)-only logistic regression, conventional multivariable logistic regression, least absolute shrinkage and selection operator (LASSO) logistic regression, random forest, and extreme gradient boosting (XGBoost) were compared. The multivariable models used 26 candidate predictors (30 encoded parameters). Five repetitions of five-fold outer cross-validation with three-fold inner tuning provided held-out predictions. Evaluation included the area under the receiver operating characteristic curve (AUC), calibration, classification metrics, and decision-curve net benefit. Held-out tree-based Shapley additive explanations described XGBoost predictions. Among 955 patients, 474 (49.6%) died. AUCs based on averaged held-out probabilities were 0.732 (95% confidence interval [CI], 0.698–0.761) for LASSO, 0.729 (0.696–0.761) for conventional regression, 0.709 (0.674–0.740) for XGBoost, 0.707 (0.673–0.739) for random forest, and 0.581 (0.545–0.617) for SOFA alone. The LASSO-minus-conventional-regression AUC difference was 0.003 (95% CI, -0.003 to 0.010). Intervals resampled fixed predictions without refitting. LASSO had a Brier score of 0.209, calibration intercept of -0.001, and slope of 1.065. The final equation retained age, Charlson Comorbidity Index, arterial oxygen partial pressure/fraction of inspired oxygen ratio, SOFA, lactate, bilirubin, other infection site, and vasopressor use. LASSO provided moderate discrimination without a clear advantage over conventional regression. The separately tuned final equation requires source-data verification, external validation, and prospective clinical-utility assessment before clinical use.
מבוא
Sepsis-associated acute respiratory distress syndrome (ARDS) combines acute hypoxemic respiratory failure with infection-related organ dysfunction1,2. The LUNG SAFE study documented a substantial international burden of ARDS and incomplete clinical recognition3. Short-term prognosis reflects lung injury together with shock, metabolic disturbance, chronic disease, and dysfunction of other organs4. Recent ESICM guidance also emphasizes the diversity of ARDS phenotypes and respiratory-support needs5.
The Sequential Organ Failure Assessment (SOFA) score describes organ dysfunction and contributes to the clinical identification of sepsis6. However, an aggregate score may not preserve all prognostic information in age, chronic disease, oxygenation, lactate, and early organ-support requirements. Broader ARDS studies have developed mortality models using intensive-care databases, including evaluations across distinct databases and interpretable boosting approaches7,8. These studies establish that routinely collected clinical information can support prognostic modeling, but their results do not directly establish performance in a sepsis-associated ARDS cohort assessed at a fixed landmark. Mu and colleagues and Xu and colleagues evaluated models specifically in sepsis-associated ARDS9,10. Differences in population, outcome horizon, predictor timing, and validation design limit direct comparisons of their reported discrimination. Evidence of performance in one database also does not establish calibration or clinical benefit in a different institution.
The remaining question is whether a clinically timed, reproducible model offers useful prediction when evaluated against a conventional model using the same candidate information. A high AUC alone does not establish reliable absolute risks, and a feature-importance ranking does not provide an implementable risk equation. Predictor ascertainment must precede model application, while preprocessing and tuning must remain within the training data used for internal validation. The timing is particularly important when organ-support variables are collected over the first ICU day. A 24-h landmark defines when those measurements become available and makes explicit that patients who die or leave the ICU earlier are outside the target population. TRIPOD+AI provides a framework for reporting the population, predictor timing, model specification, and evaluation11. PROBAST+AI complements that framework by addressing limitations in data, development, evaluation, and applicability12. A transparent comparison should therefore report discrimination, calibration, uncertainty, and decision-curve results while distinguishing internal evaluation of a modeling approach from validation of the final fitted equation.
This study used a 24-h landmark to compare five model classes through repeated nested cross-validation. LASSO logistic regression was selected as the primary approach because it can provide a compact risk equation. Held-out TreeSHAP values described the XGBoost model separately. The multivariable models were compared with SOFA alone and with conventional multivariable regression using the same candidate predictors, without assuming that nonlinear methods would improve prediction. The aim was to characterize internally evaluated performance and provide a fully specified equation for independent testing.
פרוטוקול
The study was approved by the Institutional Review Board of Zhongshan Hospital, Fudan University, and the study was conducted in accordance with the Declaration of Helsinki (approval No. B2026-091). The requirement for written informed consent was waived because the study was retrospective and used de-identified data. The details of all the software used are listed in the Table of Materials
Study design, setting, and prediction time
This single-center retrospective prediction-modeling cohort included adults admitted between January 1, 2021, and December 31, 2025, to two general intensive care units (ICUs) of Zhongshan Hospital, Fudan University. Follow-up for the last included admission was completed on January 28, 2026. The database was locked on January 31, 2026. The intended use is risk stratification at 24 h after ICU admission among patients who remain alive, in the ICU, and under active treatment. Baseline time was ICU admission. Candidate predictors were restricted to the interval from admission through 24 h, and the model was applied at the 24-h landmark (Figure 1). No information recorded after that landmark was used as a predictor. The admission window, final follow-up date, and database-lock date were verified against records in the hospital’s electronic medical record system. Patient-level admission dates were not included in the original analytic extract but can be re-extracted from that system. Ming Zhong accessed the source clinical records and performed data extraction at Zhongshan Hospital, Fudan University.
Participants and operational definitions
Sepsis was defined using Sepsis-3 as suspected or documented infection accompanied by an acute increase in SOFA score of at least 2 points1,6. ARDS was defined using the Berlin framework: onset within 1 week of a known clinical insult or new or worsening respiratory symptoms; bilateral opacities not fully explained by effusions, lobar collapse, or nodules; respiratory failure not fully explained by cardiac failure or fluid overload; and a PaO₂/FiO₂ ratio of 300 mmHg or less with positive end-expiratory pressure (PEEP) or continuous positive airway pressure (CPAP) of at least 5 cmH₂O13. The 2024 global definition was used only as a contextual reference for nonintubated ARDS and did not replace the prespecified Berlin-based cohort definition14.
ARDS was attributed to sepsis when the infectious insult and sepsis-associated organ dysfunction preceded or coincided with the qualifying respiratory deterioration within the Berlin 1-week window. Patients not receiving invasive mechanical ventilation were eligible only if they were receiving CPAP or bilevel noninvasive ven tilation (NIV) with an expiratory positive airway pressure (EPAP) of at least 5 cmH2O. Ming Zhong assessed ARDS eligibility using the Berlin criteria, including review of radiographic findings and the exclusion of hydrostatic edema in the clinical record.
The unit of analysis was the patient, and only the first eligible ICU admission per patient was included. Twenty-eight-day mortality was defined as all-cause death within 28 days of ICU admission (ICU admission = day 0). The four exclusion criteria were applied sequentially in the following order: age younger than 18 years (n = 42), more than 20% patient-level missingness across the prespecified candidate predictors (n = 185), a pre-existing palliative-care or do-not-resuscitate order documented on or before ICU admission (n = 98), and an ICU stay shorter than 24 h (n = 40). Each patient was counted under the first applicable criterion, making the four exclusion counts mutually exclusive. The target population was adults who reached the 24-h landmark while receiving active ICU care (Figure 2). Of the 40 patients with an ICU stay shorter than 24 h, 15 died within this interval and 25 were transferred to another department.
Outcome
The outcome was all-cause death by day 28 after ICU admission. Death status was ascertained from the institutional clinical record and follow-up system. Patients who were alive at day 28 were coded as survivors. Because model application occurred at 24 h, the predicted risk applies only to patients who reached the landmark; exclusion of patients with an ICU stay shorter than 24 h was not treated as missing outcome data.
Candidate predictors and measurement rules
Twenty-six candidate predictors were selected before model fitting based on clinical availability and prior ARDS prediction studies7,9. They included age, sex, body mass index (BMI), admission source, Charlson Comorbidity Index, hypertension, diabetes, chronic obstructive pulmonary disease, chronic kidney disease, immunosuppression, infection site, temperature, heart rate, respiratory rate, mean arterial pressure, PaO2/FiO2 ratio, PEEP or expiratory positive airway pressure, invasive mechanical ventilation, SOFA score, vasopressor use, renal replacement therapy, lactate, platelet count, creatinine, total bilirubin, and procalcitonin.
Static variables were defined at ICU admission. Dynamic physiologic and laboratory variables were summarized from the first 24 h using the most severe (worst) value recorded within that window. The lowest PaO2/FiO2 ratio was calculated from PaO2 and FiO2 recorded at the same arterial blood gas assessment, and PEEP/EPAP was taken from the same respiratory-support episode. SOFA used the worst value for each of its six organ components during the same 24-h window15. Charlson Comorbidity Index scores were calculated by applying standard weights to comorbidities coded with the International Classification of Diseases (ICD)16. Infection site was coded into five mutually exclusive categories: respiratory, abdominal, urinary, blood, and other. Treatment indicators were coded as present only when initiated before the 24-hour landmark. Supplementary Table 1 provides the data dictionary.
Data quality and missing data
The final analytic dataset contained 955 rows, 955 unique row identifiers, 474 deaths, and no blank cells. It contained no exact duplicate records after excluding the row identifier. All PaO2/FiO2 values were 300 mmHg or less and all PEEP/EPAP values were at least 5 cmH2O. Among the 146 patients coded as not receiving invasive mechanical ventilation, PEEP/EPAP ranged from 5 to 18 cmH2O and PaO2/FiO2 from 40 to 282 mmHg. These checks support the numerical oxygenation and pressure criteria, but the analytic extract does not retain respiratory-support mode, imaging findings, cardiogenic-edema exclusion, or adjudication records for independent verification.
After application of the four prespecified exclusion criteria, all candidate predictors were complete in the final 955-patient cohort. No missing-value imputation or supplementary data entry to fill missing predictor values was performed, and no patients were additionally excluded beyond those four criteria. The records of the 365 excluded patients and the source-level missingness matrix were not available in the analytic extract. Therefore, variable-specific missingness before exclusion, the characteristics of excluded patients, and a sensitivity analysis retaining those records could not be reconstructed. Supplementary Table 2 distinguishes this source-data limitation from the zero missingness in the final analytic cohort. This limitation concerns the contents of the available analytic file and does not establish that institutional re-extraction is impossible.
Sample-size adequacy
A post hoc adequacy assessment followed the binary-outcome prediction-model framework of Riley and colleagues17. The 26 candidate predictors required 30 predictor parameters after one-hot encoding, excluding the intercept. The assessment used the observed outcome prevalence of 0.496 and an anticipated C-statistic of 0.80 based on a comparable sepsis-associated ARDS study9. With an approximated Cox-Snell R2 of 0.262 and a target global shrinkage factor of 0.90, the largest of the three minimum-sample criteria was 873 participants (approximately 433 outcome events). The available 955 participants and 474 deaths exceeded this benchmark by 82 participants and approximately 41 events. The shrinkage factor of 0.90 was the prespecified target for this post hoc calculation, not an empirical estimate of the final model’s shrinkage. This regression-based calculation is a post hoc benchmark, not proof of adequate sample size for random forest or XGBoost, and it does not remove the need for external validation.
Model development and repeated nested internal validation
Five model classes were evaluated: SOFA-only logistic regression, conventional multivariable logistic regression using all candidate parameters, LASSO logistic regression, random forest, and XGBoost18,19,20. Female sex, emergency-department admission, and respiratory infection were the reference categories. Sex, admission source, and infection site were encoded using fixed, predefined indicator mappings; no categories or ordering were learned from outcome data. Other binary predictors were coded as 0 or 1. For conventional and LASSO logistic regression, all encoded columns were standardized using means and standard deviations estimated within the corresponding training fold. No outcome-guided univariable screening was used.
Internal validation used five repetitions of stratified five-fold outer cross-validation. Hyperparameters were tuned within each outer-training set using three-fold inner cross-validation and mean AUC as the tuning objective21. The base random seed was 2026, with derived resampling and model seeds specified in the analysis code. Each outer-training set contained 764 participants and 379 or 380 deaths; each held-out fold contained 191 participants and 94 or 95 deaths. Each participant received one held-out prediction per repetition. The five probabilities were averaged for each participant before calculating pooled performance estimates, plots, and paired comparisons. Thus, pooled estimates summarize averaged held-out predictions, not the arithmetic mean of fold-specific performance estimates. Standardization parameters were fitted using only the corresponding training data: inner-training subsets during tuning and the outer-training set when fitting the model evaluated on its held-out outer fold. No held-out outer-fold values were used to estimate means or standard deviations. No chronological split or temporal validation was performed.
During nested validation, the LASSO inverse regularization parameter C was selected from 0.005, 0.01, 0.03, 0.10, 0.30, 1, and 3 using the maximum mean inner-fold AUC rule. Random forest used 250 trees and tuned maximum depth, the number of variables considered at each split, and minimum leaf size. XGBoost tuned tree depth, learning rate, number of boosting rounds, and minimum child weight. The search spaces and fold-specific settings are reported in Supplementary Table 3. After internal validation, a final LASSO model was refitted to all 955 patients. This refit used 10-fold cross-validation and a finer grid of 30 logarithmically spaced C values from 0.001 to 10, again maximizing mean AUC. The final equation therefore comes from a separate full-cohort refit with a different tuning grid; its performance has not been independently validated. Outer-fold sample sizes, outcome counts, and discrimination are summarized in Supplementary Table 4.
Performance assessment and model comparison
Discrimination was summarized by the AUC. Percentile confidence intervals were calculated using 1,000 participant-level bootstrap resamples of the averaged held-out predictions. The prediction models were not refitted within these bootstrap samples. Paired bootstrap differences compared LASSO with each alternative using the same sampled participants. The assessment also included the Brier score, calibration intercept, calibration slope, and calibration plots for every model22. The calibration intercept and slope were jointly estimated by logistic regression of the observed outcome on the logit of predicted risk. This intercept is not calibration-in-the-large estimated with the slope fixed at 1. Ideal joint calibration has an intercept of 0 and a slope of 1. Calibration-decile counts and Wilson intervals for observed mortality are reported in Supplementary Table 5.
Threshold-dependent metrics were secondary. Sensitivity, specificity, positive predictive value (PPV), negative predictive value (NPV), accuracy, F1 score, and the complete confusion matrix were calculated at a prespecified probability threshold of 0.50. The 0.50 threshold was a conventional default for descriptive classification, with no established clinical meaning. It was not tuned on held-out data and is not a recommended treatment threshold. Decision-curve analysis (DCA) compared all models with treat-all and treat-none strategies from 0.10 to 0.8023. For interpretation, a positive model result was considered a potential trigger for additional senior review, reassessment of organ support, and closer monitoring, not as an instruction to limit or initiate a specific therapy. Selected net-benefit values and the scope of the threshold summaries are provided in Supplementary Table 6.
Sensitivity and explainability analyses
Two sensitivity analyses used three repetitions of five-fold outer cross-validation with three-fold inner tuning for LASSO after removing (1) SOFA and Charlson scores, and (2) PEEP/EPAP plus the early invasive-ventilation, vasopressor, and renal-replacement indicators. These analyses examined redundancy from aggregate scores and dependence on treatment variables (Supplementary Table 7). Five-fold LASSO tuning was also repeated 30 times on the same cohort using different split seeds. This exploratory assessment describes sensitivity to tuning splits, not patient-bootstrap stability (Supplementary Table 8). For nonlinear explanation, XGBoost was refitted in a separate five-fold outer cross-validation with three-fold inner tuning. Native TreeSHAP contributions were calculated only for the held-out fold and expressed on the model log-odds (margin) scale24. Contributions from indicator columns belonging to the same original predictor were summed before taking absolute values and averaging across participants. Relative importance was calculated using all 26 original predictors. Shapley additive explanations (SHAP) describe the fitted XGBoost model and were not used to select LASSO predictors or to make causal claims. The complete original-predictor ranking is reported in Supplementary Table 9. The exact background/reference specification and prediction-contribution options could not be verified from the available archived analysis materials.
Software, reporting, and risk-of-bias framework
The software, versions, developers, resource identifiers, and purposes are listed in the separate Table of Materials. The model-fitting environment and the additional figure/table reproduction environment are distinguished there; the latter was used to reproduce figures and tables from archived results rather than to refit the models. The complete analysis script, fixed seeds, derived tables, and figures are described in the data-availability statement. Reporting was assessed against the Transparent Reporting of a Multivariable Prediction Model for Individual Prognosis or Diagnosis + Artificial Intelligence (TRIPOD+AI) statement11. All checklist items and subitems, including the abstract checklist, were reviewed. Supplementary Table 10 records manuscript locations, reporting gaps, and reasons for non-applicability12. This review does not imply that every reporting requirement has been met. PROBAST+AI informed the qualitative self-assessment of methodological limitations in Supplementary Table 11; no formal signalling-question assessment or independent external appraisal was completed.
תוצאות
Cohort and data audit
The reported cohort flow comprised 2,850 screened sepsis records, 1,320 reported ARDS diagnoses, and 365 sequential, mutually exclusive exclusions, leaving 955 patients in the 24-h landmark cohort (Figure 2). Ming Zhong assessed ARDS eligibility using the Berlin criteria. The difference of 1,530 between the screening and ARDS counts is arithmetic and is not a verified count of patients assessed and found not to meet Berlin criteria. Of the 40 patients excluded for an ICU stay shorter than 24 h, 15 died within this interval and 25 were transferred to another department. Among the 955 included patients, 481 (50.4%) survived and 474 (49.6%) died by day 28. The final analytic extract supports these included-cohort counts but lacks source records needed to reconstruct screening.
The median age was 62 years, 582 patients (60.9%) were male, 809 (84.7%) received invasive mechanical ventilation within 24 h, 620 (64.9%) received vasopressors, and 141 (14.8%) received renal replacement therapy. Non-survivors were older and had a greater chronic disease burden, lower PaO₂/FiO₂ ratios, a different distribution of SOFA scores despite identical median scores in both groups (10.0; interquartile range, 9.0–12.0 vs. 8.0–12.0; standardized mean difference, 0.32), and higher lactate levels (Table 1).
Repeated nested cross-validated performance
Among 955 participants with 474 deaths, based on the averaged held-out probabilities, LASSO had an AUC of 0.732 (95% CI, 0.698–0.761), compared with 0.729 (0.696–0.761) for conventional logistic regression, 0.709 (0.674–0.740) for XGBoost, 0.707 (0.673–0.739) for random forest, and 0.581 (0.545–0.617) for SOFA alone (Table 2 and Figure 3). The LASSO-minus-conventional-regression AUC difference was 0.003 (95% CI, -0.003 to 0.010; paired bootstrap p = 0.352). LASSO exceeded random forest by 0.025 (0.009–0.043; p = 0.004), XGBoost by 0.022 (0.008–0.037; p = 0.004), and SOFA alone by 0.150 (0.109–0.190; p < 0.001) (Table 3). The confidence intervals and paired comparisons used 1,000 bootstrap resamples of fixed participant-level predictions without refitting or retuning the models; they are not full optimism-corrected intervals.
LASSO had a Brier score of 0.209 (95% CI, 0.199–0.220), calibration intercept of -0.001 (95% CI, -0.154 to 0.146), and calibration slope of 1.065 (95% CI, 0.887–1.259). Conventional logistic regression had a Brier score of 0.212 and a slope of 0.796 (95% CI, 0.665–0.946), indicating overly extreme risk predictions, consistent with overfitting. Random forest had a slope of 1.677 (95% CI, 1.365–2.007), indicating risk predictions that were too moderate or insufficiently spread. Both departures support assessment of recalibration in independent data before clinical use. SOFA-only regression had a near-ideal calibration intercept of 0.000 and slope of 0.944, despite an AUC of 0.581, illustrating that calibration and discrimination measure different properties. Its slope interval was wide (95% CI, 0.522–1.364). Calibration plots and predicted-risk distributions are shown in Figure 4.
Threshold-dependent performance and clinical utility
At the prespecified conventional default threshold of 0.50, LASSO classified 304 deaths as positive, 170 deaths as negative, 155 survivors as positive, and 326 survivors as negative. Sensitivity was 0.641 (95% CI, 0.597–0.684), specificity 0.678 (0.637–0.717), positive predictive value 0.662 (0.616–0.708), and negative predictive value 0.657 (0.614–0.698) (Table 4). Accuracy was 0.660 (95% CI, 0.629–0.690), and the F1 score was 0.652 (0.614–0.686). The cutoff has no established clinical rationale and serves only to summarize classification performance.
At the illustrative thresholds of 0.30, 0.50, and 0.65, LASSO had greater estimated net benefit than both treat-all and treat-none strategies, with values of 0.301, 0.156, and 0.088, respectively (Figure 5). Differences from other multivariable models were small. Conventional logistic regression had a net benefit of 0.299 at 0.30, compared with 0.301 for LASSO; at 0.50, XGBoost had a net benefit of 0.158, compared with 0.156 for LASSO (Supplementary Table 6). These estimates do not establish a clinical-utility advantage for LASSO. The shaded 0.30–0.65 region illustrates a possible additional-review workflow and is not a validated operating range. The decision curves do not demonstrate improved outcomes from model-guided care.
Final LASSO equation and sensitivity analyses
The final full-cohort LASSO refit selected C = 0.0452 (implementation-specific penalty index 1/C = 22.12) using a separate 10-fold procedure and retained eight nonzero predictor terms. This C value was not one of the seven candidate values used during nested validation, although it lies within their numerical range of 0.005–3. The finer 30-value grid was used to refine selection of the penalty for the full-cohort equation. Because both the tuning grid and fold scheme differed, the reported nested-validation performance does not validate this final equation.
The back-transformed, original-scale linear predictor was:
LP = -3.138671 + 0.028115(Age) + 0.228926(Charlson Index) - 0.004742(PaO₂/FiO₂) + 0.088872(SOFA) + 0.126599(Lactate) + 0.022202(Bilirubin) - 0.109025(Other infection) + 0.261243(Vasopressor use).
Predicted probability = 1/[1 + exp(-LP)]. “Other infection” equals 1 for the other-infection category and 0 for respiratory, abdominal, urinary, and bloodstream infection. These four sites therefore have the same infection-site contribution of zero in the reduced equation, whose effective comparison category is all sites other than “other.” Respiratory infection was the reference category only in the original candidate encoding. “Vasopressor use” equals 1 when present before the landmark and 0 otherwise. Table 5 lists units and coefficients rounded to six decimal places; full-precision values are described as accompanying the analysis code. This equation is provided for independent validation, not direct clinical deployment.
In the separately resampled sensitivity analysis, LASSO without SOFA and Charlson scores had an AUC of 0.673 (95% CI, 0.642–0.704). Removing PEEP/EPAP and early organ-support indicators produced an AUC of 0.722 (0.688–0.756). Supplementary Table 7 provides the sensitivity results, including the corresponding calibration and Brier scores. These analyses suggest that aggregate severity and chronic-disease information contributed important predictive signal, whereas the primary result was not fully dependent on early treatment indicators.
Held-out XGBoost explanation
The held-out TreeSHAP analysis explains XGBoost predictions, not the LASSO equation. In this analysis, the largest mean absolute contributions to XGBoost output were age (16.7% of total importance), lactate (13.9%), Charlson Comorbidity Index (13.7%), PaO₂/FiO₂ ratio (12.9%), and SOFA score (9.8%) (Figure 6). Vasopressor use ranked sixth. Figure 6 displays all 26 original predictors. The complete ranking is provided in Supplementary Table 9, and relative importance was calculated using all 26 original predictors. The direction and magnitude of a SHAP value reflect the XGBoost log-odds output conditional on that fitted model; they do not estimate causal effects and should not be used to interpret the LASSO coefficients.
DATA AVAILABILITY:
The de-identified analytic dataset, data dictionary, analysis code, and model coefficients are publicly available in Zenodo (version 1.0; doi: 10.5281/zenodo.22342338).
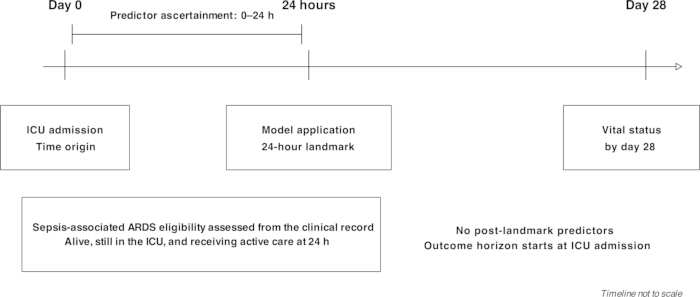
Figure 1. Prediction timeline. ICU admission is day 0. Candidate predictors are restricted to the first 24 h, and the model is applied only to patients alive, still in the ICU, and receiving active treatment at the 24-h landmark. The outcome is all-cause death by day 28 from ICU admission, not 28 days after the landmark. Diagnosis timing is not reconstructed from the final analytic file. The timeline is not to scale. Please click here to view a larger version of this figure.
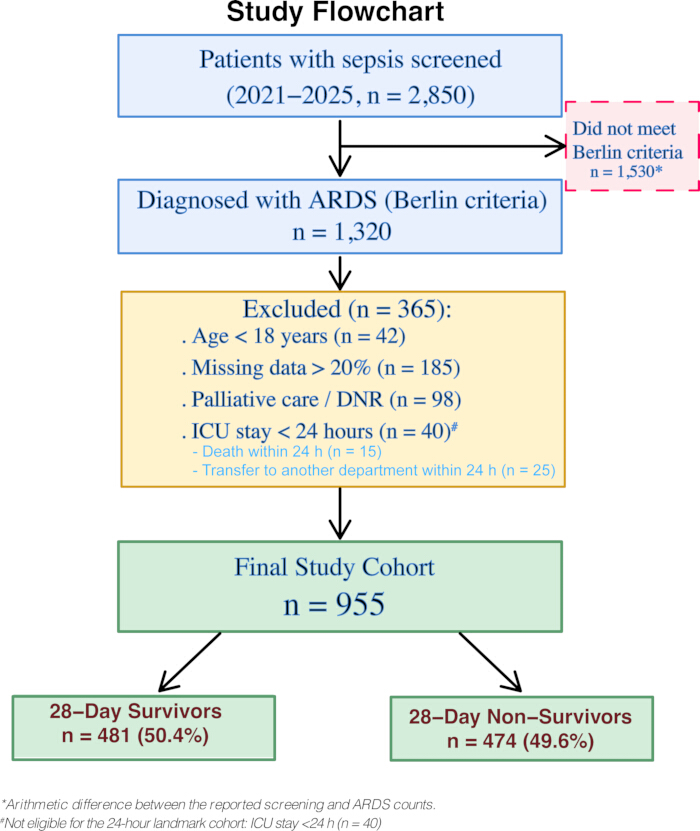
Figure 2. Participant flow. Ming Zhong assessed ARDS eligibility using the Berlin criteria. The four exclusion criteria were applied sequentially in the displayed order and the counts are mutually exclusive. Of the 40 patients with an ICU stay shorter than 24 h, 15 died within this interval and 25 were transferred to another department. Screening and exclusion counts are those reported for the cohort; 1,530 is the arithmetic difference between 2,850 screened records and 1,320 ARDS diagnoses, not an independently verified non-ARDS count. The final analytic cohort contains 955 unique analytic identifiers, 481 survivors, and 474 non-survivors. Unique analytic identifiers do not establish the numbers of unique source patients, hospital admissions, or ICU stays in the screening population. DNR, do-not-resuscitate. Please click here to view a larger version of this figure.
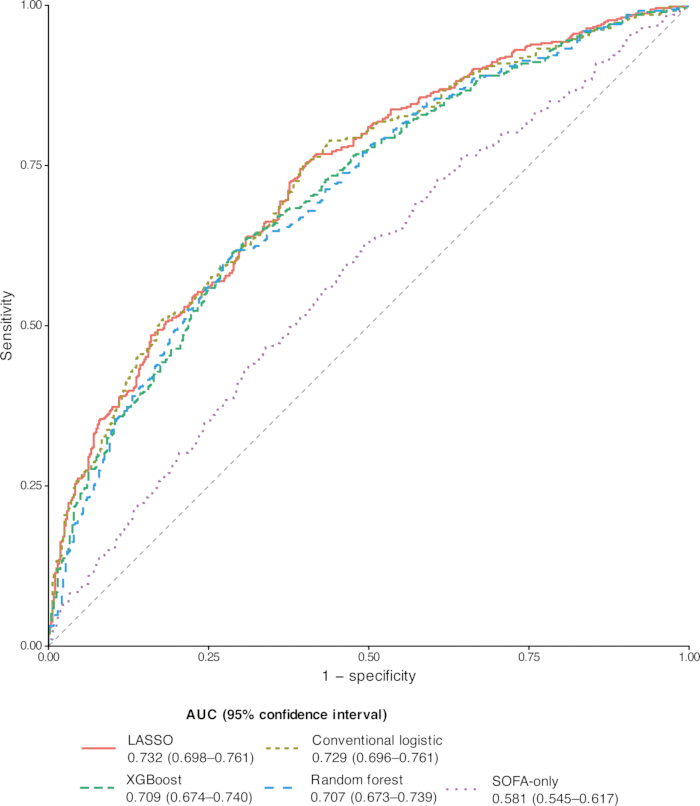
Figure 3. Receiver operating characteristic curves. Curves use the mean of five held-out probabilities per participant from five repetitions of five-fold outer cross-validation with three-fold inner tuning. Legend intervals are the 1,000-sample fixed-prediction bootstrap AUC intervals reported in Table 2; they are not curve-wise confidence bands. AUC, area under the receiver operating characteristic curve. Please click here to view a larger version of this figure.
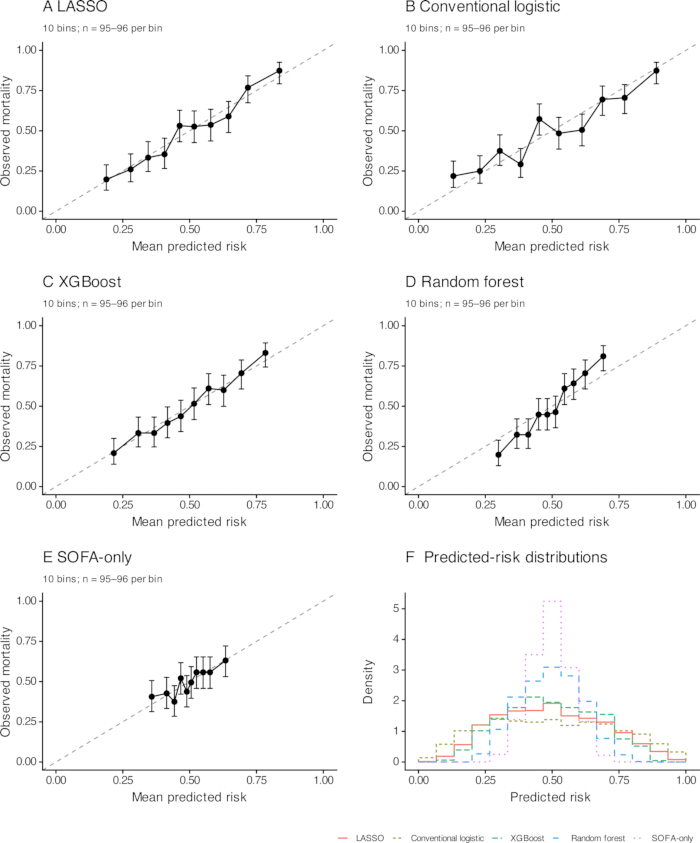
Figure 4. Calibration and predicted-risk distributions. Panels A–E show LASSO, conventional logistic regression, XGBoost, random forest, and SOFA-only predictions, respectively. Points are observed 28-day mortality in ten ordered risk bins of 95–96 participants; bars are Wilson 95% confidence intervals. The diagonal denotes ideal agreement. Panel F shows histograms of the averaged held-out predicted probabilities on a density scale. Numerical bin results are in Supplementary Table 5. Please click here to view a larger version of this figure.
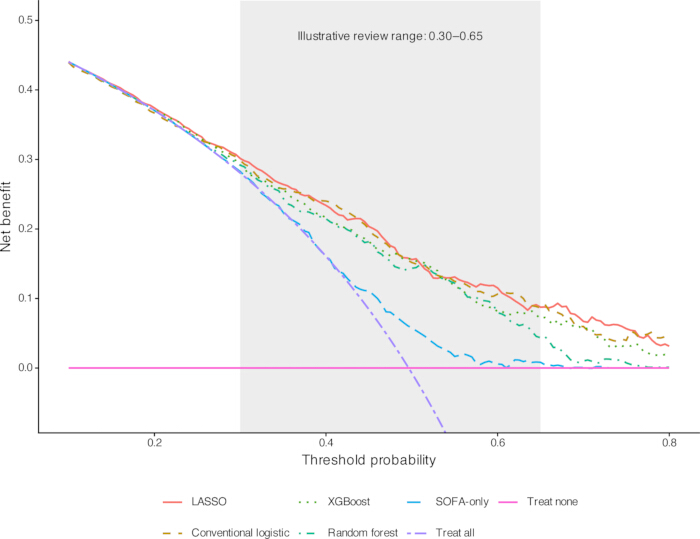
Figure 5. Decision-curve analysis. Net benefit was calculated directly from averaged held-out probabilities across thresholds of 0.10–0.80 in increments of 0.005. All five models are compared with treat-all and treat-none. The shaded 0.30–0.65 region illustrates a possible additional-review use case and is not a validated clinical cutoff range. The treat-all curve continues below the displayed y-axis range at high thresholds. These curves do not demonstrate improved outcomes from model-guided care. Please click here to view a larger version of this figure.
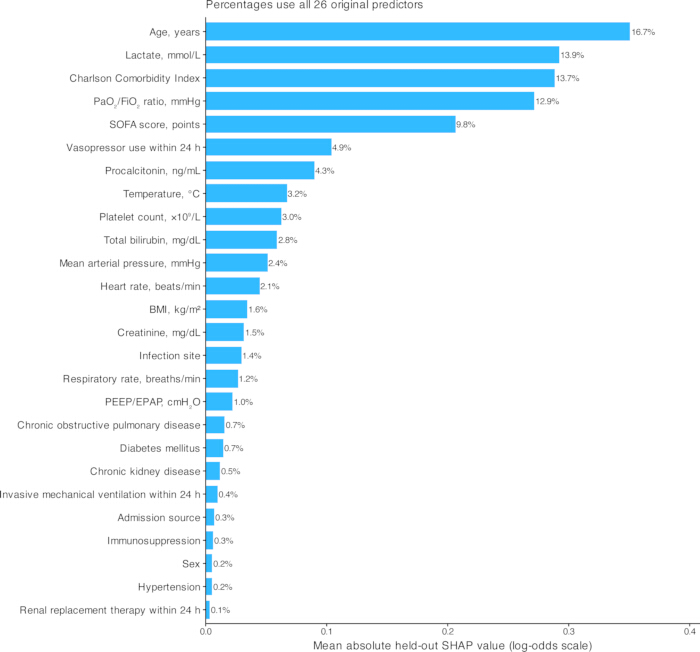
Figure 6. Complete global XGBoost feature importance from held-out native TreeSHAP values. All 26 original predictors are shown. Bars represent mean absolute contributions on the log-odds scale; right-hand labels express each predictor’s share of the total importance across all 26 predictors. Indicator-column contributions were summed within each original predictor before taking absolute values and averaging. These quantities explain XGBoost predictions, not the LASSO coefficients or causal effects. Numerical values are in Supplementary Table 9. The exact background/reference specification and prediction-contribution options could not be verified from the available archived analysis materials. Please click here to view a larger version of this figure.
| Characteristic | Overall(N = 955) | Survivors(n = 481) | Non-survivors(n = 474) | SMD |
| Age, years | 62.0 (53.0–71.0) | 59.0 (51.0–68.0) | 65.0 (55.0–74.8) | 0.45 |
| BMI, kg/m² | 27.0 (23.5–30.3) | 27.2 (23.3–30.1) | 26.9 (23.6–30.4) | 0.02 |
| Charlson Comorbidity Index | 2.0 (1.0–3.0) | 2.0 (1.0–3.0) | 3.0 (2.0–4.0) | 0.43 |
| Temperature, °C | 37.5 (36.6–38.3) | 37.5 (36.7–38.3) | 37.5 (36.6–38.4) | 0.01 |
| Heart rate, beats/min | 105.0 (89.0–122.0) | 107.0 (90.0–123.0) | 103.5 (89.0–120.0) | 0.07 |
| Respiratory rate, breaths/min | 28.0 (23.0–33.0) | 28.0 (23.0–33.0) | 28.0 (23.0–32.8) | 0.05 |
| Mean arterial pressure, mmHg | 72.0 (62.0–81.0) | 72.0 (62.0–81.0) | 72.0 (62.0–81.0) | 0.02 |
| PaO₂/FiO₂ ratio, mmHg | 123.0 (93.0–161.0) | 133.0 (101.0–168.0) | 114.0 (87.0–153.8) | 0.31 |
| PEEP/EPAP, cmH₂O | 10.0 (8.0–12.0) | 10.0 (8.0–12.0) | 10.0 (8.0–12.0) | 0.07 |
| SOFA score, points | 10.0 (8.0–12.0) | 10.0 (8.0–12.0) | 10.0 (9.0–12.0) | 0.32 |
| Lactate, mmol/L | 2.2 (1.4–3.6) | 1.9 (1.2–3.0) | 2.5 (1.5–4.3) | 0.37 |
| Platelet count, ×10⁹/L | 178.0 (116.0–242.0) | 180.0 (116.0–243.0) | 173.0 (116.2–239.0) | 0.03 |
| Creatinine, mg/dL | 1.3 (0.7–2.2) | 1.3 (0.7–2.3) | 1.3 (0.8–2.1) | 0.02 |
| Total bilirubin, mg/dL | 1.0 (0.6–1.6) | 1.0 (0.7–1.6) | 1.1 (0.6–1.6) | 0.11 |
| Procalcitonin, ng/mL | 4.8 (1.7–13.7) | 4.7 (1.8–11.7) | 4.9 (1.6–15.0) | 0.10 |
| Sex, n (%) | 0.10 | |||
| Female | 373 (39.1) | 200 (41.6) | 173 (36.5) | |
| Male | 582 (60.9) | 281 (58.4) | 301 (63.5) | |
| Admission source, n (%) | 0.05 | |||
| Emergency department | 478 (50.1) | 235 (48.9) | 243 (51.3) | |
| Interhospital transfer | 185 (19.4) | 94 (19.5) | 91 (19.2) | |
| Hospital ward | 292 (30.6) | 152 (31.6) | 140 (29.5) | |
| Infection site, n (%) | 0.20 | |||
| Respiratory | 544 (57.0) | 273 (56.8) | 271 (57.2) | |
| Abdominal | 168 (17.6) | 75 (15.6) | 93 (19.6) | |
| Blood | 93 (9.7) | 53 (11.0) | 40 (8.4) | |
| Urinary | 88 (9.2) | 40 (8.3) | 48 (10.1) | |
| Other | 62 (6.5) | 40 (8.3) | 22 (4.6) | |
| Hypertension, n (%) | 444 (46.5) | 221 (45.9) | 223 (47.0) | 0.02 |
| Diabetes mellitus, n (%) | 335 (35.1) | 175 (36.4) | 160 (33.8) | 0.06 |
| Chronic obstructive pulmonary disease, n (%) | 155 (16.2) | 81 (16.8) | 74 (15.6) | 0.03 |
| Chronic kidney disease, n (%) | 180 (18.8) | 83 (17.3) | 97 (20.5) | 0.08 |
| Immunosuppression, n (%) | 101 (10.6) | 46 (9.6) | 55 (11.6) | 0.07 |
| Invasive mechanical ventilation within 24 h, n (%) | 809 (84.7) | 410 (85.2) | 399 (84.2) | 0.03 |
| Vasopressor use within 24 h, n (%) | 620 (64.9) | 293 (60.9) | 327 (69.0) | 0.17 |
| Renal replacement therapy within 24 h, n (%) | 141 (14.8) | 68 (14.1) | 73 (15.4) | 0.04 |
| Data are median (interquartile range) or n (%). Only the present/yes level is shown for binary comorbidity and treatment indicators. SMDs are descriptive absolute standardized mean differences; one global SMD is reported for each nominal variable. No hypothesis tests were used for predictor selection. BMI, body mass index; PEEP/EPAP, positive end-expiratory/expiratory positive airway pressure; SOFA, Sequential Organ Failure Assessment; SMD, standardized mean difference. | ||||
Table 1: Characteristics of the final analytic cohort by 28-day outcome. Data are median (interquartile range) or n (%). Only the present/yes level is shown for binary comorbidity and treatment indicators. SMDs are descriptive absolute standardized mean differences; one global SMD is reported for each nominal variable. No hypothesis tests were used for predictor selection. BMI, body mass index; PEEP/EPAP, positive end-expiratory/expiratory positive airway pressure; SOFA, Sequential Organ Failure Assessment; SMD, standardized mean difference.
| Model | AUC(95% CI) | Brier score(95% CI) | Calibration intercept(95% CI) | Calibration slope(95% CI) |
| SOFA-only | 0.581(0.545 to 0.617) | 0.245(0.240 to 0.250) | 0.000(-0.132 to 0.127) | 0.944(0.522 to 1.364) |
| Conventional logistic | 0.729(0.696 to 0.761) | 0.212(0.200 to 0.224) | -0.010(-0.156 to 0.124) | 0.796(0.665 to 0.946) |
| LASSO | 0.732(0.698 to 0.761) | 0.209(0.199 to 0.220) | -0.001(-0.154 to 0.146) | 1.065(0.887 to 1.259) |
| Random forest | 0.707(0.673 to 0.739) | 0.222(0.215 to 0.229) | 0.013(-0.124 to 0.154) | 1.677(1.365 to 2.007) |
| XGBoost | 0.709(0.674 to 0.740) | 0.217(0.208 to 0.226) | 0.002(-0.133 to 0.149) | 1.095(0.901 to 1.306) |
| Each participant contributed the mean of five held-out probabilities from repeated nested cross-validation. Percentile intervals use 1,000 participant-level bootstrap samples of these fixed predictions, without model refitting. Calibration intercept and slope were estimated jointly. Values rounded to 0.000 may be slightly positive or negative. AUC, area under the receiver operating characteristic curve; CI, confidence interval. | ||||
Table 2: Probability performance based on averaged held-out predictions. Each participant contributed the mean of five held-out probabilities from repeated nested cross-validation. Percentile intervals use 1,000 participant-level bootstrap samples of these fixed predictions, without model refitting. Calibration intercept and slope were estimated jointly. Values rounded to 0.000 may be slightly positive or negative. AUC, area under the receiver operating characteristic curve; CI, confidence interval.
| Comparison | AUC difference | 95% CI | Paired bootstrap P |
| LASSO minus SOFA-only | 0.150 | 0.109 to 0.190 | <.001 |
| LASSO minus Conventional logistic | 0.003 | -0.003 to 0.010 | .352 |
| LASSO minus Random forest | 0.025 | 0.009 to 0.043 | .004 |
| LASSO minus XGBoost | 0.022 | 0.008 to 0.037 | .004 |
| Differences are LASSO minus the comparator. Paired resampling used the same participants for both models in each of 1,000 bootstrap samples. These exploratory comparisons do not constitute independent validation of the final full-cohort equation. AUC, area under the receiver operating characteristic curve; CI, confidence interval. | |||
Table 3: Paired AUC comparisons of LASSO with alternative models. Differences are LASSO minus the comparator. Paired resampling used the same participants for both models in each of 1,000 bootstrap samples. These exploratory comparisons do not constitute independent validation of the final full-cohort equation. AUC, area under the receiver operating characteristic curve; CI, confidence interval.
| Model | TP | FP | TN | FN | Sensitivity (95% CI) | Specificity (95% CI) | PPV (95% CI) | NPV (95% CI) | Accuracy (95% CI) | F1 (95% CI) |
| SOFA-only | 236 | 181 | 300 | 238 | 0.498(0.451 to 0.544) | 0.624(0.582 to 0.670) | 0.566(0.517 to 0.614) | 0.558(0.515 to 0.599) | 0.561(0.531 to 0.594) | 0.530(0.491 to 0.571) |
| Conventional logistic | 299 | 154 | 327 | 175 | 0.631(0.585 to 0.676) | 0.680(0.638 to 0.720) | 0.660(0.615 to 0.701) | 0.651(0.611 to 0.694) | 0.655(0.625 to 0.685) | 0.645(0.607 to 0.679) |
| LASSO | 304 | 155 | 326 | 170 | 0.641(0.597 to 0.684) | 0.678(0.637 to 0.717) | 0.662(0.616 to 0.708) | 0.657(0.614 to 0.698) | 0.660(0.629 to 0.690) | 0.652(0.614 to 0.686) |
| Random forest | 301 | 164 | 317 | 173 | 0.635(0.590 to 0.678) | 0.659(0.618 to 0.703) | 0.647(0.603 to 0.690) | 0.647(0.603 to 0.688) | 0.647(0.617 to 0.674) | 0.641(0.605 to 0.674) |
| XGBoost | 302 | 151 | 330 | 172 | 0.637(0.591 to 0.678) | 0.686(0.641 to 0.729) | 0.667(0.617 to 0.712) | 0.657(0.612 to 0.697) | 0.662(0.630 to 0.690) | 0.652(0.612 to 0.684) |
| Counts and metrics use averaged held-out predictions. Intervals are percentile 95% bootstrap confidence intervals from 1,000 samples. The 0.50 cutoff was not optimized on held-out observations and is not a recommended clinical treatment threshold. TP, true positive; FP, false positive; TN, true negative; FN, false negative; PPV, positive predictive value; NPV, negative predictive value. | ||||||||||
Table 4: Classification performance at the prespecified probability threshold of 0.50. Counts and metrics use averaged held-out predictions. Intervals are percentile 95% bootstrap confidence intervals from 1,000 samples. The 0.50 cutoff was not optimized on held-out observations and is not a recommended clinical treatment threshold. TP, true positive; FP, false positive; TN, true negative; FN, false negative; PPV, positive predictive value; NPV, negative predictive value.
| Term | Unit or coding | Coefficient | exp(coefficient) |
| Intercept | — | -3.138671 | Not applicable |
| Age, years | Per year | 0.028115 | 1.029 |
| Charlson Comorbidity Index | Per point | 0.228926 | 1.257 |
| PaO₂/FiO₂ ratio, mmHg | Per mmHg | -0.004742 | 0.995 |
| SOFA score, points | Per point | 0.088872 | 1.093 |
| Lactate, mmol/L | Per mmol/L | 0.126599 | 1.135 |
| Total bilirubin, mg/dL | Per mg/dL | 0.022202 | 1.022 |
| Other infection (reference: all non-other sites) | 1 if other; 0 if respiratory, abdominal, urinary, or bloodstream | -0.109025 | 0.897 |
| Vasopressor use within 24 h | 1 if present; 0 otherwise | 0.261243 | 1.299 |
| Probability = 1/[1 + exp(−LP)], where LP is the intercept plus the sum of coefficient × predictor. Coefficients are back-transformed to the original measurement scale. Other infection is coded 1 only for the other-site category; respiratory, abdominal, urinary, and bloodstream infection are coded 0 and form the effective reference group in this reduced equation. exp(coefficient) is a descriptive transformation of the penalized coefficient, not post-selection hypothesis-test evidence. Full-precision coefficients are included in the result CSV. The full-cohort refit used a different tuning grid from nested validation and requires external validation. | |||
Table 5: Complete original-scale final LASSO equation. Probability = 1/[1 + exp(−LP)], where LP is the intercept plus the sum of coefficient × predictor. Coefficients are back-transformed to the original measurement scale. Other infection is coded 1 only for the other-site category; respiratory, abdominal, urinary, and bloodstream infection are coded 0 and form the effective reference group in this reduced equation. exp(coefficient) is a descriptive transformation of the penalized coefficient, not post-selection hypothesis-test evidence. Full-precision coefficients are included in the result CSV. The full-cohort refit used a different tuning grid from nested validation and requires external validation.
Supplementary Table 1. Data dictionary and retained measurement information. This data dictionary specifies the study’s extraction rules and identifies source information not retained in the analytic dataset. The 26 candidate predictors produce 30 encoded parameters, excluding the intercept. All encoded columns were standardized within training folds for conventional and LASSO regression. ICU, intensive care unit; ICD, International Classification of Diseases; PEEP/EPAP, positive end-expiratory/expiratory positive airway pressure. Please click here to download this file.
Supplementary Table 2. Data audit and missingness in the final analytic cohort. All candidate predictors were complete in the final 955-patient cohort after application of the four prespecified exclusion criteria. No missing-value imputation, supplementary data entry to fill missing predictor values, or additional patient exclusion beyond those criteria was performed. The 185 exclusions for more than 20% patient-level missingness do not quantify variable-level missingness in the original eligible cohort. Complete predictor data in retained patients do not rule out selection bias. Please click here to download this file.
Supplementary Table 3. Model implementation and fold-specific tuning settings. CV, cross-validation; AUC, area under the receiver operating characteristic curve. For the fold-setting block, RF settings are depth / max_features / minimum leaf size. XGB settings are depth / learning rate / boosting rounds / minimum child weight. Inner AUCs are listed as LASSO / RF / XGB. The companion Python script contains the complete executable estimator specifications. Please click here to download this file.
Supplementary Table 4. AUCs in each held-out outer fold. Each patient appears in one held-out fold per repetition. Fold AUCs are descriptive and are not statistically independent because training samples overlap. The primary pooled AUC uses the mean of five held-out probabilities per patient and is not the arithmetic mean of these fold AUCs. Please click here to download this file.
Supplementary Table 5. Calibration deciles and observed-mortality uncertainty. Deciles contain 95–96 participants, ordered by averaged held-out predicted risk. Death counts are exactly recoverable from observed proportions and bin size. Wilson intervals describe bin-level observed mortality, not a confidence band for an estimated calibration function. Numerical coordinates are the same as those used in Figure 4. Please click here to download this file.
Supplementary Table 6. Exploratory decision-curve summaries. Qualifying grid points had net benefit greater than both treat-all and treat-none. Lowest and highest values summarize qualifying points on the 0.10–0.80 grid (step 0.005); they do not establish that every intervening threshold qualifies. Treat-none net benefit is zero. Full curves are supplied in DCA_plot_data.csv. The 0.30–0.65 interval is illustrative, not a validated clinical operating range. Please click here to download this file.
Supplementary Table 7. Sensitivity analyses of the LASSO approach. The primary row repeats Table 2 and uses five repetitions of nested cross-validation and 1,000 bootstrap samples. Each reduced-predictor analysis used three repetitions and 500 bootstrap samples. Removing early organ-support information excludes PEEP/EPAP, invasive ventilation, vasopressor use, and renal replacement therapy. The feature sets were not evaluated through a matched-fold formal comparison. Please click here to download this file.
Supplementary Table 8. LASSO selection under repeated tuning splits. Thirty fits repeated five-fold hyperparameter tuning with different random seeds on the same 955-patient cohort. This evaluates sensitivity to tuning splits, not patient-bootstrap selection stability or external validation. The C grid was the same coarse grid used in nested validation. Coefficients are on the standardized scale and must not be substituted for the original-scale final equation in Table 5. Please click here to download this file.
Supplementary Table 9. Complete held-out XGBoost TreeSHAP ranking. Values were calculated for held-out participants from a separate five-fold XGBoost analysis. Indicator contributions were summed to the original predictor before taking absolute values and averaging. Relative importance uses all 26 original predictors in the denominator. Values explain the fitted XGBoost output, not LASSO coefficients or causal effects. Figure 6 displays all 26 predictors. Please click here to download this file.
Supplementary Table 10. TRIPOD+AI item-by-item reporting checklist. Part A covers all 27 main items in 52 numbered entries. Part B covers the 13 abstract-checklist items. Item prompts are abbreviated; numbering and order follow the official checklists. Locations use section and exhibit identifiers. † Locations use section titles and exhibit identifiers. ‡ Reported indicates that the requested information is stated; Partial indicates incomplete reporting; Not reported indicates that the information is not stated; Not applicable indicates that the conditional activity or separate evaluation was not performed. These labels are descriptive and are not official scores or risk-of-bias ratings. Part B assesses the manuscript abstract. Identifiers 1–13 follow the separate TRIPOD+AI for Abstracts checklist and do not replace the main checklist identifiers. The item labels are concise descriptions of the official checklist items. The checklist identifies reported information and remaining gaps; it does not constitute independent certification or establish complete reporting adherence. Please click here to download this file.
Supplementary Table 11. PROBAST+AI-informed qualitative self-assessment without a formal signalling-question assessment. The study’s methodological limitations were reviewed qualitatively using the PROBAST+AI framework. No formal item-by-item signalling-question assessment was completed, and no domain-level or overall risk-of-bias ratings were assigned. This self-assessment is not an independent external appraisal. The identified limitations remain relevant to interpretation and applicability. Please click here to download this file.
דיון
This analysis yielded three main findings. First, the 24-h LASSO approach provided moderate discrimination and close-to-ideal calibration of averaged held-out probabilities. Second, its discrimination was almost identical to conventional logistic regression using the same candidate predictors. Third, both regression approaches outperformed SOFA alone, while the tree-based models provided no incremental discrimination in this cohort. A systematic review of clinical prediction studies likewise found no consistent advantage of machine learning over logistic regression in comparisons at lower risk of bias25. However, a large benchmark study found that random forests performed better on many other datasets, which cautions against treating this result as a universal ranking of algorithms26. These findings favor a transparent regression approach for further testing, not a general claim that regression is always superior.
The pooled LASSO AUC of 0.732 was lower than the estimate of 0.759 obtained with the previously reported single-split approach and the test-set AUC of 0.8015 reported by Mu and colleagues in 2,466 patients with sepsis-associated ARDS9. Other ARDS prediction studies have also reported useful discrimination, but their populations, outcome definitions, and validation strategies differ from those in this study7,8,10. These are contextual comparisons rather than head-to-head evaluations. Repeated nested resampling reduces dependence on one split and keeps tuning separate from held-out evaluation, but averaging repeated predictions and reusing overlapping training samples must still be considered when interpreting the pooled performance. The near-zero paired difference from conventional regression underscores the importance of a like-for-like comparator before attributing gains to algorithm class.
The final LASSO terms have plausible clinical interpretations, but plausibility is not proof of causality. ARDS-specific lung injury contributes to prognosis in sepsis, while host characteristics and disease severity also influence outcomes27,28. Age and comorbidity burden reflect baseline vulnerability; lower PaO₂/FiO₂ indicates worse oxygenation; and SOFA summarizes multiorgan dysfunction. Lactate and vasopressor use convey information about acute circulatory illness, although lactate should be interpreted alongside other perfusion findings rather than as a single therapeutic target29. Held-out XGBoost SHAP values highlighted a similar set of influential features, but they explain that fitted model rather than the LASSO equation. Current explainability methods do not replace causal reasoning, accuracy assessment, or clinical validation30. The small bilirubin and infection-site coefficients therefore remain candidates for external stability assessment, not independently established treatment targets. The unverified background/reference specification and prediction-contribution settings also limit the reproducibility of the TreeSHAP analysis.
The proposed use is a structured clinical review at 24 h, not an instruction to prescribe therapy or limit care. Review could address oxygenation, perfusion, organ-support requirements, and the trajectory since admission within the broader clinical priorities described in sepsis guidance31. The decision curves suggest potential net benefit for an additional-review strategy in this development setting, but they do not show that model-guided care improves patient outcomes. The illustrative 0.30–0.65 range is not a validated operating interval. Threshold selection must reflect local workload and the relative consequences of missed high-risk patients and unnecessary review. Responsible translation requires assessment of workflow, safety, and unintended consequences32. A subsequent prospective early-stage evaluation could follow DECIDE-AI, which is relevant to future deployment studies rather than the reporting of this retrospective analysis33.
The explicit landmark, conventional-regression comparator, quantitative calibration, complete equation, paired comparisons, and held-out explainability analysis improve transparency. Important source-data limitations remain. The analytic extract lacks the source screening cohort, dated measurements, cross-admission source-patient identifiers, SOFA components, and ARDS adjudication fields. Variable-level source missingness, excluded-patient characteristics, and the screening sequence cannot be reconstructed from the current analytic extract. Consequently, the reported analyses cannot be verified against source clinical documents using the available extract. Patient-level admission dates can be re-extracted from the institutional system. The availability of the other source-level information required to reconstruct screening and assess missingness remains to be confirmed. The high 28-day mortality of 49.6% characterizes a selected landmark cohort at one tertiary center and limits transportability of the estimated absolute risks. Excluding ICU stays shorter than 24 h removed 15 patients who died and 25 who were transferred to another department within that interval, limiting applicability to patients who remained in the ICU at the 24-h landmark. Patients with a pre-existing palliative-care or do-not-resuscitate order were also excluded; the model does not apply to them. Excluding patients with more than 20% missing candidate-predictor data may have introduced selection bias if these patients differed systematically from those retained. Complete predictor data in the final cohort do not eliminate this potential bias34.
The performance estimates also have a narrower interpretation than a fully validated final model. They summarize means of five held-out predictions per patient. No bootstrap optimism correction was performed. The reported bootstrap intervals describe sampling variability in fixed averaged held-out predictions only, because development and tuning were not repeated within resamples. Overlapping training sets and model-selection variation can make uncertainty larger than simple resampling summaries suggest35. The full-cohort LASSO equation used a finer grid and a different tuning scheme from nested validation, so it was not itself evaluated as an independently fixed model. The 30-fit selection analysis assessed tuning-split sensitivity on the same participants, not patient-bootstrap stability. The post hoc sample-size benchmark also depends on an anticipated C-statistic of 0.80 and does not establish adequate complexity for every algorithm. Temporal validation was not performed, and the internal validation results do not establish whether predictive performance would be maintained in patients admitted during a later period. Independent temporal and multicenter validation of the final equation, including calibration, possible recalibration, and decision-curve assessment, is needed before clinical implementation36. Within this single-center cohort, internal validation of the LASSO approach showed moderate discrimination and acceptable calibration of averaged held-out predictions, with no clear discrimination advantage over conventional multivariable regression using the same predictors. The final eight-term equation enables independent testing; source-data verification and prospective assessment of the intended review workflow remain necessary before clinical use.
גילויים
The authors declare no financial or non-financial competing interests. During manuscript revision, OpenAI Codex was used to assist with language editing, drafting responses to editorial comments, and preparing manuscript and table files. All authors reviewed and edited the AI-assisted content, verified the accuracy of the reported methods and results, and approved the final manuscript. The authors take full responsibility for the accuracy and integrity of the work.
תודות
The authors thank the clinical, nursing, and data-management staff at Zhongshan Hospital, Fudan University, for their support in patient care and data retrieval. This work was supported by the Shanghai Engineering Research Center of Interventional Medical Device (Project No. 18DZ2250900).
חומרים
| שם | חברה | מספר קטלוג | הערות |
|---|---|---|---|
| Institutional clinical data source | Zhongshan Hospital, Fudan University | Institutional electronic health record and follow-up system; vendor/version not specified in the source documentation | Cohort identification, data extraction, and outcome ascertainment |
| Matplotlib 3.10.8 | Matplotlib Development Team | No catalog number; https://matplotlib.org; RRID:SCR_008624 | Figures |
| NumPy 2.3.5 | NumPy Developers | No catalog number; https://numpy.org; RRID:SCR_008633 | Array computation |
| Python 3.13.5 | Python Software Foundation | No catalog number; https://www.python.org; RRID:SCR_008394 | Analysis environment |
| R (version 4.5.2) | R Foundation for Statistical Computing | https://www.r-project.org; RRID:SCR_001905 | Figure and table reproduction from archived results; not used for model fitting |
| scikit-learn 1.8.0 | scikit-learn Developers | No catalog number; https://scikit-learn.org; RRID:SCR_002577 | Preprocessing, resampling, regression, random forest |
| SciPy 1.17.0 | SciPy Developers | No catalog number; https://scipy.org; RRID:SCR_008058 | Statistical functions |
| XGBoost 3.1.3 | XGBoost Developers | No catalog number; https://xgboost.ai; RRID:SCR_021361 | Gradient-boosted trees and TreeSHAP contributions |
| The additional R environment was used for reproduction of figures and tables from archived results, not for model fitting. |
מקורות
- Singer M, et al. The Third International Consensus Definitions for Sepsis and Septic Shock (Sepsis-3). JAMA. 2016;315(8):801-810.
- Matthay MA, et al. Acute respiratory distress syndrome. Nat Rev Dis Primers. 2019;5:18.
- Bellani G, et al. Epidemiology, patterns of care, and mortality for patients with acute respiratory distress syndrome in intensive care units in 50 countries. JAMA. 2016;315(8):788-800.
- Thompson BT, Chambers RC, Liu KD. Acute respiratory distress syndrome. N Engl J Med. 2017;377(6):562-572.
- Grasselli G, et al. ESICM guidelines on acute respiratory distress syndrome: definition, phenotyping and respiratory support strategies. Intensive Care Med. 2023;49(7):727-759.
- Seymour CW, et al. Assessment of clinical criteria for sepsis: for the Third International Consensus Definitions for Sepsis and Septic Shock (Sepsis-3). JAMA. 2016;315(8):762-774.
- Huang B, et al. Mortality prediction for patients with acute respiratory distress syndrome based on machine learning: a population-based study. Ann Transl Med. 2021;9(9):794.
- Li W, Zhou H, Zou Y. An interpretable machine learning model for predicting mortality risk in adult ICU patients with acute respiratory distress syndrome. Front Med (Lausanne). 2025;12:1580345.
- Mu S, Yan D, Tang J, Zheng Z. Predicting mortality in sepsis-associated acute respiratory distress syndrome: a machine learning approach using the MIMIC-III database. J Intensive Care Med. 2025;40(3):294-302.
- Xu Z, Zhang K, Liu D, Fang X. Predicting mortality and risk factors of sepsis related ARDS using machine learning models. Sci Rep. 2025;15:13509.
- Collins GS, et al. TRIPOD+AI statement: updated guidance for reporting clinical prediction models that use regression or machine learning methods. BMJ. 2024;385:e078378.
- Moons KGM, et al. PROBAST+AI: an updated quality, risk of bias, and applicability assessment tool for prediction models using regression or artificial intelligence methods. BMJ. 2025;388:e082505.
- ARDS Definition Task Force. Acute respiratory distress syndrome: the Berlin Definition. JAMA. 2012;307(23):2526-2533.
- Matthay MA, et al. A new global definition of acute respiratory distress syndrome. Am J Respir Crit Care Med. 2024;209(1):37-47.
- Lambden S, Laterre PF, Levy MM, Francois B. The SOFA score-development, utility and challenges of accurate assessment in clinical trials. Crit Care. 2019;23(1):374.
- Charlson ME, Carrozzino D, Guidi J, Patierno C. Charlson Comorbidity Index: a critical review of clinimetric properties. Psychother Psychosom. 2022;91(1):8-35.
- Riley RD, et al. Calculating the sample size required for developing a clinical prediction model. BMJ. 2020;368:m441.
- Tibshirani R. Regression shrinkage and selection via the lasso. J R Stat Soc Series B Stat Methodol. 1996;58(1):267-288.
- Breiman L. Random forests. Mach Learn. 2001;45(1):5-32.
- Chen T, Guestrin C. XGBoost: a scalable tree boosting system. In: Proceedings of the 22nd ACM SIGKDD International Conference on Knowledge Discovery and Data Mining. San Francisco, CA; 2016. p. 785-794.
- Varma S, Simon R. Bias in error estimation when using cross-validation for model selection. BMC Bioinformatics. 2006;7:91.
- Van Calster B, et al. Calibration: the Achilles heel of predictive analytics. BMC Med. 2019;17:230.
- Vickers AJ, van Calster B, Steyerberg EW. A simple, step-by-step guide to interpreting decision curve analysis. Diagn Progn Res. 2019;3:18.
- Lundberg SM, et al. From local explanations to global understanding with explainable AI for trees. Nat Mach Intell. 2020;2(1):56-67.
- Christodoulou E, et al. A systematic review shows no performance benefit of machine learning over logistic regression for clinical prediction models. J Clin Epidemiol. 2019;110:12-22.
- Couronné R, Probst P, Boulesteix AL. Random forest versus logistic regression: a large-scale benchmark experiment. BMC Bioinformatics. 2018;19(1):270.
- Auriemma CL, et al. Acute respiratory distress syndrome-attributable mortality in critically ill patients with sepsis. Intensive Care Med. 2020;46(6):1222-1231.
- Laffey JG, et al. Potentially modifiable factors contributing to outcome from acute respiratory distress syndrome: the LUNG SAFE study. Intensive Care Med. 2016;42(12):1865-1876.
- Hernández G, et al. Effect of a resuscitation strategy targeting peripheral perfusion status vs serum lactate levels on 28-day mortality among patients with septic shock: the ANDROMEDA-SHOCK randomized clinical trial. JAMA. 2019;321(7):654-664.
- Ghassemi M, Oakden-Rayner L, Beam AL. The false hope of current approaches to explainable artificial intelligence in health care. Lancet Digit Health. 2021;3(11):e745-e750.
- Evans L, et al. Surviving Sepsis Campaign: international guidelines for management of sepsis and septic shock 2021. Intensive Care Med. 2021;47(11):1181-1247.
- Wiens J, et al. Do no harm: a roadmap for responsible machine learning for health care. Nat Med. 2019;25(9):1337-1340.
- Vasey B, et al. Reporting guideline for the early-stage clinical evaluation of decision support systems driven by artificial intelligence: DECIDE-AI. Nat Med. 2022;28(5):924-933.
- Andaur Navarro CL, et al. Risk of bias in studies on prediction models developed using supervised machine learning techniques: systematic review. BMJ. 2021;375:n2281.
- Varoquaux G. Cross-validation failure: small sample sizes lead to large error bars. Neuroimage. 2018;180(Pt A):68-77.
- Riley RD, et al. Evaluation of clinical prediction models (part 2): how to undertake an external validation study. BMJ. 2024;384:e074820.