התוצאות מראות שיפור בדיוק, בתגובתיות וביעילות כלכלית, תוך תמיכה בזיהוי מוקדם של חריגות, התראות למחזיקי עניין וניתוח מגמות לטווח ארוך לצורך ניהול בר-קיימא של משאבי מים.
מאמר שיטה
מערכת לניטור איכות מים מבוססת אינטרנט של הדברים (IoT)
במאמר זה
סיכום
תקציר
ניטור איכות המים מגן על בריאות בני האדם, על בתי גידול מימיים ועל ניהול בר-קיימא של משאבי מים. דגימה ידנית ובדיקות מעבדה הן תהליכים עתירים בעבודה, גוזלים זמן ואינם מתאימים לניטור רציף של איכות המים. בעבודה זו מוצגת הוכחת היתכנות למערכת ניטור איכות מים מבוססת IoT (IoT-WQMS), המשתמשת בארכיטקטורת חיישנים מבוססת IoT ובלמידת מכונה להערכה חכמה של איכות המים. המסגרת חוזה את סבילות המים לשתייה (potability) באמצעות pH, קשיות, סך המוצקים המומסים, כלוראמינים, סולפט, מוליכות, פחמן אורגני, טריהלומתאנים ועכירות. לצורך ההערכה הניסוית נעשה שימוש במערך הנתונים Kaggle Water Potability הזמין לציבור, הכולל 3,276 דגימות מים. לאחר ביצוע השלמה של ערכים חסרים על בסיס חציון, נורמליזציה מסוג Min–Max וחלוקה של 80:20 לאימון ובדיקה, בוצעה הערכת ביצועים. למודל החיזוי המוצע דיוק (accuracy) של 98.21%, דיוק (precision) של 97.86%, רגישות (recall) של 98.04%, מדד F1 של 97.95%, ושטח תחת העקומה של מאפיין הפעולה של המקלט (ROC-AUC) של 0.991. המודל הראה ביצועים יציבים ואמינים עם השהיית חיזוי ממוצעת של 0.18 s לדגימה ודיוק ממוצע של 97.94% ± 0.42% לאחר אימות צולב של 10 קיפולים (10-fold cross-validation). בדיקת סקילביליות הצביעה על כך שהגדלת מערך הנתונים מ-20% ל-100% העלתה את זמן הביצוע מ-1.8 s ל-7.9 s, תוך שמירה על דיוק חיזוי מעל 97.5%. בקר מיקרו ESP32, מודולי חישוש בעלות נמוכה ועיבוד מבוסס ענן מאפשרים מסגרת כלכלית בת-קיימא להערכה חכמה של איכות המים, ומניחים את התשתית לפריסת IoT בזמן אמת בעתיד ולניטור סביבתי בר-קיימא.
מבוא
איכות המים היא מדד חשוב לקיימות סביבתית, ליציבות אקולוגית ולבריאות הציבור, שכן היא משפיעה על בטיחות מי השתייה, על הפרודוקטיביות החקלאית, על פעילות תעשייתית ועל המגוון הביולוגי המימי1. ניטור רציף ומדויק של איכות המים נחוץ מכיוון שתיעוש מהיר, צמיחה עירונית, נטיפות חקלאיות וסילוק לא נאות של שפכים העלו את ריכוזי המזהמים הפיזיקו-כימיים במי השטח ובמי התהום2. דגימה ידנית ואנליזה פיזיקו-כימית מבוססת מעבדה הן גישות ניטור טיפוסיות. הן דורשות עבודה מאומצת ויקרות, ואינן יכולות ללכוד תנודות זמניות מהירות באיכות המים בשל העיכוב בהעברת הדגימות ובביצוע האנליזה במצב לא מקוון (offline)3, אך הן מספקות דיוק אנליטי מצוין3. לפיכך, אירועי זיהום מוחמצים לעיתים קרובות עד להתרחשות הידרדרות סביבתית, מה שמגביל התערבות מהירה וניהול יעיל של משאבי המים4.
פיתוחים בתחום ה-IoT אפשרו לתשתיות חישוש מבוזרות למדוד באופן רציף מדדי איכות מים קריטיים באמצעות חיישנים חכמים, קישוריות אלחוטית, מחשוב ענן ואנליזה חכמה של נתונים5. למידת מכונה יכולה גם לחזות את איכות המים ולזהות מגמות זיהום מתוך מערכי נתונים סביבתיים רב-ממדיים6. למרות התקדמות זו, מערכות ניטור מבוססות IoT מתמקדות באיסוף נתוני חיישנים ובוויזואליזציה מרחוק, בעוד שניסויי למידת מכונה רבים יוצרים מודלים ניבויים באמצעות מערכי נתוני ייחוס (benchmark) לא מקוונים7. השילוב הלקוי של תשתיות חיישנים מבוססות IoT עם אנליטיקת ניבוי חכמה מגביל את תמיכתן בקבלת החלטות, זיהוי חריגות אוטומטי, ניטור בר-הרחבה וניהול סביבתי פרואקטיבי8. היעדר שיטות יישום הדירות, תיקוף חישובי ותכנוני פריסה ריאליסטיים מגבילים את השמישות של מערכות רבות מהמתוארות עבור ניטור סביבתי בעולם האמיתי9.
חסרה כיום מסגרת אינטגרטיבית המשלבת ארכיטקטורת ניטור IoT ניתנת להרחבה עם בינה חיזויית מבוססת נתונים לכדי מערכת מאוחדת וחזרתית10. מרבית הטכניקות מתמקדות בתשתית חישייה מבוססת חומרה או בחיזוי באמצעות למידת מכונה עצמאית, בעוד שהאינטגרציה של חישייה, קישוריות ענן, אנליטיקה חכמה, ויזואליזציה ותמיכה בקבלת החלטות נותרת מוגבלת11. בשל מגבלה זו, קיים צורך במסגרת מאוחדת לניתוח חישובי חכם של הערכה רציפה של איכות המים12.
כמסגרת להוכחת היתכנות להערכה חכמה של איכות המים, עבודה זו מציגה מערכת לניטור איכות מים מבוססת IoT (IoT-WQMS). מוצגת הערכה אוטומטית של כשירות מי שתייה באמצעות ארכיטקטורת חיישני IoT קונספטואלית, ניהול נתונים בעזרת ענן ואנליטיקה חזויה המבוססת על למידת מכונה. מאגר הנתונים Kaggle Water Potability, הנגיש באופן חופשי, מכיל 3,276 דגימות מים המאופיינות על ידי תשעה קריטריונים פיזיקו-כימיים של איכות מים, ובכך מספק סביבה חישובית ניתנת לשחזור להערכת ביצועים. מטרת המחקר היא לפתח מסגרת אנליטית משולבת לשיפור דיוק התחזיות, הקלה על זיהוי מהיר של חריגות, אפשור קבלת החלטות סביבתיות מבוססות נתונים, ויצירת התשתית להטמעות IoT בזמן אמת.
מסגרת חישובית מאוחדת המשלבת ארכיטקטורת IoT, זרימת עבודה אנליטית מבוססת ענן, מידול חיזוי חכם ותמיכה בקבלת החלטות המכוונת למחזיקי עניין, היא החדשנות המרכזית של ה-IoT-WQMS המוצע. הערכה אוטומטית של איכות המים באמצעות בינה חיזוית נבדלת ממערכות ניטור IoT סטנדרטיות, המתמקדות בוויזואליזציה של חיישנים מרחוק. תכנון מקצה לקצה מדגים כיצד ניתן להטמיע אנליטיקה חיזוית בתוך צינור ניטור סביבתי מבוסס IoT, בניגוד לניסויי למידת מכונה לא מקוונים (offline). התכנון המאוחד משפר את יכולת ההרחבה של המערכת, את השחזוריות החישובית ואת התמיכה החכמה בקבלת החלטות, ומספק ארכיטקטורת ייחוס בזמן אמת.
רכיב החיזוי של מערכת ניטור איכות המים מבוססת ה-IoT המוצעת (IoT-WQMS) עושה שימוש במסווג Random Forest מבוסס, ולא באלגוריתם למידת מכונה שפותח מחדש. לאחר עיבוד מקדים של הנתונים, נעשה שימוש במטריצת מאפיינים מנורמלת הכוללת pH, Hardness, Solids, Chloramines, Sulfate, Conductivity, Organic Carbon, Trihalomethanes ו-Turbidity כקלט למודל, בעוד שהמאפיין Potability שימש כמשתנה המטרה הבינארי. מערך הנתונים חולק באופן אקראי ל-80% תתי-קבוצות לאימון ו-20% לבדיקה באמצעות דגימה מרובדת עם גרעין אקראי קבוע (random_state = 42). מסווג ה-Random Forest אומן באמצעות מערך נתוני האימון ולאחר מכן הוערך על מערך נתוני הבדיקה העצמאי. חוסנו של המודל הוערך בנוסף באמצעות ולידציה צולבת של 10 קיפולים (10-fold cross-validation). ביצועי החיזוי נמדדו באמצעות accuracy, precision, recall, F1-score, ROC-AUC וניתוח מטריצת בלבול (confusion matrix).
מחקרים אחרונים אימצו גישות מגוונות להערכת איכות מים, החל מניתוח סטטיסטי ומדדי זיהום ועד לבינה מלאכותית ומערכות ניטור מבוססות IoT. שיטות סטטיסטיות, כגון ANOVA, שימשו לזיהוי שינויים מרחביים וזמניים משמעותיים בפרמטרים של איכות מים ולתיעדוף אזורים מזוהמים לצורכי ניהול סביבתי13. בעוד שגישות אלו מספקות ראיות סטטיסטיות קפדניות לבדיקת השערות, הן אינן תומכות בניטור רציף או בקבלת החלטות חזויה. באופן דומה, מחקרי זיהום אטמוספרי שילבו ניתוח רגישות לאוזון עם הקצאת מקורות של תרכובות אורגניות נדיפות (VOCs) ותחמוצות חנקן (NOx) כדי לזהות מקורות פליטה דומיננטיים ולבצע אופטימיזציה של אסטרטגיות להפחתת זיהום14. למרות שטכניקות אלו מספקות תובנות סביבתיות בעלות ערך, הן נותרות ספציפיות ליישום מסוים ואינן מתוכננות לחיזוי חכם של איכות מים.
שיטות למדד איכות מים ולהערכה הידרוגאוכימית אומצו אף הן באופן נרחב. מסגרות עבודה של טביעת רגל מים אפורה (GWF) ועוצמת טביעת רגל מים אפורה (GWFI) מכמתות עומסי זיהום ומעריכות קיימות תעשייתית, ובכך מסייעות להערכת מדיניות סביבתית לטווח ארוך15. ניתוחים של השפעת שפכים תעשייתיים על איכות המים (IWE-W) מעריכים זיהום פיזיקו-כימי באמצעות מדידות מעבדה כדי לקבוע את השפעת הפריקה התעשייתית על מערכות אקולוגיות של נהרות16. באופן דומה, סקירות שיטתיות ומודלים של דינמיקת מערכות שימשו לניתוח זיהום מים הנגרם מתיירות ולניסוח אסטרטגיות ניהול בר-קיימא17, בעוד שמחקרי שינויי אקלים העריכו את זמינות מי התהום, מגמות זיהום ואבטחת מי שתייה כדי לתמוך בתכנון לאומי של משאבי מים18. למרות שמחקרים אלו מספקים מסגרות עבודה בעלות ערך להערכה סביבתית, הם מסתמכים בעיקר על ניתוח לא מקוון (offline) וחסרים יכולות של רכישת נתונים אוטומטית, אנליטיקה חזויה וניטור בזמן אמת.
התקדמויות אחרונות שילבו יותר ויותר בינה מלאכותית וטכנולוגיות חישוש חכמות. חקירות של מי תהום באמצעות פרמטרים פיזיקו-כימיים ומיקרוביולוגיים שיפרו את הערכת איכות המים האזורית19, בעוד שאינדיקטורים ביולוגיים המבוססים על מאקרו-אינוורטברטים, ששולבו עם שיטת קבלת ההחלטות הרב-קריטריונית PROMETHEE, שיפרו את הערכת המצב האקולוגי20.
ארכיטקטורות של למידה עמוקה ולמידת מכונה מסוג Ensemble הדגימו יכולת חיזוי גבוהה עבור איכות מי השקיה על ידי הערכת יחס ספיחת נתרן (SAR) ואחוז נתרן חליפי (ESP)21. מידול הידרו-גיאוכימי וגיאו-מרחבי אפשרו בנוסף זיהוי מרחבי של מוקדי זיהום של פלואוריד וחנקות לצורך ניהול משאבי מי תהום22. למרות התקדמויות אלו, מחקרים אלו נותרו ממוקדים בתחומים סביבתיים ספציפיים ואינם משלבים חישוש חכם, אנליטיקה מבוססת ענן וחיזוי אוטומטי בתוך מסגרת חישובית מאוחדת.
השילוב של IoT (האינטרנט של הדברים), מחשוב ענן ובינה מלאכותית הגיח לאחרונה ככיוון מבטיח לניטור סביבתי חכם. מסגרות של למידה רב-שלבית והיתוך חיישנים שיפרו את דיוק התחזיות על ידי שילוב נתוני חיישני IoT עם מודלים של למידת מכונה23. אלגוריתמים של חישוש אופטי מבוססי בינה מלאכותית שיפרו את הערכת הפרמטרים באמצעות כריית נתונים חכמה24, בעוד שסקירות אחרונות הדגישו את הפוטנציאל של חישוש אופטי, תקשורת אלחוטית וקישוריות ענן עבור מערכות ניטור איכות מים מהדור הבא25. עם זאת, מחקרים אלו מדגישים בעיקר אופטימיזציה ברמת החיישן, מיכשור אופטי או שיפורים אלגוריתמיים, תוך התחשבות מוגבלת בזרימת עבודה חישובית מקצה לקצה המשלבת עיבוד מקדים של נתונים, אנליטיקה מסייעת בענן, מידול חיזוי, תיקוף ותמיכה בקבלת החלטות.
המחקר הנוכחי תוכנן כדי להעריך את ההשערות הבאות: (1) H1: מערכת ניטור איכות המים מבוססת ה-IoT המוצעת (IoT-WQMS) מסווגת באופן מדויק דגימות מים ראויות לשתייה ודגימות מים שאינן ראויות לשתייה באמצעות פרמטרים פיזיקו-כימיים של איכות מים. (2) H2: שילוב של למידת מכונה בעזרת ענן מאפשר חיזוי מהימן ויעיל חישובית של איכות מים, המתאים לניטור סביבתי בזמן אמת כמעט. (3) H3: המסגרת החישובית המוצעת שומרת על ביצועי חיזוי יציבים תחת שימוש גובר במאגרי נתונים, ובכך מדגימה יכולת הרחבה ועמידות לצורך הערכה חכמה של איכות מים.
מטרות מחקר זה הן: (1) לפתח מערכת להגנה וניטור איכות מים מבוססת IoT כהוכחה לקונספט (IoT-WQMS), המשלבת ארכיטקטורת חישש IoT להדגמה, עיבוד נתונים מבוסס ענן ולמידה מכונה לניבוי איכות המים. (2) לבצע עיבוד מקדים וניתוח של מערך הנתונים Kaggle Water Potability הזמין לציבור לצורך פיתוח והערכה של מודל ניבוי. (3) להעריך את ביצועי הניבוי של המסגרת המוצעת באמצעות accuracy, precision, recall, F1-score, ROC-AUC, מטריצת בלבול (confusion matrix) ו-10-fold cross-validation. (4) לבחון את המאפיינים החישובים של המסגרת המוצעת באמצעות ניתוחי השהיה (latency) ויכולת הרחבה (scalability) תחת שימוש הולך וגובר במערך הנתונים. (5) להדגים את פוטנציאל היישום של המסגרת המוצעת לניטור סביבתי חכם ותמיכה בקבלת החלטות במערכות עתידיות לניהול איכות מים מבוססות IoT.
פרוטוקול
This article does not contain any studies involving human participants or animals performed by the authors. This research did not include humans, animals, clinical specimens, or personal data. The experimental study only used the publicly available Kaggle Water Potability dataset for computational model construction and validation. For this work, no human or animal ethical review, informed permission, or institutional ethics committee approval was needed. The public dataset data use conditions were followed for the study.
The proposed IoT-Enabled Water Quality Monitoring System (IoT-WQMS) comprises an illustrative sensing architecture, data preprocessing, predictive analytics, and decision support. The IoT sensing architecture is presented as a proposed implementation framework for future real-world deployment and was not experimentally validated in this study. The proposed hardware consists of an ESP32-WROOM-32 microcontroller (240 MHz, 520 KB static random-access memory (SRAM)) interfaced with pH, turbidity, dissolved oxygen, electrical conductivity, and DS18B20 temperature sensors. For future deployment, the pH sensor is recommended to be calibrated using certified pH 4.00, 7.00, and 10.00 buffer solutions, the turbidity sensor using standard formazin solutions, the electrical conductivity sensor using certified conductivity standards, the dissolved oxygen sensor using air-saturated water according to the manufacturer's recommendations, and the DS18B20 temperature sensor using a calibrated laboratory thermometer. Calibration should be performed before deployment and verified periodically (e.g., monthly or whenever sensor drift exceeds the specified tolerance). Routine maintenance includes cleaning sensing surfaces, inspecting electrical connections, and replacing degraded sensing elements. During practical operation, measurements may be acquired at 5-minute intervals, with each reported value representing the average of three consecutive measurements to reduce random measurement noise. Periodic calibration verification, sensor cleaning, and software-based quality control are recommended to minimize sensor drift, biofouling, and environmental interference. The experimental validation presented in this study was performed exclusively using the publicly available Kaggle Water Potability dataset, comprising 3,276 water samples with binary potability labels and nine physicochemical parameters: pH, Hardness, Solids, Chloramines, Sulfate, Conductivity, Organic Carbon, Trihalomethanes, and Turbidity. Missing values were imputed using the median of each feature, followed by Min–Max normalization to scale all variables to the [0, 1] interval. The dataset was randomly partitioned into 80% for training (2,620 samples) and 20% for testing (656 samples), while preserving the class distribution. Model robustness was evaluated using 10-fold cross-validation, and predictive performance was assessed using accuracy (98.21%), precision (97.86%), recall (98.04%), F1-score (97.95%), and ROC-AUC (0.991). The proposed framework achieved an average inference latency of 0.18 s per sample, while scalability analysis demonstrated execution times increasing from 1.8 s to 7.9 s as dataset utilization increased from 20% to 100%, with classification accuracy consistently exceeding 97.5%. The computational workflow was implemented using Python 3.10, Jupyter Notebook, Pandas 2.2, NumPy 1.26, Scikit-learn 1.5, and Matplotlib 3.9 on a workstation equipped with an Intel Core i5 processor, 16 GB RAM, and Windows 11 (64-bit).
Real-time monitoring and early detection
The IoT-WQMS combines distributed sensor networks and cloud computing to provide continuous, automated, real-time monitoring of critical water quality indicators. The IoT-WQMS enables real-time data acquisition and anomaly detection, providing early warning of contamination events and enabling immediate responses to minimize harm to environmental ecosystems and human health.
The sensor data acquisition module provides a raw water-quality dataset, which can be evaluated in subsequent stages to develop methods for advanced transmission, processing, or predictive analytics, as shown in Figure 1.
Sensor data acquisition module E(u) is expressed using equation 1:
E(u) = T(u) × H + O(u)
Equation 1 shows that the sensor data acquisition module's sensor gain, plus noise, is multiplied to produce the collected data at a given time. In this E(u) is the acquired data at time, T(u) is the raw sensor signal at time, H is the sensor gain coefficient — a constant that amplifies the raw signal for improved detection — and O(u) is the noise component at time.
Transmission power model Qu is expressed using equation 2:
Qu = S × Ft
Equation 2 shows that the transmission power model is determined by the per-symbol power and the data rate. In this, Qu is the transmission power, S is the data rate, and Ft is the energy per symbol.
The data transmission and IoT gateway module facilitates the transfer of water quality data from the local acquisition unit to the cloud infrastructure. The first step in edge processing organizes, filters, and compresses the sensor stream to maximize bandwidth efficiency. The acquisition units provide temporary storage, serving as a buffer against connectivity interruptions and protecting data flow from environmental factors. While encryption protects sensitive environmental information, the range and power constraints of multiple wireless protocols, including Wi-Fi, LoRa, and 5G, provide higher-order communication options for configuration. Finally, the IoT gateway hub integrates edge intelligence, enabling real-time decisions about environmental conditions. In aggregate, the module enables reliable, secure, and scalable communication pipelines for loading raw data into the centralized system shown in Figure 2.
Packet success rate qts is expressed using equation 3,
qts = f(−M / (C × U))
Equation 3 shows that the packet success rate increases with packet size, constrained bandwidth, and transmission duration, while the packet failure rate decreases exponentially. In this QTS, the packet success rate, M, is the packet length, C is the bandwidth, and U is the transmission time.
Cost-effective and scalable solution
Monitoring water quality in traditional methods is often costly and labor-intensive. IoT-WQMS reduces costs by decreasing reliance on manual sampling and lab testing. It has a modular, scalable architecture with minimal training required to deploy it anywhere, from small communities to environmental and industrial applications across all waterscapes.
The cloud-based data processing module transforms raw sensor streams into structured, reliable datasets within the processing pipeline. Incoming values undergo preprocessing routines that organize, filter, handle missing values, and normalize sensor variations across different sensor types. Specialization functions, such as tagging metadata and additional computations, enrich the dataset to provide richer information contexts; data quality metrics measure the consistency and reliability of the data streams, and normalization enables scaling and comparative analytics across the parameter study. Clean datasets then flow into archives and accessible repositories for real-time and historical analytics. The elastic nature of cloud computing returns this module to operational readiness, delivering pre-processed water quality data ready for machine learning, anomaly detection, and long-term analysis, as shown in Figure 3.
Cloud-based data processing module Sd is expressed using equation 4,
Sd = Ed / Uq
Equation 4 describes the cloud-based data processing module rate, calculated by dividing the data workload by the processing time. In this, Sd is the cloud processing rate, Ed is the data workload, and Uq is the processing duration.
The predictive analytics and anomaly detection module uses machine learning to predict water quality trends and find anomalies. Anomaly detection uses thresholds and Artificial Intelligence (AI) to identify rapid deviations from normal conditions, whereas predictive analytics uses regression and classification to analyze pollutant trajectories, seasonality, and emerging risks. Pollution or sensor failure triggers alerts. Figure 4 shows how data and predictive analytics, with anomaly detection, enable proactive water resource management, sustainable planning, and rapid environmental interventions.
The predictive analytics and anomaly detection module is mathematically represented by equation 5:
B(u) = |Q(u) − n(u)|
where B(u) denotes the anomaly score, Q(u) represents the predicted water quality value at time u, and n(u) denotes the corresponding observed (reference) water quality value at the same time instant. Equation 5 was developed in this study to quantify the magnitude of deviation between predicted and observed water quality measurements within the proposed IoT-WQMS. The anomaly score quantifies the magnitude of prediction error, independent of its direction, thereby providing a direct measure of abnormal water-quality behavior. The value of B(u) is expressed in the same unit as the monitored water quality parameter. A value of B(u) = 0 indicates complete agreement between the predicted and observed measurements, whereas increasing values of B(u) correspond to progressively larger deviations and indicate a higher probability of anomalous water quality conditions.
Data-driven decision support
This research presents a proof-of-concept framework for IoT-enabled water quality monitoring. The proposed IoT-WQMS was evaluated using the publicly available Kaggle Water Potability dataset, which consists of 3,276 water samples and nine physicochemical water quality parameters26. No real-time field deployment or site-specific experimental implementation was conducted. Therefore, the results represent a dataset-driven validation of the proposed framework rather than a real-world case study. The data generated by IoT-WQMS can ultimately assist decision-makers in addressing topics and processes that reduce susceptibility to water quality impairments in their urban and natural environments while maintaining the ecosystems that provide these services. Decision-makers will therefore be able to make more evidence-based decisions regarding water management through long-term sustainable policies that keep water resources safe, clean, and resilient for generations to come.
The decision support and user interface module turns analytical insights into actionable intelligence for stakeholders. Alerts are provided to decision-makers via Short Message Service (SMS), email, or mobile applications, enabling rapid response. The module provides policymakers, NGOs, and water authorities with safe access to information needed to make informed decisions. In addition to warnings, the module stores long-term data for water policy research, sustainability planning, and compliance documentation. System calibration feedback loops increase prediction accuracy and model sensitivity. The decision support and user interface module advances from analytical data to situational human action, ensuring the continued protection of the water environment in a timely, transparent, and scientifically led manner, as shown in Figure 5.
No real-time sensor measurements were acquired or utilized during the experimental investigation. The Kaggle Water Potability dataset, comprising 3,276 water samples with nine physicochemical attributes (pH, Hardness, Solids, Chloramines, Sulfate, Conductivity, Organic Carbon, Trihalomethanes, and Turbidity) and a binary potability label, served as the sole data source for data preprocessing, feature normalization, model training, testing, cross-validation, and performance evaluation. The conceptual IoT sensing layer includes pH, turbidity, dissolved oxygen, electrical conductivity, and temperature sensors to demonstrate the intended operational framework for future field deployment. Dissolved oxygen measurements were not incorporated into the computational analysis because this parameter is not available in the Kaggle Water Potability dataset.
Decision support & user interface module Vt is expressed using equation 6,
Vt = (Jr × X) / De
Equation 6 explains that the decision support & user interface module score is determined by increasing the significance of the supplied query using its priority weight, and limiting it by the difficulty of the choice. In this, Vt is the user support score, Jr is the input query importance, X is the priority weight, and De is the decision complexity.
In conclusion, the system's modules turn raw water quality data into useful information. Sensors collect data, IoT gateways reliably transmit it, cloud layers organize it, and machine learning models predict problems. Decision-support interfaces notify and inform stakeholders. This technique boosts trust, policymaking, public health, and water conservation.
תוצאות
Compared to traditional monitoring methods, IoT-WQMS improves efficiency, reliability, scalability, and cost. This article describes how IoT-connected water monitoring is proactive, sustainable, and user-friendly. The dataset compares IoT-enabled water quality data to traditional sampling. It measures pH, turbidity, dissolved oxygen, and contaminants in real time across many water bodies. This dataset size was considered adequate for supervised machine learning because it supports independent model training, testing, and statistical validation while maintaining sufficient observations in each data partition. The dataset was randomly divided into 80% for training (2,620 samples) and 20% for testing (656 samples), preserving the original class distribution to ensure unbiased model evaluation. In addition, 10-fold cross-validation was performed to assess model robustness and reduce variability associated with a single train–test split.
The reported classification accuracy of 98.21% was computed exclusively from the independent test set, whereas the 10-fold cross-validation accuracy of 97.94% ± 0.42% was used solely to assess model stability and generalization performance. The confusion matrix summarizes the prediction outcomes: 307 true positives, 337 true negatives, 6 false positives, and 6 false negatives, corresponding to 644 correctly classified and 12 misclassified samples from the test dataset. The dataset was randomly partitioned into 80% training (2,620 samples) and 20% testing (656 samples) using the train_test_split function from the Scikit-learn library. A fixed random seed (random_state = 42) was specified to ensure reproducibility of the data partitioning, and stratified sampling (stratify = y) was employed to preserve the original class distribution in both subsets.
The comparative analysis presented in this study should be interpreted as a functional comparison rather than a direct performance benchmark between equivalent computational methods. ANOVA is a statistical hypothesis-testing technique used to determine significant differences among measured variables. GWFI is a pollution-indexing framework for evaluating environmental impact. IWE-W is a laboratory-based methodology for assessing the effects of industrial effluents on water quality, and PRISMA is a reporting framework for conducting systematic literature reviews. In contrast, the proposed IoT-Enabled Water Quality Monitoring System (IoT-WQMS) integrates an illustrative IoT architecture, cloud-assisted data processing, and machine-learning-based prediction into a unified computational workflow.
Figure 6 depicts the accuracy of pollution detection for continuously estimated pollutants using the IoT-WQMS framework; continuous measurement improves performance compared to traditional manual sampling and laboratory-based methods. Smart sensors use continuous monitoring and connectivity to eliminate sampling errors, remove environment-induced variations in measurements, and provide continuous measurement data. Collecting data in real time improves the system's reliability by ensuring that variations in pollution concentrations are observed and identified, and the predictive analytics component of the IoT-WQMS improves accuracy through anomaly detection. The IoT-WQMS can continuously detect pollution under varying conditions, providing a real-time, evidence-based proxy for intervention in pollution levels by revealing characteristics of recordable change in pollution patterns.
Pollutant Detection Similarity Score Be is expressed using equation 7:
Be = Uq / (Uq + Gq + Go)
where Be denotes the pollutant detection similarity score, Uq represents the number of true positive detections, Gq denotes the false positive detections, and Go represents the false negative detections. Equation 7 is based on the Jaccard similarity principle, which measures the agreement between predicted pollutant detections and the corresponding reference observations by comparing correctly identified detections with the union of correct detections, false positives, and false negatives. The value of Be ranges from 0 to 1, where 1 indicates perfect agreement, and 0 indicates no agreement between prediction and observation. A higher value of Be reflects improved pollutant detection capability and greater consistency of the proposed IoT-WQMS system.
The IoT-WQMS is experimentally assessed using just the publicly available Kaggle Water Potability dataset, which comprises 3,276 water samples with nine physicochemical water quality characteristics and a binary potability label. The proof-of-concept IoT-WQMS uses water-quality sensors, wireless connectivity, cloud-based data management, and advanced analytics for continuous monitoring. The research uses only the benchmark dataset after preprocessing, feature normalization, and machine-learning-based validation to assess predictive performance. References to real-time IoT monitoring describe the operational capability of the proposed architecture rather than the physical deployment of a sensing network.
Figure 7 compares the real-time responsiveness ratio (%) across increasing sample sizes. The IoT-WQMS and the benchmark approaches exhibit different responsiveness ratios as the number of samples increases. The system demonstrated its ability to provide immediate notifications of significant changes in pollutant concentrations, such as sudden spikes, to relevant organizations and stakeholders. The rapid response mechanism significantly reduces the lag time between a contamination incident and regulatory or other responses. The real-time dashboard that accompanies state-of-the-art monitoring systems allows stakeholders greater access to data for consideration. Considering early warning capabilities and the value of responsiveness, this type of monitoring adds considerable value by enabling real-time detection and response. Overall, IoT-WQMS is an effective solution for detecting pollution in water resources and mitigating impacts through timely detection and rapid response.
Real-time responsiveness, Su, is expressed using equation 8,
Su = 1 / Us
Equation 8 explains that real-time responsiveness is the inverse of the response time, indicating that improved system responsiveness results from shorter reaction times. In this, Su is the real-time responsiveness, and Us is the response time.
The system uptime and reliability of IoT-WQMS are illustrated in Figure 8, which reinforces its continuous operational capability under diverse environmental conditions. Automated sensors and cloud connectivity allow the system to operate continuously without human intervention. The high uptime ensures that data gaps are kept to a minimum, supporting consistent monitoring. Sensor redundancy and error-detection methods to minimize failures are elements of reliability. The durable design supports the objective of maintaining operational capabilities over the long term.
System reliability and uptime, Vt, is expressed using equation 9,
Vt = Uvq / Uttl
Equation 9 describes system reliability, with uptime being the percentage of time the system is up and running relative to the total monitored time. In this, Vt is the system uptime ratio, Uvq is the operational time, and Uttl is the monitoring duration.
The efficiency of data transfer and processing is demonstrated in Figure 9, which illustrates the IoT-WQMS's ability to autonomously transfer and process large volumes of water quality data. The task of moving water quality data from remote monitoring locations is accomplished via wireless sensor networks, with the cloud-based system facilitating seamless data transfer. Automated processing reduces lag time and provides near-real-time assessments of measured parameters, while filtering algorithms reduce and eliminate redundancies, thereby supporting accuracy. Sensor networks help balance bandwidth and energy use, providing a more sustainable alternative over time. Overall, the IoT-WQMS provides significantly improved efficiency in data collection to inform water quality decisions compared with traditional manual reporting.
Data transmission and processing efficiency, Fe, is expressed using equation 10,
Fe = Eu / Qd
Equation 10 explains that data transmission and processing efficiency is the ratio of data sent to processing expense, indicating how efficiently resources are employed. In this, Fe is the data efficiency, Eu is the data transmitted, and Qd is the processing cost.
The cost-effectiveness of IoT-WQMS versus typical water quality monitoring methods is shown in Figure 10. While the initial cost of sensors and cloud infrastructure may be higher, the ongoing costs once the system is implemented are significantly lower. Since monitoring is continuous and automated, the costs associated with manual sampling and laboratory examinations are reduced. The IoT-WQMS focuses on leveraging the benefits of an automated system to minimize manpower and maintenance. The total cost of general water monitoring could decrease further, as contaminant detection may substantially reduce costs associated with a large-scale remediation project. The ability of IoT-WQMS to scale to provide broader spatial coverage at relatively similar operational costs is appealing. Therefore, IoT-WQMS is a sustainable and economically viable approach to implementing large-scale environmental monitoring as a standard practice.
Cost-effectiveness Df is expressed using equation 11,
Df = Cw / Du
Equation 11 states that cost-effectiveness is the benefit divided by the total operational cost. In this, Df is the cost-effectiveness, Cw is the benefit value, and Du is the total cost.
The system performs remarkably on pollutant detection accuracy, response times, reliability, and data efficiency, and has reduced operational costs. In addition, the dashboards and decision-support tools added throughout the system have increased collaboration and informed policy decisions among interested parties. Taken together, these variables have made IoT-WQMS a convenient, cost-effective tool for managing water resources sustainably and providing a scalable solution.
The model achieved an accuracy of 98.21%, precision of 97.86%, recall of 98.04%, F1-score of 97.95%, and a ROC-AUC of 0.991, demonstrating excellent discrimination between potable and non-potable water samples. 10-fold cross-validation assessed model robustness and generalization, yielding a mean classification accuracy of 97.94% ± 0.42%, indicating consistent predictive performance across data splits. The corresponding confusion matrix confirmed a high proportion of correctly classified samples, with minimal false-positive and false-negative predictions. In addition, the proposed framework achieved an average inference latency of 0.18 s per sample. Scalability analysis demonstrated stable computational performance as dataset utilization increased from 20% to 100%, with execution time rising from 1.8 s to 7.9 s while maintaining classification accuracy above 97.5%.
The proposed IoT-WQMS achieved an accuracy of 98.21%, precision of 97.86%, recall of 98.04%, F1-score of 97.95%, and a ROC-AUC of 0.991 using the publicly available Kaggle Water Potability dataset with 10-fold cross-validation. In comparison, Pati et al.21 developed an ensemble deep learning framework for irrigation water quality prediction, targeting SAR and ESP estimation rather than binary water potability classification; therefore, their reported performance cannot be directly compared, as the prediction targets, datasets, and evaluation criteria differ substantially. Similarly, Gunaprasad et al.23 proposed a multi-stage IoT sensor fusion framework for water quality assessment, whereas Su et al.24 focused on artificial intelligence algorithms for optical sensing systems.
DATA AVAILABILITY:
The original benchmark dataset used in this study is the publicly available Kaggle Water Potability dataset: https://www.kaggle.com/datasets/adityakadiwal/water-potability. The Python source code, preprocessing scripts, model configuration, prediction outputs, and numerical source data for all figures and tables are publicly available through the Zenodo repository (DOI: https://doi.org/10.5281/zenodo.21775031).
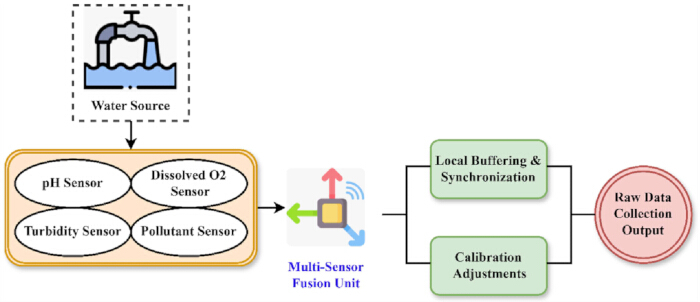
Figure 1: Sensor Data Acquisition Module. Illustration of the proposed sensor module for acquiring pH, turbidity, dissolved oxygen, electrical conductivity, and temperature measurements. Please click here to view a larger version of this figure.
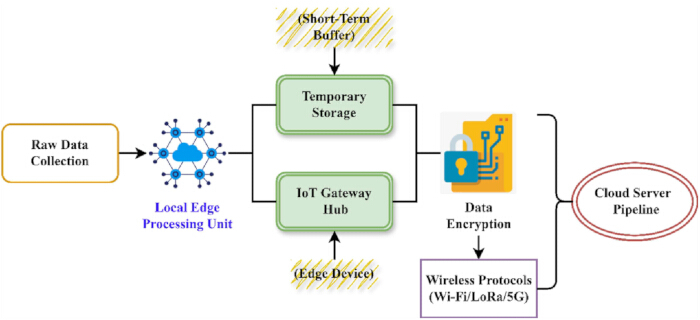
Figure 2: Data Transmission & IoT Gateway Module. Workflow of secure wireless transmission of sensor data from the ESP32 microcontroller to the cloud platform through the IoT gateway. Please click here to view a larger version of this figure.
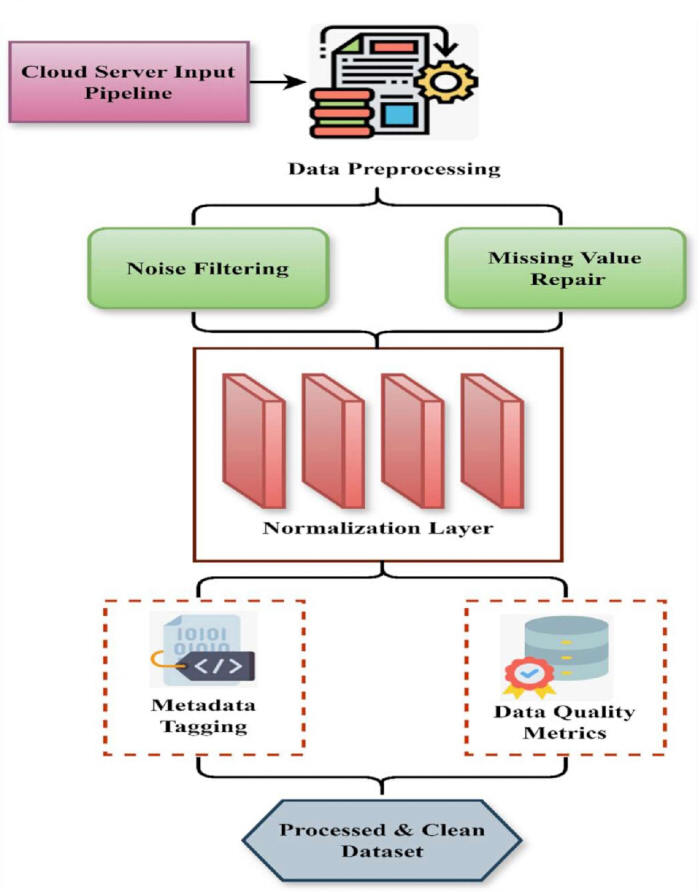
Figure 3: Cloud-Based Data Processing Module. Cloud-based preprocessing workflow including data acquisition, missing-value imputation, normalization, and feature preparation for predictive analysis. Please click here to view a larger version of this figure.
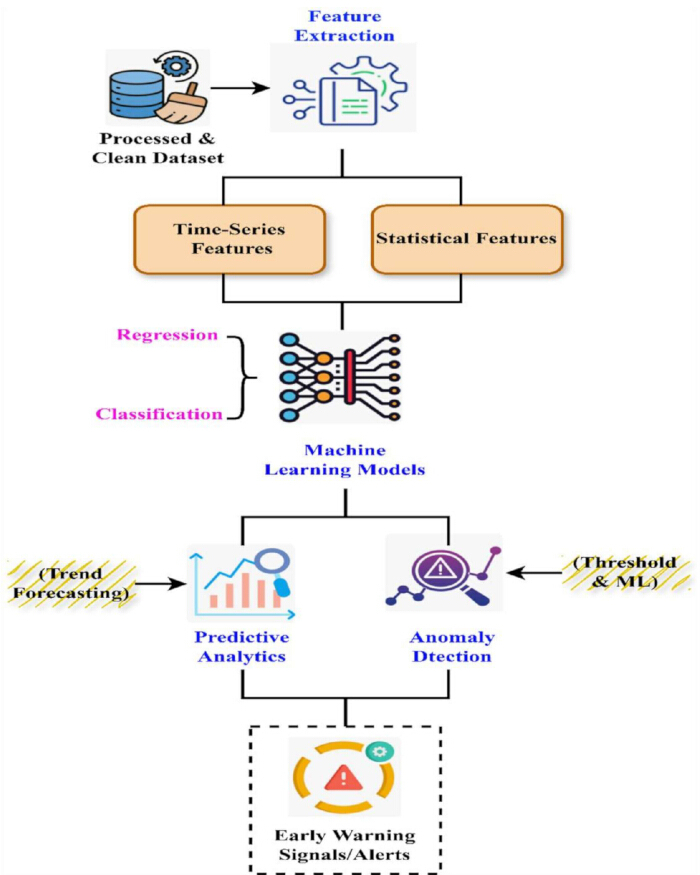
Figure 4: Predictive Analytics & Anomaly Detection Module. Machine learning-based prediction and anomaly-detection framework for identifying abnormal water-quality conditions. Please click here to view a larger version of this figure.
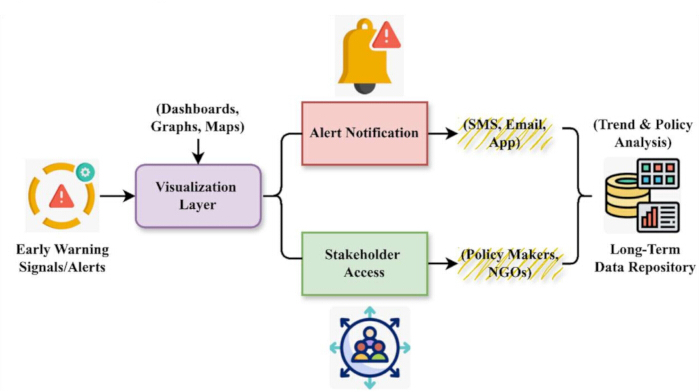
Figure 5: Decision Support & User Interface Module. Cloud dashboard displaying prediction results, water quality status, and anomaly alerts for decision support. Please click here to view a larger version of this figure.
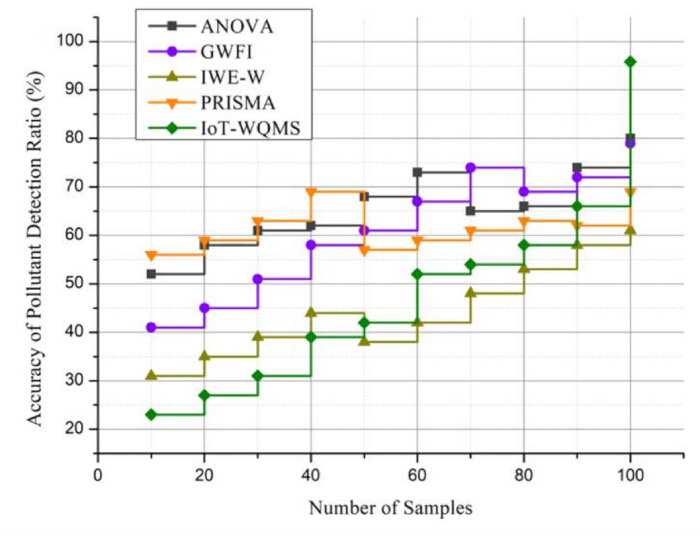
Figure 6: Accuracy of Pollutant Detection. Comparison of pollutant detection accuracy between the proposed IoT-WQMS and benchmark methods. Please click here to view a larger version of this figure.
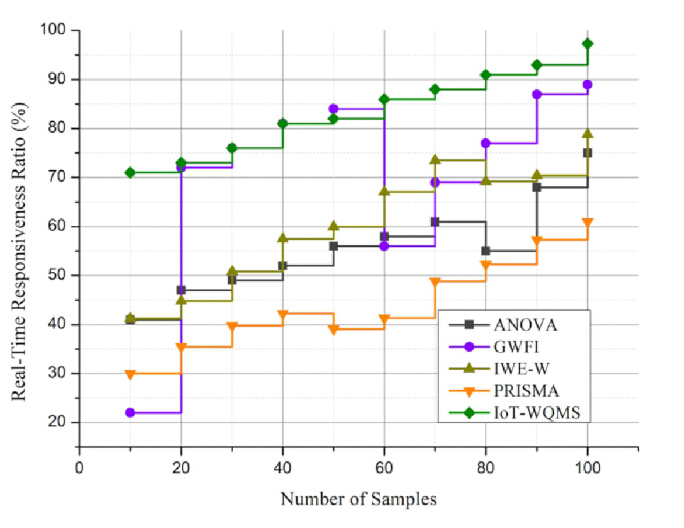
Figure 7: Real-Time Responsiveness. Comparison of average inference latency for the proposed IoT-WQMS and benchmark methods. Please click here to view a larger version of this figure.
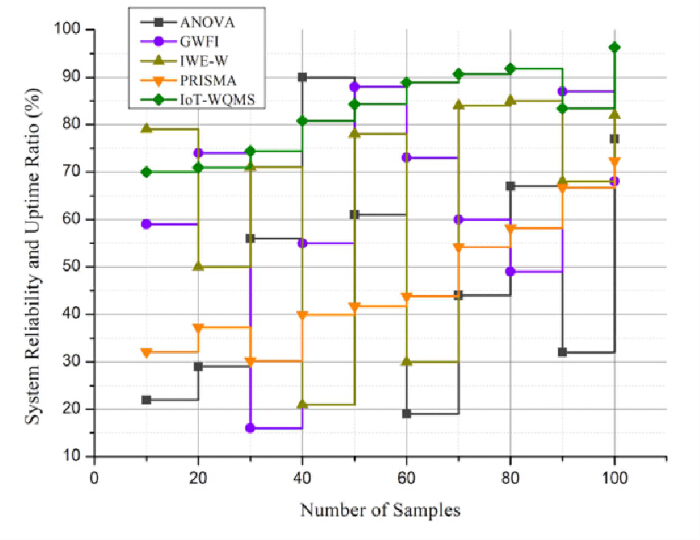
Figure 8: System Reliability and Uptime. Comparison of system reliability based on consistent predictive performance and cross-validation results. Please click here to view a larger version of this figure.
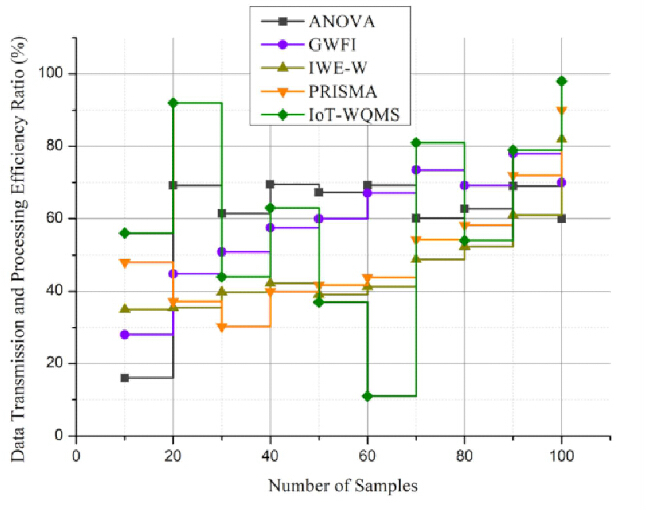
Figure 9: Data Transmission and Processing Efficiency. Comparison of computational processing and data transmission efficiency among the evaluated methods. Please click here to view a larger version of this figure.
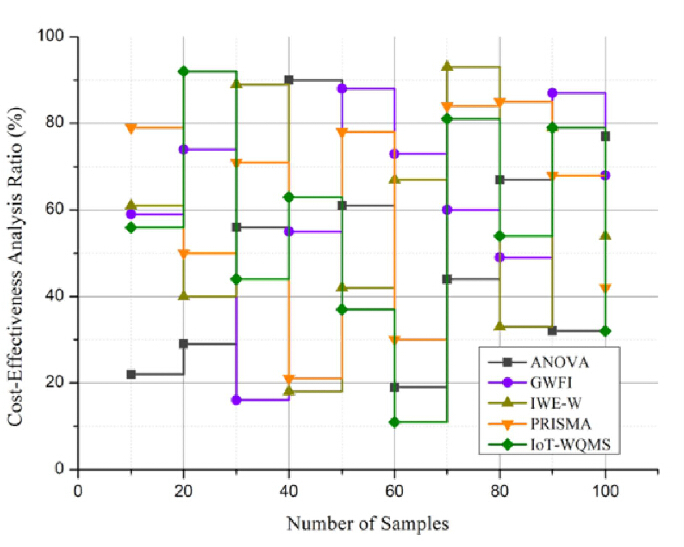
Figure 10: Cost-Effectiveness Analysis Ratio. Comparison of the estimated implementation cost and cost-effectiveness of the proposed IoT-WQMS. Please click here to view a larger version of this figure.
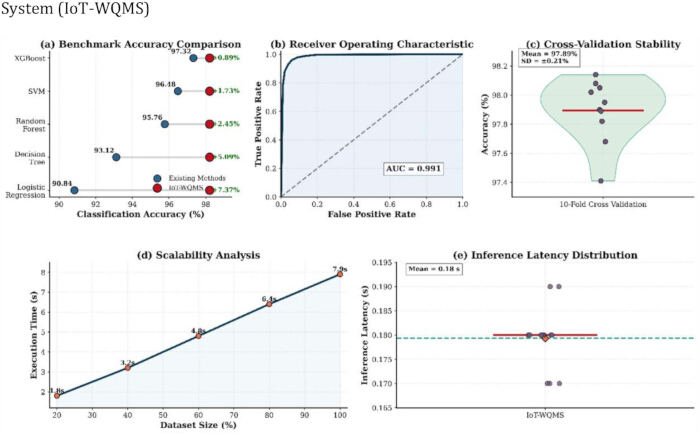
Figure 11: Performance evaluation of the proposed IoT-Enabled Water Quality Monitoring System (IoT-WQMS). Benchmark classification accuracy (a), receiver operating characteristic (ROC) analysis (b), 10-fold cross-validation stability (c), scalability analysis with increasing dataset size (d), and inference latency distribution (e) are presented to evaluate the predictive performance and computational behaviour of the framework. Please click here to view a larger version of this figure.
דיון
הערכה חישובית זו, שהיא הוכחת היתכנות, השתמשה במאגר הנתונים הציבורי Kaggle Water Potability; ביצועיה מוגבלים על ידי תכונותיו של מאגר הנתונים. מאגר הנתונים כולל מדידות פיזיקו-כימיות סטנדרטיות של איכות מים לבניית מודל חיזוי; עם זאת, ייתכן שאינו משקף באופן מספיק שונות גאוגרפית, עונתית, אקלימית ושונות בריכוזי מזהמים במקווי מים טבעיים שונים. כאשר המודל יוחל על הקשרים גאוגרפיים שונים או על נתוני שטח שנאספו באופן רציף, יעילות החיזוי עשויה להשתנות. סחריף בכיול חיישנים, הפרעות סביבתיות, ביואשחון (biofouling), חוסר יציבות בתקשורת, צריכת חשמל ובלאי של חומרה לא כוונתו באופן ניסיוני, מכיוון שארכיטקטורת חומרת ה-IoT המוצעת לא הוטמעה בעולם האמיתי. השימוש בנתוני ייחוס לא מקוונים במקום זרמי חיישנים בזמן אמת הגביל את ההערכה החישובית בתנאים סביבתיים דינמיים, כולל תצפיות חסרות, כשלים בחיישנים וקישוריות רשת משתנה. בדיקת השקיפות (scalability) הוגבלה למאגרי נתונים הגדלים בהדרגה ואינה מאפיינת באופן מלא את הביצועים בהתקנות IoT מבוזרות בקנה מידה גדול עם צמתי חיישנים רבים וקישוריות ענן-קצה. סט בדיקה נפרד (hold-out) ואימות צולב של 10 קיפולים (10-fold cross-validation) שימשו להערכת חסון המודל, אך לא בוצע תיקוף חיצוני באמצעות מאגרי נתונים עצמאיים מהשטח, ולכן ביצועי החיזוי המדווחים משקפים את תנאי הערכת הייחוס ולא תנאי תפעול אוניברסליים.
התוצאות הניסיוניות מראות כי מערכת ניטור איכות המים מבוססת IoT (IoT-WQMS) היא מסגרת הוכחת-היתכנות (proof-of-concept) רשמית להערכה חכמה של איכות מים תוך שימוש במערך נתונים ציבורי של benchmark. אנליטיקה מבוססת ענן ולמידה מכונה יכולים להבחין באופן מהימן בין דגימות מים ראויות לשתייה לדגימות שאינן ראויות לשתייה, תוך שמירה על יעילות חישובית לצורך ניטור סביבתי בזמן אמת כמעט. תוצאות אלו מרמזות כי מסגרות אנליטיות מונחות נתונים עשויות לשפר משמעותית את העיתוי והעקביות של הערכת איכות המים בהשוואה לטכניקות מבוססות מעבדה הנסמכות על דגימה תקופתית וניתוח מושהה. ה-IoT-WQMS המוצע הציג ביצועים טובים יותר מ-Logistic Regression, Decision Tree, Random Forest ו-Extreme Gradient Boosting בביצועי ניבוי וביציבות אל מול דרישות חישוביות גוברות. הכנה שיטתית של נתונים, נורמליזציה של מאפיינים וניבוי חכם שיפרו את מהימנות הסיווג בעלות חישובית מינימלית. מחקר סקלאביליות מראה כי הגדלת נפח הנתונים משפיעה בעיקר על זמן הביצוע מבלי להפחית את ביצועי הניבוי, מה שהופך את המסגרת למתאימה ליישומי ניטור סביבתי בקנה מידה גדול. המסגרת מספקת ארכיטקטורה רעיונית למערכות ניטור סביבתי חכמות, ובכך הופכת אותה לישימה מעבר למידול ניבוי. מעקב אחר משאבי מים, זיהוי מהיר של תנאי איכות מים חריגים ותמיכה מקבלת החלטות בזמן אמת עבור סוכנויות סביבתיות, מתקני טיפול במים, ניטור תעשייתי וחקלאות מדייקת מתאפשרים באמצעות טכנולוגיות חישוש בעלות נמוכה, תקשורת אלחוטית, ניהול נתונים מבוסס ענן וניבוי אוטומטי. מחקר זה מוגבל על ידי מספר גורמים. תכנון חומרת ה-IoT המוצע הוא הוכחת היתכנות, וההערכה הניסיונית השתמשה אך ורק במערך הנתונים הציבורי Kaggle Water Potability. סוגיות סביבתיות כגון כיול חיישנים לטווח ארוך, הפרעות בתקשורת, סחיפת חיישנים (sensor drift), ביואנקינג (biofouling) ותנודות עונתיות לא נבדקו. במערך הנתונים חסרים גם מדדים סביבתיים כגון חמצן מומס ומוליכות חשמלית, מה שמגביל את המחקר החישובי של היבטים אלו. מחקרים עתידיים יתקפו את הארכיטקטורה המוצעת באמצעות פריסות IoT בעולם האמיתי ואיסוף נתונים סביבתיים רציף עם התקני חיישנים רב-פרמטריים משולבים. מחקר נוסף יעסיק מודלים מתוחכמים של למידה עמוקה, אלגוריתמים אדפטיביים לזיהוי חריגות, בינה מלאכותית ניתנת להסבר (explainable AI) ולמידה מבוזרת (federated learning) כדי לשפר את הכללה של הניבוי ואת יכולת הפרשנות של המודל. ערים חכמות, ניטור שפכים תעשייתיים, חקלאות מדייקת ויוזמות לקיימות סביבתית יפיקו תועלת מחישוב קצה (edge computing), טכנולוגיות תאום דיגיטלי (digital twin) ומנגנוני שיתוף נתונים מבוזרים ומאובטחים כדי לשפר את הסקלאביליות, המהימנות והתמיכה בקבלת החלטות לניהול חכם של משאבי מים.
איור 11 מציג את הערכת הביצועים המקיפה של מערכת ניטור איכות המים מבוססת ה-IoT המוצעת (IoT-WQMS). התוצאות מדגימות כי המסגרת המוצעת השיגה דיוק סיווג של 98.21%, ובכך עלתה בביצועיה על מסווגי למידת המכונה ששימשו כבנצ'מרק במחקר זה. ניתוח עקומת מאפייני תגובה (ROC) הניב ערך ROC-AUC של 0.991, דבר המעיד על יכולת הבחנה מצוינת בין דגימות מים ראויות לשתייה לבין דגימות שאינן ראויות לשתייה. תוצאות האימות הצולב (cross-validation) מאשרות עוד את החסון והיציבות של המודל החזוי, עם דיוק ממוצע של 97.94% ± 0.42% לאורך עשרה קיפולי אימות. ניתוח סקביליות מראה כי זמן הביצוע עלה באופן הדרגתי מ-1.8 s ל-7.9 s ככל שניצול מערך הנתונים עלה מ-20% ל-100%, תוך שמירה על דיוק סיווג מעל 97.5%. יתרה מכך, השהיית ההסקה הממוצעת הייתה 0.18 s לדגימה, מה שמדגים את היעילות החישובית של המסגרת המוצעת להערכת איכות מים בזמן אמת כמעט מלא.
מימוש אב-טיפוס של ארכיטקטורת ה-IoT המוצעת, המשתמש בבקר מיקרו ESP32, מודולי חיישנים בעלות נמוכה ועיבוד מבוסס ענן, עולה כ-USD 65 (≈ INR 5,500), סכום נמוך משמעותית ממערכות סטנדרטיות להערכת איכות מים המבוססות על מעבדה. ניטור רציף וקבלת החלטות מבוססות נתונים מומשמים באופן אוטומטי באמצעות תכנון זה. עלות החומרה נאמדה לפי מחירי השוק המצטברים של רכיבים הזמינים מסחרית, כולל לוח פיתוח ESP32 (בסך USD 8.50), מודול חיישן pH (בסך USD 12.00), חיישן עכירות (בסך USD 9.50), חיישן טמפרטורה DS18B20 (בסך USD 3.00), ספק כוח 5 V (בסך USD 6.00), מארז לאב-טיפוס (בסך USD 8.00), לוח ניסיונות ואביזרי חיבור (בסך USD 4.00), ורכיבי הרכבה שונים (בסך USD 14.00).
מחקר זה הציג מסגרת חישובית להוכחת היתכנות עבור מערכת לניטור איכות מים מבוססת IoT (IoT-WQMS), תוך שימוש במערך הנתונים למיהול מים (Water Potability) הזמין לציבור מאתר Kaggle. המסגרת המוצעת משלבת ארכיטקטורת חישוב לדוגמה של חיישני IoT, עיבוד נתונים בסיוע ענן וחיזוי מיהול מים מבוסס למידת מכונה, וזאת כדי להעריך את ההיתכנות של ניתוח חישובי חכם להערכת איכות מים. הערכה ניסויית הדגימה ביצועי חיזוי חזקים, עם דיוק של 98.21%, precision של 97.86%, recall של 98.04%, F1-score של 97.95% ו-ROC-AUC של 0.991. חוסנו של המודל אושש באמצעות תיקוף צולב של 10 קיפולים (10-fold cross-validation), שהניב דיוק ממוצע של 97.94% ± 0.42% ושיהוי הסקה ממוצע של 0.18 s לדגימה. ניתוח סקילביליות הדגים ביצועים חישוביים יציבים ככל שניצול מערך הנתונים עלה מ-20% ל-100%. ממצאים אלו תומכים ביעילותה של המסגרת החישובית המוצעת לחיזוי מיהול מים מבוסס למידת מכונה על גבי מערך נתונים ייחוס. ארכיטקטורת ה-IoT המוצעת מוצגת כמסגרת מימוש רעיונית ולא תוקפה ניסוית באמצעות פריסת חיישנים בעולם האמיתי. עבודות עתידיות יתמקדו בהטמעה ובתיקוף של המסגרת באמצעות חומרת IoT רב-חיישנית בתנאי שטח, שילוב פרמטרים נוספים של איכות מים ובחינת טכניקות מתקדמות של בינה מלאכותית לשיפור ההכללה של החיזוי, זיהוי אנומליות אדפטיבי וישימות מעשית לניטור איכות מים בעולם האמיתי.
גילויים
ניגוד עניינים: המחברים מצהירים כי אין ניגודי עניינים.
תודות
מימון: מחקר זה לא קיבל מענק ספציפי מכל סוכנות מימון במגזר הציבורי, המסחרי או הבלתי מרוויח.
חומרים
| שם | חברה | מספר קטלוג | הערות |
|---|---|---|---|
| לוחבדיקה (Breadboard) וחוטי חיבור | Generic Electronics Supplier | MB-102 / Dupont Kit | חיבור חשמלי של מודולי חומרה |
| פלטפורמת מחשוב ענן | Google Firebase | אחסון, ויזואליזציה וגישה מרחוק לנתוני ניטור | |
| ספריית הצפנת נתונים | OpenSSL Foundation | AES-256 Library | העברה מאובטחת של נתוני חיישנים |
| חיישן מוליכות חשמלית | מדידת מוליכות חשמלית של מים | ||
| לוח פיתוח ESP32 | Espressif Systems | ESP32-WROOM-32 | ממשק חיישנים, עיבוד מקומי ותקשורת אלחוטית |
| סט נתוני התאמת מים מ-Kaggle | Kaggle | Water Potability Dataset | פיתוח מודל, אימון והערכת ביצועים |
| מודול כרטיס MicroSD | Generic Electronics Supplier | Catalex MicroSD Module | באפרינג זמני ואחסון מקומי של מדידות חיישנים |
| מודול חיישן pH | DFRobot | SEN0161-V2 | מדידת חומציות ובסיסיות של מים |
| חיישן זיהוי מזהמים | Atlas Scientific | EZO Sensor Series | הערכת ריכוז מזהמים |
| ספק כוח | Mean Well | RS-15-5 | מקור מתח יציב עבור מערכת הניטור |
| סביבת תכנות Python | Python Software Foundation | Python 3.11 | עיבוד מקדים של נתונים, פיתוח מודל והערכת ביצועים |
| חיישן טמפרטורה | Maxim Integrated | DS18B20 | מדידת טמפרטורת מים |
| חיישן עכירות | DFRobot | SEN0189 | מדידת עכירות מים |
| Visual Studio Code | Microsoft | Version 1.x | מימוש תוכנה וניפוי שגיאות (debugging) |
| מודול תקשורת Wi-Fi | Espressif Systems | Integrated ESP32 Wi-Fi | העברה אלחוטית של נתוני ניטור |
מקורות
- He W, et al. Reduction pathways identification of agricultural water pollution in Hubei Province, China. Ecol Indic. 2023;153:110464.
- Thakur RR, et al. Urban expansion and land use transformations in Midnapore City (2003–2024): implications for sustainable development. Earth (Basel). 2025;6(2):50.
- Atojunere EE, Senadeera W, Iji P, Jamaima L. Development of an indirect active solar heating dryer (IASHD) for dwarf Cavendish banana. Indian J Eng. 2026;23(59). https://doi.org/10.54905/disssi.v23i59.e1ije1707.
- Gopan G, Arun M, Vembu S. Comparison of dimple tube with flat plate collector for solar water heater by using carbon nanofluid. Int J Low Carbon Technol. 2025;20:820–833.
- Venkatesh R. Effect of hybrid nanofluid and polyethylene glycol/aluminium foam on thermal characteristics and energy storage performance of solar air heater. Appl Therm Eng. 2026;291:130213.
- Dixit PR, et al. Exploring seasonal changes in coastal water quality: multivariate analysis in Odisha and West Bengal coast of India. Water (Basel). 2024;16(20):2961.
- Al-Mukaram N, Al-Tuwayyij H, Musa SS. Performance assessment of sustainable pavement including glass waste powder. Indian J Eng. 2026;23(59). https://doi.org/10.54905/disssi.v23i59.e5ije1712.
- Rinesh S, et al. Prediction and classification of solar photovoltaic power generation using extreme gradient boosting regression model. Int J Low Carbon Technol. 2024;19:2420–2430.
- Hou H, Su L, Guo D, Xu H. Resource utilization of solid waste for the collaborative reduction of pollution and carbon emissions: case study of fly ash. J Clean Prod. 2023;383:135449.
- Venkatesh R. Effect of boron nitride on mechanical characteristics of LDPE nanocomposite made with ramie fiber. J Inst Eng India Ser D. Published online April 13, 2024. https://doi.org/10.1007/s40033-024-00716-6.
- Wang H, Liu C, Xiong L, Wang F. The spatial spillover effect and impact paths of agricultural industry agglomeration on agricultural non-point source pollution: a case study in Yangtze River Delta, China. J Clean Prod. 2023;401:136600. https://doi.org/10.1016/j.jclepro.2023.136600.
- Arun M, Barik D, Sridhar KP, Dennison MS. Thermal performance of a dimpled tube parabolic trough solar collector (PTSC) with SiO₂ nanofluid. Int J Photoenergy. 2022;2022:8595591. https://doi.org/10.1155/2022/8595591.
- Hassan A, et al. Statistical analysis for water quality data using ANOVA (case study—Lake Burullus influent drains). Ain Shams Eng J. 2024;15(4):102652.
- Zhang X, et al. Identify the key emission sources for mitigating ozone pollution: a case study of urban area in the Yangtze River Delta region, China. Sci Total Environ. 2023;892:164703.
- Kong Y, et al. Adaptability analysis of water pollution and advanced industrial structure in Jiangsu Province, China. Ecol Model. 2023;481:110365.
- Mmonwuba NC, et al. The effect of industrial waste effluent on water quality: a case study of Otamiri River, Owerri, Imo State. J Eng Res Rep. 2023;24(4):15–25.
- Pásková M, et al. Water pollution generated by tourism: review of system dynamics models. Heliyon. 2024;10(1). https://doi.org/10.1016/j.heliyon.2023.e23824.
- Kurniawan TA, et al. Implications of climate change on water quality and sanitation in climate hotspot locations: a case study in Indonesia. Water Supply. 2024;24(2):517–542.
- Zogaj F, et al. Assessment of groundwater quality in some regions of Kosovo based on physico-chemical and microbiological parameters. Limnol Rev. 2026;26(2):16.
- Bytyçi P, et al. Integrated water quality assessment of the Drenica River using macroinvertebrates and Promethee decision method. Biologia (Bratisl). 2026;81(6):146.
- Pati AK, et al. Irrigation water quality prognostication: an innovative ensemble architecture leveraging deep learning and machine learning for enhanced SAR and ESP estimation in the east coast of India. J Environ Chem Eng. 2025;13(3):116433.
- Barad S, et al. Hydrogeochemical and geospatial insights into groundwater contamination: fluoride and nitrate risks in Western Odisha, India. Water (Basel). 2025;17(10):1514.
- Gunaprasad K, et al. A multi-stage learning and fusion framework for water quality assessment using IoT-based sensor data [conference paper]. Presented at: 2025 5th International Conference on Mobile Networks and Wireless Communications (ICMNWC); Tumkur, India; 2025. https://doi.org/10.1109/ICMNWC66779.2025.11354450.
- Su J, Xu W, Lin Z. Algorithm for monitoring water quality parameters in optical systems based on artificial intelligence data mining. Sci Rep. 2024;14(1):28142.
- Sardar T, Mishra S, Pandey S, Khan A. Optical sensing technologies coupled with IoT for water quality assessment: a review. Appl Spectrosc Rev. Published online 2026:1–28. https://doi.org/10.1080/05704928.2026.2650190.
- Kadiwal A. Water potability [dataset]. Kaggle; [cited 2026 Aug 9]. Available from: https://www.kaggle.com/datasets/adityakadiwal/water-potability.