This protocol describes a laboratory-based multimodal method for measuring emotional responses to film clips in young adults, healthy older adults, and older adults with dementia.
מאמר שיטה
Multimodal Assessment of Emotion in Aging and Dementia: A Laboratory-Based Protocol
במאמר זה
סיכום
תקציר
Dementia affects millions worldwide and challenges emotional and social functioning. However, emotional experiences in dementia remain poorly understood. To help better understand this complex phenomenon, the component process model (CPM) was used, which views emotion as a changing process involving appraisal, expression, physiology, motivation, and feeling. It demands a multimodal approach to measure its components. A protocol was developed that combines physiological, facial, vocal, linguistic, and self-report measures, and its feasibility was assessed. The protocol was piloted using iMotions on two older adults with caregiving experience and one with expertise in neuropsychology. Adjustments to instructions, mock tests to familiarize participants with the tasks, and session duration were implemented for a subsequent sample of healthy participants (3 young and 4 older adults) and for 1 older adult diagnosed with dementia due to probable Alzheimer’s disease. Participants were screened for impairments in hearing, vision, cognition, and language, as well as psychological distress. The final tasks required watching validated film clips to elicit joy, anger, and sadness. Recorded data according to the CPM included facial movements and voice (expression), electrodermal activity and heart rate (physiology), discourse content, and CoreGRID questionnaire (appraisal; feeling; motivation). Protocol feasibility was assessed by documenting the number of completed tasks, collecting participant feedback via the Post-Study System Usability Questionnaire with comments, and extracting data quality metrics from iMotions for facial expressions and galvanic skin response (percentage of usable data; signal-to-noise ratio). All participants completed the tasks and reported positive feedback on the usability questionnaire. Automated facial expression data were analyzable for all participants, and galvanic skin response recordings were obtained for all participants, with 10 of 11 recordings meeting the predefined signal-to-noise criterion. This protocol was feasible to administer in the tested sample. Further evaluation in larger and more diverse dementia samples is needed.
מבוא
Emotion is central to human behavior, social communication, and well-being, but it remains difficult to define because it involves multiple interacting systems of response. Emotion can be understood as a relatively brief, event-related response involving changes in the body, mind, and behavior, and can be expressed through facial, vocal, verbal, physiological, and subjective channels1,2,3. Therefore, emotion should not be treated as a single internal state. Instead, it is better understood as a dynamic process that unfolds across multiple response systems, including how a person evaluates an event, prepares to act, reacts physiologically, expresses themselves, and consciously experiences a feeling4. This makes emotion difficult to assess using a single measure. Studies that rely on a single indicator, such as self-report, facial expression, or physiological arousal, may capture only one part of an emotional episode5,6,7,8,9. This limitation is particularly important when studying aging and dementia, where verbal report, facial expressivity, physiological regulation, language, or cognitive appraisal may differ across individuals10,11,12.
The component process model (CPM)13 provides a useful theoretical framework for addressing this challenge. In this model, an emotion episode involves coordinated changes across five components: appraisal, expression, physiology, motivation, and feeling4,14,15. Appraisal refers to how the person evaluates the meaning and relevance of the event. Physiology includes autonomic and bodily changes. Motivation refers to action tendencies, such as approach, avoidance, or withdrawal. Expression includes facial, vocal, and bodily manifestations. Feeling refers to the consciously experienced emotional state. A key advantage of this model is that it supports a componential and multimodal approach in which different signals provide complementary information about the same emotional episode16.
Therefore, a method based on the CPM is best supported by multimodal measurement. Facial expression and voice analysis can be used to assess expressive components of emotion. Galvanic skin response (GSR) and heart rate can be used to assess physiological arousal. Self-report questionnaires can capture participants’ subjective ratings across componential features of emotional experience, including appraisal, bodily reactions, expressions, action tendencies, and feelings15,17. Spoken descriptions of emotional stimuli can also add information that is not captured by facial, physiological, or questionnaire measures alone. Linguistic and sentiment analyses can quantify emotional tone, positive and negative emotion words, and other psychologically meaningful language categories18. In addition, the content of speech can be examined indirectly for appraisal-related or evaluative language, such as descriptions of what is happening, what the scene means, and how the person interprets the emotional situation19. The combination of facial, physiological, vocal, linguistic, and self-report measures allows researchers to move closer to a componential assessment of emotion.
A second methodological challenge for studies seeking to characterize the typical emotional responses of specific population groups lies in the selection of appropriate emotional stimuli. Stimuli should be validated for the intended emotional categories and standardized in order to support reproducibility. Ideally, they should also be brief enough so as not to induce fatigue, and suitable for presentation to participants with different sensory, cognitive, and language abilities. Meta-analytic evidence suggests that film stimuli are among the most effective methods for evoking both positive and negative emotional states20. However, film clips must be selected carefully because they vary in duration, sensory complexity, narrative content, familiarity, and emotional intensity. Film databases have been validated to reliably elicit target emotional states such as joy, sadness, anger, and neutrality16,21,22. Neutral clips provide a baseline against which emotional responses to target clips can be interpreted20. Some databases were developed for discrete and componential emotion assessment, which helps align stimulus selection with the theoretical framework, i.e., CPM, of the study16,21.
Multimodal emotion assessment is particularly relevant for aging and dementia research. Dementia is an umbrella term used to describe conditions involving gradual cognitive decline and impairment in social functioning. These conditions can affect memory, language, attention, executive function, visuospatial ability, everyday activities, and social interactions23,24. Supporting emotional well-being is an important priority in dementia care, which includes maintaining a sense of dignity for persons with dementia25. However, assessing emotional responses in people with dementia can be challenging because cognitive and language changes may affect self-report, while each measurement method captures only one part of the emotional response26. Aging itself may influence emotional experience and response. Older adults often report relatively preserved or even improved emotional well-being in daily life27, but laboratory studies show that subjective and physiological responses to emotional stimuli can differ by age and may not always change in the same direction28,29. These age-related differences highlight the need to interpret emotional responses in dementia while also considering normal aging.
Despite this need, applying a comprehensive multimodal protocol with older adults and people with dementia is challenging. Participants may experience reduced tolerance for long testing sessions, fatigue, or difficulty understanding task instructions due to sensory limitations, language, or more general cognitive difficulties. Biometric measures also pose practical challenges, including facial-tracking failures, movement artifacts in electrodermal activity, poor audio quality, and missing questionnaire responses. These challenges make feasibility testing essential before applying a multimodal protocol in larger samples. A protocol designed for this population should include short and structured tasks, scheduled pauses to reduce the possibility of fatigue, clear task instructions to support comprehension, as well as screening for vision and hearing to address sensory limitations, screening for language and cognition to identify communication and cognitive difficulties, and screening for psychological distress to support participant safety. Biometric feasibility should include predefined data quality rules and controlled room conditions.
The goal of the present method article is to describe a laboratory-based protocol for assessing emotional responses in healthy young adults (HYA), healthy older adults (HOA), and older adults with dementia (OAWD) using synchronized multimodal measurement. Film clips that have been validated to elicit specific emotional responses16,21,22 were presented to participants, and their emotional responses were assessed using a multimodal approach. The iMotions Lab 11 platform was used to present the stimuli and synchronize the collection of different types of data. In the first phase, participants passively watched the film clips while data on facial expressions, skin conductance response, and heart rate were collected. Before and after each clip, participants were asked to read three standardized sentences aloud, allowing emotional data to be collected from their vocal signals. After each emotional film clip, they answered a selection of items from the CoreGRID questionnaire, a self-reporting instrument for the componential assessment of emotions16,17. In the second phase, participants re-watched the film clips and described what they saw, what they thought was happening, and how the scene made them feel. Their spoken descriptions were collected for subsequent linguistic, sentiment, and appraisal-related analyses. This protocol is intended for researchers who wish to examine emotional experience across multiple components while maintaining a feasible procedure in older adults and individuals with non-severe dementia who meet the specified screening criteria. It is most appropriate for controlled laboratory settings in which synchronized facial, vocal, physiological, linguistic, and self-report data can be collected.
פרוטוקול
The study protocol (collection, storage, access, retention, and uses of identifiable facial and voice recordings) was approved by the University of Ottawa Research Ethics Board under Ethics File Number H-05-25-11608. After an initial pilot test, adjustments were made to the task instructions, the inclusion of a short mock test to familiarize participants with the procedure, and the overall session duration. Refer to the Table of Materials for the software, sensors, recording equipment, and screening instruments used in this protocol.
1. Recruit and classify participants
- Allocate two visits on separate days for each participant. Ensure that a caregiver is present for participants with dementia to assist as needed. Schedule each participant for Visit 1, i.e., screening.
- Send one confirmation email with the visit details and consent form only for review.
- Send a reminder email the day before the visit and ask participants to bring their glasses or hearing aids if used, and invite them to contact the researcher with any last-minute questions.
2. Visit 1: Screen participants for eligibility
- Review the consent form with the participant. Obtain written consent before beginning the screening session.
- For participants with dementia, allow additional time to review the consent information and confirm that the participant understands the study procedures, the voluntary nature of participation, and the right to withdraw before obtaining written consent. Have the caregiver assist with clarification when needed.
- Collect demographic information using the approved demographic questionnaire.
- Conduct binocular visual acuity screening using the Freiburg Visual Acuity Test (FrACT; version 10.3.5) with Sloan Letters and Tumbling E optotypes30 while participants wear their usual corrective lenses or bifocals.
- Exclude participants when the FrACT result indicates visual acuity worse than 20/70 on the Snellen chart with either of the two tests31.
- Conduct the hearing screening at 40 dB using 500, 1000, 2000, and 4000 Hz signals32 for both ears and use speaker-based audiology testing equipment while participants wear their hearing aids during screening.
- Include participants when they detect at least 2 out of 4 frequency tones presented at 40 dB.
- Administer the Montreal Cognitive Assessment (MoCA)33. Include healthy participants when the MoCA score is ≥ 23 (consistent with healthy control for this protocol)34.
- Include participants with dementia when the MoCA score is ≥ 9 (consistent with non-severe-stage dementia for this protocol)35.
- Administer the Dementia Severity Rating Scale (DSRS)36 and the Functional Activities Questionnaire (FAQ)37 with the caregivers. Include only participants when the DSRS score is ≤ 36 (more than 36 is considered severe)36 and the FAQ score is ≥ 6 (consistent with dementia-level functional impairment)38.
- For language assessment, administer the Quick Aphasia Battery (QAB) to all participants and include them when the QAB score is ≥ 7.5 (considered as mild or no aphasia)39.
- Administer the Kessler Psychological Distress Scale (K10)40 to all participants and exclude participants when the K10 score is ≥ 29 (considered as high distress)41.
- Exclude participants with a current clinically diagnosed psychiatric disorder that may interfere with emotional response or study participation, including major depressive disorder, generalized anxiety disorder, bipolar disorder, or other active mood or anxiety disorders.
NOTE: Participants provided separate consent regarding public presentation of their video recordings by selecting one of three options: (1) the video recording may not be used in public presentations; (2) the video recording may be used only with the participant’s face blurred; or (3) the video recording may be used without facial blurring. This choice did not alter the secure storage and restricted access procedures.
3. Prepare the laboratory environment and participant for Visit 2
- Use two quiet laboratory rooms such that one has access to the other via a window. Maintain room temperature between 21 and 24 °C.
- Maintain room humidity between 30% and 60%. Maintain room lighting at approximately 100 lux at face level using diffuse lighting.
- Measure light using a digital light meter. Place the participant-facing monitor directly in front of the participant.
- Use a 27-inch monitor as the primary stimulus-presentation display. Set the monitor to 2560 × 1440 pixels at approximately 60 Hz and brightness to 40%.
- Use a second monitor for the researcher to view the sensor and recording interface during data collection. Do not use the second monitor to present visual stimuli to the participant.
- Send two reminder emails to the participant after Visit 1 and before Visit 2: one confirmation email immediately after Visit 1, and one reminder email approximately a day before Visit 2.
- Ask participants to bring their glasses and/or hearing aids if used; ensure earrings, rings, or bracelets are removable; avoid hand lotion, oil, or cream before the session; avoid coffee for approximately 2 h before the session; and avoid alcohol for approximately 12 h before the session. Inform participants that they may eat, drink water, and take their usual medications as normal.
NOTE: When feasible, schedule Visit 2 between 10:00 AM and 12:00 PM and use a consistent time window across participants to minimize variability associated with circadian factors and caffeine withdrawal. If direct verbal communication between rooms is unavailable, use a separate two-way communication device only for communication. Do not use this device to present study stimuli or collect study data.
4. Prepare the software and stimulus sequence
- Open the multimodal data-acquisition platform (iMotions). Create two study flows within a study file in the multimodal data-acquisition platform.
- Name the first study flow as “Study Flow 1” for passive viewing (see Supplementary File 1). Name the second study flow as “Study Flow 2” for active engagement (see Supplementary File 2).
- In Study Flow 1 (passive viewing), create one welcome page followed by 8 stimulus blocks, as detailed in the Supplementary File 1.
- Use the following block order in Study Flow 1: Neutral(1), Joy(a), Neutral(2), Sad, Neutral(3), Joy(b), Neutral(4), Anger. Use the film clips in the order and emotion categories listed in Supplementary Table 1.
- Configure the welcome page to instruct participants that they are about to watch 8 short video excerpts, each lasting 1 to 3 min. It states that some clips may not have sound.
- Create four Neutral blocks in Study Flow 1. In each block, add a sentence-reading screen before the Neutral film clip.
- Use these three neutral sentences on the sentence-reading screen42: “The earth is round,” “Digital clocks are common,” and “Our body is made of water.”
- Add an instruction screen before each Neutral film clip. Add a no-sound instruction screen before each neutral film clip.
- Add the Neutral film clip after the instruction screen. Do not add the CoreGRID questionnaire and sentence-reading after Neutral clips.
- Create four emotional blocks in between those Neutral blocks in Study Flow 1: Joy (a), Sad, Joy (b), and Anger.
- In each emotional block, add a sentence-reading screen before the emotional film clip. Use the same three neutral sentences on the pre-clip sentence-reading screen.
- Add an instruction screen before each emotional film clip to guide the participant to proceed.
- Add a sentence-reading screen immediately after each emotional film clip.
- Add an instruction screen telling the participant to answer the next questions about the movie clip they just watched.
- Add the 22-item CoreGRID questionnaire after each emotional film (only use the Appraisal, Motivation, and Feeling major components from the 32 CoreGRID items)16.
- In Study Flow 2 (active engagement), create the same 8 stimulus blocks using the same block order.
- In each Study Flow 2 block, add an instruction screen before the film clip asking the participant to describe the video while it is playing.
- Use the following instruction text: “Please describe the next video while it is playing. You can tell me: what you see happening, what you think is going on, and how the scene makes you feel.”
- Add a no-sound instruction screen before each Neutral film clip in Study Flow 2. Add the film clip after the instruction screen.
- Add the Emotion Selection task after each film clip in Study Flow 2. In the Emotion Selection task, ask the participant to reflect on the movie they just watched and their feelings.
- Include the following response options in the Emotion Selection task: Sad, Joy, Neutral, and Anger (see Supplementary File 2).
- Add a movie familiarity question after each Emotion Selection task (see Supplementary File 2).
- Ask the participant, “Have you seen this movie before?” Include the following response options for the movie familiarity question: Yes, No, and I am not sure.
- Confirm that all movie clips have the same video properties: 1920 × 1080 pixel resolution and 30.00 frames/s.
- Configure the pre-clip and post-clip sentence-reading screens so that only the researcher can advance to the next stimulus.
NOTE: The neutral sentence-reading task is used as a standardized voice sample. Use neutral sentences before and after emotional clips to assess changes in vocal features without using emotionally loaded sentence content. In Study Flow 2, the active description task is used to collect spoken descriptions for subsequent analyses of language, sentiment, and appraisal/evaluation. Neutral clips serve as comparison conditions between emotional clips; omitting tasks like completing the CoreGRID questionnaire reduces participant burden.
5. Configure audio and video recording
- Open Global Settings | Audio & Video in the multimodal data-acquisition platform. Under Camera Setup, select Respondent as the camera to configure.
- Check Enable VideoCam Capture (Figure 1). Select the participant-facing camera from the camera dropdown menu. Set the video recording format to 1920 × 1080 at 30 frames/s.
- Check Include Audio and select Microphone (USB Lavalier Microphone) from the audio dropdown menu.
- Leave Date, Time, and FPS overlay unchecked. Leave Horizontal and Vertical flip image options unchecked. Set the video encoding format to H.265.
- Connect the microphone directly to the recording computer. Clip the USB lavalier microphone to a lanyard around the participant’s neck.
- Check that the participant’s face is centered in the webcam frame. Check that the participant’s face is not occluded by hair, hands, glare, or screen position.
- Ask the participant to read one short test sentence aloud. Confirm that the audio signal is audible.
- Check that the speaker volume is comfortable for the participant. Keep the speaker volume setting consistent across all movie clips.
NOTE: Overlays are optional for quality-control review, and image-flip options are only needed if the preview image is inverted.
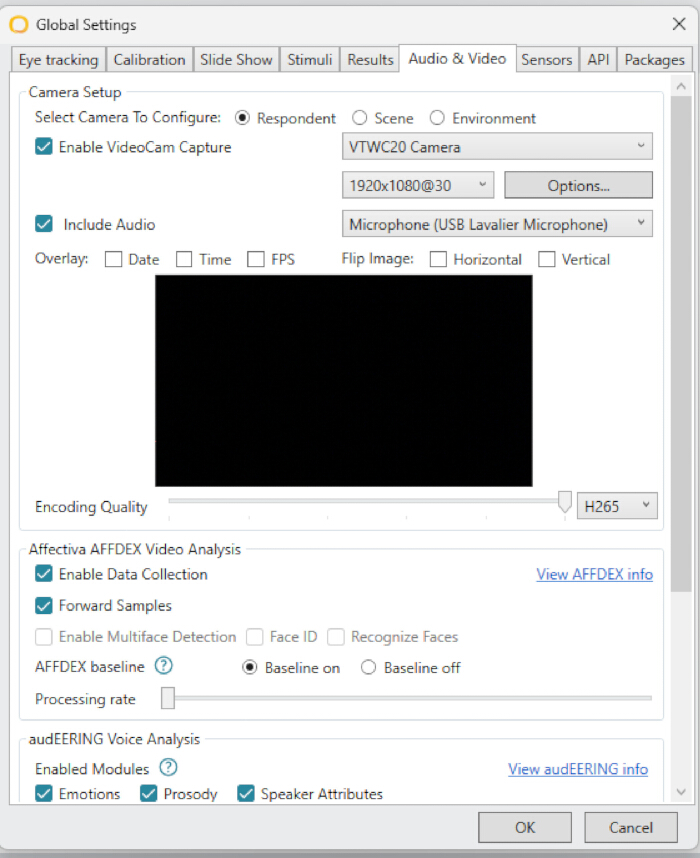
Figure 1: Audio and video global settings in iMotions to configure video encoding. The screenshot shows the configuration used for participant-facing video and audio recording. Video was configured at 1920 × 1080 resolution and 30 frames/s, with audio captured using a USB lavalier microphone and video encoded in H.265 format. Screenshot reproduced with permission from iMotions A/S. Please click here to view a larger version of this figure.
6. Configure facial expression and voice analysis
- Open Global Settings | Audio & Video.
- Under the automated facial-expression analysis module, check Enable Data Collection. Check Forward Samples (Figure 2).
- Leave Enable Multiface Detection, Face ID, and Recognize Faces unchecked. Select Baseline under the automated facial-expression analysis module.
- Set the facial-expression analysis sampling rate to 30 Hz. Under the automated voice-analysis module, check Emotions, Prosody, and Speaker Attributes.
- Set the automated voice-analysis module sampling rate to 11 Hz. Set the minimum speech segment duration to 1 s.
- Set the maximum speech segment duration to 10 s. Set the speech segment end delay to 0.25 s. Save the settings before beginning data collection.
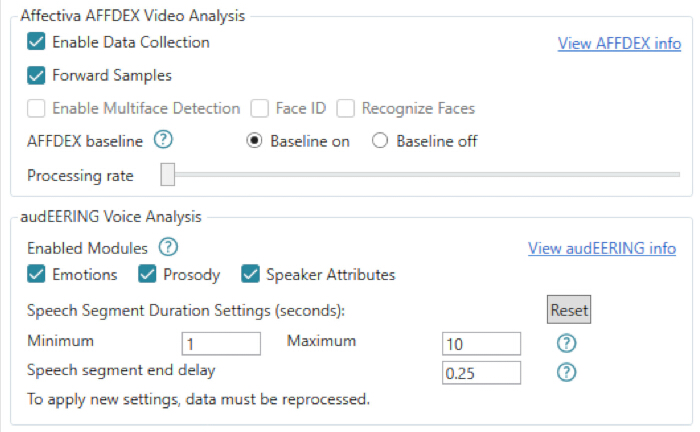
Figure 2: Affectiva AFFDEX facial expression analysis and audEERING voice analysis settings in iMotions. The screenshot shows the configuration used for automated facial expression and voice analysis. AFFDEX data collection was enabled at 30 Hz with Baseline selected, and the audEERING module was configured to analyze Emotions, Prosody, and Speaker Attributes at 11 Hz, using speech segments of 1–10 s and a segment-end delay of 0.25 s. Screenshot reproduced with permission from iMotions A/S. Please click here to view a larger version of this figure.
7. Configure GSR and heart-rate recording
- Open Global Settings | Sensors.
- Under the physiological sensor settings, select GSR as the sensor type (Figure 3).
- Set Sample Frequency to 128 Hz. Check Heart Rate. Leave Accelerometer unchecked.
- Check Enable data collection for the Shimmer device. Confirm that the GSR/PPG sensor is connected before beginning the recording, and that the connection quality is high.
- Place the electrodes on the index and middle fingers when using the standard GSR electrode setup.
- Attach the optical pulse ear-clip sensor for heart rate recording through photoplethysmography.
- Ask the participant whether hand lotion, oil, or cream was used before the session. Document lotion, oil, cream, rings, or other factors that may affect electrode contact.
- Ask the participant to sit comfortably and minimize movement of the sensor hand during recording. Use a chair with an armrest. Ask the participant to avoid speaking during stimulus presentation.
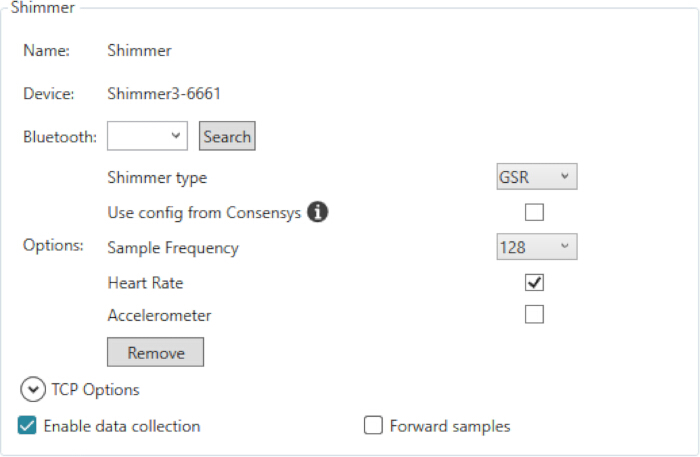
Figure 3: Shimmer GSR and heart-rate settings in iMotions. The screenshot shows the configuration used for physiological recording with the Shimmer device. GSR was selected as the sensor type with a sampling frequency of 128 Hz; heart rate recording was enabled, and accelerometer recording was disabled. Screenshot reproduced with permission from iMotions A/S. Please click here to view a larger version of this figure.
8. Visit 2: Conduct the mock test
- Seat the participant comfortably in front of the monitor. Explain that the task includes watching film clips, reading short sentences, describing scenes aloud, and answering emotion-related questions.
- Ask the participant to keep looking toward the screen during each clip. Ask the participant to remain as still as possible during each clip.
- Start the short mock test of Study Flow 1 with the participant to practice with the system and answer questions. Present the welcome page.
- Ask the participant to read the welcome instructions silently. Confirm that the participant understands that some clips may not have sound.
- Ask the participant to read the three neutral sentences aloud. Inform the participant that there is no right or wrong way to read them aloud.
- Present the no-sound instruction screen. Present the instruction screen for the mock test film clip slide.
- Use a picture with a film-clip icon and ask the participant to watch the clips from the actual test here (see Supplementary File 1 for the icon).
- Review the test recording for facial visibility, audio clarity, and physiological signal quality. Correct any recording issues before beginning the actual task (Study Flow 1).
- Document all corrections in the session log, and record the room light level in lux, temperature, and humidity in the comment box.
9. Conduct Study Flow 1: passive viewing
- Move to the adjacent researcher's room before starting Study Flow 1. Confirm that the participant is visible through the window.
- Confirm that the researcher can monitor the recording interface and sensor signals from the adjacent room.
- Use the agreed communication method and confirm that communication with the participant is working before beginning the session.
- Remind the participant to inform the researcher if they feel discomfort, fatigue, or want to pause.
- Start recording Study Flow 1 in the multimodal data-acquisition platform. Advance to the next stimulus only after the participant has read all three sentences aloud.
- Ensure that Facial expression analysis, GSR, heart rate, and microphone recording are working during the clip.
- Stop the task if the participant asks to stop or shows sustained discomfort. After Study Flow 1 is completed, remove the GSR electrodes and PPG sensor from the participant for the break.
- Record any technical issue, pause, participant discomfort, incomplete task, or possible artifact source in the session log.
10. Conduct Study Flow 2: active engagement
- Ensure that the participant had at least 10 min of break before Study Flow 2. Reattach the GSR electrodes and PPG sensor using the same placement as in Study Flow 1.
- Confirm that the GSR, PPG, facial expression, and microphone recordings are functioning before beginning Study Flow 2.
- Follow steps 9.1 to 9.4.
- Start recording for Study Flow 2 in the multimodal data-acquisition platform. Continue GSR and PPG recording throughout Study Flow 2.
- Record any technical issue, pause, participant discomfort, incomplete task, or possible artifact source in the session log.
NOTE: In Study Flow 2, participants describe each clip aloud as it plays. Continuous physiological recording preserves synchronization with the spoken descriptions for subsequent cross-modal analyses, such as combining physiological and linguistic or sentiment measures. These analyses were not conducted in the present feasibility study.
11. End the session and secure the data
- Remove the GSR electrodes, heart-rate PPG sensor, and microphone. Ask the participant whether they feel comfortable before leaving the laboratory.
- Save all participants’ recording files before closing the software as a separate study file.
- Label electronic study files with the participant's unique study ID. Store the master list linking participant identities to study IDs separately in a password-protected and encrypted file.
- Store audio recordings, video recordings, transcripts, questionnaire data, and analysis files on a secure drive. Access the data only from the password-protected research computer and do not store study data on personal devices.
- Restrict access to identifiable recordings and the participant-code master list to authorized research team members. Require any additional individual who requires access to study data to sign a confidentiality agreement.
- Treat facial video and voice recordings as identifiable data even when the files are labeled only with participant codes. Share identifiable recordings outside the research team only as permitted by the participant's consent and the approved ethics protocol.
NOTE: Participants provide separate consent regarding public use of video recordings. Recordings are not used publicly unless the participant has provided the corresponding consent; where applicable, facial blurring is applied according to the participant's selected consent option.
תוצאות
Feasibility Study - Methods
Participants
A total of 11 participants were recruited. All participants gave written informed consent for both audio and video recordings. Participant characteristics are summarized in Table 1. Of the seven healthy older adults, six had caregiving experience. One healthy older adult had 28 years of professional experience in clinical psychology and neuropsychology, including work with adults and older adults in geriatric care, rehabilitation, and memory program settings. This was the first participant who was intentionally included in the pilot phase to provide expert-informed feedback on protocol clarity, participant burden, clinical appropriateness, and data collection procedures. Their inclusion should therefore be interpreted as part of pilot testing rather than as representative of the broader healthy older adult group. The OAWD had received a clinical diagnosis of dementia due to probable Alzheimer’s disease, which was confirmed by reviewing documentation from a specialized geriatric clinic. At screening in Visit 1, this participant had a MoCA score of 13, a DSRS score of 18, and an FAQ score of 24. These results indicate that the OAWD had moderate cognitive impairment, dementia severity at the upper end of the mild range, and substantial impairment in instrumental activities of daily living, respectively.
| Group | n | Gender | Age (Years) | Education (Years) |
| HYA | 3 | 3 female | 23 (21–24) | 16 (12–18) |
| HOA | 7 | 3 female, 4 male | 73 (63–83) | 18 (15–22) |
| OAWD | 1 | 1 male | 78 | 12 |
| Total | 11 | 6 female, 5 male | 60 (21–83) | 17 (12–22) |
Table 1: Participant characteristics. Sample size, gender distribution, age, and years of education are summarized by study group. Age and education are reported as mean (range). Abbreviations: HYA = Healthy Young Adult; HOA = Healthy Older Adult; OAWD = Older Adult with Dementia.
Protocol refinement
The first three HOA participants completed an initial pilot version of the protocol. This version included 16 film clips arranged in four sets, with each set including a neutral, joy, sadness, and anger clip, and Visit 2 lasted approximately 4.5 h. Qualitative feedback from these participants was used to refine the procedure. In the revised protocol, the number of film clips was reduced from 16 to 8, comprising four neutral clips and four emotional clips (two joy, one sadness, and one anger), and the duration of Visit 2 was reduced to less than 2 h. Instructions were clarified, visual supports such as icons were added, two mock practice tasks were introduced before the experimental tasks, and interface settings, including pointer size and contrast, were adjusted to improve task visibility and ease of use for older adults. The revised protocol was subsequently administered to eight participants, including three HYA, four HOA, and one OAWD.
Data processing and synchronization
Facial expression recordings were post-processed using the automated facial-expression analysis module, with data availability defined as the percentage of video frames in which a face was successfully detected and analyzed. Voice recordings were processed using the automated voice-analysis module with speech segments of 1 to 10 s and a segment end delay of 0.25 s. GSR was recorded at 128 Hz, and feasibility was evaluated using the platform-derived percentage of missing signal and signal-to-noise ratio. All acquired data streams and study events were aligned on a common synchronized iMotions timeline. Device timestamps were used when available; otherwise, timing was reconstructed from the sample count and sampling rate. Film presentation intervals were identified using the synchronized StartMedia and EndMedia event markers.
Outcomes
Feasibility was assessed according to the following variables: 1) task completion; 2) participant usability feedback; 3) successful acquisition or completion of the planned measurement modalities; and 4) predefined data-quality outputs for facial expression and GSR. Task completion included completion of the film-viewing, sentence-reading, CoreGRID, spoken-description, Emotion Selection, and movie familiarity tasks required under the protocol version administered to each participant. Heart-rate/PPG and voice recording acquisition were documented descriptively. Heart rate was recorded from the PPG signal as an additional physiological channel. No processing, modality-specific quality threshold, or heart-rate outcome was included in the present feasibility analysis. Formal modality and specific data-quality evaluation were limited to facial expression and GSR outputs produced by the platform. Participant feedback was assessed using the 16-item Post-Study System Usability Questionnaire (PSSUQ)43,44. PSSUQ overall and subscale scores were calculated as the mean of the applicable item scores, using the original 1-to-7 response scale. Lower scores reflect better perceived usability. Successful modality acquisition or completion was determined by whether the planned heart-rate recording, voice recording, spoken-description task, and CoreGRID questionnaire were obtained or completed for each participant. Data quality was assessed using iMotions-derived facial expression and GSR outputs, including percentage of usable facial data, percentage of usable GSR data, GSR signal-to-noise ratio, and percentage of missing GSR signal.
Data analysis
Feasibility data were summarized descriptively. For each feasibility variable, means, standard deviations, and ranges were calculated across the 11 participants. GSR signal quality was interpreted using a 20 dB signal-to-noise ratio cutoff. Recordings with a signal-to-noise ratio ≥ 20 dB were classified as usable. Recordings with a signal-to-noise ratio < 20 dB were classified as suboptimal when a signal was still recorded. Recordings were classified as missing when no usable signal was captured or the sensor failed completely.
Feasibility
Feasibility results are displayed in Table 2. All three participants who completed the initial pilot version and all eight participants who completed the revised protocol completed the tasks required under their respective protocol versions. All 11 participants completed the required CoreGRID and spoken description tasks, voice recordings were obtained during the sentence-reading and active description tasks, and heart-rate recording using PPG was successfully implemented for all participants. Because the initial pilot group with three participants was small and the revisions were made based on qualitative feedback, quantitative feasibility outcomes were not statistically compared between protocol versions. The final protocol was therefore directly tested in eight participants. PSSUQ scores were low across the overall scale and subscales. The overall score and all subscale scores were below published preliminary PSSUQ norms44. This indicates that participants rated the protocol as more usable than the available benchmark values. Automated facial expression data were successfully obtained for all participants. Two participants had data for facial expression below 100%; however, both recordings were deemed analyzable.
| Feasibility/data-quality variable | Result | Standard deviation | Range |
| Completed tasks n/N (%) | 11/11 (100.00) | — | — |
| PSSUQ overall score | 1.54 | 0.49 | 1.00–2.57 |
| PSSUQ System Usefulness score | 1.61 | 0.60 | 1.00–3.00 |
| PSSUQ Information Quality score | 1.38 | 0.51 | 1.00–2.50 |
| PSSUQ Interface Quality score | 1.74 | 0.57 | 1.00–2.67 |
| Usable facial data n/N (%) | 11/11 (99.98) | 0.04 | 99.88–100.00 |
| Successful GSR recording n/N (%) | 11/11 (100.00) | — | — |
| GSR signal-to-noise ratio (dB) | 34.94 | 10.01 | 13.94–47.16 |
| Missing GSR signal (%) | 0.08 | 0.11 | 0.00–0.33 |
| Usable GSR data n/N (%) | 10/11 (90.91) | — | — |
Table 2: Feasibility and data-quality outcomes. Task completion is reported as the number of participants completing all required tasks divided by the number tested. GSR recordings with SNR ≥20 dB were classified as meeting the predefined signal-quality criterion; recordings with SNR <20 dB were classified as suboptimal when a signal remained available. The missing GSR signal was calculated as the number of missing samples divided by the expected number of samples over the analyzed stimulus duration, multiplied by 100. The percentage of frames with facial expression data was defined as the number of video frames in which a face was successfully detected and analyzed, divided by the total number of video frames considered in the post-processed recording, multiplied by 100. This measure reflects the availability of facial expression data rather than the accuracy of the inferred expression. PSSUQ scores range from 1 to 7, with lower scores indicating better perceived usability. Completed tasks included all required film-viewing, sentence-reading, CoreGRID, spoken-description, Emotion Selection, and movie-familiarity tasks under the protocol version administered to each participant. Continuous variables are reported as mean, standard deviation, and range. Categorical feasibility outcomes are reported as n/N (%). Abbreviations: GSR = galvanic skin response; SNR = signal-to-noise ratio; PSSUQ: Post-Study System Usability Questionnaire43,44.
GSR data were successfully recorded for all participants. Most recordings met the predefined signal-quality criterion, with 10 participants showing GSR signal-to-noise ratios above the 20 dB cutoff. One HOA had a GSR signal-to-noise ratio below the cutoff. This recording was classified as suboptimal rather than missing because a GSR signal was still recorded. Missing GSR signals were minimal across participants. Overall, these feasibility outcomes indicate that the protocol produced complete task data, positive usability feedback, and analyzable facial expression and GSR data in the feasibility sample.
Representative outcomes
iMotions Signals
Representative iMotions signal traces from one HOA participant during the Neutral(1) and Joy(b) film conditions are shown in Figure 4. These processed channels are shown as representative visualization outputs generated by the platform and were not used to calculate the feasibility outcomes.
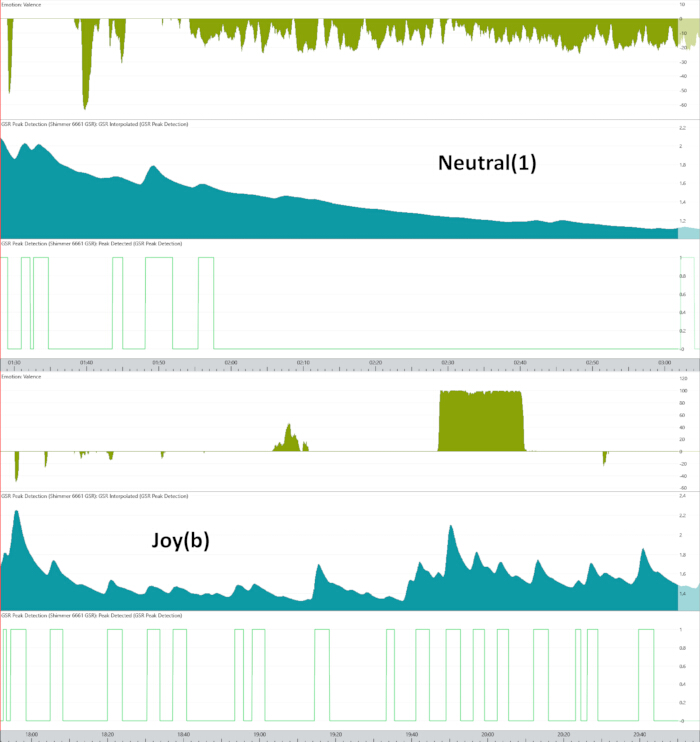
Figure 4: Representative synchronized iMotions signal traces of an HOA participant while watching individual film clips. From top to bottom, the panels display AFFDEX facial valence, interpolated GSR, and GSR peak detection over time. AFFDEX facial valence is reported as a unitless score ranging from −100 to +100, where negative values represent negative affective expression, 0 represents neutral expression, and positive values represent positive affective expression. The interpolated GSR signal is expressed in microsiemens (µS). The GSR peak detection channel is a binary 0/1 signal, with 1 indicating a detected phasic response peak. The x-axis shows the iMotions recording timeline in minutes and seconds. Facial valence is shown in olive green, interpolated GSR in teal, and GSR peak detection in light green. Visualization reproduced with permission from iMotions A/S. Please click here to view a larger version of this figure.
The two examples illustrate the synchronized display of three output streams: automated facial expression valence, interpolated GSR, and GSR peak detection. These representative outputs show how facial and physiological signals can be inspected on the same timeline for individual film clips. During the Neutral(1) clip, the valence signal remained mostly near or below zero. On the other hand, the GSR signal showed an early increase followed by a gradual decline across the clip. The GSR peak-detection channel identified several discrete peaks early in the recording, followed by fewer detected peaks later in the clip. In the Joy(b) clip, the facial valence signal showed a larger positive response later in the clip, including a sustained period of high positive valence. The GSR trace showed multiple phasic changes across the clip, and the peak-detection channel marked repeated GSR peaks.
Δ Voice (Average valence)
A second representative outcome was generated to illustrate how the sentence-reading task can be used to examine emotional vocal change before and after emotional film viewing. For this example, data from the same HOA participant were used. Average vocal valence for each pre- and post-clip sentence-reading sample was calculated by audEERING within iMotions. Average vocal valence for each pre- and post-clip sentence-reading sample was generated by the automated voice analysis module. Vocal valence is represented on a continuous scale from −1 to +1, with lower values representing more negative vocal expression and higher values representing more positive vocal expression. Average Valence output was derived from the iMotions without further transformation before calculating Δ Voice Average Valence.
Δ Voice Average Valence = post-clip average vocal valence − pre-clip average vocal valence (1)
Positive Δ values indicate an increase in vocal valence from pre- to post-clip, whereas negative Δ values indicate a decrease in vocal valence. The examples in Figure 5 included one Sad clip and one Joy clip from the same HOA participant. Facial valence and Δ Voice Average Valence are displayed separately using their original values because the two measures have different scales.
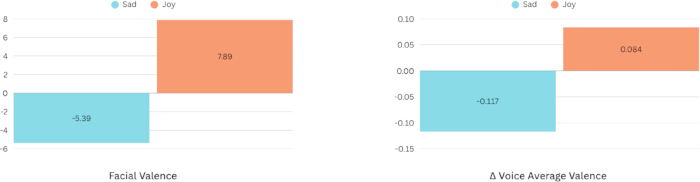
Figure 5: Representative facial valence and Δ Voice Average Valence outputs for Sad and Joy clips in one HOA participant. Facial valence is reported as a dimensionless score ranging from −100 to +100, where negative values indicate negative affective expression, 0 indicates neutral expression, and positive values indicate positive affective expression. Δ Voice Average Valence was calculated as post-clip average vocal valence minus pre-clip average vocal valence. Average vocal valence is reported on a scale from −1 to +1, with lower values representing more negative vocal expression and higher values representing more positive vocal expression. Positive Δ values indicate an increase in vocal valence from pre- to post-clip, whereas negative Δ values indicate a decrease. Facial valence and Δ Voice Average Valence are displayed separately using their original scales. Please click here to view a larger version of this figure.
Figure 5 provides an illustrative presentation of facial valence and Δ Voice Average Valence for the Sad and Joy clips in one HOA participant. In this example, both measures were negative for the Sad clip and positive for the Joy clip. Because this example is based on one participant and two emotional conditions, it is intended only to illustrate the types of outputs the protocol can generate and should not be interpreted as evidence of agreement between modalities.
Supplementary File 1: Study Flow 1 configuration and task screens. This file shows the eight blocks of the Study Flow 1 configuration used for passive viewing and representative task screens. It includes the welcome screen, sentence-reading screens, film viewing instructions, no sound notification, film clip presentation screen, and post-clip question instructions. Screenshots reproduced with permission from iMotions A/S. Please click here to download this file.
Supplementary File 2: Study Flow 2 configuration and task screens. This file shows the eight blocks of the Study Flow 2 configuration used for active engagement and representative task screens. It includes the welcome screen, active description instruction, no sound notification, film clip presentation screen, Emotion Selection task, and movie familiarity question. Screenshots reproduced with permission from iMotions A/S. Please click here to download this file.
Supplementary Table 1: Film clip sequence, validation sources, and emotion categories. This table lists the eight film clips in presentation order, the source or validation study for each clip, and the assigned emotion category block. The film excerpts were obtained directly from the authors of the corresponding validation studies for research use upon request. Researchers wishing to use the same excerpts may contact the first authors of the cited source studies to request access. If an exact excerpt cannot be obtained, researchers may substitute a film excerpt that has been independently validated to elicit the same target emotion and is comparable in duration and audiovisual characteristics. Please click here to download this file.
דיון
This method article describes a laboratory-based protocol for multimodal assessment of emotional responses in different age groups and individuals diagnosed with dementia. The protocol was designed to operationalize several components of the CPM, including expression, physiology, appraisal, motivation, and feeling4,13,14,15,16,17. The feasibility results provide preliminary support for implementing this protocol in the tested sample: all participants completed the experimental tasks, usability ratings were positive, and facial expression and GSR data were successfully obtained for all participants. Also, all participants completed the required CoreGRID and spoken-description tasks. Voice recordings were obtained from all participants during the sentence-reading and active-description tasks, and heart rate was recorded using PPG as an additional physiological channel. No predefined modality-specific quality criterion was applied to the heart rate, voice, linguistic, or CoreGRID data in the present feasibility analysis. The linguistic, sentiment, and appraisal content of the spoken descriptions was not analyzed in the present study. Accordingly, these findings provide preliminary support for the administration of the protocol in the tested sample, which included one OAWD due to probable Alzheimer’s disease. The outputs represent what successful data collection may look like for GSR and facial expression analysis after applying the protocol. The synchronized iMotions traces show that facial expression valence, interpolated GSR, and GSR peak detection can be inspected on the same timeline. These examples illustrate the type of time-varying facial and physiological outputs generated by the protocol. The ΔVoice Average Valence example illustrates one possible output of the sentence-reading task. In one HOA participant, vocal and facial valence were both negative for the Sad clip and positive for the Joy clip. Because this example included only one participant and two emotional conditions, no conclusion regarding agreement between the modalities can be drawn.
This initial pilot study is important because the protocol included several tasks and data streams, which may be demanding for HOA and OAWD groups. The results of the pilot study led to changes in task instructions, the inclusion of a short mock test, and adjustments to the session duration. The mock test helped familiarize all participants with the procedure before the actual task. These modifications were intended to reduce participant burden and improve task clarity. Because the two protocol versions were implemented sequentially as part of an iterative pilot process and the initial group included only three participants, quantitative outcomes were not formally compared between versions. Several steps are critical for successful implementation, including careful adherence to the procedure, control of the laboratory environment, and screening for sensory, cognitive, language, and psychological distress factors.
First, the stimulus sequence must be prepared carefully so that neutral and emotional clips are presented in the intended order and so that sentence-reading, CoreGRID, active description, and emotion-selection tasks appear at the correct points in the study flow. Validated film clips are important because emotion induction based on viewing of a feature film is effective, but the use of standardized and validated clips strengthens reproducibility and helps align the task with the intended emotion categories16,20,21,22. In addition, neutral clips are critical as they provide a comparison condition for interpreting responses to emotional clips. In the representative Neutral(1) trace shown in Figure 4, GSR peaks were mainly observed near the beginning of the clip, with considerably fewer peaks later in the recording. The representative Neutral trace illustrates physiological activity during one Neutral clip and is presented as an example rather than evidence that participants returned to a physiological baseline across the sample. The film clips were presented in a fixed order and were repeated in the same order during Study Flow 2; therefore, order, carryover, familiarity, and habituation effects cannot be excluded. However, Study Flow 2 was not intended to independently replicate the emotional responses evoked during Study Flow 1, but rather to gather verbal descriptions for further language, sentiment, and appraisal-related analyses. Future studies focused on comparing emotional responses across repeated presentations should consider counterbalancing or randomizing stimulus order. Second, the laboratory environment must be controlled before each session. Stable lighting, temperature, humidity, consistent monitor settings, comfortable audio volume, consistent time of day, and adequate room conditions are important for minimizing variability across participants and improving the quality of facial, physiological, and audio recordings. Lighting may be particularly important when testing OAWD since environmental light has been associated with agitation in people living with dementia45. Third, participant positioning and sensor placement are essential. The participant’s face must remain visible to the camera, the microphone must capture clear speech, and the GSR sensors must maintain stable contact with the skin while the participant minimizes movement of the sensor hand. A stable chair without wheels and with armrests helps reduce participant movement and support stable sensor contact.
This feasibility study identified practical modifications and troubleshooting points. The GSR finding suggests the importance of documenting possible artifact sources. One participant had rings on the hand used for GSR recording, and the rings could not be removed during the session. This likely reduced sensor contact quality and/or contributed to movement artifact. As noted in the protocol, participants should be instructed before the test day to avoid hand lotion, oil, or cream and to remove rings or other hand accessories when possible. Instructing and supporting participants before and during the testing sessions are important for multimodal data-quality reporting because such support helps to prevent suboptimal but interpretable recordings from being treated the same way as complete sensor failure. Similarly, the two participants with facial usable data below 100% still had analyzable recordings. It shows that minor reductions in automated facial tracking do not necessarily invalidate the recording.
This protocol has several limitations. One HOA was intentionally recruited because of the participant's extensive professional experience in clinical psychology and neuropsychology. Therefore, the behavioral and physiological data from this participant may not be fully representative of a typical HOA, although their informed qualitative feedback was valuable for refining the protocol. First, the sample size was small and included only one older adult with dementia due to Alzheimer’s disease; as such, the findings should not be interpreted as evidence that the protocol is suitable for all forms of dementia or stages of severity. Future research should assess the protocol's viability across a variety of dementia subtypes and severity levels, such as frontotemporal dementia, which has been linked to inconsistencies between self-reported emotional reactivity and facial expression11. The current study did not assess feasibility in those with severe dementia. Another potential limitation is that the controlled laboratory setting, while supporting the quality of the data obtained, may limit applicability in less controlled environments, such as clinics, homes, or long-term care settings. A third potential limitation is that the protocol depends on multiple devices, software modules, and synchronized data streams, which increases the technical demands for implementation. Automated facial expression, voice, and physiological measures require careful reporting of software settings, sampling rates, preprocessing decisions, and data-quality thresholds. Lastly, the Δ Voice Average Valence output is exploratory and requires validation with more participants and comparison with other valid measures. In order to demonstrate convergent validity, future research should investigate if the magnitude and direction of Δ Voice Average Valence are related to face valence during the movie clip, participant ratings on the Feeling component of CoreGRID, and the emotion chosen by participants following each film clip (i.e., negative or positive emotions).
Despite these limitations, this protocol offers a positive, reproducible workflow for assessing emotion as a multidimensional process rather than as a single self-reported measure. This is relevant for aging and dementia research, where emotional responses may differ across subjective, expressive, physiological, vocal, and linguistic channels10,11,12,26,27,28,29. To conclude, this protocol has great potential for studying emotional experience, affective communication, dementia care, human-computer interaction, and multimodal biomarker development.
גילויים
The authors declare no conflicts of interest.
תודות
The authors thank all participants for their time and contribution to this study. S. Shafiyan acknowledges funding from the EPIC-AT Health Research Training Platform Fellowship, hosted at the University of Toronto and powered by AGE-WELL. The Health Research Training Platform is funded by the Canadian Institutes of Health Research.
חומרים
| שם | חברה | מספר קטלוג | הערות |
|---|---|---|---|
| AC40 audiometer | Interacoustics A/S | https://www.interacoustics.com/audiometers/ac40 | Hearing screening |
| Affectiva AFFDEX module | iMotions A/S / Affectiva | https://imotions.com/products/imotions-lab/modules/ | Facial-expression analysis module integrated in iMotions; uses Affectiva AFFDEX for automated facial coding and valence/expression outputs. |
| ASUS ProArt PA278CV monitor | ASUSTeK Computer Inc. | PA278CV | 27-inch participant-facing monitor; native resolution 2560 × 1440; used for presentation of film stimuli and task instructions. |
| audEERING voice-analysis module | iMotions A/S / audEERING GmbH | https://imotions.com/products/imotions-lab/modules/ | Voice-analysis module integrated in iMotions and powered by audEERING technology; used for emotion, prosody, and speaker-attribute analysis. |
| CoreGRID questionnaire | Published instrument | https://doi.org/10.3389/fcomp.2022.773256 | The 22-item subset of the 32 CoreGRID items was used, retaining only items from the Appraisal, Motivation, and Feeling components of the Component Process Model. |
| Dementia Severity Rating Scale (DSRS) | Published instrument | https://doi.org/10.1097/00002093-199601010-00006 | Dementia severity |
| Extech EA30 light meter | Extech Instruments | https://www.extech.com/products/ea30/ | EasyView Wide Range Light Meter; measures illumination in lux and was used to verify room lighting at face level. |
| Freiburg Visual Acuity Test (FrACT), version 10.3.5 | Freiburg Vision Test / Michael Bach | https://michaelbach.de/fract/ | Visual acuity screening using Sloan Letters and Tumbling E optotypes. |
| Functional Activities Questionnaire (FAQ) | Published instrument | https://doi.org/10.1093/geronj/37.3.323 | Functional assessment |
| iMotions Lab | iMotions A/S | https://imotions.com/products/imotions-lab/ | Version 11.1.44638.4; used for stimulus presentation, synchronization, multimodal data collection, and analysis |
| Kessler Psychological Distress Scale (K10) | Published instrument | https://doi.org/10.1111/j.1467-842X.2001.tb00310.x | Psychological distress screening |
| MAONO AU-UL10 USB lavalier microphone | Shenzhen Maono Technology Co., Ltd. | AU-UL10 | USB lavalier microphone used for participant voice recording |
| Montreal Cognitive Assessment (MoCA) | MoCA Cognition | https://mocacognition.com/ | Cognitive screening |
| Post-Study System Usability Questionnaire (PSSUQ) | Published instrument | https://doi.org/10.1080/10447318.2002.9669130 | The 16-item version was used for feasibility/usability evaluation |
| Quick Aphasia Battery (QAB) | Published instrument | https://aphasialab.org/qab/ | Language screening |
| Shimmer3R GSR+ Unit | Shimmer Research Ltd. | https://www.shimmersensing.com/product/shimmer3-gsr-unit/ | Wearable sensor used to record galvanic skin response/electrodermal activity. The GSR+ unit supports an optical PPG ear-clip sensor, placed on the earlobe, to acquire a photoplethysmography signal for heart-rate estimation. |
| VisionTek VTWC20 webcam | VisionTek Products, LLC | 901380 | Full-HD webcam; 1920 × 1080 video at 30 frames/s; used for participant facial-video recording. |
מקורות
- Robbins SP, Judge TA. Emotions and moods. In: Robbins SP, Judge TA. Organizational behavior. 12th ed. Upper Saddle River (NJ): Pearson/Prentice Hall; 2007. p. 258-97.
- Ortony A, Clore GL, Foss MA. The referential structure of the affective lexicon. Cogn Sci. 1987;11(3):341-64.
- Fox E. Perspectives from affective science on understanding the nature of emotion. Brain Neurosci Adv. 2018;2:2398212818812628.
- Scherer KR. Emotions are emergent processes: they require a dynamic computational architecture. Philos Trans R Soc Lond B Biol Sci. 2009;364(1535):3459-74.
- Harley JM. Measuring emotions: a survey of cutting-edge methodologies used in computer-based learning environment research. In: Tettegah SY, Gartmeier M, editors. Emotions, technology, design, and learning. Boston (MA): Academic Press; 2016. p. 89-114.
- Ciuk DJ, Troy AS, Jones MC. Measuring emotion: self-reports vs. physiological indicators [conference paper]. Presented at: 2015 Annual Meeting of the Midwest Political Science Association; Chicago, IL; 2015. Available from: https://ssrn.com/abstract=2595359.
- Coppin G, Sander D. Theoretical approaches to emotion and its measurement. In: Meiselman HL, editor. Emotion measurement. 2nd ed. Oxford: Woodhead Publishing; 2021. p. 3-37.
- Sharma R, Udmale SS, Pandey AK, Singh RS. Characteristics of IoT health data. In: Singh SK, et al., editors. IoT-based data analytics for the healthcare industry: techniques and applications. Amsterdam: Elsevier; 2021. p. 31-46.
- Halder A, Konar A, Chakraborty A, Nagar AK. Emotion recognition from facial expressions using type-2 fuzzy sets. In: Konar A, Chakraborty A, editors. Emotion recognition: a pattern analysis approach. Hoboken (NJ): John Wiley & Sons; 2015. p. 147-82.
- Heilman KM, Nadeau SE. Emotional and neuropsychiatric disorders associated with Alzheimer's disease. Neurotherapeutics. 2022;19(1):99-116.
- Pressman PS et al. Incongruences between facial expression and self-reported emotional reactivity in frontotemporal dementia and related disorders. J Neuropsychiatry Clin Neurosci. 2023;35(2):192-201.
- Levenson RW, Carstensen LL, Friesen WV, Ekman P. Emotion, physiology, and expression in old age. Psychol Aging. 1991;6(1):28-35.
- Scherer KR. What are emotions? And how can they be measured? Soc Sci Inf. 2005;44(4):695-729.
- Scherer KR, Schorr A, Johnstone T, editors. Appraisal processes in emotion: theory, methods, research. New York: Oxford University Press; 2001.
- Scherer KR. The dynamic architecture of emotion: evidence for the component process model. Cogn Emot. 2009;23(7):1307-51.
- Menétrey MQ, Mohammadi G, Leitão J, Vuilleumier P. Emotion recognition in a multi-componential framework: the role of physiology. Front Comput Sci. 2022;4:773256.
- Fontaine JR, Scherer KR, Roesch EB, Ellsworth PC. The world of emotions is not two-dimensional. Psychol Sci. 2007;18(12):1050-7.
- Kahn JH, Tobin RM, Massey AE, Anderson JA. Measuring emotional expression with the Linguistic Inquiry and Word Count. Am J Psychol. 2007;120(2):263-86.
- Shafiyan S, Izanloo A, Yazdi AA. Using the Structure of Evaluative Components as a basis for comparing the oral narratives of schizophrenics and healthy individuals. J Psycholinguist Res. 2022;51(3):655-77.
- Westermann R, Spies K, Stahl G, Hesse FW. Relative effectiveness and validity of mood induction procedures: a meta‐analysis. Eur J Soc Psychol. 1996;26(4):557-80.
- Hewig J et al. A revised film set for the induction of basic emotions. Cogn Emot. 2005;19(7):1095-1109.
- Mohammadi G, Lin K, Vuilleumier P. Towards understanding emotional experience in a componential framework [conference paper]. Presented at: 2019 8th International Conference on Affective Computing and Intelligent Interaction; Cambridge, United Kingdom; 2019. p. 123-9. Available from: https://ieeexplore.ieee.org/document/8925491.
- Sadock BJ, Sadock VA, Ruiz P. Kaplan & Sadock’s synopsis of psychiatry: behavioral sciences/clinical psychiatry. 11th ed. Philadelphia: Wolters Kluwer; 2015.
- Mahendra N, Hickey EM, Bourgeois MS. Cognitive-communicative characteristics: profiling types of dementia. In: Hickey EM, Bourgeois MS, editors. Dementia: person-centered assessment and intervention. 2nd ed. New York: Routledge; 2018. p. 42-80.
- Canadian Dementia Priority Setting Partnership. Canadian dementia research priorities: report of the Canadian Dementia Priority Setting Partnership. Alzheimer Society of Canada; 2017. Available from: https://alzheimer.ca/en/research/10-priorities-dementia-research-canada.
- Madsø KG, Flo-Groeneboom E, Pachana NA, Nordhus IH. Assessing momentary well-being in people living with dementia: a systematic review of observational instruments. Front Psychol. 2021;12:742510.
- Charles ST, Carstensen LL. Social and emotional aging. Annu Rev Psychol. 2010;61:383-409.
- Fernández-Aguilar L et al. Differences between young and older adults in physiological and subjective responses to emotion induction using films. Sci Rep. 2020;10(1):14548.
- Tsai JL, Levenson RW, Carstensen LL. Autonomic, subjective, and expressive responses to emotional films in older and younger Chinese Americans and European Americans. Psychol Aging. 2000;15(4):684-93.
- Bach M. The Freiburg Visual Acuity test: automatic measurement of visual acuity. Optom Vis Sci. 1996;73(1):49-53.
- World Health Organization. Visual disturbances and blindness (H53-H54). In: International statistical classification of diseases and related health problems 10th revision: ICD-10 version 2019. Geneva: World Health Organization; 2019. Available from: https://icd.who.int/browse10/2019/en#/H53-H54
- Feltner C et al. Screening for hearing loss in older adults: updated evidence report and systematic review for the US Preventive Services Task Force. JAMA. 2021;325(12):1202-15.
- Nasreddine ZS et al. The Montreal Cognitive Assessment, MoCA: a brief screening tool for mild cognitive impairment. J Am Geriatr Soc. 2005;53(4):695-9.
- Carson N, Leach L, Murphy KJ. A re‐examination of Montreal Cognitive Assessment (MoCA) cutoff scores. Int J Geriatr Psychiatry. 2018;33(2):379-88.
- Pan IM et al. Staging of dementia severity with the Hong Kong version of the Montreal Cognitive Assessment (HK-MoCA)’s. Alzheimer Dis Assoc Disord. 2020;34(4):333-8.
- Clark CM, Ewbank DC. Performance of the dementia severity rating scale: a caregiver questionnaire for rating severity in Alzheimer disease. Alzheimer Dis Assoc Disord. 1996;10(1):31-9.
- Pfeffer RI et al. Measurement of functional activities in older adults in the community. J Gerontol. 1982;37(3):323-9.
- Teng E et al. Utility of the functional activities questionnaire for distinguishing mild cognitive impairment from very mild Alzheimer's disease. Alzheimer Dis Assoc Disord. 2010;24(4):348-53.
- Wilson SM, Eriksson DK, Schneck SM, Lucanie JM. A quick aphasia battery for efficient, reliable, and multidimensional assessment of language function. PLOS ONE. 2018;13(2):e0192773.
- Kessler RC et al. Screening for serious mental illness in the general population. Arch Gen Psychiatry. 2003;60(2):184-9.
- Andrews G, Slade T. Interpreting scores on the Kessler psychological distress scale (K10). Aust N Z J Public Health. 2001;25(6):494-7.
- Ben-David BM, van Lieshout PH, Leszcz T. A resource of validated affective and neutral sentences to assess identification of emotion in spoken language after a brain injury. Brain Inj. 2011;25(2):206-20.
- Lewis JR. IBM computer usability satisfaction questionnaires: psychometric evaluation and instructions for use. Int J Hum Comput Interact. 1995;7(1):57-78.
- Lewis JR. Psychometric evaluation of the PSSUQ using data from five years of usability studies. Int J Hum Comput Interact. 2002;14(3-4):463-88.
- Bafaloukou M et al. An interpretable machine learning tool for in-home monitoring of agitation episodes in people living with dementia: a proof-of-concept study. EClinicalMedicine. 2025;80:103032.
הדפסות חוזרות והרשאות
מאמר זה פורסם
הסרטון יגיע בקרוב