This meta-analysis maps replicated, adjusted-consistent, heterogeneous, sparse, and exploratory associations with coronary slow flow/no-reflow after primary percutaneous coronary intervention for ST-segment elevation myocardial infarction.
מאמר מחקר
Slow Flow/No-Reflow After Primary Percutaneous Coronary Intervention in ST-Segment Elevation Myocardial Infarction: A Meta-Analysis
במאמר זה
סיכום
תקציר
Coronary slow flow/no-reflow after primary percutaneous coronary intervention (PCI) limits myocardial reperfusion in ST-segment elevation myocardial infarction (STEMI). Clinical, laboratory, angiographic, and procedural associations were synthesized while separating crude primary analyses from adjusted-only sensitivity analyses. Seven databases were searched from inception through May 31, 2026. Random-effects models used restricted maximum likelihood estimation and Hartung-Knapp confidence intervals; 95% prediction intervals were reported when at least three studies contributed. Forty-three observational studies included 27,405 patients, including 5,631 with slow flow/no-reflow. Crude pooled averages supported associations for diabetes mellitus, Killip class II or higher/acute heart failure, advanced Killip class, impaired baseline Thrombolysis in Myocardial Infarction flow, high thrombus burden, longer stent length, thrombus aspiration, and direct stenting, although several prediction intervals included the null. Adjusted-only analyses were consistent for age, hypertension, diabetes, Killip class II or higher/acute heart failure, and high thrombus burden. Outcome-definition and eligibility sensitivity analyses did not eliminate important uncertainty. Domain-based risk-of-bias judgments were predominantly some concerns or high concern, and Grading of Recommendations Assessment, Development and Evaluation certainty was low or very low. The review, therefore, provides a cross-domain evidence map rather than a causal catalog or bedside prediction score.
מבוא
ST-segment elevation myocardial infarction (STEMI) is a time-critical acute coronary syndrome for which primary percutaneous coronary intervention (PCI) is the preferred reperfusion strategy when it can be delivered promptly1,2. Restoration of epicardial patency, however, does not ensure adequate tissue perfusion. Coronary slow flow/no-reflow (SF/NR) describes impaired antegrade coronary flow or myocardial perfusion after treatment of the culprit lesion when residual stenosis, dissection, spasm, or another mechanical obstruction does not explain the finding. SF/NR is associated with larger infarction, impaired ventricular recovery, heart failure, arrhythmia, and adverse longer-term outcomes3,4,5,6.
The phenotype is defined variably. Many studies use final Thrombolysis in Myocardial Infarction (TIMI) flow below grade 3 or at grade 2 or lower, whereas others incorporate myocardial blush grade (MBG), TIMI myocardial perfusion grade (TMPG), corrected TIMI frame count (cTFC), or parallel angiographic criteria. These measures capture related but not identical aspects of reperfusion. The biological substrate is likewise heterogeneous and may include distal embolization, ischemic endothelial injury, reperfusion injury, platelet-leukocyte plugging, vasoconstriction, edema, and pre-existing microvascular dysfunction3,6.
Previous work has established individual clinical and angiographic correlates, developed risk scores, and evaluated selected biomarkers or prediction models7,8. These studies are informative but do not by themselves distinguish associations supported across multiple domains from findings that remain dependent on adjustment set, outcome definition, selected subgroup, threshold, or assay. A broad synthesis is also vulnerable to inappropriate pooling if non-commensurate scales or adjusted and unadjusted estimates are combined.
A systematic review and meta-analysis were therefore conducted, framed as a cross-domain evidence map. The objectives were to identify repeatedly supported associations, examine whether comparable adjusted estimates were consistent with crude primary findings, evaluate sensitivity to angiographic outcome definition and an eligibility boundary, separate non-commensurate or sparse evidence from headline quantitative findings, and grade risk of bias and certainty. The review was not intended to infer treatment effects, establish causality, or produce coefficients for a bedside score.
פרוטוקול
Review framework and registration
The review followed Preferred Reporting Items for Systematic Reviews and Meta-Analyses (PRISMA) 2020 and Meta-analysis Of Observational Studies in Epidemiology (MOOSE) guidance9,10. The review question concerned adult patients with STEMI undergoing primary PCI and study-level factors associated with angiographic SF/NR. This review was not prospectively registered. Analytical decisions and source-level effect selection are documented in the reproducibility materials and treated as post hoc, as the review was not prospectively registered.
Information sources and search strategy
A systematic literature search was conducted in PubMed, Embase, Web of Science Core Collection, the Cochrane Library, China National Knowledge Infrastructure (CNKI), Wanfang Data, and the VIP Chinese Science and Technology Journal Database (VIP) from database inception through May 31, 2026. Search strategies combined controlled vocabulary, where available, and free-text terms representing three core concepts: ST-segment elevation myocardial infarction, percutaneous coronary intervention, and coronary slow flow/no-reflow. No predictor- or biomarker-specific search block was imposed, in order to maintain sensitivity for eligible observational studies reporting extractable associations. The complete database-specific search strategies are provided in Supplementary Table 1. Reference lists of eligible reports and relevant reviews were also examined.
Eligibility and study selection
Eligible reports were cohort, case-control, or cross-sectional studies of adults with acute STEMI treated with primary PCI. Studies had to assess angiographic SF/NR during or after PCI and report an association estimate or group-level data sufficient to derive one. Studies restricted to non-ST-elevation acute coronary syndromes, elective PCI, rescue PCI without separable primary-PCI data, noncoronary interventions, animal or in vitro experiments, reviews, editorials, case reports, and reports without usable outcome data were excluded. Two reviewers independently screened records and full texts, with disagreements resolved by discussion and adjudication.
The final eligibility assessment included 43 studies. One report that combined STEMI and non-ST-elevation myocardial infarction without separable STEMI-specific estimates was excluded. One boundary-case study in which PCI occurred 2-7 days after symptom onset was retained in the primary dataset and excluded in sensitivity analyses. For the Qu and Guan (2024) cohort, only the final published full report was used. Multiple reports from the same cohort were examined to avoid duplicate participants within an analysis.
Outcome definitions
Study definitions were coded as TIMI-based, combined TIMI plus MBG/TMPG, MBG/TMPG-based, cTFC-based, or parallel definitions. These definitions were not assumed to represent identical reperfusion phenotypes. Primary syntheses required compatible exposure and effect definitions, and definition-restricted sensitivity analyses were performed for factors with sufficient TIMI-based studies.
Data extraction and effect-source hierarchy
One reviewer extracted study design, population, sample size, event count, outcome definition, exposure definition, unit or threshold, effect estimate, and adjustment set; a second reviewer verified each field against the source. Primary binary syntheses used crude or unadjusted study-level associations reconstructed from outcome-group 2 × 2 data or equivalent unadjusted results when available. Adjusted estimates were not combined with crude estimates. Separate adjusted-only sensitivity analyses were conducted when at least three studies reported comparable multivariable estimates. The complete study-level extraction and analysis dataset is provided in Supplementary File 1.
When a report presented multiple adjusted models, the model designated by the authors as primary or fully adjusted was selected. If parallel models represented alternative correlated exposures, the model containing the prespecified exposure of interest was selected. Models were never chosen according to statistical significance or effect magnitude. Published odds ratios with internally contradictory direction or reference coding were not silently inverted; unresolved estimates were excluded from pooling and listed with reasons in the supplementary effect-source documentation.
Effect harmonization and sparse evidence
Odds ratios (ORs) with 95% confidence intervals (CIs) were used for compatible binary or regression associations, and mean differences (MDs) were used for continuous between-group differences expressed in the same unit. Per-unit effects were not pooled with categorical contrasts, and risk ratios and hazard ratios were not treated as ORs. Biomarkers, thresholds, assays, or scales judged noncommensurate were reported study-specifically. Evidence based on fewer than three compatible studies was descriptive or exploratory and was not treated as a headline pooled result.
Risk of bias and certainty of evidence
Two reviewers applied a modified Newcastle-Ottawa domain-based assessment. The original Newcastle-Ottawa Scale domains of selection, comparability/confounding, and outcome ascertainment were retained; missing data and selective analysis/reporting were recorded as explicit additional domains to avoid reliance on a single summary score11,12. Domain judgments were assigned using a prespecified worst-domain rule: low concern required low concern across all domains; high concern was assigned when any domain was judged high concern; all remaining profiles were classified as some concerns. These review-specific judgment categories were used transparently for this synthesis and were not treated as a separately validated instrument. Numerical Newcastle-Ottawa Scale totals were not used as evidence-certainty labels. The certainty of evidence for important associations was evaluated using Grading of Recommendations Assessment, Development and Evaluation (GRADE), considering risk of bias, inconsistency, indirectness, imprecision, and other concerns13.
Statistical analysis
Compatible estimates were synthesized with inverse-variance random-effects models using restricted maximum likelihood (REML) estimation14. Hartung-Knapp adjustments were used for confidence intervals15. Heterogeneity was summarized with tau squared and I2. A 95% prediction interval (PI) was reported for analyses with at least three contributing studies. Outcome-definition sensitivity analyses restricted evidence to TIMI-based definitions; adjusted-only analyses were separated from crude primary analyses; and eligibility sensitivity analyses excluded the boundary-case delayed-PCI study. Leave-one-out analyses were used where appropriate. Detailed sensitivity analyses are provided in Supplementary Table 2. Funnel plots and Egger regression were limited to analyses with at least 10 compatible estimates; absence of an asymmetry signal was not interpreted as absence of publication bias. Analyses were conducted in R using the metafor package (Research Resource Identifier (RRID): SCR_003450), and all tables and figures were generated from the final analysis datasets. The complete statistical-analysis and figure-generation code is provided in Supplementary File 2. Software and resources used in the review are listed in the Table of Materials. The number of contributing studies is denoted by k.
תוצאות
Study selection and characteristics
The searches identified 1,278 records. After removal of 853 duplicates, 425 records underwent title and abstract screening; 311 were excluded. Full texts were obtained for 114 reports, of which 71 were excluded, leaving 43 studies in the final review (Figure 1)16,17,18,
19,20,21,22,23,24,25,26,27,28,29,30,31,32,33,34,35,36,37,38,39,40,41,42,43,44,45,46,47,48,49,50,51,52,
53,54,55,56,57,58. The studies included 27,405 patients, including 5,631 with SF/NR and 21,774 with normal flow. Twenty-eight studies were retrospective, 10 prospective, and five cross-sectional. Twenty-two studies were conducted in China and nine in Turkey; the remainder were distributed across Egypt, Denmark, India, Iran, Japan, Mexico, Pakistan, and a United Kingdom/Egypt cohort (Table 1).
Outcome definitions included TIMI-based criteria, combined TIMI and MBG/TMPG criteria, and other angiographic definitions (Table 2). In the domain-based risk-of-bias assessment, 25 studies had some concerns overall and 18 had high concern overall; no study was assigned an overall low-concern judgment (Supplementary Table 3).
Clinical associations
Patients with SF/NR were older on average: MD 3.16 (95% CI 2.19-4.13; I2 = 77.8%; 95% PI -1.07-7.39; k = 24). Diabetes mellitus showed a positive crude pooled average: OR 1.25 (95% CI 1.02-1.53; I2 = 74.2%; 95% PI 0.53-2.97; k = 30). Killip class II or higher/acute heart failure was associated with SF/NR: OR 1.88 (95% CI 1.38-2.55; I2 = 58.3%; 95% PI 0.97-3.63; k = 11). Advanced Killip class III or IV also showed an association: OR 2.37 (95% CI 1.83-3.07; I2 = 0.0%; 95% PI 1.83-3.07; k = 5). Male sex, smoking, dyslipidemia/hyperlipidemia, and previous myocardial infarction did not show consistent crude pooled associations (Figure 2; Table 3).
Adjusted-only analyses were positive for age, per 1-year increase (OR 1.03 (95% CI 1.00-1.06; I2 = 42.5%; 95% PI 1.003-1.059; k = 4)), hypertension (OR 1.69 (95% CI 1.25-2.28; I2 = 0.0%; 95% PI 1.25-2.28; k = 3)), diabetes mellitus (OR 2.07 (95% CI 1.73-2.47; I2 = 0.0%; 95% PI 1.73-2.47; k = 4)), and Killip class II or higher/acute heart failure (OR 1.76 (95% CI 1.15-2.72; I2 = 0.0%; 95% PI 1.12-2.77; k = 4)). These adjusted estimates were analyzed separately from crude effects (Table 4).
Laboratory associations
Laboratory evidence was more fragmented than clinical and angiographic evidence. Comparable adjusted evidence for estimated glomerular filtration rate and C-reactive protein/high-sensitivity C-reactive protein was sparse and imprecise. D-dimer, hemoglobin, low-density lipoprotein cholesterol, fibrinogen-to-albumin ratio, and triglyceride-glucose/insulin-resistance measures differed in unit, threshold, assay, or population and were reported as study-specific or exploratory findings rather than forced into commensurate pools (Supplementary Table 4).
Angiographic and procedural associations
High thrombus burden showed a positive crude pooled average: OR 1.93 (95% CI 1.45-2.58; I2 = 63.1%; 95% PI 0.92-4.07; k = 10). Impaired baseline TIMI flow was also associated with SF/NR: OR 2.73 (95% CI 1.24-5.99; I2 = 80.0%; 95% PI 0.46-16.03; k = 8). Stent length was greater in the SF/NR group: MD 3.42 (95% CI 1.39-5.44; I2 = 33.8%; 95% PI 0.28-6.56; k = 4). The adjusted-only high-thrombus-burden analysis was consistent: OR 2.38 (95% CI 1.71-3.31; I2 = 0.0%; 95% PI 1.71-3.31; k = 4). The adjusted per-point SYNTAX-score association was imprecise: OR 1.06 (95% CI 0.95-1.19; I2 = 60.8%; 95% PI 0.89-1.28; k = 3) (Figure 3; Table 3,4).
Thrombus aspiration showed an observational association: OR 1.78 (95% CI 1.05-3.01; I2 = 85.1%; 95% PI 0.39-8.19; k = 9). Direct stenting showed an inverse observational association: OR 0.55 (95% CI 0.32-0.95; I2 = 0.0%; 95% PI 0.32-0.95; k = 3).
Sensitivity analyses
TIMI-only analyses produced an age MD of 3.12 years (95% CI 1.87-4.38; I2 = 79.2%; 95% PI -1.76-8.00; k = 18), a hypertension OR of 1.28 (95% CI 1.12-1.45; I2 = 38.2%; 95% PI 0.88-1.84; k = 22), and a diabetes OR of 1.32 (95% CI 1.07-1.63; I2 = 68.6%; 95% PI 0.61-2.85; k = 24).
Excluding the boundary-case delayed-PCI study produced an age MD of 3.16 years (95% CI 2.15-4.16; I2 = 78.7%; 95% PI -1.14-7.46; k = 23) and a Killip class II or higher/acute heart failure OR of 1.78 (95% CI 1.39-2.28; I2 = 46.5%; 95% PI 1.06-3.00; k = 10). Other eligibility sensitivity results are reported in Supplementary Table 2. Study-level age sensitivity, adjusted-only sensitivity analyses, and the summary of domain-based risk-of-bias judgments are presented in Supplementary Figures 1-3, respectively.
Small-study effects and certainty
Egger regression was performed only for analyses with at least 10 studies. Asymmetry signals were detected for hypertension, diabetes mellitus, and smoking; no asymmetry signal was detected for age, male sex, Killip class II or higher/acute heart failure, or high thrombus burden. These tests did not establish presence or absence of publication bias. GRADE certainty was low for diabetes, advanced Killip class, and high thrombus burden and very low for the other evaluated associations (Supplementary Table 5). Domain-level risk-of-bias judgments are summarized in Figure 4. Small-study-effect assessments are detailed in Supplementary Table 6.
DATA AVAILABILITY:
All analyses used aggregate data extracted from published reports. Supplementary File 1 contains the complete study-level extraction and analysis dataset, including effect-source documentation, eligibility information, risk-of-bias judgments, and GRADE inputs. Supplementary File 2 contains the complete R code used for data preparation, primary and sensitivity meta-analyses, risk-of-bias and GRADE summaries, table generation, figure generation, and reproducibility checks.
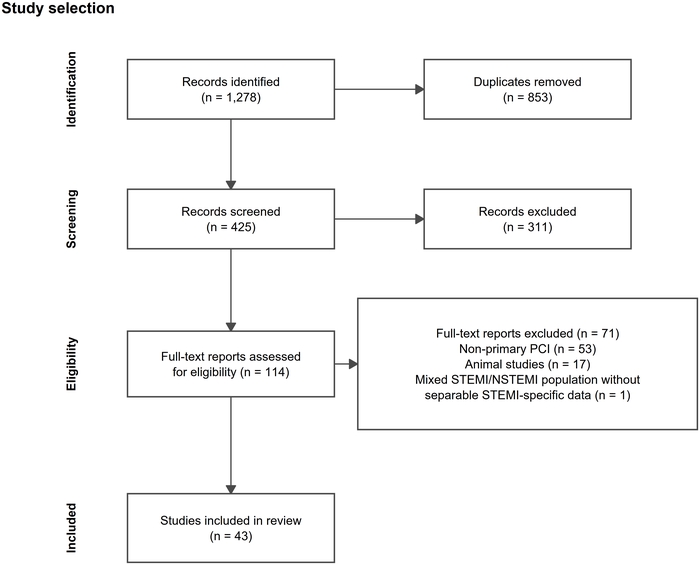
Figure 1: PRISMA study selection. The review identified 1,278 records, removed 853 duplicates, screened 425 records, excluded 311 records, assessed 114 full texts, excluded 71 full texts, and included 43 studies. Mixed STEMI/NSTEMI population without separable STEMI-specific data accounted for one full-text exclusion. PCI, percutaneous coronary intervention; PRISMA, Preferred Reporting Items for Systematic Reviews and Meta-Analyses; STEMI, ST-segment elevation myocardial infarction. Please click here to view a larger version of this figure.
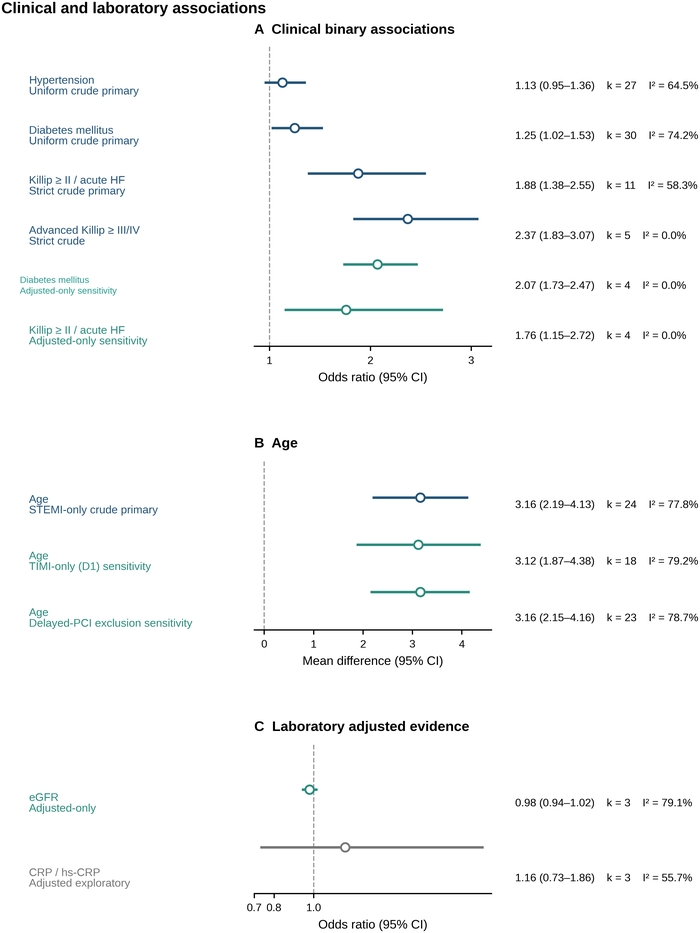
Figure 2: Clinical and laboratory associations with slow flow/no-reflow. Panel A shows clinical binary associations from crude primary and adjusted-only sensitivity analyses. Panel B shows the pooled age mean difference in the primary analysis and the TIMI-only and delayed-PCI-exclusion sensitivity analyses. Panel C shows adjusted laboratory evidence for estimated glomerular filtration rate and C-reactive protein/high-sensitivity C-reactive protein. Points are pooled estimates and horizontal lines are 95% confidence intervals; color identifies primary, sensitivity, and exploratory analyses. Abbreviations: CRP, C-reactive protein; eGFR, estimated glomerular filtration rate; hs-CRP, high-sensitivity C-reactive protein; MD, mean difference; OR, odds ratio. Please click here to view a larger version of this figure.
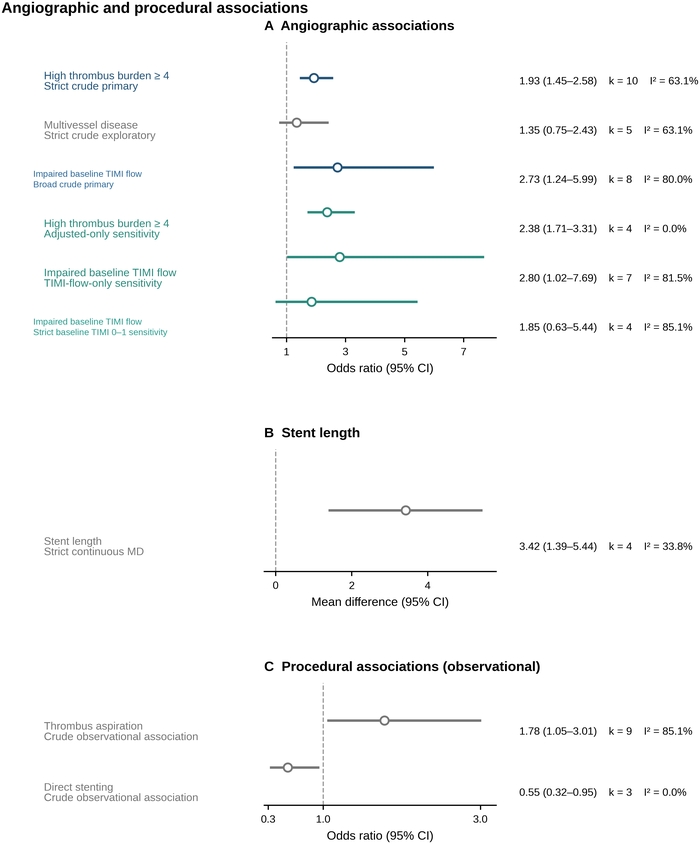
Figure 3: Angiographic and procedural associations with slow flow/no-reflow. Panel A shows angiographic associations for high thrombus burden, multivessel disease, and impaired baseline TIMI flow, including definition-restricted and adjusted-only sensitivity analyses. Panel B shows the pooled mean difference in stent length. Panel C shows observational associations for thrombus aspiration and direct stenting. Points are pooled estimates and horizontal lines are 95% confidence intervals. Procedural associations may be affected by confounding by indication, procedural selection, and lesion anatomy. Abbreviations: MD, mean difference; OR, odds ratio; TIMI, Thrombolysis in Myocardial Infarction. Please click here to view a larger version of this figure.
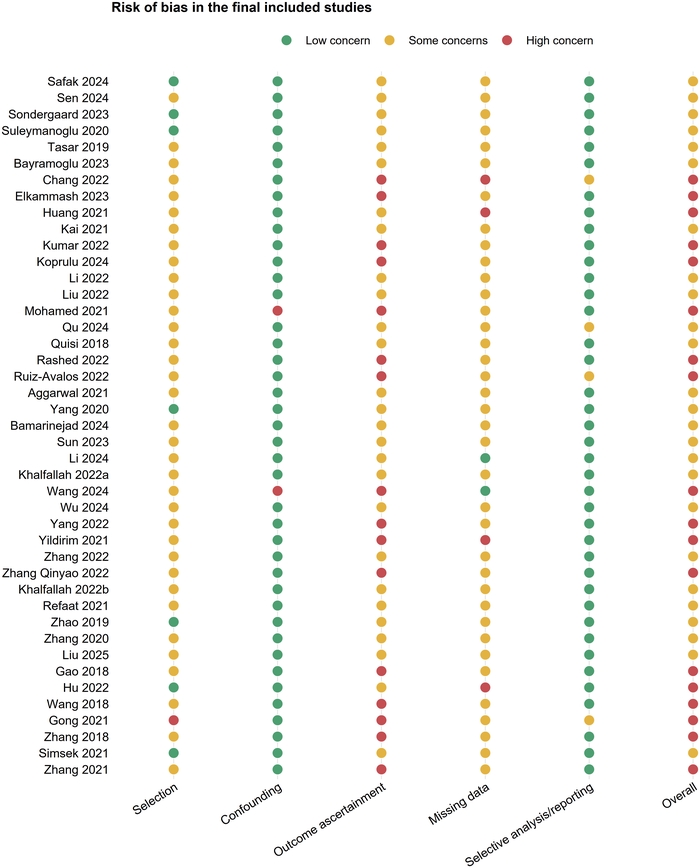
Figure 4: Modified Newcastle-Ottawa domain-based risk-of-bias assessment for 43 included studies. Judgments are shown for selection, confounding/comparability, outcome ascertainment, missing data, selective analysis/reporting, and overall risk of bias. Please click here to view a larger version of this figure.
Table 1: Characteristics of the 43 included studies. The table summarizes study setting, design, sample size, outcome definition, analytical classification, and eligibility notes. Please click here to download this Table.
Table 2: Outcome definitions and analytical classifications. The table summarizes the angiographic slow flow/no-reflow definition, outcome class, primary-PCI eligibility, and analytical role for each included study. Please click here to download this Table.
Table 3: Main quantitative results from crude primary and designated exploratory analyses. The table reports effect measures, number of contributing studies, pooled estimates, 95% confidence intervals, heterogeneity, and 95% prediction intervals. Please click here to download this Table.
Table 4: Adjusted-only sensitivity analyses. The table reports comparable multivariable associations analyzed separately from crude primary effects, including the effect scale, number of studies, 95% confidence intervals, heterogeneity, and prediction intervals. Please click here to download this Table.
Supplementary Figure 1: Study-level age sensitivity analysis. Study-specific mean differences in age are shown with 95% confidence intervals together with the pooled random-effects estimate. Please click here to download this file.
Supplementary Figure 2: Adjusted-only sensitivity analyses. Comparable multivariable odds ratios are shown for clinical, laboratory, and angiographic factors analyzed separately from crude primary effects. Please click here to download this file.
Supplementary Figure 3: Summary of domain-based risk-of-bias judgments. The distribution of low concern, some concerns, and high concern judgments is summarized across the prespecified assessment domains. Please click here to download this file.
Supplementary Table 1: Complete database-specific search strategies. Search terms, search fields, database coverage, and the prespecified search period from inception through May 31, 2026, are provided for all seven databases. Please click here to download this file.
Abbreviations: coronary artery disease (CAD); confidence interval (CI); C-reactive protein (CRP); estimated glomerular filtration rate (eGFR); fibrinogen-to-albumin ratio (FAR); Grading of Recommendations Assessment, Development and Evaluation (GRADE); high-sensitivity C-reactive protein (hs-CRP); low-density lipoprotein cholesterol (LDL-C); mean difference (MD); myocardial infarction (MI); neutrophil-to-lymphocyte ratio (NLR); odds ratio (OR); percutaneous coronary intervention (PCI); prediction interval (PI); ST-segment elevation myocardial infarction (STEMI); Thrombolysis in Myocardial Infarction (TIMI); triglyceride-glucose/insulin resistance (TyG/IR). I2 denotes the percentage of between-study variability attributable to heterogeneity; k denotes the number of studies.
Supplementary Table 2: Sensitivity analyses. Outcome-definition, adjusted-only, eligibility, and leave-one-out analyses are reported with effect estimates, heterogeneity, and prediction intervals where applicable. Please click here to download this file.
Supplementary Table 3: Study-level risk-of-bias judgments. Domain-level judgments and overall ratings are provided for the 43 included studies. Please click here to download this file.
Supplementary Table 4: Descriptive and non-pooled evidence. Factors not quantitatively pooled because of sparse evidence, incompatible definitions, thresholds, units, or scales are summarized with the reason for non-pooling. Please click here to download this file.
Supplementary Table 5: GRADE Summary of Findings. Certainty judgments are presented for the main associations together with the principal reasons for downgrading and the permitted interpretation. Please click here to download this file.
Supplementary Table 6: Small-study-effect assessments. Egger regression results are reported for primary meta-analyses with at least 10 contributing studies; analyses with fewer studies are identified as unsuitable for formal asymmetry testing. Please click here to download this file.
Supplementary File 1: Complete study-level extraction and analysis data. The workbook contains study characteristics, eligibility information, analysis inputs, effect-source documentation, risk-of-bias judgments, GRADE inputs, and descriptive evidence. Please click here to download this file.
Supplementary File 2: Complete statistical-analysis and figure-generation code. The single R script contains the code used for data preparation, primary and sensitivity meta-analyses, risk-of-bias and GRADE summaries, table generation, figure generation, and reproducibility checks. Please click here to download this file.
דיון
This review maps associations with angiographic SF/NR across clinical, laboratory, angiographic, and procedural domains while separating evidence according to replication, adjustment, comparability, heterogeneity, and certainty. Among commonly studied factors, diabetes, Killip class/acute heart failure, advanced Killip class, impaired baseline TIMI flow, high thrombus burden, and longer stent length showed positive pooled averages. Adjusted-only analyses were consistent for age, hypertension, diabetes, Killip class II or higher/acute heart failure, and high thrombus burden. Nevertheless, prediction intervals for several crude analyses included null, and GRADE certainty was low or very low.
The findings overlap with variables used in previous risk scores and prediction-model studies, including age, hemodynamic compromise, ischemic delay, baseline TIMI flow, thrombus burden, lesion characteristics, and stent length7,8. The incremental contribution of this review is therefore not the discovery of a new universal predictor. It is the cross-domain separation of repeatedly supported findings from adjusted-consistent, outcome-definition-sensitive, noncommensurate, sparse, or exploratory evidence, supported by source-level effect verification, prediction intervals, domain-based risk-of-bias judgments, and GRADE.
The more stable clinical and angiographic associations are biologically plausible but remain observational. Advanced Killip class and acute heart failure may mark greater infarct severity and limited hemodynamic reserve. Impaired baseline TIMI flow and high thrombus burden may reflect prolonged occlusion, distal embolization, and microvascular reperfusion injury3,6. These interpretations support candidate variable selection for future models but do not establish causality or justify treatment escalation based on the pooled associations alone.
Heterogeneity remains central to interpretation. TIMI flow, MBG/TMPG, and cTFC capture related but nonidentical reperfusion phenotypes, and TIMI-only sensitivity analyses did not remove all between-study variability. Crude and adjusted analyses also answered different questions because adjusted models used nonuniform covariate sets. For this reason, adjusted and unadjusted estimates were not combined, noncommensurate biomarkers were not force-pooled, and sparse evidence was not given the same prominence as repeatedly replicated associations. The observed associations with thrombus aspiration and direct stenting are especially susceptible to confounding by indication, procedural selection, and lesion anatomy and should not be interpreted as harmful or protective treatment effects59.
Strengths include the 43-study cross-domain synthesis, explicit effect-source hierarchy, separation of crude and adjusted estimates, REML/Hartung-Knapp modeling, prediction intervals, definition-restricted and eligibility sensitivity analyses, domain-level risk-of-bias assessment, GRADE, and a reproducible data-and-code package. Limitations include the observational design of all included studies, residual confounding, geographic concentration in China and Turkey, inconsistent SF/NR definitions, variable thresholds and assays, sparse biomarker evidence, restricted small-study effect assessment, lack of prospective registration, and the eligibility boundary set by one delayed-PCI study. Study-level aggregation also prevents assessment of interactions within individual patients.
Future research should use standardized angiographic and tissue-level reperfusion definitions, report both crude data and transparently specified multivariable models, avoid data-driven dichotomization, and validate prediction models across regions and centers. Individual-participant-data meta-analysis or prospective multicenter registries could evaluate nonlinear effects and interactions while improving calibration and transportability. The present evidence map can guide prioritization of variables and study design, but clinical implementation requires prospective validation rather than direct translation of pooled observational estimates.
Across 43 observational studies, several clinical and angiographic characteristics were associated with slow flow/no-reflow after primary PCI for STEMI, particularly diabetes, higher Killip class or acute heart failure, impaired baseline TIMI flow, and high thrombus burden. Adjusted-only analyses supported some of these associations, but heterogeneity, variable outcome definitions, residual confounding, geographic concentration, sparse biomarker evidence, and limited assessment of small-study effects reduced certainty. Evidence for procedural variables should not be interpreted as treatment effects. This review, therefore, provides a cross-domain evidence map that distinguishes repeatedly supported and adjusted-consistent associations from heterogeneous, sparse, or exploratory findings. Prospective multicenter validation using standardized reperfusion definitions is required before these associations can inform a bedside prediction tool or treatment strategy.
גילויים
The authors declare no competing interests. Generative artificial intelligence tools were used solely for language editing and text polishing.
AUTHOR CONTRIBUTIONS:
Jian Cheng: conceptualization, methodology, data curation, formal analysis, investigation, and writing-original draft. Qiangsong Jin: independent study screening, methodological assessment, numerical-data verification, validation, and writing-review and editing. Biao Tang: adjudication, supervision, and writing-review and editing. All authors reviewed and approved the submitted version.
תודות
All authors reviewed the manuscript and are responsible for the accuracy and completeness of its content. No specific funding was received for this work.
חומרים
| שם | חברה | מספר קטלוג | הערות |
|---|---|---|---|
| China National Knowledge Infrastructure (CNKI) | CNKI | Chinese-language literature search through May 31, 2026 | |
| Cochrane Library | Cochrane | Systematic review and trial-register search through May 31, 2026 | |
| dplyr 1.2.1; tidyr 1.3.2; purrr 1.2.2 | R packages | Data preparation, restructuring, and analysis workflow | |
| Embase.com | Elsevier | Bibliographic database search through May 31, 2026 | |
| ggplot2 4.0.3; patchwork 1.3.2; svglite 2.2.2 | R packages | Statistical graphics, multi-panel figure assembly, and vector export | |
| metafor 5.0.1 | R package | RRID: SCR_003450 | REML random-effects meta-analysis, Hartung-Knapp inference, prediction intervals, funnel plots, and Egger regression |
| PubMed | NCBI, U.S. National Library of Medicine | Bibliographic database search through May 31, 2026 | |
| R 4.5.2 | R Foundation for Statistical Computing | Statistical computing environment | |
| readxl 1.5.0; openxlsx 4.2.9 | R packages | Import and export of analysis workbooks | |
| VIP Database | VIP Information | Chinese-language literature search through May 31, 2026 | |
| Wanfang Data | Wanfang Data | Chinese-language literature search through May 31, 2026 | |
| Web of Science Core Collection | Clarivate | Citation database search through May 31, 2026 |
מקורות
- Byrne RA, et al. 2023 ESC guidelines for the management of acute coronary syndromes. Eur Heart J. 2023;44(38):3720-3826.
- Rao SV, et al. 2025 ACC/AHA/ACEP/NAEMSP/SCAI guideline for the management of patients with acute coronary syndromes: a report of the American College of Cardiology/American Heart Association Joint Committee on Clinical Practice Guidelines. Circulation. 2025;151(13):e771-e862.
- Niccoli G, Burzotta F, Galiuto L, Crea F. Myocardial no-reflow in humans. J Am Coll Cardiol. 2009;54(4):281-292.
- Ndrepepa G, et al. 5-year prognostic value of no-reflow phenomenon after percutaneous coronary intervention in patients with acute myocardial infarction. J Am Coll Cardiol. 2010;55(21):2383-2389.
- Rezkalla SH, Dharmashankar KC, Abdalrahman IB, Kloner RA. No-reflow phenomenon following percutaneous coronary intervention for acute myocardial infarction: incidence, outcome, and effect of pharmacologic therapy. J Interv Cardiol. 2010;23(5):429-436.
- Galasso G, et al. No-reflow phenomenon: pathophysiology, diagnosis, prevention, and treatment. A review of the current literature and future perspectives. Angiology. 2014;65(3):180-189.
- Dawson LP, et al. No-reflow prediction in acute coronary syndrome during percutaneous coronary intervention: the NORPACS risk score. Circ Cardiovasc Interv. 2024;17(4):e013738.
- Ebrahimi R, et al. Predicting the no-reflow phenomenon in ST-elevation myocardial infarction patients undergoing primary percutaneous coronary intervention: a systematic review of clinical prediction models. Ther Adv Cardiovasc Dis. 2024;18:17539447241290438.
- Page MJ, et al. The PRISMA 2020 statement: an updated guideline for reporting systematic reviews. BMJ. 2021;372:n71.
- Stroup DF, et al. Meta-analysis of observational studies in epidemiology: a proposal for reporting. JAMA. 2000;283(15):2008-2012.
- Stang A. Critical evaluation of the Newcastle-Ottawa scale for the assessment of the quality of nonrandomized studies in meta-analyses. Eur J Epidemiol. 2010;25(9):603-605.
- Wells GA, et al. The Newcastle-Ottawa Scale (NOS) for assessing the quality of nonrandomised studies in meta-analyses. 2000.
- Guyatt GH, et al. GRADE: an emerging consensus on rating quality of evidence and strength of recommendations. BMJ. 2008;336(7650):924-926.
- Viechtbauer W. Conducting meta-analyses in R with the metafor package. J Stat Softw. 2010;36(3):1-48.
- Knapp G, Hartung J. Improved tests for a random effects meta-regression with a single covariate. Stat Med. 2003;22(17):2693-2710.
- Safak O, et al. Prognostic nutritional index as a predictor of no-reflow occurrence in patients with ST-segment elevation myocardial infarction who underwent primary percutaneous coronary intervention. Angiology. 2024;75(7):689-695.
- Sen F, Kurtul A, Bekler O. Pan-immune-inflammation value is independently correlated to impaired coronary flow after primary percutaneous coronary intervention in patients with ST-segment elevation myocardial infarction. Am J Cardiol. 2024;211:153-159.
- Søndergaard FT, et al. Soluble ST2 in plasma is associated with post-procedural no-or-slow reflow after primary percutaneous coronary intervention in ST-elevation myocardial infarction. Eur Heart J Acute Cardiovasc Care. 2023;12(1):48-52.
- Suleymanoglu M, et al. The relationship between atherogenic index of plasma and no-reflow in patients with acute ST-segment elevation myocardial infarction who underwent primary percutaneous coronary intervention. Int J Cardiovasc Imaging. 2020;36(5):789-796.
- Tasar O, Karabay AK, Oduncu V, Kirma C. Predictors and outcomes of no-reflow phenomenon in patients with acute ST-segment elevation myocardial infarction undergoing primary percutaneous coronary intervention. Coron Artery Dis. 2019;30(4):270-276.
- Bayramoglu A, Hidayet S. Association between pan-immune-inflammation value and no-reflow in patients with ST elevation myocardial infarction undergoing percutaneous coronary intervention. Scand J Clin Lab Invest. 2023;83(6):384-389.
- Chang SM, Yu YT, Luan B, Hou AJ, Wang Y. Predictive value of soluble growth stimulator gene 2 protein for coronary slow flow/no-reflow in ST-elevation myocardial infarction patients receiving percutaneous coronary intervention. J Interv Cardiol. 2022;2022:9322460.
- Elkammash A, et al. Acute heart failure and coronary blood flow in ST-elevation myocardial infarction patients undergoing primary percutaneous coronary intervention: an observational cohort study. Cureus. 2023;15(12):e50340.
- Huang X, Zheng W, Zhao XD, Nie SP. CHA2DS2-VASc score predicts the slow flow/no-reflow phenomenon in ST-segment elevation myocardial infarction patients with multivessel disease undergoing primary percutaneous coronary intervention. Medicine (Baltimore). 2021;100(21):e26162.
- Kai T, et al. Renal dysfunction as a predictor of slow-flow/no-reflow phenomenon and impaired ST segment resolution after percutaneous coronary intervention in ST-elevation myocardial infarction with initial thrombolysis in myocardial infarction grade 0. Circ J. 2021;85(10):1770-1778.
- Kumar R, et al. Quantification of thrombus burden as an independent predictor of intra-procedural no-reflow in patients with ST-segment elevation myocardial infarction undergoing primary percutaneous coronary revascularization. J Ayub Med Coll Abbottabad. 2022;34(2):288-294.
- Koprulu D, Toprak K, Genc Tapar G, Ocak M. FGF-21: a novel biomarker predicting no-reflow in ST-segment elevation myocardial infarction. Eur Rev Med Pharmacol Sci. 2024;28(8):3024-3029.
- Li Q, et al. Association between kaolin-induced maximum amplitude and slow-flow/no-reflow in ST elevation myocardial infarction patients treated with primary percutaneous coronary intervention. Int J Cardiol. 2022;369:13-18.
- Liu Y, et al. A nomogram risk prediction model for no-reflow after primary percutaneous coronary intervention based on rapidly accessible patient data among patients with ST-segment elevation myocardial infarction and its relationship with prognosis. Front Cardiovasc Med. 2022;9:966299.
- Mohamed A. Predicting mortality and no-reflow in STEMI patients using epicardial adipose tissue. Clin Cardiol. 2021;44(10):1371-1376.
- Qu Z, Guan X. Predictive value of the triglyceride-glucose index for no-reflow phenomenon after percutaneous coronary intervention in patients with acute ST-segment elevation myocardial infarction complicated by metabolic syndrome. Am J Transl Res. 2024;16(10):5539-5551.
- Quisi A, Alici G. The relationship between serum rheumatoid factor level and no-reflow phenomenon in patients with acute ST-segment elevation myocardial infarction undergoing primary percutaneous coronary intervention. J Clin Lab Anal. 2018;32(9):e22598.
- Rashed MI, Saleh MA, Elfekky EM, Elmahmoudy AM. CHA2DS2 VASc score and brachial artery flow-mediated dilation as predictors for no-reflow phenomenon in patients with ST-segment elevation myocardial infarction undergoing primary percutaneous coronary intervention. Egypt Heart J. 2022;74(1):13.
- Ruiz-Avalos JA, Bazan-Rodriguez L, Espinoza-Escobar G, Martinez-Villa FA, Ornelas-Aguirre JM. Predictors in no-reflow phenomenon in acute myocardial infarction with ST-segment elevation. Arch Cardiol Mex. 2022;92(4):461-468. Spanish.
- Aggarwal P, et al. Predictors of no-reflow phenomenon following percutaneous coronary intervention for ST-segment elevation myocardial infarction. Ann Cardiol Angeiol (Paris). 2021;70(3):136-142.
- Yang L, Cong H, Lu Y, Chen X, Liu Y. Prediction of no-reflow phenomenon in patients treated with primary percutaneous coronary intervention for ST-segment elevation myocardial infarction. Medicine (Baltimore). 2020;99(26):e20152.
- Bamarinejad F, et al. Clinical, laboratory, and procedural predictors of slow flow/no reflow phenomenon after emergency percutaneous coronary interventions in ST-elevated myocardial infarction. Egypt Heart J. 2024;76(1):146.
- Sun Y, Ren J, Li L, Wang C, Yao H. RDW as a predictor for no-reflow phenomenon in DM patients with ST-segment elevation myocardial infarction undergoing primary percutaneous coronary intervention. J Clin Med. 2023;12(3):807.
- Li X, et al. Association of pre-PCI blood pressure and no-reflow in patients with acute ST-elevation coronary infarction. Glob Heart. 2024;19(1):28.
- Khalfallah M, Maria DA, Allaithy A. Impact of stress hyperglycemia on no-reflow phenomenon in patients with ST elevation myocardial infarction undergoing primary percutaneous coronary intervention. Glob Heart. 2022;17(1):23.
- Wang L, et al. Machine learning prediction of no reflow in patients with ST-segment elevation myocardial infarction undergoing primary percutaneous coronary intervention. Cardiovasc Diagn Ther. 2024;14(4):547-562.
- Wu Z, et al. Correlation between admission blood glucose, fibrinogen, and slow blood flow during primary PCI for acute ST segment elevation myocardial infarction. Front Cardiovasc Med. 2024;11:1478743.
- Yang X, et al. LncRNA MALAT1 functions as a biomarker of no-reflow phenomenon in ST-segment elevation myocardial infarction patients receiving primary percutaneous coronary intervention. Sci Rep. 2022;12(1):3294.
- Yildirim A, et al. Relationship between blood viscosity and no-reflow phenomenon in ST-segment elevation myocardial infarction performed in primary percutaneous coronary interventions. Biomark Med. 2021;15(9):659-667.
- Zhang XT, Lin ZR, Zhang L, Zhao ZW, Chen LL. MELD-XI score predict no-reflow phenomenon and short-term mortality in patient with ST-segment elevation myocardial infarction undergoing primary percutaneous coronary intervention. BMC Cardiovasc Disord. 2022;22(1):113.
- Zhang Q, Hu M, Ma S, Niu T. New R2-CHA2DS2-VASc score predicts no-reflow phenomenon and long-term prognosis in patients with ST-segment elevation myocardial infarction after primary percutaneous coronary intervention. Front Cardiovasc Med. 2022;9:899739.
- Khalfallah M, Allaithy A, Maria DA. Impact of the total ischemia time on no-reflow phenomenon in patients with ST elevation myocardial infarction undergoing primary percutaneous coronary intervention. Anatol J Cardiol. 2022;26(5):382-387.
- Refaat H, Tantawy A, Gamal AS, Radwan H. Novel predictors and adverse long-term outcomes of no-reflow phenomenon in patients with acute ST elevation myocardial infarction undergoing primary percutaneous coronary intervention. Indian Heart J. 2021;73(1):35-43.
- Zhao Y, et al. Usefulness of fibrinogen-to-albumin ratio to predict no-reflow and short-term prognosis in patients with ST-segment elevation myocardial infarction undergoing primary percutaneous coronary intervention. Heart Vessels. 2019;34(10):1600-1607.
- Zhang QY, Ma SM, Sun JY. New CHA2DS2-VASc-HSF score predicts the no-reflow phenomenon after primary percutaneous coronary intervention in patients with ST-segment elevation myocardial infarction. BMC Cardiovasc Disord. 2020;20(1):346.
- Liu H, et al. The HALP score predicts no-reflow phenomenon and long-term prognosis in patients with ST-segment elevation myocardial infarction after primary percutaneous coronary intervention. Coron Artery Dis. 2025;36(4):273-280.
- Gao R, et al. The value of combining plasma D-dimer and endothelin-1 levels to predict no-reflow after percutaneous coronary intervention of ST-segment elevation in acute myocardial infarction patients with a type 2 diabetes mellitus history. Med Sci Monit. 2018;24:3549-3556.
- Hu X, et al. Elevated uric acid is related to the no-/slow-reflow phenomenon in STEMI undergoing primary PCI. Eur J Clin Invest. 2022;52(4):e13719.
- Wang Z, Ren L, Liu N, Peng J. Utility of hematological parameters in predicting no-reflow phenomenon after primary percutaneous coronary intervention in patients with ST-segment elevation myocardial infarction. Clin Appl Thromb Hemost. 2018;24(7):1177-1183.
- Gong X, et al. D-dimer level predicts angiographic no-reflow phenomenon after percutaneous coronary intervention within 2-7 days of symptom onset in patients with ST-segment elevation myocardial infarction. J Cardiovasc Transl Res. 2021;14(4):728-734.
- Zhang H, et al. The value of pre-infarction angina and plasma D-dimer in predicting no-reflow after primary percutaneous coronary intervention in ST-segment elevation acute myocardial infarction patients. Med Sci Monit. 2018;24:4528-4535.
- Simsek B, et al. The association of acute-to-chronic glycemic ratio with no-reflow in patients with ST-segment elevation myocardial infarction undergoing primary percutaneous coronary intervention. Kardiol Pol. 2021;79(2):170-178.
- Zhang J, He L. Circulating miR-660-5p is associated with no-reflow phenomenon in patients with ST segment elevation myocardial infarction undergoing primary percutaneous coronary intervention. Anatol J Cardiol. 2021;25(5):323-329.
- Carrick D, et al. A randomized trial of deferred stenting versus immediate stenting to prevent no- or slow-reflow in acute ST-segment elevation myocardial infarction (DEFER-STEMI). J Am Coll Cardiol. 2014;63(20):2088-2098.