This study used chest computed tomography radiomics to develop a diabetes prediction model and assess diabetes-associated bone changes. The model showed strong predictive performance, while Shapley Additive Explanations identified bone features with the highest contributions to diabetes prediction.
מאמר מחקר
Assessing Diabetes-Associated Bone Changes Using Chest Computed Tomography Radiomics and Extreme Gradient Boosting: A Retrospective Study
במאמר זה
סיכום
תקציר
Chest computed tomography (CT) provides quantitative information on bone that may reveal diabetes-associated skeletal changes not readily identified by routine image assessment. This study aimed to establish a prediction model for diabetes using chest CT radiomics features and identify bone features with the highest contributions to diabetes prediction. One hundred patients with diabetes and 100 healthy controls underwent chest CT. The thoracic vertebrae, scapulae, and sternum were automatically segmented using a convolutional neural network (CNN), and 93 radiomics features were extracted from each structure. Max-Relevance and Min-Redundancy (mRMR), least absolute shrinkage and selection operator (LASSO), and extreme gradient boosting (XGBoost) were successively used for feature selection and model development. The area under the receiver operating characteristic curve (AUC) was evaluated using internal-validation data and an external-test cohort of 50 participants, including 25 patients with diabetes. Shapley Additive Explanations (SHAP) were used to interpret the XGBoost model. After mRMR, and LASSO, 17 features were selected. The model achieved AUCs of 0.95 and 0.90 on the internal-validation and external-test data, respectively. gldm_SmallDependenceLowGrayLevelEmphasis_T11, glcm_Idmn_T8, and gldm_LargeDependenceHighGrayLevelEmphasis_T4 showed the highest contributions to diabetes prediction in the SHAP analysis. Glycated hemoglobin (HbA1c) levels correlated with several bone CT features. These findings demonstrate that chest CT radiomics combined with interpretable machine learning can characterize diabetes-associated bone changes and distinguish patients with diabetes from healthy controls.
מבוא
The incidence of osteoarthropathy increases with the duration of diabetes1,2,3. Osteoarthritis is more likely to occur in patients who take oral hypoglycemic drugs for prolonged periods or in patients with poor disease control4,5,6. Patients with diabetes may have disorders of calcium, phosphorus, and magnesium metabolism. When diabetes is poorly controlled, it is often accompanied by hepatic malnutrition and kidney disease. A reduction in active vitamin D leads to calcium malabsorption in patients with diabetes, while calcium deficiency in bone and reduced bone synthesis lead to loss of bone mass7. Oral sulfonylurea hypoglycemic drugs increase the loss of bone calcium salts, leading to osteoporosis. Diabetic neuropathy causes sensory decline and motor reflex control disorders, which may manifest as alterations in joint mobility8, and microvascular disease caused by diabetes affects the nutritional supply to bone9.
Patients with diabetes sometimes undergo chest computed tomography (CT) examinations at health check-up centers. Chest CT can clearly display bones, including the thoracic vertebrae, scapulae, and sternum. However, it is difficult for radiologists to determine whether these bones are affected by diabetes. CT radiomics can extract hundreds of quantitative features from bone, providing a non-invasive approach to studying bone texture and structure, and some of these features are expected to differ between healthy individuals and patients with diabetes10. Recent studies have begun to apply quantitative bone imaging to diabetic bone disease. Alagoz and Alani evaluated mandibular bone using cone-beam CT radiomics in patients with type 2 diabetes11, and Khadilkar et al. reported altered bone geometry and quality in type 2 diabetes mellitus using peripheral quantitative computed tomography12. However, these studies focused on the jaw and peripheral skeleton. To the best of our knowledge, no previous study has combined automatic multi-structure chest CT radiomics with interpretable machine learning to link bone features with glycemic control on chest CT. Bone segmentation is generally required before radiomics features can be extracted. Manual segmentation of bones on chest CT is time-consuming and labor-intensive and may vary among operators. In recent years, automatic segmentation based on deep learning has improved in speed and accuracy; for example, automatic segmentation of bones in the chest can be performed using TotalSegmentator13. Therefore, the purpose of this study was to assess diabetes-associated bone changes using chest CT radiomics together with Shapley Additive Explanations (SHAP)-based model interpretation.
פרוטוקול
This retrospective study was approved by the Institutional Review Board (IRB) of Tongji Hospital, Tongji Medical College, Huazhong University of Science and Technology (approval no. TJ-IRB20250926; approved on September 26, 2025), and the requirement for informed consent was waived owing to the retrospective design. All procedures involving human participants adhered to the ethical standards of the Declaration of Helsinki. The overall study design, from patient selection to the HbA1c analyses, is shown in Figure 1.
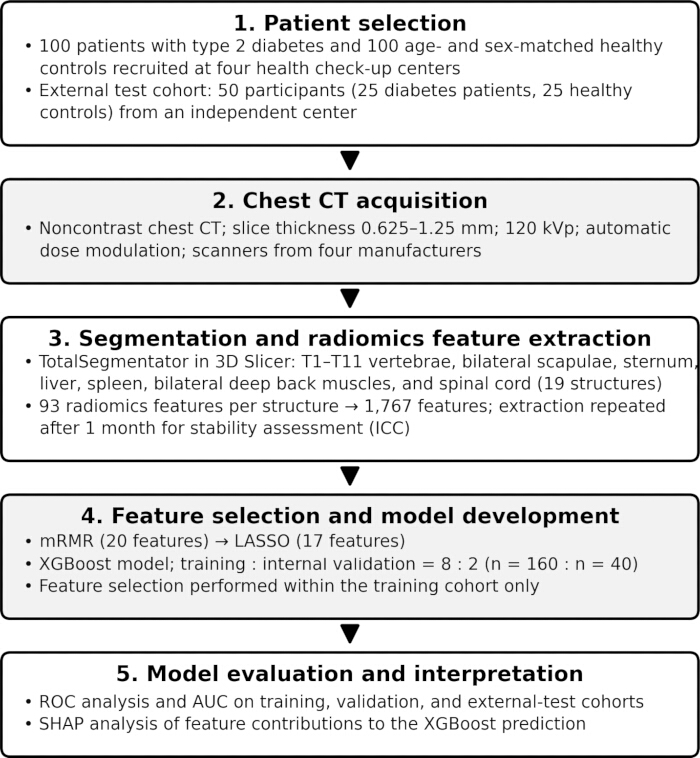
Figure 1. Overall study design. The flow chart summarizes patient selection, chest CT acquisition, automatic segmentation and radiomics feature extraction, feature selection and XGBoost model development, and model evaluation and interpretation. AUC, area under the curve; ICC, intraclass correlation coefficient; LASSO, least absolute shrinkage and selection operator; mRMR, Max-Relevance and Min-Redundancy; ROC, receiver operating characteristic; SHAP, Shapley Additive Explanations. Please click here to view a larger version of this figure.
Patients
The typical symptoms of diabetes include excessive thirst, excessive urination, excessive food intake, or unexplained weight loss. In this study, the diagnosis of type 2 diabetes was made by meeting any of the following four criteria: 1) fasting blood glucose (FPG) ≥ 7.0 mmol/L; 2) 2-hour blood glucose ≥ 11.1 mmol/L during an oral glucose tolerance test (OGTT); 3) random blood glucose ≥ 11.1 mmol/L; or 4) HbA1c ≥ 6.5%. Patients with type 2 diabetes who underwent chest CT examinations in the Health Check-up Centers were included in the study.
The criteria for healthy controls were as follows: 1) no diabetes; 2) no organic or functional diseases of the cardiovascular, respiratory, digestive, neurological, endocrine, immune, urinary, or other systems; 3) no acute or chronic infection; 4) normal blood routine test, urine routine test, liver and kidney function, electrolytes, blood lipids, and coagulation function; 5) no abnormalities on electrocardiogram, chest X-ray, or ultrasound; 6) no depression, anxiety, or schizophrenia; 7) no intake of sedatives, hormones, or antibiotics within the past 3 months; 8) no history of alcohol, drug, or substance abuse; and 9) no history of recent surgery or trauma. Healthy controls who underwent chest CT examinations in the Health Check-up Centers were included in the study.
Finally, 100 patients with diabetes and 100 healthy controls were included in the study, and they were strictly matched by age and sex.
Chest CT examination
Noncontrast chest CT was performed using scanners from four manufacturers at four health check-up centers. The acquisition parameters were as follows: slice thickness, 0.625–1.25 mm; tube voltage, 120 kVp; tube current, automatic dose modulation (ADM); field of view (FOV), typically 40–45 cm; pitch, 1.0–1.5; and matrix size, typically 512 × 512. Patients were instructed to inhale deeply and hold their breath during scanning to minimize respiratory motion artifacts.
Image analysis
The chest CT data were transferred to a dedicated workstation for automatic bone segmentation and radiomics feature extraction. The workstation was equipped with a consumer-grade graphics processing unit (see Table of Materials for software and hardware details). The following structures were automatically segmented in this study: the T1–T11 vertebrae, bilateral scapulae, and sternum; the liver, spleen, bilateral deep back muscles, and spinal cord were also segmented, so that 19 structures were analyzed in total. We resampled all CT volumes to a unified isotropic voxel size of 1 mm × 1 mm × 1 mm to eliminate variations in native pixel spacing and slice thickness, which strongly affect texture features of trabecular bone. Discretization converts continuous Hounsfield unit (HU) values into discrete bins before extracting texture radiomic features. It is a critical preprocessing step, especially when images come from different CT scanners, as scanner differences can shift HU distributions and alter bin counts/edges, which directly changes texture features. HU values were binned with a constant interval (bin width = 25 HU). Ninety-three radiomics features were extracted from each structure with the radiomics module of 3D Slicer (PyRadiomics, version 3.0.1), yielding 1,767 features in total (93 features × 19 structures). Radiomics features were standardized using Z-score standardization by subtracting the mean from each feature value and dividing by the standard deviation. The features comprised first-order statistics and higher-order texture features based on the gray-level co-occurrence, gray-level dependence, gray-level run-length, gray-level size-zone, and neighboring gray-tone difference matrices and followed the definitions of the Image Biomarker Standardization Initiative (IBSI)14.
The whole automatic segmentation and feature-extraction procedure was repeated on all 200 chest CT scans one month later with the same software and settings to assess measurement stability. The intraclass correlation coefficient (ICC) was calculated for each feature. The HbA1c values of the 100 patients with diabetes were obtained from their health check-up records.
Feature selection, prediction model, and SHAP analysis
Standard ComBat was used to correct scanner-related batch effects. The four scanner batches corresponded to GE, Siemens, Philips, and United Imaging, with one scanner used at each of the four participating centers. The four batches comprised 44, 62, 51, and 43 participants, respectively. Radiomics features were compared between patients with diabetes and healthy controls using independent-samples t tests, with an unadjusted significance threshold of p < 0.01 used to identify differential radiomics features. Receiver operating characteristic (ROC) curves were used to evaluate the discriminatory performance of individual features, and the area under the curve (AUC) was calculated for each feature.
Max-Relevance and Min-Redundancy (mRMR) was used to select 20 features because it evaluates the relevance of each feature to the outcome and the redundancy among features simultaneously, which is suitable for high-dimensional radiomics data. The least absolute shrinkage and selection operator (LASSO) was further used for feature selection because its L1 regularization shrinks the coefficients of redundant features to zero and reduces overfitting in small samples. The LASSO penalty parameter λ was determined using 5-fold cross-validation, and the λ corresponding to the minimum cross-validated mean squared error was selected. Extreme gradient boosting (XGBoost) was then used to establish the prediction model based on the features selected by LASSO; XGBoost is an ensemble of decision trees that captures non-linear relationships and interactions, and its built-in regularization controls model complexity, which suits the moderate sample size of this study15. XGBoost was implemented with the default hyperparameters of the library (100 boosting rounds, maximum tree depth 6, and learning rate 0.3), and no additional hyperparameter tuning was performed. The training and internal-validation cohorts were divided according to an 8:2 ratio using the train_test_split function from the scikit-learn package in Python. Samples were randomly shuffled before partitioning, with random_state=42 specified to ensure reproducibility. All feature-selection steps were performed within the training cohort only; the internal-validation and external-test cohorts were kept independent of feature selection and model training. The model AUC was calculated on the training, internal-validation, and external-test data (25 patients with diabetes and 25 healthy controls from another center). The SHAP method was then used to explain the XGBoost model; SHAP assigns each feature an additive contribution to each individual prediction on the basis of cooperative game theory, providing both global and local interpretability16.
Statistical analysis
All statistical analyses were performed with Python (version 3.11) through the Anaconda environment. The 1,767 radiomics features were correlated with HbA1c using Pearson correlation. Features with |Pearson correlation coefficient| > 0.25 were used as candidate predictors of HbA1c. Multiple linear regression and XGBoost regression were then used to predict HbA1c from the radiomics features. The hyperparameters for XGBoost regression were as follows: "n_estimators": 200, "learning_rate": 0.05, "max_depth": 3, "min_child_weight": 3, "gamma": 0.1, "subsample": 0.8, "colsample_bytree": 0.8, "reg_alpha": 0.2, "reg_lambda": 1.0, "objective": "reg:squarederror", "eval_metric": "rmse", "random_state": 42, and "verbosity": 0. In the study, a two-sided p < 0.05 was considered statistically significant.
תוצאות
Patients
The 100 patients with diabetes and the 100 healthy controls were matched by age and sex. The comparison of basic information between the two groups is shown in Table 1. The primary cohort of 200 participants (100 patients with diabetes and 100 healthy controls) was divided 8:2 into a training cohort (n = 160; 80 patients with diabetes and 80 healthy controls) and an internal-validation cohort (n = 40; 20 patients with diabetes and 20 healthy controls). The external-test cohort comprised 50 participants (25 patients with diabetes and 25 healthy controls) who were recruited from another health check-up center that was independent of the four centers contributing to the primary cohort. The overall study design is shown in Figure 1.
| Variable | Diabetes (n = 100) | Healthy controls (n = 100) | P value |
| Age (years), median | 51 | 51 | 1 |
| Sex (male : female), n | 51:49 | 51:49 | 1 |
| BMI (kg/m2) | 21.4 ± 3.7 | 22.1 ± 3.9 | 0.591 |
| Systolic pressure (mmHg) | 129 ± 23 | 126 ± 21 | 0.433 |
| Diastolic pressure (mmHg) | 88 ± 14 | 86 ± 12 | 0.442 |
| Heart rate (beats/min) | 77 ± 15 | 74 ± 13 | 0.376 |
| Smoking, n | 12 | 12 | 1 |
| Mental labor : physical labor, n | 63:37 | 61:39 | 0.881 |
Table 1: Comparison of basic information between patients with diabetes and healthy controls. Demographic and clinical characteristics of 100 patients with diabetes and 100 age- and sex-matched healthy controls are shown. Continuous variables are presented as mean ± standard deviation, except for age, which is presented as the median for each group. Sex, smoking, and mental labor : physical labor are presented as participant counts. P values were obtained using the independent-samples t test for continuous variables and the χ2 test for categorical variables. BMI, body mass index.
Chest CT examination and image analysis
Chest bones, including the thoracic vertebrae, scapulae, and sternum, were successfully segmented for all 200 cases (Figure 2). In total, 1,767 radiomics features were extracted from the 19 structures. The entire segmentation and feature-extraction procedure was repeated one month later with the same software and settings; the ICC values of all 1,767 features ranged from 0.91 to 0.93, indicating good measurement stability, and all features were retained for subsequent analyses.
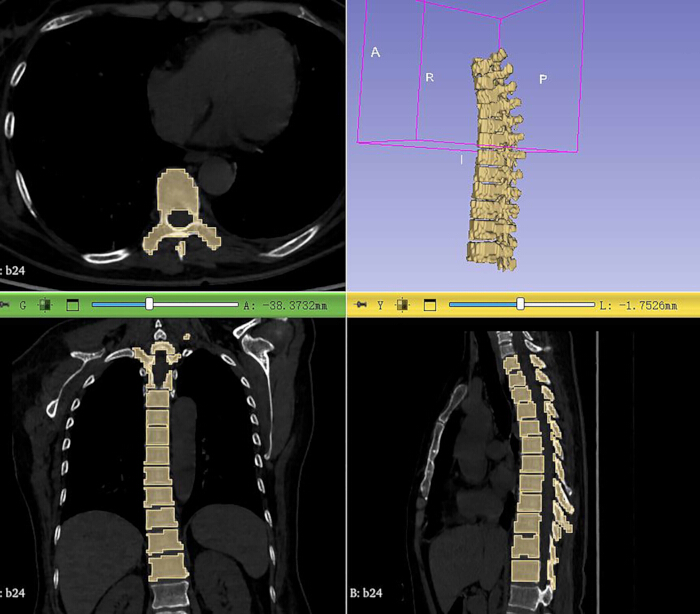
Figure 2. Automatic segmentation of the thoracic vertebrae on chest CT. Representative axial, coronal, and sagittal CT images and a three-dimensional rendering from one participant show automatic segmentation of the thoracic vertebrae. Please click here to view a larger version of this figure.
Feature selection, prediction model, and SHAP analysis
A total of 113 features differed between patients with diabetes and healthy controls. Using the mRMR method, 20 features were selected, including 16 bone features and four non-bone features. The discriminative performance of these 20 features for distinguishing patients with diabetes from healthy controls is shown in Table 2. The AUCs of the 20 features ranged from 0.533 to 0.796, and glcm_Imc2_T10 had the highest AUC (0.796). Using the LASSO method, 13 bone features and four non-bone features were selected for further model development. Using XGBoost, a prediction model (Figure 3) was established based on the 17 features selected by LASSO. The model AUCs were 1.00, 0.95, and 0.90 for the training, internal-validation, and external-test data, respectively.
| Feature | AUC | Sensitivity | Specificity | |
| gldm_SmallDependenceLowGrayLevelEmphasis_T11 vertebra | 0.793 (0.729, 0.858) | 0.638 (0.533, 0.735) | 1.000 (0.962, 1.000) | |
| ngtdm_Strength_spleen | 0.557 (0.475, 0.639) | 0.330 (0.236, 0.434) | 0.904 (0.826, 0.955) | |
| glcm_Idmn_T8 vertebra | 0.772 (0.705, 0.839) | 0.617 (0.511, 0.715) | 0.851 (0.763, 0.916) | |
| ngtdm_Busyness_spinal cord | 0.777 (0.711, 0.844) | 0.755 (0.656, 0.838) | 0.702 (0.599, 0.792) | |
| gldm_SmallDependenceLowGrayLevelEmphasis_T10 vertebra | 0.748 (0.678, 0.818) | 0.585 (0.479, 0.686) | 0.968 (0.910, 0.993) | |
| glcm_Imc2_T10 vertebra | 0.796 (0.732, 0.860) | 0.787 (0.691, 0.865) | 0.723 (0.622, 0.811) | |
| gldm_SmallDependenceLowGrayLevelEmphasis_T4 vertebra | 0.647 (0.568, 0.725) | 0.447 (0.344, 0.553) | 0.978 (0.925, 0.997) | |
| gldm_LargeDependenceHighGrayLevelEmphasis_T6 vertebra | 0.567 (0.485, 0.649) | 0.447 (0.344, 0.553) | 0.904 (0.826, 0.955) | |
| ngtdm_Busyness_left scapula | 0.649 (0.571, 0.727) | 0.851 (0.763, 0.916) | 0.234 (0.153, 0.333) | |
| glrlm_LongRunHighGrayLevelEmphasis_T2 vertebra | 0.774 (0.707, 0.841) | 0.000 (0.000, 0.038) | 1.000 (0.962, 1.000) | |
| firstorder_Skewness_T2 vertebra | 0.752 (0.683, 0.821) | 1.000 (0.962, 1.000) | 0.021 (0.003, 0.075) | |
| glcm_MCC_spinal cord | 0.738 (0.667, 0.809) | 0.670 (0.566, 0.764) | 0.755 (0.656, 0.838) | |
| gldm_SmallDependenceLowGrayLevelEmphasis_T9 vertebra | 0.780 (0.714, 0.846) | 0.511 (0.405, 0.615) | 0.978 (0.925, 0.997) | |
| gldm_LargeDependenceHighGrayLevelEmphasis_T4 vertebra | 0.533 (0.450, 0.615) | 0.362 (0.265, 0.467) | 0.978 (0.925, 0.997) | |
| glrlm_LongRunHighGrayLevelEmphasis_T3 vertebra | 0.761 (0.692, 0.829) | 0.000 (0.000, 0.038) | 1.000 (0.962, 1.000) | |
| gldm_LargeDependenceHighGrayLevelEmphasis_T8 vertebra | 0.577 (0.495, 0.658) | 0.309 (0.217, 0.412) | 0.989 (0.942, 1.000) | |
| glcm_Idn_spleen | 0.756 (0.687, 0.825) | 0.521 (0.416, 0.625) | 0.925 (0.853, 0.970) | |
| firstorder_Median_T1 vertebra | 0.788 (0.723, 0.853) | 0.989 (0.942, 1.000) | 0.032 (0.007, 0.090) | |
| gldm_LargeDependenceHighGrayLevelEmphasis_T5 vertebra | 0.582 (0.501, 0.663) | 0.362 (0.265, 0.467) | 0.936 (0.866, 0.976) | |
| gldm_SmallDependenceLowGrayLevelEmphasis_T7 vertebra | 0.619 (0.539, 0.699) | 0.277 (0.189, 0.378) | 1.000 (0.962, 1.000) | |
Table 2: Discriminative performance of the 20 chest CT radiomics features selected by mRMR for distinguishing patients with diabetes from healthy controls. For each feature, the area under the receiver operating characteristic curve (AUC), sensitivity, and specificity are reported with their 95% confidence intervals in parentheses. The 95% confidence intervals for AUC were calculated using the DeLong nonparametric method, whereas the 95% confidence intervals for sensitivity and specificity were calculated using the exact binomial method. T1–T11 denote the first through eleventh thoracic vertebrae. Feature names follow the PyRadiomics naming convention: gldm, gray-level dependence matrix; glcm, gray-level co-occurrence matrix; glrlm, gray-level run-length matrix; ngtdm, neighboring gray-tone difference matrix; firstorder, first-order statistics. mRMR, Max-Relevance and Min-Redundancy.
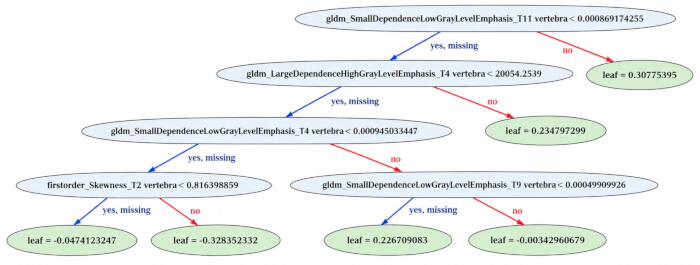
Figure 3. Representative decision tree from the XGBoost model. The diagram shows one decision tree within the XGBoost model. Internal nodes indicate feature-based splitting rules, branches indicate the resulting decisions, and terminal nodes indicate the corresponding leaf values. The final XGBoost prediction is obtained by aggregating the outputs across the boosted trees. Please click here to view a larger version of this figure.
SHAP was used to explain the XGBoost model (Figure 4). gldm_SmallDependenceLowGrayLevelEmphasis_T11, gldm_LargeDependenceHighGrayLevelEmphasis_T4, and glcm_Idmn_T8 showed the highest contributions to diabetes prediction in the SHAP analysis, followed by gldm_SmallDependenceLowGrayLevelEmphasis_T4 and ngtdm_Busyness_left scapula. All thoracic vertebrae except T3 contributed to the model.
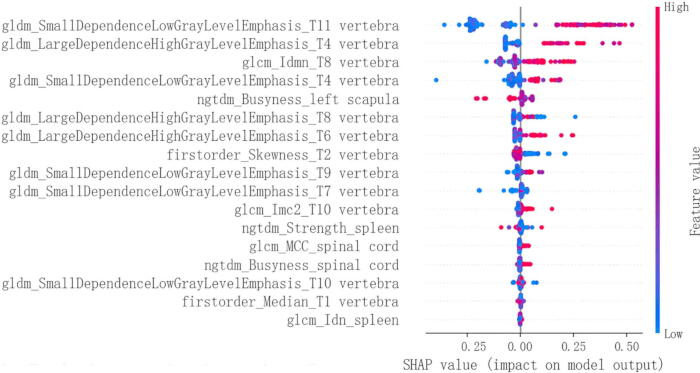
Figure 4. SHAP beeswarm plot for the XGBoost model. Each dot represents one participant. The x-axis indicates the SHAP value, representing the contribution of each feature to an individual prediction; positive values push the prediction toward diabetes, whereas negative values push the prediction toward the control class. Color indicates the feature value, from low (blue) to high (red). Features are ranked from top to bottom according to the mean absolute SHAP value. SHAP, Shapley Additive Explanations. Please click here to view a larger version of this figure.
HbA1c analysis
The Pearson correlation coefficients between HbA1c and the radiomics features ranged from −0.24 to 0.33. Features with |correlation coefficient| > 0.25 were used for HbA1c regression. Using multiple linear regression and XGBoost regression, the R2 values were 0.38 and 0.78, respectively. Both regression models were developed and evaluated on the same 100 patients with diabetes, and R2 was calculated between the predicted and measured HbA1c values for all 100 patients with diabetes.
In summary, 113 of the 1,767 chest CT radiomics features differed between patients with diabetes and healthy controls. The XGBoost model based on 17 selected features achieved AUCs of 1.00, 0.95, and 0.90 for the training, internal-validation, and external-test data, respectively. The T11, T4, and T8 vertebral texture features showed the highest contributions to diabetes prediction in the SHAP analysis.
Data Availability:
The processed numerical datasets underlying the radiomics, SHAP, correlation, and regression analyses are provided as supplementary files for editorial verification, together with the corresponding analysis scripts. The source participant-level clinical and imaging data cannot be shared publicly or submitted in de-identified form because of institutional privacy and ethical restrictions. These source data may be available subject to institutional approval and applicable ethical requirements upon reasonable request to the corresponding authors.
דיון
This study assessed diabetes-associated bone changes by establishing an interpretable machine-learning model based on chest CT radiomics and using SHAP to explain the model. The most important findings were as follows: 1) patients with diabetes and healthy controls differed in more than one hundred chest CT radiomics features; 2) the XGBoost model combining multiple CT features identified diabetes, with an AUC of 0.95 on the internal-validation data and 0.90 on the external-test data; and 3) the texture features of the thoracic vertebrae, particularly those of the T11, T4, and T8 vertebrae, showed the highest contributions to diabetes prediction in the SHAP analysis. Patients with diabetes are known to have decreased bone density17,18. However, early bone changes in patients with diabetes are difficult to detect with traditional CT reading of limited spatial resolution but might be revealed by bone CT radiomics. In this study, patients with diabetes and healthy controls differed in more than one hundred radiomics features, suggesting an association between diabetes and these imaging features. Our findings are consistent with recent studies that applied quantitative bone imaging to diabetic bone disease: Alagoz and Alani11 used cone-beam CT radiomics of the mandible to discriminate patients with type 2 diabetes, and Khadilkar et al.12 reported altered bone geometry and quality in type 2 diabetes mellitus using peripheral quantitative computed tomography. The present study extends this evidence to the axial skeleton—the thoracic vertebrae, scapulae, and sternum—which is routinely included in, but rarely analyzed from, chest CT examinations, and adds model-level interpretability by linking individual radiomics features to diabetes prediction through SHAP. To the best of our knowledge, this is the first study to combine automatic multi-structure chest CT radiomics with SHAP-based interpretation to study diabetes-associated bone changes.
XGBoost concatenates multiple weak learners, usually decision trees, through an additive model and forward stepwise optimization15. Through mechanisms such as L1/L2 regularization, leaf-node weight penalties, and tree-depth restrictions, it effectively controls model complexity. In this study, the XGBoost model established using 17 CT features achieved an AUC of 0.95 on the internal-validation data, which is comparable to the performance of XGBoost-based diabetes prediction reported in previous studies16. Most of the selected features were bone features, supporting an association between diabetes and bone CT radiomics features. The features with the highest contributions were gray-level dependence and co-occurrence texture features. The gray-level dependence matrix is a count matrix that stores information about the number and occurrence of “dependent” pixels for all pixel points in the image14,19. Intuitively, when the matrix is wider and the non-zero elements are concentrated on the right side, the texture of the original image is rougher because the width of the matrix is determined by the maximum number of “dependent” elements, and the elements on the right side of the matrix correspond to gray levels with a higher number of “dependent” elements. The neighboring gray-tone difference matrix describes grayscale variations in an image and quantifies texture by calculating the grayscale differences between neighboring pixels20. The co-occurrence matrix records the relationship between the gray levels of adjacent pixels; by calculating the probability of the spatial distribution of pixel pairs, the joint probability distributions can be represented in a matrix, from which the spatial correlation between pixels and, thereby, the texture of the image can be quantified. As a non-invasive method for studying tissue microstructure, CT radiomics is well suited to studying bone changes: osteoporosis associated with diabetes can lead to changes in the number and arrangement of bone trabeculae, which may ultimately manifest as changes in bone texture features on CT.
HbA1c is the product formed by the non-enzymatic reaction between hemoglobin in red blood cells and carbohydrates, mainly glucose, in serum. Its concentration is determined by past, rather than instantaneous, blood glucose levels and is independent of whether the patient is fasting, has injected insulin, or has taken hypoglycemic drugs before testing. HbA1c is generally believed to reflect the average blood glucose level over the past 8 to 12 weeks and is clinically used as a monitoring indicator of diabetes control21. In this study, HbA1c could be predicted from CT features. These findings suggest that chest CT radiomics may provide a quantitative and non-invasive tool for studying the association between glycemic control and bone quality. Some radiomics metrics may complement conventional blood-based glycated hemoglobin measurements and might offer auxiliary information for evaluating chronic glycemic control. However, CT-based features are not intended to replace blood tests for the diagnosis of diabetes.
The observed alterations in bone CT-derived radiomics features in patients with diabetes suggest measurable diabetes-associated differences in bone tissue beyond conventional bone metabolic markers. Bone CT radiomics provides a non-invasive imaging approach for capturing subtle bone microarchitectural and compositional changes associated with diabetes that may not be visible on routine visual image assessment. Machine-learning models built on bone CT radiomics features may facilitate the identification of individuals with diabetes-associated bone changes and support further investigation of these imaging characteristics. Because chest CT is widely performed, such an approach could, after further validation, allow opportunistic assessment of diabetes-associated bone changes from examinations acquired for other clinical indications and may help identify patients who could benefit from a dedicated bone quality evaluation. Thus, the main potential application of the present method is not the replacement of established blood-based diabetes testing but the extraction of additional quantitative information about diabetes-associated bone changes from routinely acquired chest CT examinations.
Other approaches can also be used to investigate diabetes-associated bone changes. The present findings are consistent with previous quantitative imaging studies using cone-beam CT radiomics of the mandible11 and peripheral quantitative computed tomography12, while the current approach evaluates multiple structures available on chest CT. Invasive bone biopsy was not performed for ethical reasons; therefore, the relationship between the observed radiomics features and pathological bone changes was not directly evaluated. Such relationships might be investigated in an animal model. Future studies should also compare the present approach with alternative interpretable machine-learning methods and investigate the longitudinal relationship between HbA1c and bone radiomics features. These complementary approaches could help determine the reproducibility and potential applications of chest CT radiomics for evaluating diabetes-associated bone changes.
This study has several limitations. First, the sample size was small to moderate, and the external-test cohort included only 50 participants; more cases should be collected in future studies. Second, the CT examinations were acquired on scanners from four manufacturers with slightly different acquisition parameters, although all features showed high ICC values and the external test supported the generalizability of the model. Third, the repeated feature–HbA1c correlation tests were exploratory, so the regression findings should be interpreted with caution. Fourth, invasive bone biopsy was not performed for ethical reasons; the bone CT features might be correlated with pathological findings in an animal model. Fifth, the clinical relevance of this study is limited because diabetes can be easily and reliably diagnosed through blood tests; the main value of the present approach lies in assessing diabetes-associated bone changes rather than diagnosing diabetes itself. Future studies should validate the framework in larger multicenter cohorts, compare the present approach with alternative interpretable machine-learning methods, investigate the longitudinal relationship between HbA1c and bone radiomics features, and further explore the clinical applications of opportunistic bone assessment on chest CT. In conclusion, the XGBoost model based on chest CT features identified diabetes in the internal-validation and external-test cohorts, and the texture features of the T11, T4, and T8 vertebrae showed the highest contributions to diabetes prediction in the SHAP analysis.
גילויים
Conflict of Interest:
The authors declare that they have no known competing financial interests or personal relationships that could have influenced the work reported in this manuscript.
Author Contributions:
Ting Li conceptualized and designed the study, wrote the main manuscript text, interpreted the data, and prepared all figure legends and tables. Nadeer M. Gharaibeh was responsible for data collection and management, software operation, and data processing. Yunfeng Han provided feasibility analysis, research methodology, software deployment, partial data processing, and final approval of the version to be published. Gang Wu provided financial support, project management and coordination, and project supervision and agreed to be responsible for all aspects of the work in addressing issues related to the accuracy or completeness of the work. All authors reviewed the manuscript.
תודות
This study was funded by the National Key R&D Program of China (No. 2024YFC2417700), the Hubei Provincial Health Science and Technology Project (No. WJ2025M136), and the Wuhan Central Hospital Horizontal Project (2025-021, No.140280).
חומרים
| שם | חברה | מספר קטלוג | הערות |
|---|---|---|---|
| 3D Slicer, version 5.8.3 | Brigham and Women's Hospital / Harvard Medical School | N/A | Open-source medical image computing platform used for automatic segmentation and radiomics feature extraction. [RRID:SCR_005619] |
| Anaconda | Anaconda, Inc. | N/A | Python distribution and package-management environment used for statistical analyses. [RRID:SCR_025572] |
| ComBat harmonization implementation | neurocombat_sklearn | N/A | Used to correct scanner/vendor batch effects. |
| CT scanner (GE) | GE Healthcare | N/A | Used for noncontrast chest CT at one of the four health check-up centers. |
| CT scanner (Philips) | Philips Healthcare | N/A | Used for noncontrast chest CT at one of the four health check-up centers. |
| CT scanner (Siemens) | Siemens Healthineers | N/A | Used for noncontrast chest CT at one of the four health check-up centers. |
| CT scanner (United Imaging) | United Imaging Healthcare Co., Ltd. | N/A | Used for noncontrast chest CT at one of the four health check-up centers. |
| Dedicated workstation | N/A (custom-assembled) | N/A | Used for automatic segmentation and radiomics feature extraction from chest CT data. |
| Glycated hemoglobin (HbA1c) assay | Hospital clinical laboratory | Tosoh G8 system (0290010) | Tosoh G8 Analyzer using ion-exchange high-performance liquid chromatography; used to measure HbA1c levels in patients with diabetes. |
| LASSO (least absolute shrinkage and selection operator) | scikit-learn | N/A | Regularization and feature-selection method used to further select features after mRMR for XGBoost model development. |
| mRMR (Max-Relevance and Min-Redundancy) | N/A | N/A | Feature-selection method used to select 20 radiomics features for diabetes prediction. |
| NVIDIA GeForce RTX 4090 GPU | NVIDIA Corporation | N/A | Graphics processing unit installed in the dedicated workstation for automatic segmentation and radiomics feature extraction. |
| PyRadiomics, version 3.0.1 | AIM-Harvard (Radiomics Consortium) | N/A | Radiomics implementation used with 3D Slicer to extract radiomics features. [RRID:SCR_018379] |
| Python, version 3.11 | Python Software Foundation | N/A | Programming language used for statistical analysis and machine-learning model development. [RRID:SCR_008394] |
| scikit-learn, version 1.9.1 | scikit-learn developers | N/A | Machine-learning library used for feature selection, data partitioning, and statistical/modeling analyses. [RRID:SCR_002577] |
| SciPy / statsmodels | SciPy / statsmodels developers | N/A | Python libraries used for statistical analyses. [RRID:SCR_008058] |
| SHAP, version 0.39.0 | SHAP developers | N/A | Explainable machine-learning library used to determine the contribution of individual radiomics features to XGBoost predictions. |
| TotalSegmentator, version 2.5.0 | University Hospital Basel / TotalSegmentator developers | N/A | Deep learning-based automatic segmentation tool used to segment the T1–T11 vertebrae, bilateral scapulae, sternum, liver, spleen, bilateral deep back muscles, and spinal cord from chest CT images. |
| XGBoost, version 3.4.1 | Distributed Machine Learning Community (DMLC) | N/A | Extreme gradient boosting library used to establish the diabetes prediction model and perform XGBoost regression. |
מקורות
- Marcus CD, et al. MR imaging of osteomyelitis and neuropathic osteoarthropathy in the feet of diabetics. Radiographics. 1996;16(6):1337-1348. doi:10.1148/radiographics.16.6.8946539
- Dubský M, et al. Charcot foot disease: a new approach. Drugs Aging. 2025;42(9):837-851. doi:10.1007/s40266-025-01234-0
- Petrova NL, Edmonds ME. A prospective study of calcaneal bone mineral density in acute Charcot osteoarthropathy. Diabetes Care. 2010;33(10):2254-2256. doi:10.2337/dc10-0636
- Yan W, Li X. Impact of diabetes and its treatments on skeletal diseases. Front Med. 2013;7(1):81-90. doi:10.1007/s11684-013-0243-9
- Al Sawy ER, Saber MM, Nassar NN, Sayed NSE. Targeting TREM-1 receptors with metformin and pravastatin modulate monosodium iodoacetate-induced osteoarthritis. Inflammopharmacology. 2025;33(5):2737-2748. doi:10.1007/s10787-025-01738-6
- Pan F, et al. Metformin for knee osteoarthritis in patients with overweight or obesity: a randomized clinical trial. JAMA. 2025;333(20):1804-1812. doi:10.1001/jama.2025.3471
- Kissler HJ, et al. High insulin and low IGF-I plasma levels following pancreas transplantation in rats. Implications for bone and mineral metabolism. Scand J Clin Lab Invest. 2000;60(3):175-187. doi:10.1080/003655100750044820
- Pop-Busui R, et al. Diabetic neuropathy: a position statement by the American Diabetes Association. Diabetes Care. 2017;40(1):136-154. doi:10.2337/dc16-2042
- Roy B. Pathophysiological mechanisms of diabetes-induced macrovascular and microvascular complications: the role of oxidative stress. Med Sci (Basel). 2025;13(3):87. doi:10.3390/medsci13030087
- Wang Y, et al. Association between arterial stiffness and bone microarchitectural deterioration in type 2 diabetes: a cross-sectional study. J Diabetes. 2025;17(12):e70181. doi:10.1111/1753-0407.70181
- Alagoz E, Alani H. Evaluation of mandibular bone in patients with type 2 diabetes mellitus using cone-beam computed tomography-based radiomics. Oral Surg Oral Med Oral Pathol Oral Radiol. 2026;141(6):866-874. doi:10.1016/j.oooo.2026.01.015
- Khadilkar AV, et al. Altered bone geometry and quality in type 2 diabetes mellitus: insights from peripheral quantitative computed tomography in an Indian cohort. J Pharm Bioallied Sci. 2025;17(Suppl 5):S3624-S3626. doi:10.4103/jpbs.jpbs_1601_25
- Wasserthal J, et al. TotalSegmentator: robust segmentation of 104 anatomic structures in CT images. Radiol Artif Intell. 2023;5(5):e230024. doi:10.1148/ryai.230024
- Zwanenburg A, et al. The Image Biomarker Standardization Initiative: standardized quantitative radiomics for high-throughput image-based phenotyping. Radiology. 2020;295(2):328-338. doi:10.1148/radiol.2020191145
- El Sherbiny MM, et al. An XGBoost-based predictive framework for diabetes mellitus multi-classification. Sci Rep. 2026;16(1):25519. doi:10.1038/s41598-026-65844-3
- Rafie Z, et al. Leveraging XGBoost and explainable AI for accurate prediction of type 2 diabetes. BMC Public Health. 2025;25(1):3688. doi:10.1186/s12889-025-24953-w
- Liu Q, et al. The hyperglycemia and hyperketonemia impaired bone microstructures: a pilot study in rats. Front Endocrinol (Lausanne). 2020;11:590575. doi:10.3389/fendo.2020.590575
- Brehler M, et al. Robust quantitative assessment of trabecular microarchitecture in extremity cone-beam CT using optimized segmentation algorithms. Proc SPIE Int Soc Opt Eng. 2018;10578:105781J. doi:10.1117/12.2293346.
- Wahba MA, et al. A novel cumulative level difference mean based GLDM and modified ABCD features ranked using eigenvector centrality approach for four skin lesion types classification. Comput Methods Programs Biomed. 2018;165:163-174. doi:10.1016/j.cmpb.2018.08.009
- Garaba A, et al. Radiomics for differentiation of gliomas from primary central nervous system lymphomas: a systematic review and meta-analysis. Front Oncol. 2024;14:1291861. doi:10.3389/fonc.2024.1291861
- Kalyani RR, Neumiller JJ, Maruthur NM, Wexler DJ. Diagnosis and treatment of type 2 diabetes in adults: a review. JAMA. 2025;334(11):984-1002. doi:10.1001/jama.2025.5956
הדפסות חוזרות והרשאות
מאמר זה פורסם
הסרטון יגיע בקרוב