Il saggio sull'alluvione delle piantine facilita lo screening rapido delle adesioni di pomodoro selvatico per la resistenza al batterio delle siringhe Pseudomonas. Questo test, utilizzato in combinazione con il test della crescita batterica delle piantine, può aiutare a caratterizzare ulteriormente la resistenza sottostante al batterio e può essere utilizzato per lo screening delle popolazioni di mappatura per determinare la base genetica della resistenza.
È richiesta un abbonamento a JoVE per visualizzare questo contenuto. Accedi o inizia la tua prova gratuita.
Articolo metodologico
Identificazione ad alto contenuto di velocità effettiva della resistenza a Pseudomonas syringae pv. Pomodoro nel pomodoro utilizzando Seedling Flood Assay
In questo articolo
Avviso di errata corrige
Important: There has been an erratum issued for this article. View Erratum Notice
Sommario
Abstract
Il pomodoro è una coltura agronomicamente importante che può essere infettata da Pseudomonas siringae, un batterio Gram-negativo, con conseguente malattia del speck batterico. Il pomodoroP. siringa e pv. il sistema di patosistema del pomodoro è ampiamente usato per sezionare la base genetica delle risposte innate delle piante e della resistenza alle malattie. Mentre la malattia è stata gestita con successo per molti decenni attraverso l'introduzione del cluster genico Pto/Prf dal pimpinellifolium di Solanum al pomodoro coltivato, i ceppi di razza 1 di P. siringae si sono evoluti per superare la resistenza conferita dal cluster genico Pto/Prf e si verificano in tutto il mondo.
Le specie di pomodoro selvatico sono importanti serbatoi di diversità naturale nel riconoscimento dei patogeni, perché si sono evoluti in ambienti diversi con diverse pressioni dei patogeni. Negli schermi tipici per la resistenza alle malattie nel pomodoro selvatico, vengono utilizzate piante adulte, che possono limitare il numero di piante che possono essere sottoposte a screening a causa del loro tempo di crescita prolungato e dei maggiori requisiti di spazio di crescita. Abbiamo sviluppato un metodo per vagliare le piantine di pomodoro vecchie di 10 giorni per la resistenza, che riduce al minimo il tempo di crescita delle piante e lo spazio della camera di crescita, consente un rapido ricambio delle piante e consente di testare grandi dimensioni del campione. Gli esiti delle piantine di sopravvivenza o di morte possono essere trattati come fenotipi discreti o su una scala di resistenza definita dalla quantità di nuova crescita nelle piantine sopravvissute dopo l'inondazione. Questo metodo è stato ottimizzato per lo screening di piantine di pomodoro vecchie di 10 giorni per la resistenza a due ceppi di siringhe P. e può essere facilmente adattato ad altri ceppi di siringhe P.
Introduzione
Pseudomonas syringae è un batterio patogeno Gram-negativo che infetta una vasta gamma di ospiti vegetali. I batteri entrano nella pianta ospite attraverso gli stomi o le ferite fisiche e proliferano nell'apoplasta1. Le piante hanno sviluppato una risposta immunitaria a due livelli per proteggersi dalle infezioni da agenti patogeni batterici. Il primo livello si verifica sulla superficie delle cellule vegetali, dove i recettori di riconoscimento dei pattern sulla membrana cellulare vegetale percepiscono modelli molecolari associati a i patogeni altamente conservati (PPAM) in un processo chiamato immunità innescata da PAMP (PTI)2. Durante questo processo, la pianta ospite upregulate i percorsi di risposta della difesa, tra cui la deposizione di callosi alla parete cellulare, la chiusura degli stomi, la produzione di specie reattive dell'ossigeno e l'induzione di geni patogeni-correlati.
I batteri possono superare la PTI utilizzando un sistema di secrezione di tipo III per fornire proteine, chiamate efcontadini, direttamente nella cellula vegetale3. Le proteine acchettori sono comunemente destinate ai componenti della PTI e promuovono la virulenza patogena4. Il secondo livello di immunità vegetale si verifica all'interno della cellula vegetale dopo il riconoscimento delle proteine eftraificatori. Questo riconoscimento dipende dai geni di resistenza, che codificano il sito legante nucleotide che contiene i recettori (NLR). Gli NLR sono in grado di riconoscere direttamente gli eftori o di riconoscere la loro attività su un bersaglio di virulenza o esca5. Quindi innescano una risposta immunitaria secondaria in un processo chiamato immunità attivata dagli effetti (ETI), che è spesso associata a una risposta ipersensibile (HR), una forma di morte localizzata delle cellule nel sito di infezione6. A differenza della resistenza gene-per-gene associata all'ETI, le piante possono presentare una resistenza quantitativa parziale, che dipende dal contributo di più geni7.
P. syringae pv. pomodoro (Pst) è l'agente causale di speck batterico sul pomodoro ed è un problema agricolo persistente. ceppi predominanti nel campo sono stati tipicamente Pst gara 0 ceppi che esprimono uno o entrambi gli effetti di tipo III AvrPto e AvrPtoB. DC3000 (PstDC3000) è un ceppo di razza 0 rappresentativo e un patogeno modello che può causare speck batterico nel pomodoro. Per combattere la malattia del cela batterico, gli allevatori hanno introretto il Pto [P. syringae pv. tomato]/Prf [ Resistenza al piatto e sensibilità alfenthion] cluster genico della specie di pomodoro selvatico Solanum pimpinellifolium nelle moderne cultivar8,9. Il gene Pto codifica una chinasi della proteina serine-threonine che, insieme alla Prf NLR, conferisce resistenza a PstDC3000 attraverso il riconoscimento degli effetti AvrPto e AvrPtoB10,11,12,13,14. Tuttavia, questa resistenza è inefficace contro le ceppi emergenti di gara 1, consentendo la loro rapida e aggressiva diffusione negli ultimi anni15,16. Gara 1 sforza eludere il riconoscimento da parte del cluster Pto / Prf, perché AvrPto è o perso o mutato in questi ceppi, e AvrPtoB sembra accumulare almeno15,17,18.
Le popolazioni di pomodori selvatici sono importanti serbatoi di variazione naturale per la resistenza Pst e sono stati precedentemente utilizzati per identificare i loci di resistenza potenziale19,20,21. Tuttavia, gli schermi attuali per la resistenza agli agenti patogeni utilizzano piante adulte di 4-5 settimane20,21. Pertanto, sono limitati dal tempo di crescita, spazio camera di crescita, e dimensioni del campione relativamente piccole. Per affrontare i limiti degli approcci convenzionali, abbiamo sviluppato un saggio di resistenza al pomodoro P. siringa ad alto contenuto di velocità utilizzando piantine di pomodoro di 10 giorni22. Questo approccio offre diversi vantaggi rispetto all'utilizzo di piante per adulti: vale a dire, tempi di crescita più brevi, requisiti di spazio ridotti e maggiore produttività. Inoltre, abbiamo dimostrato che questo approccio ricapitola fedelmente i fenotipi di resistenza alle malattie osservati nelle piante adulte22.
Nell'alluvione delle piantine descritta in questo protocollo, le piantine di pomodoro vengono coltivate su piatti Petri di sterili supporti Murashige e Skoog (MS) per 10 giorni e poi vengono inondate da un inoculum contenente i batteri di interesse e un surfactant. In seguito alle inondazioni, le piantine possono essere valutate quantitativamente per la resistenza alle malattie attraverso saggi di crescita batterica. Inoltre, la sopravvivenza delle piantine o la morte possono agire come una resistenza discreta o fenotipo della malattia 7–14 giorni dopo l'inondazione. Questo approccio offre un'alternativa ad alto valore effettiva per lo screening di un gran numero di ascese di pomodoro selvatico per la resistenza ai ceppi Pst race 1, come il ceppo Pst T1 (PstT1), e può essere facilmente adattato ad altri ceppi batterici di interesse.
Accesso limitato. Accedi o avvia una prova gratuita per visualizzare questo contenuto.
Protocollo
1. Preparazione e utilizzo del gabinetto di biosicurezza
- Pulire l'armadietto della biosicurezza con il 70% di etanolo.
- Chiudere la fascia e accendere la luce ultravioletta nell'armadietto della biosicurezza per 15 min.
- Dopo 15 min, spegnere la luce ultravioletta nell'armadio di biosicurezza. Sollevare la fascia e accendere il rimbalzo per 15 min.
- Pulire tutti gli elementi da utilizzare nell'armadio di biosicurezza con il 70% di etanolo prima di inserirle nell'armadio sterilizzato.
- Pulire i guanti o le mani nude con il 70% di etanolo prima di lavorare nell'armadietto della biosicurezza.
- Lavori al centro dell'armadio di biosicurezza, lontano dal gonfiere.
- Utilizzare bottiglie non aperte di autoclaved sterile 10 mM MgCl2 e ultrapure H2O per gli esperimenti. Mettere le bottiglie nell'armadio di biosicurezza e aprirle solo nell'armadio sterilizzato per la biosicurezza, non sul piano della panca.
- Utilizzare pipette di vetro dedicate e punte pipette per lavorare nell'armadio sterilizzato per la biosicurezza. Assicurarsi che questi siano aperti solo nell'armadio di biosicurezza, mai sul banco.
- Dopo l'uso dell'armadio di biosicurezza, autoclatura tutti i rifiuti (tranne i rifiuti di candeggina) e pulire la superficie con 70% di etanolo.
2. Preparazione dei supporti dell'impianto
- Pesare e sciogliere i sali basali 0,5x MS in ultrapure H2O. Pesare 0,8% di agar baccello e poi aggiungere al disciolto 0,5x MS.
- Autoclave e lasciare che il supporto a raffreddare in bagnodum d'acqua a 50 gradi centigradi per 1 h prima di versare o pipettare.
- Per garantire che le piastre non siano sovraccaricate, contrassegnare le piastre sterili monouso in polistirolo 100 x 25 mm ad un livello di riempimento di 40 mL. Versare i supporti in piastre sterili da 100 x 25 mm in un armadio sterilizzato per la biosicurezza.
3. Preparazione dei materiali vegetali e delle condizioni di crescita
- Mettere i semi di pomodoro in un tubo di microcentrifuga da 2,2 ml e aggiungere 2,0 mL del 50% di soluzione di candeggina.
- Rocciare il tubo su un rocker per 25 min.
- Dopo 25 minuti, togliere i semi dal rocker e rimuovere la soluzione di candeggina con una pipetta nell'armadietto sterile di biosicurezza. Assicurarsi che tutta la candeggina venga rimossa.
- Aggiungere 2 mL di sterile ultrapure H2O per lavare i semi. Invertire il tubo 5x.
- Rimuovere il liquido dal tubo con una pipetta.
- Ripetere i passaggi da 3,3 a 3,5 per lavare i semi 4 volte di più.
- Aggiungere 2 mL di sterile ultrapure H2O e versare i semi in un piatto Petri sterile vuoto.
- La fiamma forza l'etanolo e lascia raffreddare prima del trasferimento e distanziare uniformemente i semi su piastre da 100 x 25 mm contenenti supporti agar 0,5x S - 0,8%.
- Trasferire i semi 5-7 in una linea al centro di una piastra e sigillare i bordi delle piastre con nastro chirurgico (1,25 cm x 9,1 m).
- Stratificate i semi sterilizzati a 4 gradi centigradi al buio per almeno 3 giorni per sincronizzare la germinazione. Assicurarsi che i piatti siano impilati piatti e a faccia in su, in modo che i semi non si spostino sul piatto.
- Orientare verticalmente le piastre in modo che le radici crescano lungo la superficie della piastra, con la linea di semi orientati orizzontalmente, durante il trasferimento alla camera di crescita.
NOTA: Impostare la camera di crescita a 22 gradi centigradi e fornire 16 h di luce ad un'intensità di luce di 200-220 metri-2 s-1 e 8 h di oscurità. - Prima delle inondazioni, coltivare piantine per 10 giorni nella camera di crescita a quel punto le piantine in genere mostrano completamente emerso e cotyledons espanso e emergenti prime foglie vere (Figura 1).

Figura 1: Fase di sviluppo delle tipiche piantine di pomodoro di 10 giorni. I semi di pomodoro Rio Grande -PtoR sono stati sterilizzati, placcati e stratificati per almeno 3 giorni al buio a 4 gradi centigradi. Le piantine sono state coltivate su piastre MS 0,5x per 10 giorni a 22 gradi centigradi prima di essere allagate. Tipicamente, a 10 giorni i cotiledoni sono completamente espansi, e le prime foglie vere stanno cominciando ad emergere. Fare clic qui per visualizzare una versione più grande di questa figura.
4. Preparazione del supporto King's B23 (KB)
- Riempire il becher con 500 mL di ultrapure H2O e mescolare su una piastra di mescolare.
- Sciogliere completamente 20 g di bacto peptone, 1,5 g di anidro K2HPO4e 12,5 mL di glicerolo in un becher con ultrapure H2O.
- Versare la miscela disciolta in un cilindro graduato 1 L e portare fino a un volume finale di 1 L con ultrapure H2O.
- Versare nuovamente il brodo nel bicchiere e mescolare fino a quando non viene mescolato.
- Pesare 7,5 g di bacto agar in due bottiglie di vetro da 500 mL e aggiungere 500 mL di brodo KB dal punto 4.4 in ogni bottiglia. Autoclave per 20 min.
- Togliere le bottiglie dall'autoclave e girare delicatamente per distribuire l'agar.
- Trasferire le bottiglie a un bagno d'acqua di 50 gradi centigradi per 1 h.
- Dopo 1 h, trasferire la bottiglia nell'armadietto della biosicurezza e in condizioni asettiche, aggiungere 1.600 L di sterile 1 M MgSO4e antibiotici appropriati ai media.
NOTA: Per i ceppi resistenti al rifampicin PstDC 3000 e PstT1, utilizzare rifampicina disciolto in dimetilformamide ad una concentrazione finale di 50 g/mL. Usare il ciclooheximide disciolto nell'etanolo ad una concentrazione finale di 50 g/mL per prevenire la crescita fungina sulle piastre. - Ruotare delicatamente il supporto per mescolare e poi versare per coprire il fondo delle piastre.
- Lasciare che almeno 1 h per solidificare le piastre prima di riporle a testa in giù a 4 gradi centigradi.
5. Manutenzione di ceppi batterici e condizioni di coltura
- Mantenere uno stock di glicerolo da una singola colonia di batteri come 1 mL di coltura batterica satura e 333 -L di sterile 80% glicerolo a -80 gradi centigradi.
- Patch batteri (ad esempio, PstT1) da uno stock di glicerolo su kb agar con antibiotici appropriati (sezione 4).
- Lasciare che i batteri si riprendano per 2 giorni a 28 gradi centigradi prima di striatura di batteri freschi su agar KB selettivo utilizzando uno stuzzicadenti sterile e piatto.
- Streak batteri freschi dal brodo di glicerolo su appropriato agar meno selettivo KB utilizzando uno stuzzicadenti piatto e sterile.
NOTA: Assicurarsi che il brodo di glicerolo patchato non abbia più di 2 settimane. - Per il PstDC3000, incubare la piastra KB a 28 gradi centigradi per 24 h prima di utilizzare i batteri nell'esperimento di alluvione.
- Per PstT1, incubare la piastra KB a 28 gradi centigradi per 48 h prima di utilizzare i batteri nell'esperimento di alluvione.
6. Preparazione del PstT1 inoculum
- Risospendere apposta i batteri nello sterile MgCl2 da 10 mM a una densità ottica a 600 nm (OD600)di 0,1, o circa 5 x 10⁷ unità formanti colonie (CFU)/mL).
- Eseguire diluizioni seriali utilizzando sterile 10 mM soluzione MgCl2 nell'armadio biosicurezza. Per PstT1, utilizzare uno spettrofotometro per fare inoculum con una concentrazione iniziale di OD600 - 0.1.
- Per PstT1, effettuare una diluizione di 1/10 dalla sospensione iniziale a OD600 x 0,1 per ottenere una diluizione seriale ad una concentrazione di OD600 x 0,01.
- Utilizzando la diluizione seriale a OD600 - 0,01 dal passaggio 6.3, effettuare una diluizione 3/4 per ottenere un OD600 finale - 0,0075.
- Fare una diluizione di 1/10 di copolimero surfactant organosilicone non-ionico C13H34O4Si3 (cioè, surfactant) in 10 mM MgCl2 e vortice per 15 s. Aggiungere lo stock di surfactant 1/10 all'ultima diluizione seriale (OD600 x 0,0075) ad una concentrazione finale di 0,015% e ben turbina per mescolare.
7. Preparazione di PstDC3000 inoculum
- Risospendere i batteri in uno sterile 10 mM MgCl2 a una densità ottica a 600 nm (OD600) di 0,1 (circa 5 x 10⁷ CFU/mL).
- Eseguire diluizioni seriali utilizzando sterile 10 mM soluzione MgCl2 nell'armadio biosicurezza. Per PstDC3000, utilizzare uno spettrometro per effettuare l'inoculum con una concentrazione iniziale di OD600 - 0,1.
- Per PstDC3000, effettuare una diluizione di 1/10 dalla sospensione iniziale a OD600 x 0,1 per ottenere una diluizione seriale a una concentrazione di OD600 x 0,01.
- Utilizzando la diluizione seriale a OD600 - 0,01 dal passaggio 3, effettuare una diluizione di 1/2 per ottenere un OD600 finale - 0,005.
- Effettuare una diluizione di 1/10 di surfactant in 10 mM MgCl2 e vortice per 15 s. Aggiungere il brodo 1/10 di surfactant all'ultima diluizione seriale (OD600 x 0,005) ad una concentrazione finale dello 0,015% e far lassazione ben per mescolare.
8. Metodo di inondazione di piantine di pomodoro
- Prendere le piastre con le piantine di 10 giorni fuori dalla camera di crescita e mettere nel mobile biosicurezza per preparare le piastre per le inondazioni.
- Rimuovere il nastro chirurgico da due piastre.
- Impostare un timer per 3 min. Misurare 6 mL di inoculo finale (PstT1 OD600 - 0.0075 [sezione 6] o PstDC3000 OD600 - 0.005 [sezione 7]) e trasferire 6 mL di inoculum a ogni piastra con le piantine di 10 giorni.
- Spingere delicatamente le piantine verso il basso nell'inoculum con una punta sterile pipetta. Avviare il timer.
- Tenere un piatto in ogni mano. Inclinare la parte anteriore della piastra verso il basso per accumulare inoculum e principalmente immergere i cotiledoni e le foglie delle piantine.
- Swish lato a lato 5-7x e poi ribaltare le piastre per coprire le radici e l'intero piatto.
- Inclinare nuovamente le piastre per sommergere i cotiledoni e le foglie, e ripetere per un totale di 3 min.
- Versare l'inoculum dalle piastre, impostare le piastre su una superficie piana e poi versare qualsiasi inoculum residuo una seconda volta.
- Riavvolgere le piastre con nastro chirurgico e ripetere i passaggi da 8,2 a 8,8 per tutte le piastre rimanenti.
- Reincubare le piastre nella camera di crescita (vedere il passo 3.11 NOTA) dopo che tutte le piastre sono state allagate.
- Fenotipo dopo 7-10 giorni per PstDC3000 o 10–14 giorni per PstT1 (sezione 11). Se si eseguono saggi di crescita batterica, raccogliere il tessuto fogliare dopo 4 giorni (sezioni 9 e 10) e quindi fenotipo (sezione 11). In alternativa, eseguire analisi fenotipiche e saggi di crescita batterica su serie separate di piante.
9. sterilizzazione superficiale dei cotiledoni per il saggio sulla crescita batterica
- Quattro giorni dopo l'inondazione e la ricubatura delle piantine nella camera di crescita (sezione 8), rimuovere le piastre con le piantine di pomodoro dalla camera di crescita.
- Numerare le singole piantine sull'esterno inferiore della piastra dove la piacina si attacca alla piastra per ogni genotipo.
- Etichettare i tubi di microcentrifuga sterili da 1,5 ml con i singoli numeri di semimortaere e utilizzare pinze pulite per far cadere un borosilicate sterile da 3 mm in ogni tubo per l'uso con un battitore di perline. (Vedere NOTA nel passaggio 10.1.)
- Pipette 200 -L di 10 mM MgCl2 in ogni tubo e tubi vicini.
- Preparare il 70% di etanolo e versare 100 mL in un becher pulito. Versare 100 mL di puro e sterile H2O in un becher separato e pulito.
- Pinze dritte a punta dritta in acciaio inossidabile con punte seghettate con etanolo. Aprire leggermente la piastra per consentire la rimozione asettica di un cotileno con le pinze pulite.
- Pizzica il picciolo alla base del cotileno per rimuovere una foglia e cadere nel becher con 70% di etanolo per sterilizzare la superficie per 10 s. Sinse il cotileno in ultrapure H2O per 10 s.
- Mettere il cotiledone su un tovagliolo di carta e asciugare con delicate salviette scientifiche.
- Pesare individualmente ogni cotiledon dopo la sterilizzazione della superficie e gonfiare, e registrare il peso.
- Collocare il cotileno in un tubo di microcentrifuga da 1,5 ml precedentemente preparato (dai passi 9.3 e 9.4) etichettato con il genotipo e il numero individuale corrispondenti.
- Ricucire le piastre con nastro sterile e incubare nuovamente le piantine nella camera di crescita (vedere il passaggio 3.11 NOTA).
10. Saggio sulla crescita batterica
- Utilizzando campioni dal passo 9.10, omogeneizzare il tessuto utilizzando il battitore di perline in 10 mM MgCl2 per 1–2 min. Se il tessuto non è adeguatamente macerato, omogeneizzare di nuovo.
NOTA: Molti produttori producono omogeneizzatori battitori di perline. Il numero e il tipo di perline, così come il tempo di omogeneizzazione e la velocità (se programmabile) dovrebbero essere ottimizzati per ogni tipo di omogeneizzatore. Assicurarsi che i campioni non si surriscaldino durante l'omogeneizzazione. - Aggiungere 800 L di 10 mM MgCl2 ad ogni tubo contenente tessuto macerato dal punto 10.1 e invertire più volte per mescolare.
- Preparare le diluizioni seriali per ogni campione in MgCl2 da 10 mM in 96 po' (100, 10-1, 10-2, 10-3, 10-4, 10-5) utilizzando una pipetta multicanale (Figura 2A).
- Pipette 5 - L da ogni serie di diluizione utilizzando una pipetta multicanale su una piastra di agar KB (150 mm x 15 mm) con cicloloeximide e selezione appropriata per il ceppo batterico di interesse (vedere passo 4.8 NOTA). Lasciare asciugare completamente i piatti.
- Incubare la piastra a testa in giù a 28 gradi centigradi per 36 h, quindi visualizzare (Figura 2B) le colonie sulle piastre utilizzando un microscopio sezionato per determinare se le colonie sono abbastanza grandi da contare.
NOTA: Se le colonie non sono abbastanza grandi, re-incubare le piastre e ricontrollare le dimensioni delle colonie ogni poche ore. Tipicamente, le colonie sono numerabili 36-48 h dopo l'incubazione.

Figura 2: Diluizioni seriali per saggi di crescita batterica di piantine. (A) Il tessuto fogliare macerato delle piante infette viene diluito prima del conteggio delle cozze. Le diluizioni vengono eseguite in una piastra di 96 po '(100 non è diluita). Tipicamente, le diluizioni sono fatte da 10-1 a 10-5. (B) Diluizioni di placcatura per i conteggi delle colonie batteriche. Un totale di 5 -L di ogni colonna della serie di diluizione è placcato, dalla più diluita alla più concentrata. Dopo che le colonie si sono completamente asciugate, la piastra viene incubata a 28 gradi centigradi per 36-48 h. Le colonie vengono contate al microscopio 10x di dissetazione. Fare clic qui per visualizzare una versione più grande di questa figura.
- Contare le colonie al microscopio dissetante prima che si uniscano (Figura 2B). Conta le colonie delle piastre della serie di diluizione con meno di 100 colonie.
- Dopo aver ottenuto conteggi di colonia (Figura 2B), normalizzare i conteggi a 0,01 g di tessuto per le piantine e convertire in crescita batterica di tronchi (Tabella 1).
NOTA: La massa media di un Moneymaker-PtoS cotyledon è di 0,01 g ed è empiricamente determinata22.
| Genotipo1 Colonna A | Peso del tessuto (g) Colonna B | N. di colonie in una colonna spot C | Fattore di diluizione per spot2 Colonna D | Regolato il numero di colonie3 Colonna E | Fattore di diluizione per la diluizione seriale Colonna F | Totale n. di Colonie Colonna G (cfu/0.01 g)4 | Media n. di colonie (cfu/0,01 g) Colonna H | Crescita media del registro (cfu/0,01 g (registro10))Colonna I |
| Esempio 1 | 0,004 g | 10 | 200 | calcolato come: (C2 x 0,01 g) / B2 | 1000 | calcolato come: (D2 x E2 x F2) | media per il campione da 1 all'ultimo campione: (cioè media G1:G3) - 7000000 | registro della media cioè. log(H2) : 6,85 |
| Esempio 2 | 0,003 g | 15 | 200 | 50 | 1000 | 10000000 | ||
| Esempio 3 | 0,002 g | 6 | 200 | 30 | 1000 | 6000000 | ||
| 1 : il nome del Dati mostrati per 3 campioni | ||||||||
| 2 Il nome del sistema A base di placcatura 5 X X 200 per 1 mL | ||||||||
| 3 (COM del nome I cotiledoni sono troppo piccoli per il nucleo, quindi i conteggi delle cozze sono stati normalizzati a 0,01 g di tessuto in base alla massa media di un cotileno MoneyMaker-PtoS (dati non mostrati) | ||||||||
| 4 DEL psu' Regolato per mL in base al volume placcato | ||||||||
Tabella 1: Esempi di calcoli per il saggio di crescita batterica delle piantine. I calcoli dei campioni illustrano come normalizzare i conteggi batterici e determinare la crescita batterica del log.
- Per le adesioni selvatiche e altre linee con sfondi genetici complessi, correla il livello di crescita batterica nelle singole piantine con il loro fenotipo come descritto nella sezione 11.
11. Fenotipizzazione per resistenza
- Rimuovere le piastre dalla camera di crescita e le singole piantine fenotipi che per la morte (a causa della malattia) o la sopravvivenza (a causa della resistenza) dopo 7-14 giorni.
- Le piante fenotipiche sono state infettate da un ceppo altamente virulento come il PstDC3000 precedente, a 7-10 giorni dopo l'inoculazione alluvionale.
- Piante fenotipiche infettate da PstT1 a 10-14 giorni dopo l'inoculazione dell'alluvione.
- Determinare un sistema di punteggio basato sulla gamma di fenotipi di resistenza osservati. Fenotipi binari record per cultivar, linee isogeniche e adesioni selvatiche con fenotipi di resistenza coerenti, forti e intermedi (Figura 4A, 4B).
- Se la piantina mostra una nuova crescita dal meristem apicale entro il lasso di tempo per la fenotipizzazione, contarlo come una sopravvivenza. Se la piacità ha un meristem apicale marrone e non mostra alcuna nuova crescita vegetativa verde, contarlo come un decesso (Figura 3).

Figura 3: Rappresentazione schematica di una piantità di pomodoro. Sono raffigurate diverse parti di una piantina di pomodoro, tra cui l'ipocotilo, il cotiledone, l'epicotipo, il meristem apicale e le foglie vere. Fare clic qui per visualizzare una versione più grande di questa figura.
- Registrare i fenotipi su uno spettro di malattia per le popolazioni, come le popolazioni di mappatura F2, con una vasta gamma di fenotipi di resistenza (Figura 4C).
- Monitorare attentamente le piantine per la comparsa dei sintomi della malattia e la morte per identificare la finestra appropriata per la fenotipizzazione.
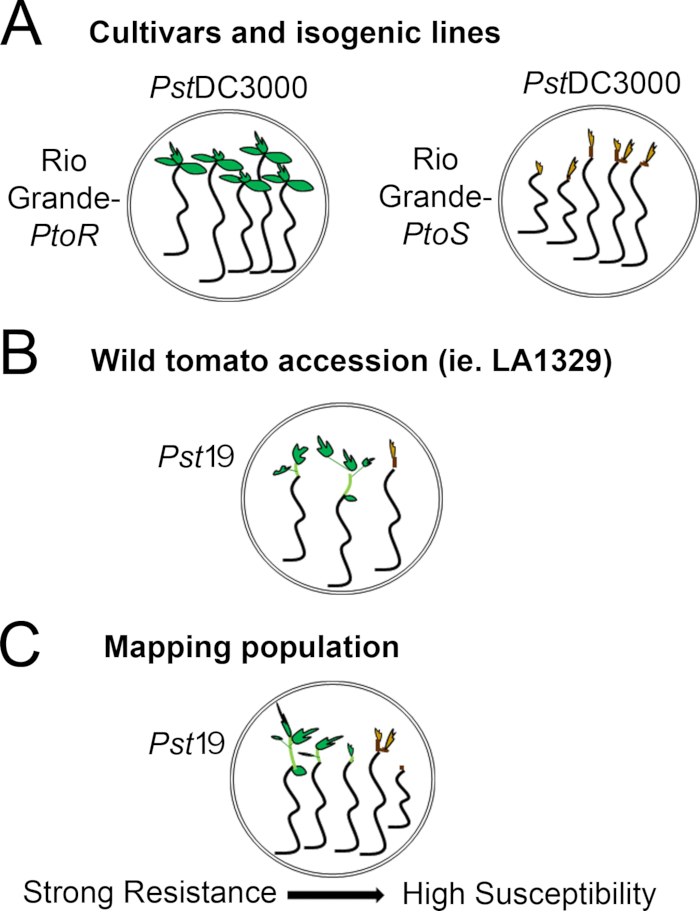
Figura 4: Rappresentazione schematica dei fenotipi attesi per la resistenza e la morte delle piantine in vari contesti genetici. (A) Le piantine del Rio Grande-PtoR e della cultivar quasi isogenica Rio Grande-PtoS sono esposte 7 giorni dopo l'inondazione con il PstDC3000 (OD600 - 0,005) - 0,015% surfactant. Rio Grande-PtoR mostra una resistenza costante, e Rio Grande-PtoS mostra una suscettibilità costante alle infezioni da PstDC3000. Queste linee danno origine a fenotipi discreti e binari. (( B) Le piantine di un'adesione selvaggia, come Solanum neorickii LA1329, sono mostrate 10 giorni dopo l'inondazione con il PstT1 (OD600 - 0,0075) - 0.015% surfactant. Le piantine mostrano la variabilità fenotipica, ma sono state registrate come fenotipi binari. La quantità di variabilità fenotipica e il metodo di fenotipizzazione (spettro binario di resistenza o resistenza) dipenderanno dalla particolare adesione testata. (C) La mappatura delle popolazioni generate dall'attraversamento delle adesioni selvatiche alle cultivar sensibili può mostrare un più ampio spettro di fenotipi nelle popolazioni segreganti di F2. In questo caso, può essere più appropriato registrare i fenotipi delle piantine su uno spettro. Le piantine altamente sensibili di una popolazione di mappatura possono essere fenotidate per la morte già nel giorno 7 quando sono state inondate di PstT1, e in genere mostrano un meristem apicale marrone, non a molto poco eprogno dell'epicotipico, e nessuna nuova crescita vegetativa verde. Il meristem apicale delle piantine sensibili può rimanere verde o molto marrone chiaro per più tempo, e ci può essere qualche estensione della crescita epicotipica e molto poco vegetativa, che diventa marrone e arresta entro il giorno 10. Le piantine individuali possono essere fenotitiche per la resistenza in base alla quantità di crescita vegetativa nuova e in corso entro il giorno 14. Le piantine possono quindi essere raggruppate in base ai fenotipi sopra descritti in diverse categorie di resistenza come la resistenza debole, media o forte. Fare clic qui per visualizzare una versione più grande di questa figura.
Accesso limitato. Accedi o avvia una prova gratuita per visualizzare questo contenuto.
Risultati
Rilevamento dell'immunità mediata da PtoRnelle cultivar e linee isogeniche utilizzando il saggio di resistenza alle piantine
La figura 5 mostra risultati rappresentativi per le cultivar Moneymaker-PtoR e Moneymaker-PtoS 7-10 giorni dopo l'inondazione con PstDC3000. Prima dell'infezione, le piantine di 10 giorni mostravano completamente emerse ed espanse cotiledoni e le prime foglie vere emergenti. Le piantine sono state inondate con 10 ...
Accesso limitato. Accedi o avvia una prova gratuita per visualizzare questo contenuto.
Discussione
Viene descritto un protocollo per l'inoculazione delle inondazioni con PstDC3000 o PstT1 ottimizzato per rilevare la resistenza a questi ceppi batterici nelle piantine di pomodoro. Ci sono diversi parametri critici per risultati ottimali nel saggio di resistenza alle piantine, tra cui la concentrazione batterica e la concentrazione di surfactant, che sono stati empiricamente determinati22. Per PstDC3000, la densità ottica è stata ottimizzata per ottenere una completa sop...
Accesso limitato. Accedi o avvia una prova gratuita per visualizzare questo contenuto.
Dichiarazioni
Gli autori non hanno nulla da rivelare.
Ringraziamenti
Ringraziamo Jamie Calma per aver testato l'effetto del volume dei media sui risultati di malattia o resistenza. Ringraziamo il Dr. Maàl Baudin e il Dr. Karl J. Scheiber del Lewis Lab per aver fornito commenti costruttivi e suggerimenti sul manoscritto. La ricerca sull'immunità vegetale nel laboratorio di Lewis è stata sostenuta dall'USDA ARS 2030-21000-046-00D e 2030-21000-050-00D (JDL), e dal direzione delle scienze biologiche IOS-1557661 (JDL).
Accesso limitato. Accedi o avvia una prova gratuita per visualizzare questo contenuto.
Materiali
| Nome | Azienda | Numero di catalogo | Commenti |
|---|---|---|---|
| Nastro 3M Micropore 1/2" x 10 YD CS 240 (1,25 cm x 9,1 m) | VWR International | 56222-182 | |
| Perle di vetro borosilicato da 3 mm | Friedrich & Dimmock | GB3000B | |
| Bacto peptone | BD | 211677 | |
| Bacto agar | BD | 214010 | |
| Biofotometro Plus | Eppendorf | E952000006 | |
| Armadio di biosicurezza, classe II tipo A2 | |||
| MARCA Cuvette in plastica monouso, polistirene | VWR International | 47744-642 | |
| Stuzzicadenti in legno piatto Chenille Kraft | VWR International | 500029-808 | |
| cicloesimide | Research Products International | C81040-5.0 | |
| Fosfato di potassio bibasico anidro, grado ACS | Fisher Scientific | P288-500 | |
| dimetilformammide | |||
| (ingrandimento di almeno 10x) | |||
| Etanolo - 190 Proof | |||
| Falcon polistirene 96 pozzetti micropiastre, fondo piatto | Fisher Scientific | 08-772-3 | |
| Bruciatore ad alcool in vetro Wick | Fisher Scientific | S41898A / No. W-125 | |
| Bruciatori ad alcool in vetro | Fisher Scientific | S41898 / No. BO125 | |
| Reagente glicerolo ACS | VWR International | EMGX0185-5 | |
| Kimberly-Clark&commercio; Kimtech Scienza e commercio; Kimwipes&commercio; Fisher | Scientific | 06-666-A | |
| Cloruro di magnesio, grado ACS VWR | International | 97061-356 | |
| Solfato di magnesio eptaidrato, | VWR International | 97062-130 | |
| da 1,5 mL | |||
| da 2,2 mL | |||
| , 115 volt | Bio Spec Products Inc. | 1001 | |
| Murashige & Skoog, Laboratori di cassoni di sali basali | , Inc. | MSP01-50LT | |
| Pipet-Lite XLS LTS 8-CH Pipetta 20-200uL | Rainin | L8-200XLS | |
| Pipet-Lite XLS LTS 8-CH Pipetta 2-20uL | Rainin | L8-20XLS Polistirene | |
| 100 mm x 25 mm piastra di Petri sterile | VWR International | 89107-632 | |
| Polistirene 150 mm x 15 mm piastra di Petri sterile | Fisher Scientific | FB08-757-14 | |
| Piastra di Petri sterile in polistirene 150x15mm | Fisher Scientific | 08-757-148 | |
| Pure Bright Germicida Ultra Bleach 5,7% Cloro disponibile (definito come 100% candeggina) | Graffette | 1013131 | |
| Rifampicina | Gold Biotechnology | R-120-25 | |
| Silwet L-77 (copolimero di tensioattivo organosiliconico non ionico C13H34O4 Tensioattivo Si3 | Fisher Scientific | NCO138454 | |
| Tips LTS 20 μ L 960/10 GPS-L10 | Rainin | 17005091 | |
| Punte LTS 250 μ L 960/10 GPS-L250 | Rainin | 17005093 | |
| pinza da dissezione VWR punta fine, 4,5" | VWR International | 82027-386 |
Riferimenti
- Underwood, W., Melotto, M., He, S. Y. Role of plant stomata in bacterial invasion. Cell Microbiology. 9 (7), 1621-1629 (2007).
- Zipfel, C. Early molecular events in PAMP-triggered immunity. Current Opinion in Plant Biology. 12 (4), 414-420 (2009).
- Galan, J. E., Wolf-Watz, H. Protein delivery into eukaryotic cells by type III secretion machines. Nature. 444 (7119), 567-573 (2006).
- Lewis, J. D., Desveaux, D., Guttman, D. S. The targeting of plant cellular systems by injected type III effector proteins. Seminars in Cell and Developmental Biology. 20 (9), 1055-1063 (2009).
- Schreiber, K. J., Baudin, M., Hassan, J. A., Lewis, J. D. Die another day: molecular mechanisms of effector-triggered immunity elicited by type III secreted effector proteins. Seminars in Cell and Developmental Biology. 56, 124-133 (2016).
- Heath, M. C. Hypersensitive response-related death. Plant Molecular Biology. 44 (3), 321-334 (2000).
- Boyd, L. A., Ridout, C., O'Sullivan, D. M., Leach, J. E., Leung, H. Plant-pathogen interactions: disease resistance in modern agriculture. Trends in Genetics. 29 (4), 233-240 (2013).
- Pitblado, R. E., MacNeill, B. H. Genetic basis of resistance to Pseudomonas syringae pv. tomato in field tomatoes. Canadian Journal of Plant Pathology. 5 (4), 251-255 (1983).
- Pedley, K. F., Martin, G. B. Molecular basis of Pto-mediated resistance to bacterial speck disease in tomato. Annual Reviews of Phytopathology. 41, 215-243 (2003).
- Ronald, P. C., Salmeron, J. M., Carland, F. M., Mehta, A. Y., Staskawicz, B. J. The cloned avirulence gene AvrPto induces disease resistance in tomato cultivars containing the Pto resistance gene. Journal of Bacteriology. 174 (5), 1604-1611 (1992).
- Martin, G. B., et al. Map-based cloning of a protein kinase gene conferring disease resistance in tomato. Science. 262 (5138), 1432-1436 (1993).
- Salmeron, J. M., Barker, S. J., Carland, F. M., Mehta, A. Y., Staskawicz, B. J. Tomato mutants altered in bacterial disease resistance provide evidence for a new locus controlling pathogen recognition. Plant Cell. 6 (4), 511-520 (1994).
- Salmeron, J. M., et al. Tomato Prf is a member of the leucine-rich repeat class of plant disease resistance genes and lies embedded within the Pto kinase gene cluster. Cell. 86 (1), 123-133 (1996).
- Scofield, S. R., et al. Molecular basis of gene-for-gene specificity in bacterial speck disease of tomato. Science. 274 (5295), 2063-2065 (1996).
- Kunkeaw, S., Tan, S., Coaker, G. Molecular and evolutionary analyses of Pseudomonas syringae pv. tomato race 1. Molecular Plant-Microbe Interactions. 23 (4), 415-424 (2010).
- Cai, R., et al. The plant pathogen Pseudomonas syringae pv. tomato is genetically monomorphic and under strong selection to evade tomato immunity. PLoS Pathogens. 7 (8), 1002130(2011).
- Almeida, N. F., et al. A draft genome sequence of Pseudomonas syringae pv. tomato T1 reveals a type III effector repertoire significantly divergent from that of Pseudomonas syringae pv. tomato DC3000. Molecular Plant-Microbe Interactions. 22 (1), 52-62 (2009).
- Lin, N. C., Abramovitch, R. B., Kim, Y. J., Martin, G. B. Diverse AvrPtoB homologs from several Pseudomonas syringae pathovars elicit Pto-dependent resistance and have similar virulence activities. Applied and Environmental Microbiology. 72 (1), 702-712 (2006).
- Rose, L. E., Langley, C. H., Bernal, A. J., Michelmore, R. W. Natural variation in the Pto pathogen resistance gene within species of wild tomato (Lycopersicon). I. Functional analysis of Pto alleles. Genetics. 171 (1), 345-357 (2005).
- Thapa, S. P., Miyao, E. M., Davis, R. M., Coaker, G. Identification of QTLs controlling resistance to Pseudomonas syringae pv. tomato race 1 strains from the wild tomato Solanum habrochaites LA1777. Theoretical and Applied Genetics. 128 (4), 681-692 (2015).
- Bao, Z. L., et al. Identification of a candidate gene in Solanum habrochaites for resistance to a race 1 strain of Pseudomonas syringae pv. tomato. Plant Genome. 8 (3), 1-15 (2015).
- Hassan, J. A., Zhou, Y. J., Lewis, J. D. A rapid seedling resistance assay identifies wild tomato lines that are resistant to Pseudomonas syringae pv. tomato race 1. Molecular Plant-Microbe Interactions. 30 (9), 701-709 (2017).
- King, E. O., Ward, M. K., Raney, D. E. Two simple media for the demonstration of pyocyanin and fluorescin. Journal of Laboratory and Clinical Medicine. 44 (2), 301-307 (1954).
- Uppalapati, S. R., et al. Pathogenicity of Pseudomonas syringae pv. tomato on tomato seedlings: phenotypic and gene expression analyses of the virulence function of coronatine. Molecular Plant-Microbe Interactions. 21 (4), 383-395 (2008).
- Bhardwaj, V., Meier, S., Petersen, L. N., Ingle, R. A., Roden, L. C. Defence responses of Arabidopsis thaliana to infection by Pseudomonas syringae are regulated by the circadian clock. PLoS One. 6 (10), 26968(2011).
- Lu, H., McClung, C. R., Zhang, C. Tick tock: circadian regulation of plant innate immunity. Annual Review of Phytopathology. 55, 287-311 (2017).
- Wang, W., et al. Timing of plant immune responses by a central circadian regulator. Nature. 470 (7332), 110-114 (2011).
Accesso limitato. Accedi o avvia una prova gratuita per visualizzare questo contenuto.
Ristampe e permessi
Errata corrige
Formal Correction: Erratum: High-Throughput Identification of Resistance to Pseudomonas syringae pv. Tomato in Tomato using Seedling Flood Assay
Posted by JoVE Editors on 10/18/2023. Citeable Link.
An erratum was issued for: High-Throughput Identification of Resistance to Pseudomonas syringae pv. Tomato in Tomato using Seedling Flood Assay. The Introduction, Protocol, Representative Results and Discussion sections were updated.
The last paragraph of the Introduction section was updated from:
In the seedling flood assay described in this protocol, tomato seedlings are grown on Petri dishes of sterile Murashige and Skoog (MS) media for 10 days and then are flooded with an inoculum containing the bacteria of interest and a surfactant. Following flooding, seedlings can be quantitatively evaluated for disease resistance via bacterial growth assays. Additionally, seedling survival or death can act as a discrete resistance or disease phenotype 7–14 days after flooding. This approach offers a high-throughput alternative for screening large numbers of wild tomato accessions for resistance to Pst race 1 strains, such as Pst strain T1 (PstT1), and can easily be adapted to other bacterial strains of interest.
to:
In the seedling flood assay described in this protocol, tomato seedlings are grown on Petri dishes of sterile Murashige and Skoog (MS) media for 10 days and then are flooded with an inoculum containing the bacteria of interest and a surfactant. Following flooding, seedlings can be quantitatively evaluated for disease resistance via bacterial growth assays. Additionally, seedling survival or death can act as a discrete resistance or disease phenotype 7–14 days after flooding. This approach offers a high-throughput alternative for screening large numbers of wild tomato accessions for resistance to Pst race 1 strains, such as Pst strain 19 (Pst19), and can easily be adapted to other bacterial strains of interest.
Step 4.8 of the Protocol section was updated from:
- After 1 h, transfer the bottle to the biosafety cabinet and under aseptic conditions, add 1,600 µL of sterile 1 M MgSO4, and appropriate antibiotics to the media.
NOTE: For rifampicin resistant strains PstDC3000 and PstT1, use rifampicin dissolved in dimethylformamide at a final concentration of 50 µg/mL. Use cycloheximide dissolved in ethanol at a final concentration of 50 µg/mL to prevent fungal growth on the plates.
to:
- After 1 h, transfer the bottle to the biosafety cabinet and under aseptic conditions, add 1,600 µL of sterile 1 M MgSO4, and appropriate antibiotics to the media.
NOTE: For rifampicin resistant strains PstDC3000 and Pst19, use rifampicin dissolved in dimethylformamide at a final concentration of 50 µg/mL. Use cycloheximide dissolved in ethanol at a final concentration of 50 µg/mL to prevent fungal growth on the plates.
Step 5.2 of the Protocol section was updated from:
- Patch bacteria (i.e., PstT1) from a glycerol stock onto KB agar with appropriate antibiotics (section 4).
to:
- Patch bacteria (i.e., Pst19) from a glycerol stock onto KB agar with appropriate antibiotics (section 4).
Step 5.6 of the Protocol section was updated from:
- For PstT1, incubate the KB plate at 28 ˚C for 48 h prior to using bacteria in the flood experiment.
to:
- For Pst19, incubate the KB plate at 28 ˚C for 48 h prior to using bacteria in the flood experiment.
Step 6 of the Protocol section was updated from:
6. Preparation of PstT1 inoculum
to
6. Preparation of Pst19 inoculum
Step 6.2 of the Protocol section was updated from:
- Perform serial dilutions using sterile 10 mM MgCl2 solution in the biosafety cabinet. For PstT1, use a spectrophotometer to make inoculum with a starting concentration of OD600 = 0.1.
to:
- Perform serial dilutions using sterile 10 mM MgCl2 solution in the biosafety cabinet. For Pst19, use a spectrophotometer to make inoculum with a starting concentration of OD600 = 0.1.
Step 6.3 of the Protocol section was updated from:
- For PstT1, make a 1/10 dilution from the initial resuspension at OD600 = 0.1 to obtain a serial dilution at a concentration of OD600 = 0.01.
to:
- For Pst19, make a 1/10 dilution from the initial resuspension at OD600 = 0.1 to obtain a serial dilution at a concentration of OD600 = 0.01.
Step 8.3 of the Protocol section was updated from:
- Set a timer for 3 min. Measure 6 mL of final inoculum (PstT1 OD600 = 0.0075 [section 6] or PstDC3000 OD600 = 0.005 [section 7]) and transfer 6 mL of inoculum to each plate with the 10-day-old seedlings.
to:
- Set a timer for 3 min. Measure 6 mL of final inoculum (Pst19 OD600 = 0.0075 [section 6] or PstDC3000 OD600 = 0.005 [section 7]) and transfer 6 mL of inoculum to each plate with the 10-day-old seedlings.
Step 8.11 of the Protocol section was updated from:
- Phenotype after 7–10 days for PstDC3000 or 10–14 days for PstT1 (section 11). If carrying out bacterial growth assays, collect leaf tissue after 4 days (sections 9 and 10) and then phenotype (section 11). Alternatively, perform phenotypic analysis and bacterial growth assays on separate sets of plants.
to:
- Phenotype after 7–10 days for PstDC3000 or 10–14 days for Pst19 (section 11). If carrying out bacterial growth assays, collect leaf tissue after 4 days (sections 9 and 10) and then phenotype (section 11). Alternatively, perform phenotypic analysis and bacterial growth assays on separate sets of plants.
Step 10.7 of the Protocol section was updated from:
- After obtaining colony counts (Figure 2B), normalize the counts to 0.01 g of tissue for seedlings and convert to log bacterial growth (Table 1).
NOTE: The average mass of one Moneymaker-PtoS cotyledon is 0.01 g and is empirically determined22.
| Genotype1 Column A | Tissue Weight (g) Column B | # of Colonies in a spot Column C | Dilution factor for spot2 Column D | Adjusted # of Colonies3 Column E | Dilution factor for serial dilution Column F | Total # of Colonies Column G (cfu/0.01 g)4 | Average # of Colonies (cfu/0.01 g) Column H | Average Log Growth (cfu/0.01 g (log10)) Column I |
| Sample 1 | 0.004 g | 10 | 200 | calculated as: (C2 x 0.01 g) / B2 = 25 | 1000 | calculated as: (D2 x E2 x F2) = 5000000 | average for sample 1 through last sample: (ie. average G1:G3) = 7000000 | log of average ie. log(H2) = 6.85 |
| Sample 2 | 0.003 g | 15 | 200 | 50 | 1000 | 10000000 | ||
| Sample 3 | 0.002 g | 6 | 200 | 30 | 1000 | 6000000 | ||
| 1Data shown for 3 samples | ||||||||
| 2Based on plating 5 µL x 200 for 1 mL | ||||||||
| 3Cotyledons are too small to core so colony counts were normalized to 0.01 g of tissue based on the average mass of one MoneyMaker-PtoS cotyledon (data not shown) | ||||||||
| 4Adjusted per mL based on volume plated | ||||||||
Table 1: Sample calculations for seedling bacterial growth assay. Sample calculations demonstrate how to normalize bacterial counts and determine log bacterial growth.
to:
- After obtaining colony counts (Figure 2B), normalize the counts to 0.1 g of tissue for seedlings and convert to log bacterial growth (Table 1).
NOTE: The average mass of one Moneymaker-PtoS cotyledon is 0.1 g and is empirically determined22.
| Genotype1 Column A | Tissue Weight (g) Column B | # of Colonies in a spot Column C | Dilution factor for spot2 Column D | Adjusted # of Colonies3 Column E | Dilution factor for serial dilution Column F | Total # of Colonies Column G (cfu/0.01 g)4 | Average # of Colonies (cfu/0.01 g) Column H | Average Log Growth (cfu/0.1 g (log10)) Column I |
| Sample 1 | 0.04 g | 10 | 200 | calculated as: (C2 x 0.1 g) / B2 = 25 | 1000 | calculated as: (D2 x E2 x F2) = 5000000 | average for sample 1 through last sample: (ie. average G1:G3) = 7000000 | log of average ie. log(H2) = 6.85 |
| Sample 2 | 0.03 g | 15 | 200 | 50 | 1000 | 10000000 | ||
| Sample 3 | 0.02 g | 6 | 200 | 30 | 1000 | 6000000 | ||
| 1Data shown for 3 samples | ||||||||
| 2Based on plating 5 µL x 200 for 1 mL | ||||||||
| 3Cotyledons are too small to core so colony counts were normalized to 0.1 g of tissue based on the average mass of one MoneyMaker-PtoS cotyledon (data not shown) | ||||||||
| 4Adjusted per mL based on volume plated | ||||||||
Table 1: Sample calculations for seedling bacterial growth assay. Sample calculations demonstrate how to normalize bacterial counts and determine log bacterial growth.
Step 11.3 of the Protocol section was updated from:
- Phenotype plants infected with PstT1 at 10–14 days after flood inoculation.
to:
- Phenotype plants infected with Pst19 at 10–14 days after flood inoculation.
Figure 4 in the Protocol section was updated from:
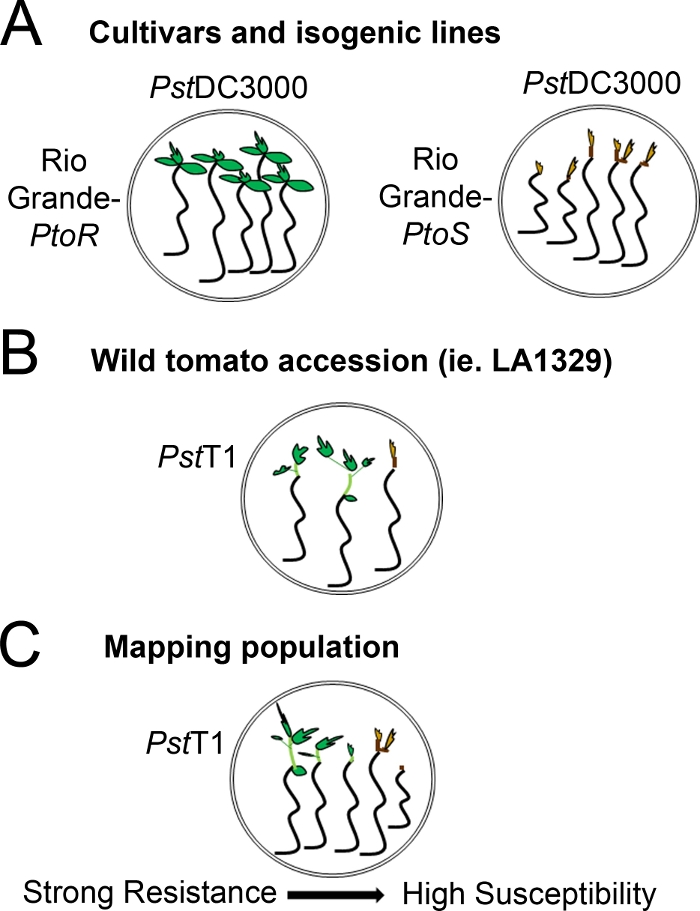
Figure 4: Schematic representation of expected phenotypes for seedling resistance and death in various genetic backgrounds. (A) Seedlings of Rio Grande-PtoR and the near-isogenic cultivar Rio Grande-PtoS are displayed 7 days after flooding with PstDC3000 (OD600 = 0.005) + 0.015% surfactant. Rio Grande-PtoR displays consistent resistance, and Rio Grande-PtoS displays consistent susceptibility to infection with PstDC3000. These lines give rise to discrete and binary phenotypes. (B) Seedlings of a wild accession, such as Solanum neorickii LA1329, are shown 10 days after flooding with PstT1 (OD600 = 0.0075) + 0.015% surfactant. Seedlings display phenotypic variability but were recorded as binary phenotypes. The amount of phenotypic variability and the method of phenotyping (binary resistance or resistance spectrum) will depend on the particular accession tested. (C) Mapping populations generated by outcrossing wild accessions to susceptible cultivars may display a wider spectrum of phenotypes in F2 segregating populations. In this case, it may be most appropriate to record seedling phenotypes on a spectrum. Highly susceptible seedlings from a mapping population may be phenotyped for death as early as day 7 when flooded with PstT1, and typically show a brown apical meristem, no to very little extension of the epicotyl, and no new, green vegetative growth. The apical meristem of susceptible seedlings may stay green or very light brown for more time, and there may be some extension of the epicotyl and very little vegetative growth, which turns brown and arrests by day 10. Individual seedlings can be phenotyped for resistance based on the amount of new and ongoing vegetative growth by day 14. Seedlings can then be grouped based on the phenotypes described above into different categories of resistance such as weak, medium, or strong resistance. Please click here to view a larger version of this figure.
to:
Figure 4: Schematic representation of expected phenotypes for seedling resistance and death in various genetic backgrounds. (A) Seedlings of Rio Grande-PtoR and the near-isogenic cultivar Rio Grande-PtoS are displayed 7 days after flooding with PstDC3000 (OD600 = 0.005) + 0.015% surfactant. Rio Grande-PtoR displays consistent resistance, and Rio Grande-PtoS displays consistent susceptibility to infection with PstDC3000. These lines give rise to discrete and binary phenotypes. (B) Seedlings of a wild accession, such as Solanum neorickii LA1329, are shown 10 days after flooding with Pst19 (OD600 = 0.0075) + 0.015% surfactant. Seedlings display phenotypic variability but were recorded as binary phenotypes. The amount of phenotypic variability and the method of phenotyping (binary resistance or resistance spectrum) will depend on the particular accession tested. (C) Mapping populations generated by outcrossing wild accessions to susceptible cultivars may display a wider spectrum of phenotypes in F2 segregating populations. In this case, it may be most appropriate to record seedling phenotypes on a spectrum. Highly susceptible seedlings from a mapping population may be phenotyped for death as early as day 7 when flooded with Pst19, and typically show a brown apical meristem, no to very little extension of the epicotyl, and no new, green vegetative growth. The apical meristem of susceptible seedlings may stay green or very light brown for more time, and there may be some extension of the epicotyl and very little vegetative growth, which turns brown and arrests by day 10. Individual seedlings can be phenotyped for resistance based on the amount of new and ongoing vegetative growth by day 14. Seedlings can then be grouped based on the phenotypes described above into different categories of resistance such as weak, medium, or strong resistance. Please click here to view a larger version of this figure.
The second paragraph of the Representative Results section was updated from:
Phenotypic screening of wild accessions using the seedling resistance assay
Figure 6 shows representative results for seedlings of susceptible and resistant accessions 10–14 days after flooding with PstT1. Susceptible accessions include RG-PtoR, S. pimpinellifolium LA1375, and S. pimpinellifolium LA1606, and resistant accessions include S. neorickii LA1329. Ten-day-old seedlings were flooded with 10 mM MgCl2 + 0.015% surfactant as a negative control, and PstT1 at an optical density of 0.0075 + 0.015% surfactant. The seedlings were phenotyped at least 10 days after flooding, as PstT1-infected seedlings died more slowly than PstDC3000-infected seedlings. Mock-inoculated seedlings were green, healthy, and actively growing. This control is important to ensure that the accessions are not sensitive to the concentration of surfactant, and to ensure there is no bacterial contamination. Susceptible accessions (Rio Grande-PtoR [n = 7], S. pimpinellifolium LA1375 [n = 7], and S. pimpinellifolium LA1606 [n = 5]) were dead, had brown apical meristems, and lacked new growth 10–14 days after inoculation with PstT1. In contrast, two S. neorickii LA1329 (n = 3) seedlings displayed a high level of new, green growth and survived infection with PstT1 (Figure 6). Three LA1329 seedlings did not germinate. Typically, 5–7 individuals were screened for each accession in a primary screen to determine the prevalence of resistance in the population. When a more genetically complex wild accession, such as LA1329, is flooded with PstT1, the resistance phenotypes display slightly more variability among individual seedlings, compared to Moneymaker-PtoR treated with PstDC3000. However, the resistance phenotypes were usually less variable than those seen in F2 mapping populations. Thus, binary phenotyping criteria was used for LA1329.
to:
Phenotypic screening of wild accessions using the seedling resistance assay
Figure 6 shows representative results for seedlings of susceptible and resistant accessions 10–14 days after flooding with Pst19. Susceptible accessions include RG-PtoR, S. pimpinellifolium LA1375, and S. pimpinellifolium LA1606, and resistant accessions include S. neorickii LA1329. Ten-day-old seedlings were flooded with 10 mM MgCl2 + 0.015% surfactant as a negative control, and Pst19 at an optical density of 0.0075 + 0.015% surfactant. The seedlings were phenotyped at least 10 days after flooding, as Pst19-infected seedlings died more slowly than PstDC3000-infected seedlings. Mock-inoculated seedlings were green, healthy, and actively growing. This control is important to ensure that the accessions are not sensitive to the concentration of surfactant, and to ensure there is no bacterial contamination. Susceptible accessions (Rio Grande-PtoR [n = 7], S. pimpinellifolium LA1375 [n = 7], and S. pimpinellifolium LA1606 [n = 5]) were dead, had brown apical meristems, and lacked new growth 10–14 days after inoculation with Pst19. In contrast, two S. neorickii LA1329 (n = 3) seedlings displayed a high level of new, green growth and survived infection with Pst19 (Figure 6). Three LA1329 seedlings did not germinate. Typically, 5–7 individuals were screened for each accession in a primary screen to determine the prevalence of resistance in the population. When a more genetically complex wild accession, such as LA1329, is flooded with Pst19, the resistance phenotypes display slightly more variability among individual seedlings, compared to Moneymaker-PtoR treated with PstDC3000. However, the resistance phenotypes were usually less variable than those seen in F2 mapping populations. Thus, binary phenotyping criteria was used for LA1329.
Figure 6 in the Representative Results section was updated from:
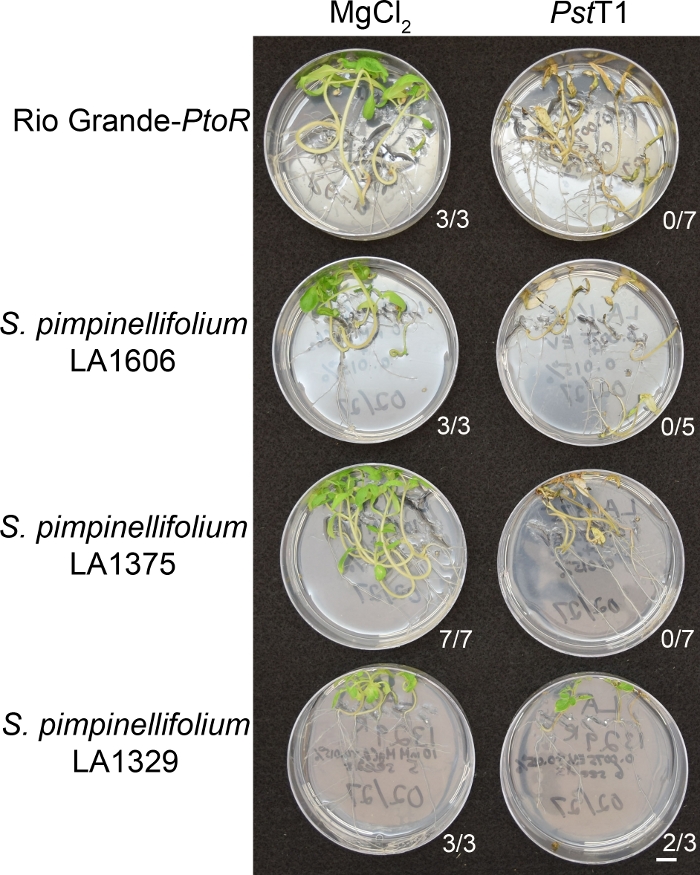
Figure 6: Phenotypic characterization of resistance or disease symptoms 10–14 days post-infection in wild accessions. Rio Grande-PtoR, S. pimpinellifolium LA1606, S. pimpinellifolium LA1375 and S. neorickii LA1329 tomato seedlings were grown on 0.5x MS plates for 10 days, and then flooded with PstT1 (OD600 = 0.0075) + 0.015% surfactant. The number of surviving seedlings for each wild accession out of the total number tested is shown. Scale bar = 1 cm. Please click here to view a larger version of this figure.
to:
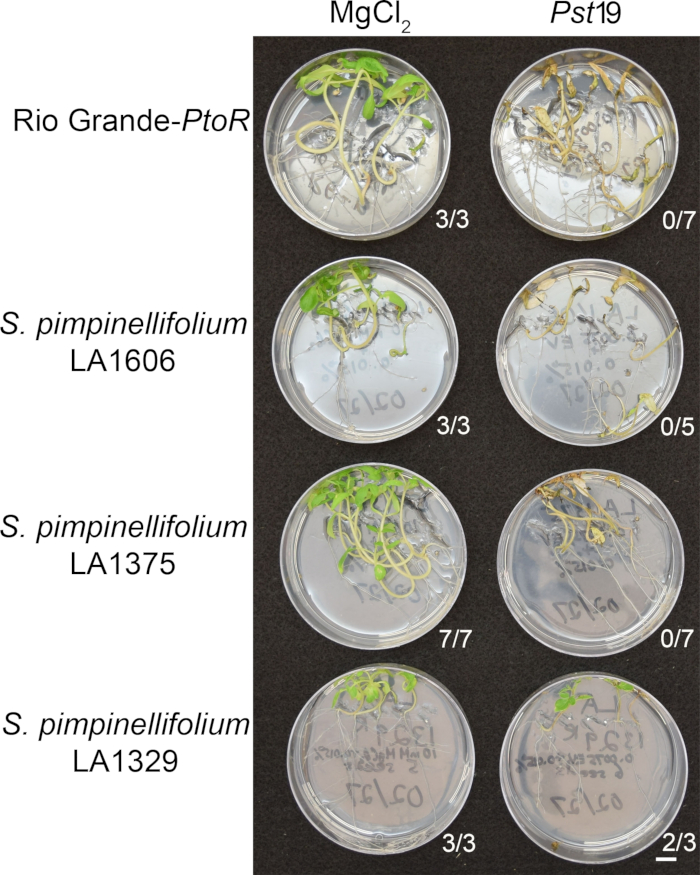
Figure 6: Phenotypic characterization of resistance or disease symptoms 10–14 days post-infection in wild accessions. Rio Grande-PtoR, S. pimpinellifolium LA1606, S. pimpinellifolium LA1375 and S. neorickii LA1329 tomato seedlings were grown on 0.5x MS plates for 10 days, and then flooded with Pst19 (OD600 = 0.0075) + 0.015% surfactant. The number of surviving seedlings for each wild accession out of the total number tested is shown. Scale bar = 1 cm. Please click here to view a larger version of this figure.
The third paragraph of the Representative Results section was updated from:
Quantitative assessment of bacterial growth using the seedling flood assay
To confirm that the observed resistance in LA1329 to PstT1 resulted in lower bacterial growth, bacterial growth assays were carried out in tomato seedlings. The level of PstT1 growth in Moneymaker-PtoS and S. neorickii LA1329 was determined 4 days post-infection. Moneymaker-PtoS is a near-isogenic line with consistent susceptibility among individual seedlings. Wild accessions such as S. neorickii LA1329 are often more genetically complex. LA1329 displays approximately 60% resistance to PstT1 across the population22. Because seedlings may drop their cotyledons after infection, one seedling was grown on each plate to correlate bacterial growth in the harvested cotyledon with overall seedling survival or death as determined phenotypically at least 10 days after flooding. The bacterial counts on day 4 for each seedling were normalized to 0.01 g of tissue and converted to log growth (CFU/0.01 g(log10)). Log growth for phenotypically resistant LA1329 seedlings (LA1329RES) or phenotypically susceptible seedlings (LA1329SUS) were separately pooled and compared to each other and the susceptible cultivar Moneymaker-PtoS. For example, there was a 1.7 log difference in bacterial growth between LA1329RES (log 6.3) and LA1329SUS (log 8.0), and a 1.6 log difference between LA1329RES (log 6.3) and Moneymaker-PtoS (log 7.9) (Figure 7). Therefore, phenotypic resistance correlated with quantitative resistance in the seedling assays.
to:
Quantitative assessment of bacterial growth using the seedling flood assay
To confirm that the observed resistance in LA1329 to Pst19 resulted in lower bacterial growth, bacterial growth assays were carried out in tomato seedlings. The level of Pst19 growth in Moneymaker-PtoS and S. neorickii LA1329 was determined 4 days post-infection. Moneymaker-PtoS is a near-isogenic line with consistent susceptibility among individual seedlings. Wild accessions such as S. neorickii LA1329 are often more genetically complex. LA1329 displays approximately 60% resistance to Pst19 across the population22. Because seedlings may drop their cotyledons after infection, one seedling was grown on each plate to correlate bacterial growth in the harvested cotyledon with overall seedling survival or death as determined phenotypically at least 10 days after flooding. The bacterial counts on day 4 for each seedling were normalized to 0.01 g of tissue and converted to log growth (CFU/0.01 g(log10)). Log growth for phenotypically resistant LA1329 seedlings (LA1329RES) or phenotypically susceptible seedlings (LA1329SUS) were separately pooled and compared to each other and the susceptible cultivar Moneymaker-PtoS. For example, there was a 1.7 log difference in bacterial growth between LA1329RES (log 6.3) and LA1329SUS (log 8.0), and a 1.6 log difference between LA1329RES (log 6.3) and Moneymaker-PtoS (log 7.9) (Figure 7). Therefore, phenotypic resistance correlated with quantitative resistance in the seedling assays.
Figure 7 in the Representative Results section was updated from:
x
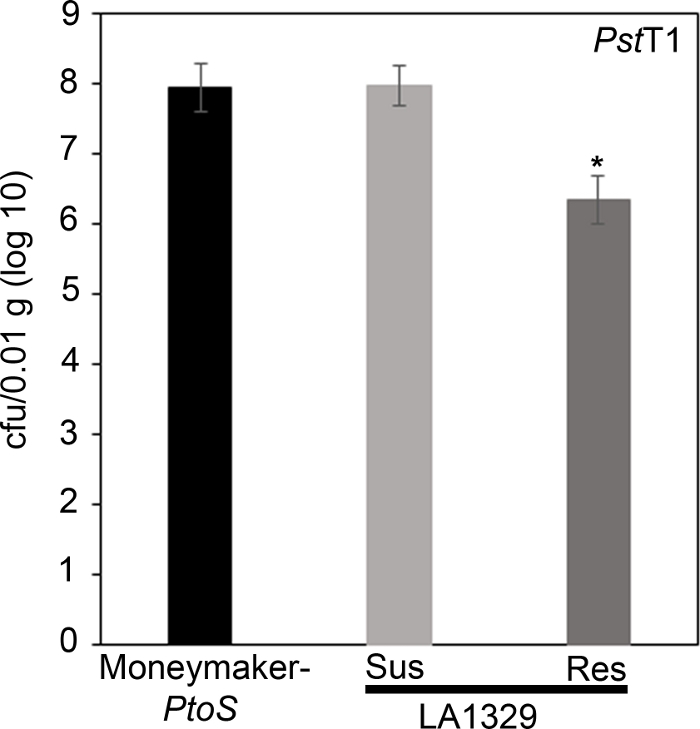
Figure 7: Resistant Solanum neorickii LA1329 seedlings support lower bacterial growth than Moneymaker-PtoS or susceptible S. neorickii LA1329. Bacterial counts were determined 4 days post-inoculation from S. neorickii LA1329 (n = 14) and Moneymaker-PtoS (n = 10) seedlings infected with PstT1 and normalization was performed to 0.01 g of tissue. For LA1329, the two phenotypic groups, susceptible (SUS) or resistant (RES), were observed and counted separately. Above the bar * = statistically significant difference determined by a one-factor analysis of variance. A general linear model procedure (p < 0.001) followed by a multiple comparison of means using Tukey's post hoc test was used. Error bars = standard error. The figure indicates one representative experiment. Please click here to view a larger version of this figure.
x
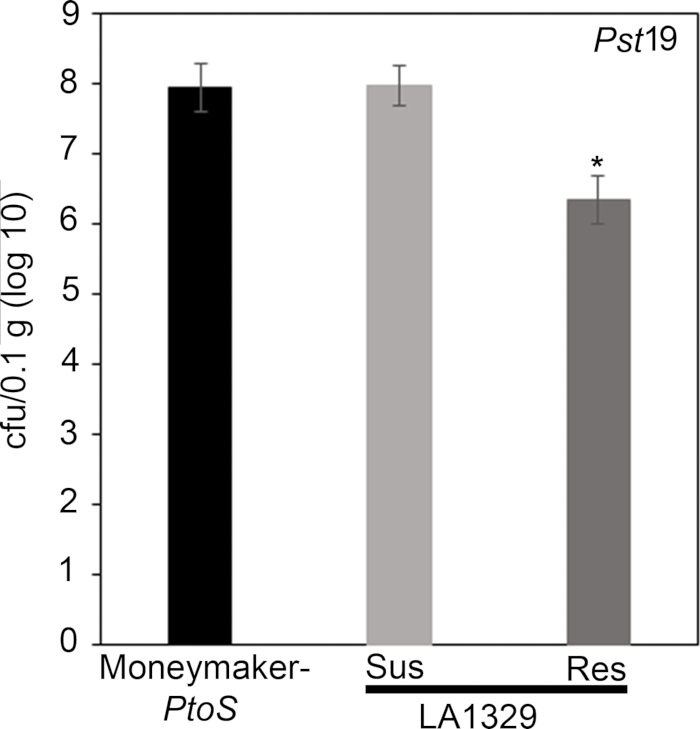
Figure 7: Resistant Solanum neorickii LA1329 seedlings support lower bacterial growth than Moneymaker-PtoS or susceptible S. neorickii LA1329. Bacterial counts were determined 4 days post-inoculation from S. neorickii LA1329 (n = 14) and Moneymaker-PtoS (n = 10) seedlings infected with Pst19 and normalization was performed to 0.1 g of tissue. For LA1329, the two phenotypic groups, susceptible (SUS) or resistant (RES), were observed and counted separately. Above the bar * = statistically significant difference determined by a one-factor analysis of variance. A general linear model procedure (p < 0.001) followed by a multiple comparison of means using Tukey's post hoc test was used. Error bars = standard error. The figure indicates one representative experiment. Please click here to view a larger version of this figure.
The first paragraph of the Discussion section was updated from:
A protocol for flood inoculation with PstDC3000 or PstT1 optimized to detect resistance to these bacterial strains in tomato seedlings is described. There are several critical parameters for optimal results in the seedling resistance assay, including bacterial concentration and surfactant concentration, which were empirically determined22. For PstDC3000, the optical density was optimized to achieve complete survival on a resistant cultivar containing the Pto/Prf cluster and complete death on a susceptible cultivar lacking the Pto/Prf cluster22. For a strain such as PstT1, where there are no known resistant varieties, the optical density was optimized to be the lowest possible for consistent and complete plant death22. Uppalapati et al.24 designed a tomato seedling assay to investigate the pathogenesis of PstDC3000 and the virulence function of coronatine. In this virulence assay, infections were performed using bacteria concentrated to an OD600 of 0.124, 20x higher than the optical density of strains used in our resistance assay. Recognition of PstDC3000 effectors AvrPto and AvrPtoB in tomato seedlings carrying the Pto/Prf gene cluster results in ETI and a macroscopic HR22. In the context of a strong immune response such as ETI, a lower bacterial titer was used for PstDC3000 to avoid overwhelming genetic resistance from the Pto/Prf gene cluster22. In addition, these results suggest that a high bacterial concentration could overwhelm weaker immune responses such as PTI or quantitative partial resistance, where multiple genes contribute to the overall phenotype. Surfactant is necessary for the bacteria to adhere to the leaf surface; however, high concentrations can cause chlorosis of the leaf22. We previously tested a range of surfactant concentrations to empirically determine the ideal concentration in 10-day-old tomato seedlings22. When testing new species that may differ in their sensitivity to surfactant, the surfactant concentration should be optimized to identify a concentration that does not cause damage or chlorosis in the absence of bacteria. Appropriate assay conditions will require optimization of a surfactant concentration that does not cause damage, and a bacterial concentration that causes disease in all susceptible controls.
to:
A protocol for flood inoculation with PstDC3000 or Pst19 optimized to detect resistance to these bacterial strains in tomato seedlings is described. There are several critical parameters for optimal results in the seedling resistance assay, including bacterial concentration and surfactant concentration, which were empirically determined22. For PstDC3000, the optical density was optimized to achieve complete survival on a resistant cultivar containing the Pto/Prf cluster and complete death on a susceptible cultivar lacking the Pto/Prf cluster22. For a strain such as Pst19, where there are no known resistant varieties, the optical density was optimized to be the lowest possible for consistent and complete plant death22. Uppalapati et al.24 designed a tomato seedling assay to investigate the pathogenesis of PstDC3000 and the virulence function of coronatine. In this virulence assay, infections were performed using bacteria concentrated to an OD600 of 0.124, 20x higher than the optical density of strains used in our resistance assay. Recognition of PstDC3000 effectors AvrPto and AvrPtoB in tomato seedlings carrying the Pto/Prf gene cluster results in ETI and a macroscopic HR22. In the context of a strong immune response such as ETI, a lower bacterial titer was used for PstDC3000 to avoid overwhelming genetic resistance from the Pto/Prf gene cluster22. In addition, these results suggest that a high bacterial concentration could overwhelm weaker immune responses such as PTI or quantitative partial resistance, where multiple genes contribute to the overall phenotype. Surfactant is necessary for the bacteria to adhere to the leaf surface; however, high concentrations can cause chlorosis of the leaf22. We previously tested a range of surfactant concentrations to empirically determine the ideal concentration in 10-day-old tomato seedlings22. When testing new species that may differ in their sensitivity to surfactant, the surfactant concentration should be optimized to identify a concentration that does not cause damage or chlorosis in the absence of bacteria. Appropriate assay conditions will require optimization of a surfactant concentration that does not cause damage, and a bacterial concentration that causes disease in all susceptible controls.
The third paragraph of the Discussion section was updated from:
Pst is a foliar pathogen that preferentially colonizes the aerial parts of tomato seedlings, including the cotyledons24 (Figure 3). Therefore, qualitative phenotyping in the seedling flood assay focuses on growth and disease symptoms in aerial portions of the seedling, and tissue for the bacterial growth assay is sampled from the cotyledons for quantitative analysis. After flood inoculation, seedlings may die within 7–10 days after inoculation with PstDC3000 or 10–14 days after inoculation with PstT1, as discussed in section 11. Seedling death is visualized by a brown apical meristem, arrested epicotyl elongation, and/or arrested vegetative growth. If different bacterial strains are used, the timing will have to be empirically determined. In addition, the progression of disease on control plants should be monitored daily after flooding until a consistent time frame from the onset of disease symptoms to seedling death can be identified. Depending on the genotypes and treatments used in the flood assay, seedling phenotypes can be recorded as binary phenotypes or on a disease spectrum (Figure 4). A broader spectrum of phenotypes may be observed when flood inoculating F2 mapping populations from wild tomato accessions crossed to susceptible cultivars (Figure 4C). It may be best to phenotype segregating populations on a disease spectrum depending on how quickly the seedling dies and the degree of new vegetative growth and branching (Figure 4C). The seedling flood assay can also be used in conjunction with the seedling bacterial growth assay to quantitatively assess levels of bacterial growth associated with qualitative phenotypes in individual seedlings (Figure 7). Very large reductions (i.e., ~log 3) in bacterial growth or strong resistance in resistant seedlings of a wild accession compared to a susceptible cultivar suggest that the underlying genetic basis of resistance may be due to ETI22. Smaller reductions in bacterial growth (i.e., ~log 1.7), as observed in LA1329 seedlings, may be due to the contribution of weaker resistance from quantitative trait loci and/or PTI. Thus, the seedling growth assay can be an important tool in further characterizing resistance in wild tomato lines.
to:
Pst is a foliar pathogen that preferentially colonizes the aerial parts of tomato seedlings, including the cotyledons24 (Figure 3). Therefore, qualitative phenotyping in the seedling flood assay focuses on growth and disease symptoms in aerial portions of the seedling, and tissue for the bacterial growth assay is sampled from the cotyledons for quantitative analysis. After flood inoculation, seedlings may die within 7–10 days after inoculation with PstDC3000 or 10–14 days after inoculation with Pst19, as discussed in section 11. Seedling death is visualized by a brown apical meristem, arrested epicotyl elongation, and/or arrested vegetative growth. If different bacterial strains are used, the timing will have to be empirically determined. In addition, the progression of disease on control plants should be monitored daily after flooding until a consistent time frame from the onset of disease symptoms to seedling death can be identified. Depending on the genotypes and treatments used in the flood assay, seedling phenotypes can be recorded as binary phenotypes or on a disease spectrum (Figure 4). A broader spectrum of phenotypes may be observed when flood inoculating F2 mapping populations from wild tomato accessions crossed to susceptible cultivars (Figure 4C). It may be best to phenotype segregating populations on a disease spectrum depending on how quickly the seedling dies and the degree of new vegetative growth and branching (Figure 4C). The seedling flood assay can also be used in conjunction with the seedling bacterial growth assay to quantitatively assess levels of bacterial growth associated with qualitative phenotypes in individual seedlings (Figure 7). Very large reductions (i.e., ~log 3) in bacterial growth or strong resistance in resistant seedlings of a wild accession compared to a susceptible cultivar suggest that the underlying genetic basis of resistance may be due to ETI22. Smaller reductions in bacterial growth (i.e., ~log 1.7), as observed in LA1329 seedlings, may be due to the contribution of weaker resistance from quantitative trait loci and/or PTI. Thus, the seedling growth assay can be an important tool in further characterizing resistance in wild tomato lines.
The fourth paragraph of the Discussion section was updated from:
Typically, genetic screens have been performed on four- to five-week-old adult tomato plants to identify the genetic basis of P. syringae resistance in wild accessions20,21. Adult tomato plants require much longer growth times, require more space in the growth chamber, and are much larger plants, which means that usually few individuals are screened for each line. The seedling flood assay provides a powerful, alternative approach in the identification of P. syringae resistance in wild tomato accessions. Screening at the seedling stage permits a large sample size to be tested which can be particularly advantageous in detecting resistance in genetically complex populations. Reduced growth chamber space requirements and growth time facilitate a high-throughput approach and rapid detection of natural resistance in wild accessions to emerging pathogens. Furthermore, P. syringae resistance that was identified at the seedling stage in this assay is not restricted to the developmental stage. S. neorickii LA1329 and S. habrochaites LA1253 were initially identified at the seedling stage and also display resistance to PstT1 in adult plants as previously described22.
to:
Typically, genetic screens have been performed on four- to five-week-old adult tomato plants to identify the genetic basis of P. syringae resistance in wild accessions20,21. Adult tomato plants require much longer growth times, require more space in the growth chamber, and are much larger plants, which means that usually few individuals are screened for each line. The seedling flood assay provides a powerful, alternative approach in the identification of P. syringae resistance in wild tomato accessions. Screening at the seedling stage permits a large sample size to be tested which can be particularly advantageous in detecting resistance in genetically complex populations. Reduced growth chamber space requirements and growth time facilitate a high-throughput approach and rapid detection of natural resistance in wild accessions to emerging pathogens. Furthermore, P. syringae resistance that was identified at the seedling stage in this assay is not restricted to the developmental stage. S. neorickii LA1329 and S. habrochaites LA1253 were initially identified at the seedling stage and also display resistance to Pst19 in adult plants as previously described22.
Esplora altri articoli
Saggio di allagamento di piantine di pomodoroResistenza a Pseudomonas syringaeScreening ad alta produttivitàAccessioni di pomodoro selvaticoProtocollo di inoculazione delle piantineSaggi di crescita battericaCluster genico Pto/PrfFenotipizzazione della resistenza alle malattieMetodo di sterilizzazione dei semiCondizioni della camera di crescita
