La piattaforma automatizzata per l'accettazione a bassa tensione proposta integra l'Internet delle Cose (IoT), l'orchestrazione visiva dei flussi di lavoro, il computing edge e cloud, l'ingegneria delle caratteristiche e il machine learning per automatizzare i test di accettazione dei sistemi a bassa tensione (LV). La piattaforma consente il rilevamento intelligente dei guasti, decisioni in tempo reale, accettazione automatizzata, elevata accuratezza, bassa latenza operativa e distribuzione scalabile.
È richiesta un abbonamento a JoVE per visualizzare questo contenuto. Accedi o inizia la tua prova gratuita.
Articolo di ricerca
Una piattaforma di automazione per l'accettazione a bassa tensione guidata da processi, con orchestrazione visiva del workflow e validazione tramite apprendimento automatico
In questo articolo
Sommario
Abstract
The rapid expansion of low-voltage (LV) networks and their integration with distributed energy resources requires intelligent and automated management solutions. Cloud-edge collaborative Internet of Things (IoT) platforms support real-time monitoring, control, and data acquisition. However, existing platforms generally lack workflow automation, visual process orchestration, user-guided decision support, and comprehensive validation. Consequently, they do not provide process-driven solutions for automated LV network acceptance testing. This study presents the design and evaluation of a Low-Voltage Acceptance Automation Platform based on a visualized process canvas. The proposed platform adopts a process-driven architecture in which acceptance workflows are visually created, managed, and executed. The visual process canvas transforms conventional static monitoring into dynamic workflow automation by enabling real-time workflow execution, validation, and decision-making. The framework incorporates the Open LV Network & Smart Meter dataset to support realistic modeling of electrical load behavior. The workflow includes IoT-based data acquisition, data preprocessing, feature engineering, workflow orchestration using the visual process canvas, machine learning-based validation, and real-time dashboard visualization. The proposed framework achieved a fault detection rate of 98.4%, a receiver operating characteristic area under the curve (ROC-AUC) of 0.968, and an operational decision latency of 31 ms, outperforming traditional cloud-centric and IoT-based baseline approaches by approximately 30%–40%.
Introduzione
L'Industria 4.0 (I4.0)1 è resa possibile da diverse tecnologie emergenti, tra cui l'Internet Industriale delle Cose (IIoT), una delle più importanti. L'IIoT indica l'applicazione delle tecnologie dell'Internet delle Cose (IoT) in ambienti industriali, dove dispositivi e macchine interconnessi comunicano principalmente attraverso interazioni da macchina a macchina. Poiché i guasti nei sistemi industriali possono causare perdite operative significative, le applicazioni IIoT richiedono comunicazioni altamente affidabili, generando al contempo volumi di dati notevolmente maggiori rispetto ai sistemi IoT convenzionali2. Inoltre, alcuni studi considerano l'IIoT un concetto strettamente legato all'Industria 4.03. Le tecnologie IoT stanno trasformando le tradizionali architetture gerarchiche, consentendo sistemi più flessibili con uno scambio di dati senza interruzioni4. Numerosi studi recenti hanno esaminato le architetture IIoT esistenti e proposto nuovi modelli di riferimento5,6,7,8,9. Nonostante questi progressi, permangono due limitazioni principali. In primo luogo, nuovi modelli vengono spesso proposti per superare i difetti delle architetture precedenti, portando a un numero crescente di modelli alternativi che aumentano la diversità architetturale e la complessità di implementazione. In secondo luogo, l'elevato livello di astrazione associato a molte architetture proposte limita la loro adozione pratica in ambienti industriali10.
In letteratura sono state riportate diverse architetture IIoT. È stata presentata un'architettura IIoT basata sullo standard Open Platform Communications (OPC), insieme a un middleware Python per la gestione delle comunicazioni OPC11. È stata proposta un'architettura IIoT a sette strati; tuttavia, non sono stati forniti dettagli implementativi né esperimenti di validazione12. È stato descritto un framework che integra le tecnologie 5G e IIoT, insieme a un caso d'uso rappresentativo, sebbene la validazione sperimentale sia stata limitata13. È stato introdotto un framework di design emotivo per l'Industria 4.0 e ne sono state discusse le potenziali implicazioni, senza verifica sperimentale14. Una piattaforma IIoT multilivello è stata valutata in un testbed reale, con particolare attenzione alle considerazioni di telecomunicazione15. Analogamente, è stato presentato un framework modulare IoT per il monitoraggio della qualità dell'aria negli ambienti interni e le sue prestazioni sono state valutate utilizzando dati raccolti da 84 famiglie con bambini16.
L'Internet delle Cose (IoT) è diventata una tecnologia in rapida evoluzione con notevole potenziale di applicazione nel settore dell'energia elettrica17,18. L'integrazione delle tecnologie IoT nei nodi del sistema elettrico consente una generazione, trasmissione, distribuzione, gestione e utilizzo dell'energia più intelligenti ed efficienti, grazie a decisioni autonome supportate da un monitoraggio continuo in tempo reale del flusso di elettricità all'interno della rete intelligente. Di conseguenza, questi nodi intelligenti migliorano le prestazioni operative complessive della rete elettrica19. La tecnologia di comunicazione rappresenta un componente fondamentale per l'implementazione della rete intelligente, poiché devono essere trasmessi in modo affidabile due principali tipi di informazioni: le misurazioni dei sensori e i segnali di controllo. Oltre a una bassa latenza di comunicazione, le applicazioni delle reti intelligenti richiedono un'adeguata qualità del servizio (QoS) e una sufficiente sicurezza dei dati per garantire un funzionamento affidabile20.
La selezione di una tecnologia di comunicazione appropriata per le applicazioni della smart grid richiede di considerare gli intervalli di comunicazione, i tassi di trasmissione dei dati e i costi di comunicazione21. Le reti di comunicazione IoT comprendono tipicamente strati software, di sicurezza, di servizio, di sistema e di connettività. All'interno dello strato di connettività, i protocolli di comunicazione vengono generalmente classificati in tre categorie. I protocolli a lungo raggio includono Long Range (LoRa) e Narrowband-IoT (NB-IoT); i protocolli a medio raggio includono Wi-Fi, 4G/LTE e 5G; e i protocolli a corto raggio includono Bluetooth e ZigBee. Con l'aumento della deregolamentazione dei mercati elettrici, la previsione del carico è diventata più importante per valutare gli effetti delle condizioni meteorologiche, dei guasti degli apparecchi, dei cambiamenti normativi e di altri fattori operativi sul costo dei servizi elettrici. Di conseguenza, una previsione accurata del carico residenziale è diventata essenziale per il funzionamento e la supervisione di smart grid, microgrid e edifici intelligenti22.
Il funzionamento affidabile delle reti a bassa tensione (LV) dipende dal mantenimento di un'elevata qualità dell'energia23. La qualità dell'energia è determinata dall'efficacia della regolazione della tensione, del bilanciamento della corrente e della riduzione dei disturbi tecnici in condizioni operative squilibrate24. Tra questi fattori, il bilanciamento delle fasi è particolarmente importante poiché determina la distribuzione uniforme di tensioni e correnti tra le fasi25. Un cattivo bilanciamento delle fasi può aumentare il riscaldamento dei conduttori, le deviazioni di tensione e le correnti di neutro, riducendo così l'efficienza del sistema e l'affidabilità operativa26. Di conseguenza, il bilanciamento delle fasi dovrebbe essere considerato durante la fase di progettazione al fine di migliorare le prestazioni del sistema, la stabilità operativa e l'affidabilità a lungo termine. Tuttavia, questo aspetto raramente viene integrato nelle metodologie convenzionali di progettazione di mini-reti.
Recenti progressi nei sistemi di orchestrazione dei flussi di lavoro hanno dimostrato i vantaggi dell'automazione basata su eventi e della gestione visiva dei processi negli ambienti IoT industriali. Tuttavia, la loro applicazione alla validazione delle reti di distribuzione e ai test di accettazione a bassa tensione rimane limitata. La maggior parte dei sistemi di automazione esistenti a bassa tensione si concentra principalmente sul monitoraggio e sul controllo supervisione, mentre sono relativamente pochi gli studi che analizzano la gestione dell'accettazione basata sui flussi di lavoro o la verifica automatica della conformità. Analogamente, sebbene le tecniche di machine learning abbiano suscitato notevole interesse per il rilevamento di anomalie nei contatori intelligenti e per la valutazione della qualità dell'energia, questi approcci vengono generalmente sviluppati come modelli analitici indipendenti piuttosto che come componenti di un framework integrato di orchestrazione dei flussi di lavoro.
Negli ultimi anni sono state proposte diverse soluzioni di contatori energetici intelligenti per la gestione degli edifici intelligenti e l'automazione domestica27. Un prototipo di contatore intelligente è stato presentato nella riferimento27 per dimostrare l'integrazione di concetti educativi a livello universitario nelle tecnologie di misurazione intelligente. Il contatore intelligente sviluppato ha mostrato un potenziale significativo per la gestione e il controllo dell'energia, riducendo il consumo energetico e favorendo sia i fornitori di servizi che i consumatori attraverso una comunicazione IoT bidirezionale. Successivamente è stato introdotto un sistema di presa intelligente basato su microcontrollore per supportare il monitoraggio intelligente dell'energia28.
Il sistema proposto di presa intelligente visualizza in tempo reale il consumo energetico attraverso un'interfaccia grafica utente basata su Android. Inoltre, il dispositivo è in grado di rilevare la presenza di apparecchi elettrici collegati, una funzionalità nota come misurazione invasiva del carico28. Per l'implementazione è stata utilizzata una presa intelligente commerciale a basso costo. Tra i possibili miglioramenti futuri figurano il monitoraggio della corrente efficace (RMS), della potenza attiva, della potenza reattiva e dell'angolo di fase tra tensione e corrente. Come descritto nei nostri studi precedenti, una microrete fotovoltaica parzialmente connessa alla rete utilizza i protocolli di comunicazione ZigBee e LoRa per scambiare informazioni con dispositivi di contatori intelligenti, dimostrando la fattibilità della comunicazione abilitata all'IoT per sistemi energetici distribuiti29,30.
Per affrontare i limiti della pianificazione convenzionale dei sistemi di distribuzione, la pratica ingegneristica e la ricerca scientifica hanno fatto progressi lungo diverse direzioni complementari. Una direzione di ricerca si è concentrata sulla pianificazione strategica mediante l'uso dei sistemi informativi geografici (GIS) per la selezione dei siti e la valutazione preliminare delle risorse31,32. Un'altra direzione ha puntato al miglioramento di singoli componenti e sottosistemi, inclusa la scelta dei conduttori, il dimensionamento ottimale della generazione e dell'accumulo di energia, e valutazioni comparative tra sistemi di distribuzione in corrente alternata (AC) e in corrente continua (DC)33,34,35,36. Una terza direzione di ricerca ha applicato algoritmi di ottimizzazione alla pianificazione delle reti di distribuzione, al tracciamento dei circuiti e alla progettazione della topologia della rete. Tra i recenti sviluppi figurano framework come la piattaforma uGrid dei ricercatori, che integra il posizionamento dei dispositivi e la configurazione della rete ma non include un'analisi standard del flusso di potenza per la verifica e l'ottimizzazione. Altri approcci si basano sull'ottimizzazione manuale dei parametri per la generazione della topologia o si concentrano su applicazioni specializzate, come microreti in corrente continua a bassa potenza37,38,39. Sebbene questi approcci rappresentino un notevole progresso, è necessario ulteriore lavoro per stabilire un metodo integrato per la progettazione end-to-end dei sistemi di distribuzione a bassa tensione. Inoltre, le valutazioni tecnico-economiche complete dei sistemi monofase, trifase e ibridi a bassa tensione rimangono limitate.
I recenti progressi nell'intelligenza artificiale (AI) e nell'apprendimento automatico hanno ulteriormente ampliato le capacità dei sistemi elettrici intelligenti. Una revisione esaustiva ha riassunto le applicazioni dell'intelligenza artificiale e dell'apprendimento automatico nelle reti intelligenti, inclusi tecnologie emergenti come l'Apprendimento Federato, l'Intelligenza Artificiale Generativa, i Modelli Linguistici di Grandi Dimensioni, l'Internet delle Cose con Intelligenza Artificiale (AIoT) e i Gemelli Digitali40. La revisione ha evidenziato applicazioni nella previsione dei carichi, nella manutenzione predittiva, nel rilevamento delle anomalie, nella gestione della domanda e nell'integrazione dei veicoli elettrici, sottolineando al contempo le sfide persistenti relative all'interoperabilità, alla privacy, alla scalabilità, alla robustezza e alle considerazioni etiche. Un'altra revisione recente ha valutato metodi di intelligenza artificiale per la gestione decentralizzata dell'energia nelle infrastrutture IoT-edge-cloud, concentrandosi sull'apprendimento automatico, sull'apprendimento per rinforzo e sui sistemi multi-agente per il controllo energetico decentralizzato41.
Nel complesso, studi precedenti hanno fatto progressi nel monitoraggio abilitato da IoT, nella contabilizzazione intelligente, nel cloud-edge computing, nell'intelligenza artificiale e nella gestione intelligente dell'energia per sistemi di distribuzione a bassa tensione (LV). Tuttavia, queste tecnologie sono state sviluppate principalmente in modo indipendente. L'orchestrazione dei flussi di lavoro, la gestione automatizzata dell'accettazione, la convalida guidata dai processi e il supporto decisionale integrato rimangono limitati, evidenziando la necessità di un framework unificato orientato ai flussi di lavoro per l'automazione.
Di conseguenza, questo studio presenta una Piattaforma di Automazione per l'Accettazione a Basso Voltaggio basata su una Tela di Processo Visualizzata. Il framework proposto integra all'interno di un'architettura unificata l'acquisizione dati basata su IoT, la pre-elaborazione dei dati, l'ingegnerizzazione delle caratteristiche, l'orchestrazione dei flussi di lavoro, la validazione basata su apprendimento automatico, il calcolo cloud-edge e la visualizzazione in tempo reale, al fine di supportare test di accettazione automatizzati e affidabili delle reti a bassa tensione mediante dati reali provenienti da contatori intelligenti. Figura 1 fornisce una panoramica dell'architettura orientata ai flussi di lavoro della piattaforma proposta. Il flusso di lavoro comprende l'acquisizione dati, la pre-elaborazione, l'ingegnerizzazione delle caratteristiche, l'orchestrazione del flusso di lavoro, il processo decisionale intelligente e l'integrazione cloud-edge, consentendo una validazione automatizzata delle reti di distribuzione in bassa tensione attraverso un framework orientato al processo. La piattaforma ha dimostrato un'elevata accuratezza nella validazione, riducendo al contempo la latenza nelle decisioni operative e il tempo di esecuzione del flusso di lavoro rispetto agli approcci convenzionali.
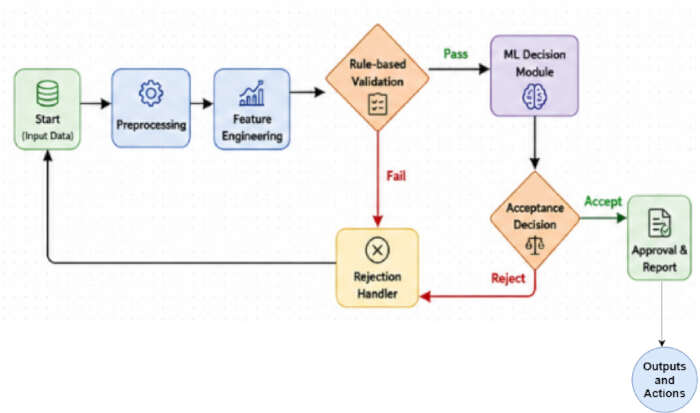
Figura 1. Architettura orientata al flusso di lavoro della piattaforma proposta per l'automazione dell'accettazione a bassa tensione. Architettura di alto livello della piattaforma proposta per l'automazione del processo di accettazione a bassa tensione (LV). Il framework illustra l'integrazione sequenziale dell'acquisizione dati abilitata da IoT, della pre-elaborazione dei dati, dell'ingegnerizzazione delle caratteristiche, dell'orchestrazione dei flussi di lavoro, della decisione intelligente, della collaborazione cloud-edge e dell'accettazione automatizzata per la convalida della rete di distribuzione in bassa tensione. IoT = Internet of Things; LV = bassa tensione; ML = machine learning. Cliccare qui per visualizzare una versione ingrandita di questa figura.
Accesso limitato. Accedi o avvia una prova gratuita per visualizzare questo contenuto.
Protocollo
This study did not involve human participants, animals, or identifiable personal data. The analyses were performed using a publicly available dataset (UK Power Networks Open LV Network & Smart Meter dataset) together with synthetically generated data for validation; therefore, ethics committee approval and informed consent were not required. The research tools used in the protocol are listed in the Table of Materials.
1. Data acquisition
The Low-Voltage (LV) Acceptance Automation Platform was developed using electrical measurements acquired from smart meters, IoT sensors, and the Open LV Network & Smart Meter Dataset. Electrical parameters, including voltage, current, active power, reactive power, and energy consumption, were collected through Wi-Fi-, PLC-, and RS-485-based communication protocols. Real-time measurements were used for live system monitoring, whereas historical data supported model development and validation.
The proposed framework used the Open LV Network & Smart Meter Dataset provided by UK Power Networks42. The dataset comprises household smart meter consumption, feeder-level load profiles, and feeder voltage measurements. Time-series subsets containing load consumption and voltage data were selected for model training and evaluation. In addition, a simulated smart meter dataset was generated to represent operational conditions and fault scenarios required for workflow validation and machine learning model evaluation. The simulated dataset included timestamped measurements of voltage, current, active power, reactive power, energy consumption, total harmonic distortion (THD), and voltage imbalance. Fault samples were generated by simulating undervoltage, overvoltage, excessive harmonic distortion, and voltage imbalance based on established low-voltage operational thresholds. The dataset characteristics are summarized in Table 1.
| Attribute | Description |
| Dataset Name | Open LV Network & Smart Meter Dataset |
| Simulated Smart Meter Dataset | Geneated 1000 smaples for Fault simulation and workflow validation |
| Data Type | Time-series (historical smart meter data) |
| Data Granularity | Household-level and feeder-level measurements |
| Key Features | Voltage, current, active power, reactive power, energy consumption, timestamps |
| Data Frequency | High-resolution (e.g., half-hourly / minute-level depending on subset) |
| Coverage | Residential low-voltage distribution networks |
| Usage in Proposed Work | Model training, validation, load behavior analysis, and acceptance workflow evaluation |
Table 1: Dataset description. Summary of the Open LV Network & Smart Meter dataset used for model development and performance evaluation. The table presents the dataset components, measured electrical variables, sampling characteristics, and dataset partitioning for training, validation, and testing.
Because the Open LV Network & Smart Meter Dataset does not contain predefined fault labels, a rule-based labeling strategy was applied to both the real and simulated datasets. Samples satisfying normal operating limits were assigned a label of 0 (Normal), whereas samples exceeding operational thresholds (e.g., voltage deviations greater than ±10% of the nominal voltage, THD > 5%, or voltage unbalance > 2%) were assigned a label of 1 (Fault). These labels served as the ground truth during model training, validation, and testing. The proposed rule engine also allows threshold values to be configured in accordance with regional standards or utility-specific acceptance criteria.
The dataset was partitioned into training (70%), validation (15%), and testing (15%) subsets. Missing values were addressed using linear interpolation, mean imputation, and forward-fill techniques as described in the preprocessing stage. To ensure statistical robustness and reproducibility, all experiments were repeated five times using different random seeds.
2. Data preprocessing
Raw data from the Open LV Network & Smart Meter Dataset and IoT sensor measurements were preprocessed to improve data quality prior to feature extraction and model development. Missing values, noise, and inconsistencies caused by communication interruptions and sensor malfunctions were identified and corrected using interpolation, mean imputation, and forward-fill techniques. The detailed mathematical derivations are provided in Supplementary File 1 (Section S1).
The preprocessed time-series data were segmented into representative operational intervals (S₁–S₅ and Sk). Statistical and electrical features, including average load, peak load, minimum load, standard deviation, voltage deviation, and power consumption, were extracted from each segment. The extracted features are summarized in Table 2 and served as inputs for the subsequent feature engineering stage.
| Segment ID | Mean Load (kW) | Peak Load (kW) | Min Load (kW) | Std Deviation (kW) | Voltage Deviation (p.u.) | Power Consumption (kWh) | Time Interval |
| S₁ | 2.45 | 3.8 | 1.2 | 0.65 | 0.032 | 58.4 | 00:00–01:00 |
| S₂ | 2.9 | 4.1 | 1.5 | 0.72 | 0.028 | 64.2 | 01:00–02:00 |
| S₃ | 3.25 | 4.85 | 1.8 | 0.81 | 0.035 | 71.6 | 02:00–03:00 |
| S₄ | 3.8 | 5.2 | 2.1 | 0.9 | 0.041 | 78.9 | 03:00–04:00 |
| S₅ | 4.1 | 5.75 | 2.4 | 0.95 | 0.045 | 85.3 | 04:00–05:00 |
| Sk | 3.6 | 5.1 | 2 | 0.88 | 0.038 | 76.5 | tk |
Table 2: Representative feature representation extracted from time-series segments. Representative statistical, electrical, load behavior, voltage stability, and power quality features extracted from segmented LV time-series data during feature engineering. The values illustrate the engineered feature representation and are not experimental performance results. LF = Load Factor; PAR = Peak-to-Average Ratio; VSI = Voltage Stability Index; PF = Power Factor; THD = Total Harmonic Distortion.
3. Feature engineering
Feature engineering was performed to improve the representation of the preprocessed data for workflow orchestration and intelligent decision-making. Principal Component Analysis (PCA)^43 was applied to reduce data dimensionality by removing redundant and highly correlated variables while retaining the most informative feature components. The mathematical derivations are provided in Supplementary File 1 (Section S2).
Statistical descriptors, load behavior indicators, voltage stability indices, and power quality metrics were derived from the segmented time-series data. These engineered features included Load Factor (LF), Peak-to-Average Ratio (PAR), Voltage Stability Index (VSI), Voltage Unbalance Index, Power Factor (PF), and Total Harmonic Distortion (THD). The resulting feature set was used as the input to the workflow orchestration and intelligent decision-making modules.
The feature engineering workflow is summarized in Supplementary File 1 (Supplementary Algorithm 1). The procedure consisted of segmenting the preprocessed data, extracting statistical and electrical features, calculating load behavior, voltage stability, and power quality indicators, and applying PCA to generate the final feature vector used for model training and validation.
4. Visualized process canvas design
The Visualized Process Canvas was developed as a graph-based workflow orchestration framework for automating low-voltage (LV) acceptance procedures. The workflow was represented as a directed graph, G = (N, E), where N = {n1, n2, …, nm}denotes the workflow nodes corresponding to individual processing stages (e.g., data input, preprocessing, validation, and decision-making), and E = {eij}represents the directed edges defining the execution sequence between nodes. This graph-based representation enabled the creation of configurable workflows and their automated execution without manual coding.
Each workflow node performed a specific processing task by receiving input data, executing predefined operations, and forwarding the processed output to subsequent nodes. Acceptance criteria, including voltage and load thresholds, were implemented as configurable validation rules that could be updated without modifying the workflow structure. The workflow supported both sequential and parallel execution to improve computational efficiency. Machine learning models were integrated into designated workflow nodes to perform anomaly detection and automated acceptance validation (Figure 2).
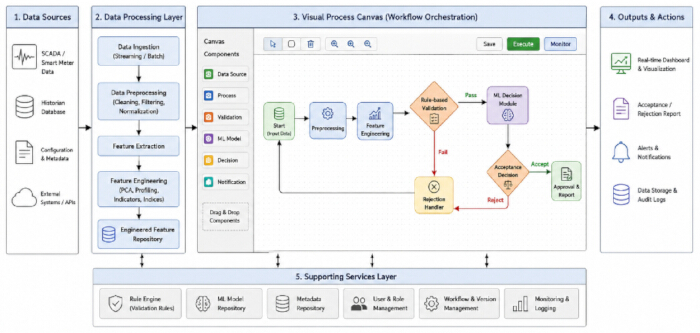
Figure 2: Visualized process canvas architecture for LV acceptance automation. Overview of the visual workflow orchestration framework used for LV acceptance automation. The process canvas illustrates the graphical organization of workflow nodes for data processing, feature engineering, rule-based validation, intelligent decision-making, and output generation to support workflow design, execution, and monitoring. Please click here to view a larger version of this figure.
The mathematical formulation describing information flow through the workflow graph is provided in Supplementary File 1 (Section S3). Supplementary File 1 (Supplementary Algorithm 2) describes the workflow orchestration procedure, including workflow traversal, node execution, rule validation, decision generation, and output aggregation.
The Visualized Process Canvas was implemented using a microservice-oriented software architecture to support scalability and modular deployment. The graphical workflow interface was developed using React.js to provide drag-and-drop workflow configuration. Backend orchestration services were implemented using Flask/FastAPI, while Eclipse Mosquitto served as the MQTT message broker for communication between workflow modules. EdgeX Foundry provided edge device management and IoT integration. Machine learning services were implemented with Scikit-learn, TensorFlow, and PyTorch, and containerized with Docker and Kubernetes.
5. Workflow orchestration engine
The workflow orchestration engine coordinated execution of the configured acceptance workflow. A detailed description is provided in Supplementary File 1 (Section S4), and the execution sequence is summarized in Supplementary Figure 1.
The workflow execution process consisted of validating the workflow definition, initializing the execution environment, scheduling workflow nodes according to their dependencies, executing nodes sequentially or in parallel, applying rule-based validation, aggregating intermediate outputs, and generating the final acceptance or rejection decision based on rule-based and machine learning evaluation. Execution results were published through dashboards, reports, application programming interfaces (APIs), and data storage services. The overall workflow orchestration process is illustrated in Figure 3.
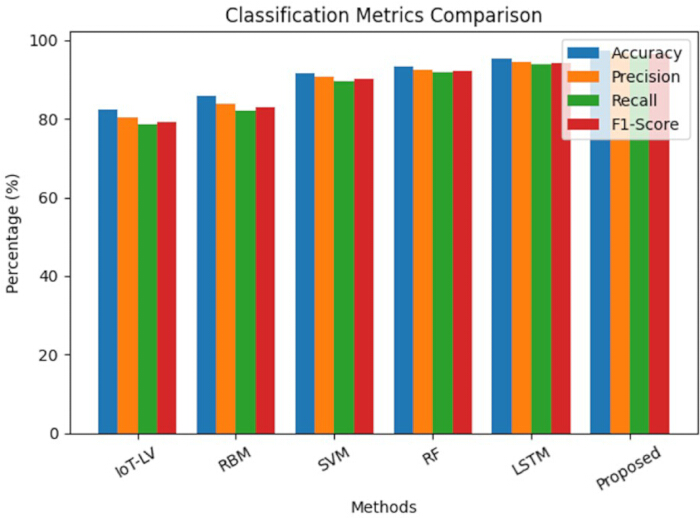
Figure 3: Comparison of classification performance metrics across different methods. Comparison of the classification performance of IoT-LV, RBM, Support Vector Machine (SVM), Random Forest (RF), Long Short-Term Memory (LSTM), and the proposed framework using the Open LV Network & Smart Meter dataset. Performance is evaluated using Accuracy, Precision, Recall, and F1-score. Results are presented as mean ± standard deviation (SD) from five independent experimental runs using a 70%/15%/15% training/validation/testing split. Error bars represent one standard deviation. Please click here to view a larger version of this figure.
6. Intelligent decision module
The Intelligent Decision Module was developed to automate low-voltage (LV) acceptance decisions using supervised machine learning models. Classification and regression algorithms were applied to the engineered feature vectors to support operational decision-making. Classification models identified normal and abnormal operating conditions, whereas regression models estimated future energy consumption and operational trends.
The input feature vector, X ∈ ℝd, comprised the statistical, voltage stability, load behavior, and power quality features extracted during the feature engineering stage. Standalone Support Vector Machine (SVM)44, Random Forest (RF)45, and Long Short-Term Memory (LSTM)46 models were implemented as baseline classifiers for comparative evaluation. The mathematical formulation of the learning models is provided in Supplementary File 1 (Section S5).
For classification, the output variable y ∈ {0,1} represented normal (0) and abnormal (1) operating conditions. When abnormal operating conditions or overload events were detected, the workflow generated a fault notification and flagged the acceptance process as invalid; otherwise, the process was classified as accepted.
The workflow orchestration engine integrated machine-learning predictions with rule-based validation, using a priority-based conflict-resolution strategy. Safety-critical operational rules and regulatory acceptance criteria were treated as hard constraints and therefore took precedence over machine-learning predictions when conflicts occurred. Final acceptance decisions were generated using the combined outputs of the rule-based validation and intelligent decision modules.
7. Cloud–edge integration and visualization dashboard
A cloud-edge computing architecture was implemented to support scalable data processing, storage, and visualization for the LV acceptance automation platform. Smart meters, SCADA systems, and IoT devices continuously collect electrical measurements, which are processed at the edge layer via filtering, normalization, feature extraction, and real-time inference to reduce communication overhead and enable low-latency decision-making. The mathematical derivations are provided in Supplementary File 1 (Section S6).
Processed data were transmitted to the cloud layer for long-term storage, advanced analytics, feature engineering, model training, and model management. Interactive dashboards provided real-time system monitoring, alerts, reporting, and operational decision support. The cloud-edge architecture is illustrated in Supplementary Figure 2, and the implementation details are summarized in Table 3.
| Layer | Component | Hardware / Software | Specification / Version | Purpose / Description |
| Edge Layer | Edge Device | Raspberry Pi 4 / NVIDIA Jetson Nano | Quad-core CPU, 4–8 GB RAM | Real-time data acquisition and local processing |
| IoT Gateway | Industrial IoT Gateway | MQTT / Modbus / OPC-UA support | Communication between sensors and edge/cloud | |
| Sensors / Smart Meters | Digital Smart Meters | Voltage, Current, Power Measurement | Data collection from LV network | |
| Edge Software | Python, EdgeX Foundry, MQTT Broker | Python 3.x | Data preprocessing, filtering, local inference | |
| Communication Protocols | Wi-Fi / PLC / RS-485 | Standard protocols | Data transmission to cloud layer | |
| Cloud Layer | Cloud Platform | AWS / Microsoft Azure / Google Cloud | Scalable cloud services | Data storage, analytics, and model training |
| Storage | AWS S3 / Azure Blob / InfluxDB | Time-series database | Storing historical and real-time data | |
| Compute & ML | Python, TensorFlow, PyTorch, Scikit-learn | ML libraries (latest versions) | Model training, evaluation, deployment | |
| Containerization | Docker, Kubernetes | Latest stable versions | Workflow orchestration and scalability | |
| Data Processing | Apache Spark / Pandas | Distributed processing | Large-scale data analytics | |
| Visualization Layer | Dashboard Tools | Grafana / Apache Superset / Plotly Dash | Web-based tools | Real-time monitoring and visualization |
| Web Framework | React.js / Angular / Flask / FastAPI | Modern web stack | UI development and API integration | |
| Notification System | Email / SMS Gateway / Push Notifications | Twilio / Firebase | Alert generation and communication | |
| API Services | REST APIs | JSON-based communication | Integration between modules |
Table 3: System implementation details. Summary of the hardware configuration, software environment, communication protocols, and cloud–edge computing components used for implementing the proposed LV acceptance automation platform.
Accesso limitato. Accedi o avvia una prova gratuita per visualizzare questo contenuto.
Risultati
The performance of the proposed Low-Voltage (LV) Acceptance Automation Platform was evaluated using the Open LV Network & Smart Meter Dataset together with a synthetic smart meter dataset generated to represent additional operating conditions and fault scenarios. The synthetic dataset enabled controlled evaluation of workflow orchestration, intelligent decision-making, and fault detection under abnormal operating conditions. The Open LV Network & Smart Meter Dataset comprised household smart meter measurements, f...
Accesso limitato. Accedi o avvia una prova gratuita per visualizzare questo contenuto.
Discussione
The experimental evaluation demonstrated that the proposed workflow-oriented Low-Voltage (LV) Acceptance Automation Platform consistently outperformed the benchmark approaches in classification, forecasting, fault detection, operational decision latency, and scalability. These performance improvements resulted from the integration of advanced feature engineering, workflow orchestration, cloud-edge collaboration, and hybrid rule-based and machine learning decision-making rather than from the use of a single machine learni...
Accesso limitato. Accedi o avvia una prova gratuita per visualizzare questo contenuto.
Dichiarazioni
Gli autori dichiarano di non avere interessi finanziari o non finanziari in conflitto.
Ringraziamenti
The authors thank the UK Power Networks Open Data Portal for providing the publicly available Open LV Network & Smart Meter dataset used in this study. This research received no external funding.
Accesso limitato. Accedi o avvia una prova gratuita per visualizzare questo contenuto.
Materiali
| Nome | Azienda | Numero di catalogo | Commenti |
|---|---|---|---|
| Apache Spark | Fondazione Apache Software | Versione 3.4+ | Analisi dati su larga scala |
| Apache Superset | Fondazione Apache Software | Versione 3.x | Pannello analitico |
| Docker Engine | Docker Inc. | Versione 24.x | Distribuzione applicazioni |
| Broker MQTT Eclipse Mosquitto | Fondazione Eclipse | Versione 2.x | Scambio dati |
| EdgeX Foundry (versione Jakarta o successiva) | LF Edge (Linux Foundation) | Versione Jakarta / Geneva | Gestione dispositivi edge |
| Flask / FastAPI | Progetti Pallets / Sebastián Ramírez | Flask 2.3+ / FastAPI 0.100+ | Integrazione API backend |
| Grafana | Grafana Labs | Versione 10.x | Visualizzazione e monitoraggio |
| Gateway IoT industriale | Advantech / Siemens | ECU-1251 / SIMATIC IOT2040 | Comunicazione da sensore al cloud |
| Sensori IoT (sensori di tensione/corrente) | Texas Instruments / Analog Devices | INA219 / ACS712 | Monitoraggio in tempo reale della rete |
| Kit per sviluppatori Jetson Nano | NVIDIA Corporation | 945-13450-0000-100 | Inferenza AI edge |
| Kubernetes | Fondazione Cloud Native Computing (CNCF) | Versione 1.27+ | Scalabilità del flusso di lavoro |
| Modello LSTM (Keras/TensorFlow) | Google (TensorFlow/Keras) | Incluso in TF 2.12+ | Previsione e previsione del carico |
| Modulo PLC (Power Line Communication) | STMicroelectronics | ST7580 | Comunicazione nella smart grid |
| Plotly Dash | Plotly Inc. | Versione 2.x | Visualizzazione interattiva |
| Python 3.10 | Fondazione Python Software | Versione 3.10.x | Elaborazione dati e analisi |
| PyTorch | Meta AI | Versione 2.0+ | Implementazione di deep learning |
| Algoritmo Random Forest | Scikit-learn | Incluso nella versione 1.3+ | Classificazione dei guasti |
| Raspberry Pi 4 Modello B (4 GB di RAM) | Fondazione Raspberry Pi | RPI4-MODBP-4GB | Elaborazione edge |
| React.js / Angular | Meta / Google | React 18.x / Angular 16+ | Sviluppo dell'interfaccia utente |
| Modulo trasceiver RS-485 | Maxim Integrated (Analog Devices) | MAX485 | Connettività dispositivi industriali |
| Scikit-learn | Sviluppatori Scikit-learn | Versione 1.3+ | Modelli di machine learning |
| Macchina a vettori di supporto (SVM) | Scikit-learn | Incluso nella versione 1.3+ | Classificazione e convalida |
| TensorFlow | Google LLC | Versione 2.12+ | Addestramento del modello |
| Twilio / Firebase Cloud Messaging | Twilio Inc. / Google | Non applicabile | Avvisi e notifiche |
| Modulo Wi-Fi | Espressif Systems | ESP8266 / ESP32 | Trasmissione dati |
| XGBoost | DMLC (Distributed ML Community) | Versione 1.7+ | Supporto decisionale intelligente |
Riferimenti
- Tong L, Zhou J, Li J. IoT-based low-voltage power distribution system management and control platform. Front Energy Res. 2022;10:902715. https://doi.org/10.3389/fenrg.2022.902715
- Babayigit B, Abubaker M. Industrial Internet of Things: A review of improvements over traditional SCADA systems for industrial automation. IEEE Syst J. 2023;18:120–133.
- Nakagawa EY, et al. Industry 4.0 reference architectures: State of the art and future trends. Comput Ind Eng. 2021;156:107241. https://doi.org/10.1016/j.cie.2021.107241
- Ladegourdie M, Kua J. Performance analysis of OPC UA for industrial interoperability towards Industry 4.0. Internet Things. 2022;3:507–525.
- Bader SR, Maleshkova M, Lohmann S. Structuring reference architectures for the industrial Internet of Things. Future Internet. 2019;11:151. https://doi.org/10.3390/fi11070151
- Fun TS, Samsudin A. Recent technologies, security countermeasure and ongoing challenges of industrial Internet of Things (IIoT): A survey. Sensors (Basel). 2021;21:6647. https://doi.org/10.3390/s21196647
- Mirani AA, et al. Key challenges and emerging technologies in industrial IoT architectures: A review. Sensors (Basel). 2022;22:5836. https://doi.org/10.3390/s22155836
- Fraile F, et al. Reference models for digital manufacturing platforms. Appl Sci. 2019;9:4433. https://doi.org/10.3390/app9204433
- Serôdio C, et al. Software and architecture orchestration for process control in Industry 4.0 enabled by cyber-physical systems technologies. Appl Sci. 2024;14:2160. https://doi.org/10.3390/app14052160
- Ungurean I, Gaitan NC. A software architecture for the industrial Internet of Things—A conceptual model. Sensors (Basel). 2020;20:5603. https://doi.org/10.3390/s20195603
- Hsiao CH, Lee WP. OPIIoT: Design and implementation of an open communication protocol platform for industrial Internet of Things. Internet Things. 2021;16:100441. https://doi.org/10.1016/j.iot.2021.100441
- Domínguez-Bolaño T, et al. An overview of IoT architectures, technologies, and existing open-source projects. Internet Things. 2022;20:100626. https://doi.org/10.1016/j.iot.2022.100626
- Sasiain J, et al. Towards flexible integration of 5G and IIoT technologies in Industry 4.0: A practical use case. Appl Sci. 2020;10:7670. https://doi.org/10.3390/app10217670
- Cañas H, et al. A conceptual framework for smart production planning and control in Industry 4.0. Comput Ind Eng. 2022;173:108659. https://doi.org/10.1016/j.cie.2022.108659
- Cabrini FH, et al. Enabling the industrial Internet of Things to cloud continuum in a real city environment. Sensors (Basel). 2021;21:7707. https://doi.org/10.3390/s21227707
- Gabriel MF, et al. Implementation of an IoT architecture for promoting healthy air quality in 84 homes of families with children. Build Environ. 2024;266:112040. https://doi.org/10.1016/j.buildenv.2024.112040
- Silva BN, Khan M, Han K. Internet of Things: A comprehensive review of enabling technologies, architecture, and challenges. IETE Tech Rev. 2018;35:205–220.
- Dhaou ISB, et al. Internet of Things technologies for smart grid. In: Research Anthology on Smart Grid and Microgrid Development. IGI Global; Hershey; 2022. p. 805–832.
- Kondoro A, et al. A low latency secure communication architecture for microgrid control. Energies. 2021;14:6262. https://doi.org/10.3390/en14196262
- Tightiz L, Yang H. A comprehensive review on IoT protocols' features in smart grid communication. Energies. 2020;13:2762. https://doi.org/10.3390/en13112762
- Kondoro A, et al. Real-time performance analysis of secure IoT protocols for microgrid communication. Future Gener Comput Syst. 2021;116:1–12.
- Rodrigues R, et al. A review of solid-state circuit breakers. IEEE Trans Power Electron. 2020;36:364–377.
- IEEE. IEEE Std 1159-2019: IEEE recommended practice for monitoring electric power quality. IEEE; Piscataway (NJ); 2019. https://doi.org/10.1109/IEEESTD.2019.8800097
- Otcenasova A, et al. The influence of power quality indices on active power losses in a local distribution grid. Energies. 2019;12:1389. https://doi.org/10.3390/en12071389
- Ma K, et al. Review of distribution network phase unbalance: Scale, causes, consequences, solutions, and future research direction. CSEE J Power Energy Syst. 2020;6:479–488.
- Peppanen J, et al. Modeling power electronic equipment to improve distribution feeder current and voltage balance [Presentation]. Presented at: IEEE PES Transmission and Distribution Conference and Exposition (T&D); Denver, CO; 2018. Available from: https://ieeexplore.ieee.org/ https://doi.org/10.1109/TDC.2018.8440261
- Sayed S, et al. Design and realization of an open-source and modular smart meter. Energy Sci Eng. 2019;7:1405–1422.
- Satapathy LM, et al. Arduino based home automation using Internet of Things (IoT). Int J Pure Appl Math. 2018;118:769–778.
- Shaban M, et al. Design of a partially grid-connected photovoltaic microgrid using IoT technology. Appl Sci. 2021;11:11651. https://doi.org/10.3390/app112411651
- Shaban M, Dhaou IB. Design of an IoT-enabled microgrid architecture for a partial grid-connected mode [Presentation]. Presented at: 18th International Multi-Conference on Systems, Signals and Devices (SSD); Virtual; 2021. Available from: https://ieeexplore.ieee.org/ https://doi.org/10.1109/SSD52085.2021.9429443
- Taye BZ, et al. Rural electrification planning using geographic information system (GIS). Cogent Eng. 2020;7:1836730. https://doi.org/10.1080/23311916.2020.1836730
- Huld T, et al. Geospatial analysis of photovoltaic mini-grid system performance. Energies. 2017;10:218. https://doi.org/10.3390/en10020218
- Domínguez J, et al. IntiGIS-Local: A geospatial approach to assessing rural electrification alternatives for sustainable socio-economic development in isolated communities—A case study of Guasasa, Cuba. Energies. 2024;17:3835. https://doi.org/10.3390/en17153835
- Tafula JE, et al. Multicriteria decision-making approach for optimum site selection for off-grid solar photovoltaic microgrids in Mozambique. Energies. 2023;16:2894. https://doi.org/10.3390/en16062894
- Isihak S, et al. Evolution of GIS-based rural electrification planning models and an application of OnSSET in Nigeria. Renew Sustain Energy Transit. 2022;2:100019. https://doi.org/10.1016/j.rset.2022.100019
- Korkovelos A, et al. The role of open access data in geospatial electrification planning and the achievement of SDG7: An OnSSET-based case study for Malawi. Energies. 2019;12:1395. https://doi.org/10.3390/en12071395
- Cicilio P, et al. uGrid: Reliable minigrid design and planning toolset for rural electrification. IEEE Access. 2019;7:163988–163999.
- Nasir M, et al. Optimal planning and design of low-voltage low-power solar DC microgrids. IEEE Trans Power Syst. 2018;33:2919–2928.
- Vai V, et al. Optimal low-voltage distribution topology with integration of PV and storage for rural electrification in developing countries: A case study of Cambodia. J Mod Power Syst Clean Energy. 2020;8:531–539.
- Banad Y, Sharif S, Rezaei Z. Artificial intelligence and machine learning for smart grids: from foundational paradigms to emerging technologies with digital twin and large language model-driven intelligence. Energy Convers Manag X. 2025;28:101329. https://doi.org/10.1016/j.ecmx.2025.101329
- Álvarez-López C, González-Briones A, Li T. Explainable AI and multi-agent systems for energy management in IoT-edge environments: a state-of-the-art review. Electronics. 2026;15(2):385. https://doi.org/10.3390/electronics15020385
- UK Power Networks. Open data portal [Online]. Available from: https://www.ukpowernetworks.co.uk/our-company/open-data-portal (Accessed June 2026).
- Jolliffe IT. Principal Component Analysis. 2nd ed. Springer; New York; 2002. https://doi.org/10.1007/b98835
- Cortes C, Vapnik V. Support-vector networks. Mach Learn. 1995;20:273–297.
- Breiman L. Random forests. Mach Learn. 2001;45:5–32.
- Hochreiter S, Schmidhuber J. Long short-term memory. Neural Comput. 1997;9:1735–1780.
- Fawcett T. An introduction to ROC analysis. Pattern Recognit Lett. 2006;27:861–874.
- Montgomery DC, Runger GC. Applied Statistics and Probability for Engineers. 8th ed. John Wiley & Sons; Hoboken (NJ); 2020.
- Montgomery DC. Design and Analysis of Experiments. 10th ed. John Wiley & Sons; Hoboken (NJ); 2020.
Accesso limitato. Accedi o avvia una prova gratuita per visualizzare questo contenuto.