This retrospective cohort study evaluates the timing of dexamethasone administration in gynecological laparoscopy under enhanced recovery after surgery, demonstrating that preoperative administration is associated with reduced postoperative nausea and vomiting, attenuated inflammatory responses, and accelerated postoperative recovery.
Articolo di ricerca
Timing of Dexamethasone Administration for Gynecological Laparoscopy Under Enhanced Recovery After Surgery: A Retrospective Cohort Study
In questo articolo
Sommario
Abstract
Postoperative nausea and vomiting (PONV) remains a major barrier to implementing Enhanced Recovery After Surgery (ERAS) pathways in gynecological laparoscopy, while perioperative inflammation may delay postoperative recovery. The optimal timing of dexamethasone administration for PONV prophylaxis and attenuation of inflammatory responses remains uncertain. This retrospective cohort study enrolled 180 patients undergoing elective gynecological laparoscopy under standardized ERAS protocols who received 8 mg intravenous dexamethasone either 30 min before anesthesia induction or immediately after abdominal incision closure. The primary outcome was the 48-h incidence of PONV. Secondary outcomes included inflammatory biomarkers, namely C-reactive protein (CRP), interleukin-6 (IL-6), and tumor necrosis factor-alpha (TNF-α), ERAS recovery indicators, and safety outcomes. Preoperative dexamethasone administration was associated with a significantly lower 48-h PONV incidence than postoperative administration (16.7% vs. 40.0%, P < 0.001), accompanied by reduced symptom severity and shorter episode duration. Patients receiving preoperative dexamethasone also demonstrated lower inflammatory biomarker levels at 24 and 48 h, faster achievement of postoperative recovery milestones, and a shorter hospital length of stay (2.1 vs. 3.2 days, P < 0.001), while safety outcomes were comparable between groups. These findings suggest that preoperative dexamethasone administration is associated with improved PONV control, attenuated perioperative inflammatory responses, and accelerated recovery in patients undergoing ERAS gynecological laparoscopy and may represent a useful strategy for optimizing perioperative care in this population.
Introduzione
Postoperative nausea and vomiting (PONV) is among the most frequent adverse events after gynecological laparoscopic surgery, with an incidence of 70%–80% in high-risk patients, and represents a persistent obstacle to the implementation of Enhanced Recovery After Surgery (ERAS) protocols1,2. PONV not only impairs patient comfort but also delays early ambulation and oral intake, prolongs the length of hospital stay, and increases the healthcare burden3. Concurrently, perioperative inflammation induced by surgical trauma, characterized by elevated pro-inflammatory cytokines including interleukin-6 (IL-6) and tumor necrosis factor-alpha (TNF-α), contributes to postoperative pain, gastrointestinal dysfunction, and fatigue, all of which hinder coordinated early recovery4.
Dexamethasone, a long-acting glucocorticoid with combined antiemetic and anti-inflammatory properties, is broadly recommended for PONV prophylaxis in international perioperative care guidelines5,6. A substantial body of evidence, including multiple dedicated studies conducted in gynecological surgical populations, has confirmed the efficacy of dexamethasone in reducing PONV risk and improving short-term recovery7,8,9,10. Nevertheless, the optimal timing of dexamethasone administration relative to anesthesia induction or surgical closure remains incompletely defined. Several investigations have suggested that preoperative dexamethasone provides superior PONV control compared with postoperative dosing11,12,13, whereas other studies have observed no statistically significant difference in antiemetic efficacy between the two time points14,15. Of note, most existing comparisons were conducted under traditional perioperative care pathways rather than modern standardized ERAS protocols, and many focused primarily on PONV as a single endpoint, with limited integrated data on how administration timing influences dynamic inflammatory biomarker trajectories, comprehensive ERAS recovery milestones, and short-term clinical outcomes in patients undergoing gynecological laparoscopy.
This unresolved question has direct clinical relevance because coordinated early recovery within ERAS pathways depends on the simultaneous control of PONV, excessive inflammation, and opioid-related side effects. Clarifying the optimal timing of dexamethasone administration could therefore support more precise and protocolized perioperative medication use. Accordingly, this retrospective cohort study aimed to directly compare preoperative versus postoperative dexamethasone administration in patients undergoing elective gynecological laparoscopy under standardized ERAS protocols by evaluating integrated outcomes, including the 48-h incidence of PONV, perioperative inflammatory biomarker dynamics, ERAS recovery milestones, and safety, to provide practical evidence for refining perioperative care regimens in this patient population.
Protocollo
Study Design and Ethical Approval
This single-center, retrospective cohort study was conducted at the Maternal and Child Health Hospital of Hubei Province. The study protocol was approved by the Institutional Review Board of the Maternal and Child Health Hospital of Hubei Province (Approval No. 2026-077-01), which waived the requirement for individual informed consent due to the retrospective nature of the study and the use of de-identified patient data. The study was conducted in accordance with the Declaration of Helsinki and adhered to the Strengthening the Reporting of Observational Studies in Epidemiology (STROBE) guidelines.
Study Population
Eligible patients were women aged 25–65 years who underwent elective gynecological laparoscopy under the ERAS pathway between January 2022 and December 2024. The lower age limit of 25 years was selected based on local clinical practice characteristics: patients aged 18–24 years accounted for a very small proportion of elective gynecological laparoscopic cases at our center, with distinct disease spectra and baseline hormonal profiles that would introduce additional confounding. The 25–65-year age range therefore represents the core population undergoing elective gynecological laparoscopic surgery in our setting. Surgical procedures included ovarian cystectomy, myomectomy, hysterectomy, endometriosis surgery, and salpingectomy. Additional inclusion criteria were American Society of Anesthesiologists (ASA) physical status classification I–III, complete medical records including perioperative dexamethasone administration details, PONV assessments, inflammatory biomarker measurements, and recovery outcomes, and receipt of standardized ERAS protocol care.
Exclusion criteria included known hypersensitivity to dexamethasone or other glucocorticoids; contraindications to glucocorticoid use (uncontrolled diabetes mellitus, active severe infection, peptic ulcer disease, or systemic lupus erythematosus); use of antiemetics, glucocorticoids, non-steroidal anti-inflammatory drugs, or opioid analgesics within 24 h preoperatively; pregnancy or lactation; severe hepatic (Child-Pugh class B/C) or renal dysfunction; coagulation disorders; mental illness precluding accurate outcome assessment; conversion to open surgery; and missing key outcome data.
Patients with a history of PONV or motion sickness were not excluded from eligibility, as these are common, established PONV risk factors in routine clinical practice. Instead, this variable was included as a propensity score matching covariate to ensure balanced distribution between groups and minimize confounding.
Group Assignment and Propensity Score Matching
Group assignment was based on the actual timing of dexamethasone administration as documented in the electronic medical records. Propensity score matching (1:1) was performed using the nearest-neighbor method to balance baseline characteristics between groups. The matching covariates included age, body mass index, ASA physical status grade, surgical type, surgical duration, history of PONV/motion sickness, and comorbidities. A caliper width of 0.2 standard deviations of the logit of the propensity score was applied. Nearest-neighbor matching was performed without replacement. Standardized mean differences (SMDs) were calculated for all covariates before and after matching to evaluate covariate balance, with an SMD of <0.1 defined as indicating good balance. Covariate balance plots were generated to visually compare the distribution of propensity scores and individual covariate SMDs before and after matching. Outcome assessors and statistical analysts were blinded to group assignment during data extraction and analysis.
Standardized ERAS Protocol
All patients received identical standardized ERAS protocols throughout the study period. Preoperatively, patients fasted for 6 h for solid food and 2 h for clear liquids, received preoperative education on ERAS goals, and did not undergo routine mechanical bowel preparation. Intraoperatively, general anesthesia was induced with propofol (1.5–2.0 mg/kg), sufentanil (0.2–0.4 µg/kg), and cisatracurium (0.15–0.2 mg/kg), and was maintained with intravenous remimazolam (0.3–0.6 mg/kg/h), sevoflurane (1.0–1.5 minimum alveolar concentration [MAC]), and remifentanil (0.1–0.3 µg/kg/min). Pneumoperitoneum pressure was maintained at 12–14 mmHg, with active temperature maintenance (core temperature ≥ 36.0°C) and restrictive fluid management (crystalloids 5–7 mL/kg/h).
Postoperatively, patients received identical multimodal analgesia regimens in both groups, consisting of baseline analgesia with diclofenac sodium suppositories (50 mg per rectum every 12 h) and rescue analgesia with dezocine (5–10 mg IV) for a visual analog scale (VAS) pain score of ≥4. Given that dezocine may itself contribute to nausea and vomiting, it was treated as a potential confounding factor and adjusted for in the multivariable regression analysis. Early oral intake of clear liquids was initiated within 2 h postoperatively, and ambulation was encouraged within 6 h. Antiemetic rescue with tropisetron (5 mg IV) was administered only for a PONV VAS score of ≥4.
Dexamethasone Administration
Patients were divided into two groups based on the timing of dexamethasone administration. Group P (preoperative dexamethasone group) received 8 mg dexamethasone (2 mL of a 4 mg/mL solution) diluted in 10 mL normal saline and administered intravenously over 5 min, 30 min before anesthesia induction. Group A (postoperative dexamethasone group) received the identical dose and volume of dexamethasone administered intravenously immediately after surgical closure of the abdominal incision.
Outcome Measures and Data Collection
The primary outcome was the 48-h incidence of postoperative nausea and vomiting, defined as any episode of nausea or vomiting documented within 48 h after surgery. Secondary outcomes included PONV severity (VAS score 0–10) documented at 0–6 h, 6–24 h, and 24–48 h; PONV duration; rescue antiemetic use; inflammatory biomarkers (CRP, IL-6, and TNF-α) measured preoperatively and at 24 and 48 h postoperatively; ERAS recovery indicators, including time to first ambulation, time to first flatus, time to first defecation, postoperative pain scores, opioid consumption, and length of hospital stay; adverse events monitored for 7 days postoperatively; and patient satisfaction scores at discharge. A postoperative complication risk score was calculated for each patient as a composite of six postoperative complications: delayed ambulation (time to first ambulation > 6 h), delayed oral intake (time to first oral intake >6 h), prolonged ileus (time to first flatus > 24 h), wound infection, urinary retention, and respiratory events. Each complication was assigned a weighted score according to clinical severity: 10 points each for delayed ambulation and delayed oral intake, 15 points each for prolonged ileus and urinary retention, 20 points for wound infection, and 25 points for respiratory events. The total score ranged from 0 (no complications) to 95 (all six complications), with higher scores indicating a greater postoperative complication burden.
Venous blood samples were collected as part of standard clinical care. Serum CRP, IL-6, and TNF-α were measured using enzyme-linked immunosorbent assay kits on a microplate reader. Intra-assay and inter-assay coefficients of variation were <5% and <10%, respectively. After collection, blood samples were allowed to clot at room temperature for 30 min and then centrifuged at approximately 1,000 × g for 10 min at 4°C. Serum aliquots were separated and stored at −80°C until batch analysis. The exact timing of dexamethasone administration was retrieved from the electronic anesthesia record system, which documents all intravenous medication administration with minute-level precision as part of standard clinical practice. Trained research nurses retrospectively extracted all data from the electronic medical records using standardized data collection forms. All entries were independently verified by a second investigator against the original clinical records, and the data were double-entered into the database with consistency checks.
Statistical Analysis
Statistical analyses were performed using SPSS version 26.0 and R version 4.3.1. Propensity score matching (1:1) was conducted using the nearest-neighbor method without replacement, with a caliper width of 0.2 standard deviations of the logit of the propensity score. Standardized mean differences were calculated to assess covariate balance, with values of <0.1 indicating good balance. Normally distributed continuous variables are presented as the mean ± standard deviation and were compared using the independent-samples t test. Non-normally distributed data are expressed as the median (interquartile range) and were analyzed using the Mann–Whitney U test. Repeated-measures data were assessed using mixed-design analysis of variance with Bonferroni post hoc tests. Categorical variables are reported as frequency (percentage) and were compared using the χ2 test or Fisher's exact test. The Kaplan–Meier method with the log-rank test was used to analyze PONV-free probability, and multivariable logistic regression was performed to identify independent predictors of 48-h PONV. A two-tailed P < 0.05 was considered statistically significant.
Risultati
Comparison of Baseline Characteristics Between Preoperative (Group P) and Postoperative (Group A) Dexamethasone Administration Groups in ERAS Gynecological Laparoscopy
A total of 327 eligible patients were initially identified from the electronic medical records, including 172 patients in the preoperative dexamethasone group and 155 patients in the postoperative dexamethasone group. After 1:1 propensity score matching, 180 patients were included in the final analysis, with 90 patients in each group. Demographic (age and BMI), clinical (ASA physical status grade, comorbidities, history of PONV/motion sickness, and smoking status), and perioperative (surgical type and duration) characteristics were evaluated. Baseline demographic and clinical characteristics after propensity score matching are presented in Figure 1A–F, with detailed pre- and post-matching characteristics and SMDs summarized in Supplementary Figure 1 and Supplementary Table 1.
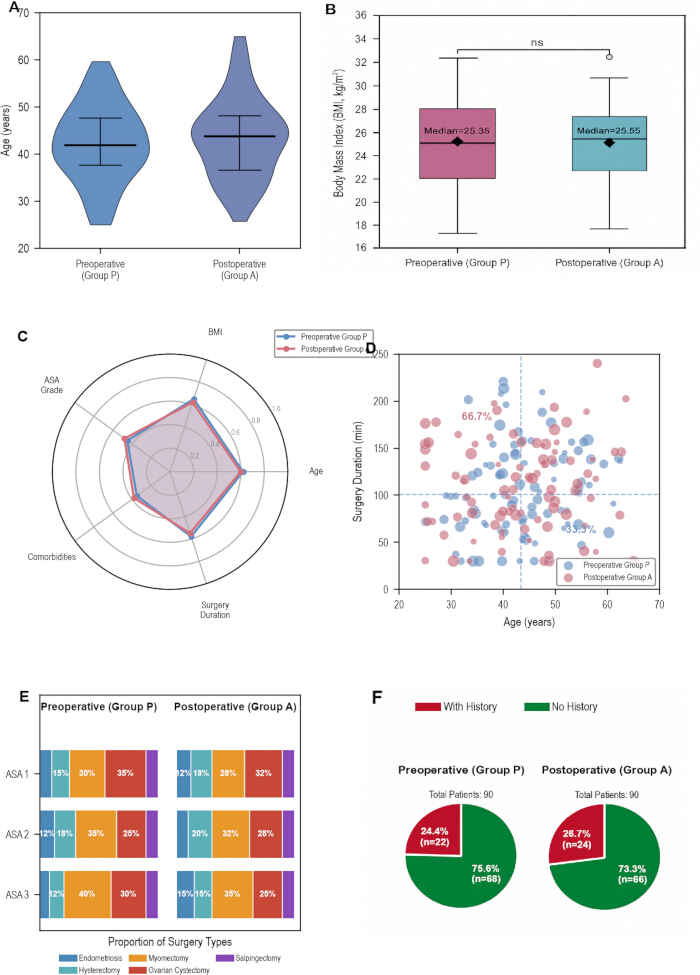
Figure 1. Baseline characteristics after propensity score matching. Please click here to view a larger version of this figure.
Baseline characteristics are compared between the preoperative dexamethasone group (Group P; n = 90) and the postoperative dexamethasone group (Group A; n = 90) after propensity score matching. (A) Violin plots showing the age distribution in each treatment group. (B) Box-and-whisker plots showing the distribution of body mass index (BMI), with median values indicated; ns indicates not statistically significant (P ≥ 0.05, Mann–Whitney U test). (C) Radar plot comparing normalized baseline characteristics, including age, BMI, American Society of Anesthesiologists (ASA) physical status grade, comorbidity burden, and surgical duration. Variables were normalized to a 0–1 scale using min–max normalization across the pooled cohort for visualization. (D) Scatter plot showing the relationship between patient age and surgical duration for individual patients in each treatment group; dashed vertical and horizontal reference lines indicate group mean values for age and surgical duration, respectively. (E) Stacked bar charts showing the distribution of surgical procedures according to ASA physical status grade in each treatment group. (F) Pie charts showing the proportion of patients with and without a history of postoperative nausea and vomiting (PONV) or motion sickness in each treatment group.
Before matching, several baseline covariates showed moderate imbalance between groups, with the maximum SMD reaching 0.278. After matching, all SMDs were reduced to <0.1 (range, 0.000–0.074), indicating good covariate balance. No statistically significant between-group differences were observed in smoking status (12.2% in Group P vs. 11.1% in Group A, P = 0.824), hypertension prevalence (20.0% vs. 17.8%, P = 0.831), or intraoperative crystalloid infusion volume (median, 850 mL vs. 880 mL, P = 0.376). The incidence of transient hyperglycemia was comparable between groups (6.7% vs. 7.8%, P = 0.779), and no severe dexamethasone-related adverse events were recorded in either group. Covariate balance plots demonstrated substantial overlap of propensity score distributions and consistent reductions in SMDs after matching (Supplementary Figure 1).
Overall, the propensity score matching procedure achieved well-balanced baseline characteristics between Group P and Group A, providing comparable study groups for subsequent outcome analyses.
Impact of Dexamethasone Administration Timing on Postoperative Nausea and Vomiting Outcomes in ERAS Gynecological Laparoscopy
Postoperative nausea and vomiting outcomes are summarized in Figure 2A–F. Patients receiving preoperative dexamethasone (Group P; n = 90) exhibited a lower 48-h incidence of PONV than those receiving postoperative dexamethasone (Group A; n = 90) (16.7% vs. 40.0%). Group P also demonstrated a lower median PONV severity score (1.5 vs. 4.0) and a shorter mean duration of PONV episodes (2.0 vs. 4.6 h). Kaplan–Meier analysis showed a higher probability of remaining free from PONV during the 48-h postoperative period (Figure 2A), while cumulative PONV incidence remained lower across all postoperative assessment intervals (Figure 2D). PONV severity distributions and episode duration are presented in Figure 2B,C, respectively. Rescue antiemetic utilization was comparable between groups across ASA physical status grades (range, 2.9%–14.3%; Figure 2E), whereas a greater proportion of patients in Group P remained free from moderate-to-severe PONV symptoms (Figure 2F).
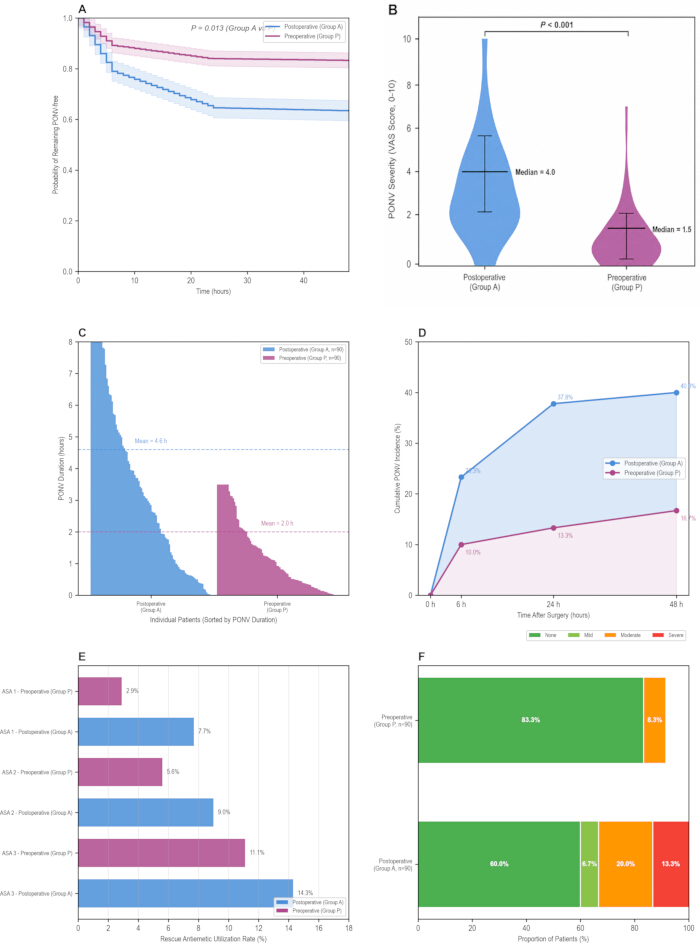
Figure 2. Postoperative nausea and vomiting outcomes according to the timing of dexamethasone administration. Please click here to view a larger version of this figure.
Postoperative nausea and vomiting (PONV) outcomes are compared between the preoperative dexamethasone group (Group P; n = 90) and the postoperative dexamethasone group (Group A; n = 90). (A) Kaplan–Meier curves showing the probability of remaining PONV-free during the first 48 h after surgery; shaded bands represent 95% confidence intervals, and the P value was calculated using the log-rank test. (B) Violin plots showing the distribution of PONV severity measured using the visual analog scale (VAS; 0–10); central markers indicate medians, box edges indicate interquartile ranges, and whiskers indicate the range. Median PONV severity was 1.5 in Group P and 4.0 in Group A (P < 0.001, Mann–Whitney U test). (C) Individual PONV episode duration for each patient, sorted by duration within each treatment group; dashed horizontal lines indicate group mean PONV duration. (D) Cumulative incidence of PONV at 6, 24, and 48 h after surgery. (E) Rescue antiemetic utilization according to American Society of Anesthesiologists (ASA) physical status grade in each treatment group. (F) Distribution of PONV severity categories in each treatment group: none (no PONV symptoms), mild (VAS 1–3), moderate (VAS 4–6), and severe (VAS 7–10). Categorical variables were compared using the chi-squared test or Fisher's exact test, as appropriate. All tests were two-tailed, and P < 0.05 was considered statistically significant.
Dexamethasone Administration Timing Modulates Perioperative Proinflammatory Biomarker Dynamics in ERAS Gynecological Laparoscopy
Perioperative inflammatory biomarker profiles are presented in Figure 3A–F. Patients receiving preoperative dexamethasone (Group P) demonstrated lower concentrations of C-reactive protein (CRP), interleukin-6 (IL-6), and tumor necrosis factor-alpha (TNF-α) at 24 and 48 h after surgery than those receiving postoperative dexamethasone (Group A). Group P also exhibited lower inflammatory biomarker peaks at 24 h and lower biomarker concentrations at 48 h. Mean TNF-α concentration at 24 h was 10.21 pg/mL in Group P compared with 17.63 pg/mL in Group A (P < 0.001; Figure 3F). Temporal changes in inflammatory biomarker concentrations are shown in Figure 3B, fold changes relative to the preoperative baseline are presented in Figure 3D, hierarchical clustering of normalized biomarker profiles is shown in Figure 3A, and individual changes in CRP are presented in Figure 3E. No significant within-group correlation was observed between 24-h IL-6 and CRP concentrations in either group (Figure 3C).
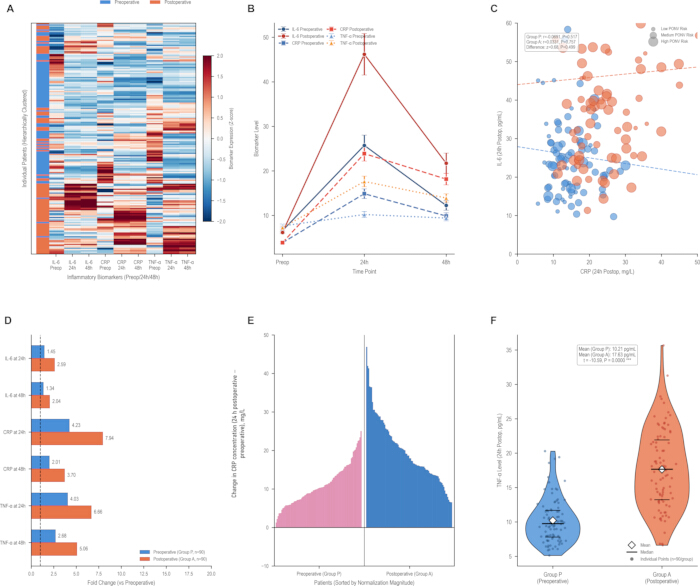
Figure 3. Perioperative inflammatory biomarker profiles according to the timing of dexamethasone administration. Please click here to view a larger version of this figure.
Inflammatory biomarker profiles are compared between the preoperative dexamethasone group (Group P; n = 90) and the postoperative dexamethasone group (Group A; n = 90). (A) Heat map displaying Z-score-normalized inflammatory biomarker values for individual patients at the preoperative assessment and at 24 and 48 h after surgery; hierarchical clustering was performed using Ward's minimum variance method with Euclidean distance. (B) Temporal changes in inflammatory biomarker concentrations, including interleukin-6 (IL-6), C-reactive protein (CRP), and tumor necrosis factor-alpha (TNF-α), measured preoperatively and at 24 and 48 h after surgery. (C) Scatter plot showing the relationship between 24-h postoperative CRP and IL-6 concentrations, with regression lines for each treatment group; bubble size represents postoperative nausea and vomiting (PONV) risk category, with larger bubbles indicating higher risk. (D) Fold changes in CRP, IL-6, and TNF-α concentrations at 24 and 48 h after surgery relative to preoperative baseline values; fold change was calculated as the postoperative concentration divided by the preoperative baseline concentration for each patient. (E) Waterfall plots showing the individual change in CRP concentration from the preoperative assessment to 24 h postoperatively, with patients ranked according to the magnitude of change; the change in CRP concentration was calculated as the 24-h postoperative CRP concentration minus the preoperative CRP concentration for each patient. (F) Violin plots comparing 24-h postoperative TNF-α concentrations between treatment groups; individual observations are shown as points, horizontal lines indicate medians, diamonds indicate means, and violin outlines show the distributions. Z-scores were calculated as (x − µ)/σ for each biomarker across all samples and time points. Significance annotations correspond to P < 0.05 by two-tailed Mann–Whitney U test.
Dexamethasone Timing Impacts Postoperative Recovery Milestones and Patient Outcomes in ERAS Gynecological Laparoscopy
Postoperative recovery outcomes are summarized in Figure 4A–F. Patients receiving preoperative dexamethasone (Group P) achieved earlier postoperative recovery milestones than those receiving postoperative dexamethasone (Group A). Median times to first ambulation (3.3 vs. 9.2 h) and first oral intake (3.6 vs. 9.4 h) were shorter in Group P, as were the times to first flatus and first defecation (all P < 0.01; Figure 4D). Overall recovery profiles are summarized in the radar plot (Figure 4A), and cumulative recovery curves for first ambulation and first oral intake are presented in Figure 4B. Group P also had lower postoperative pain scores and reduced opioid consumption (Figure 4C), a higher 48-h ERAS goal completion rate (80.0% vs. 17.8%; Figure 4E), a shorter mean hospital stay (2.1 vs. 3.2 days; mean difference, 1.1 days; P < 0.001), and higher patient satisfaction scores (Figure 4F).
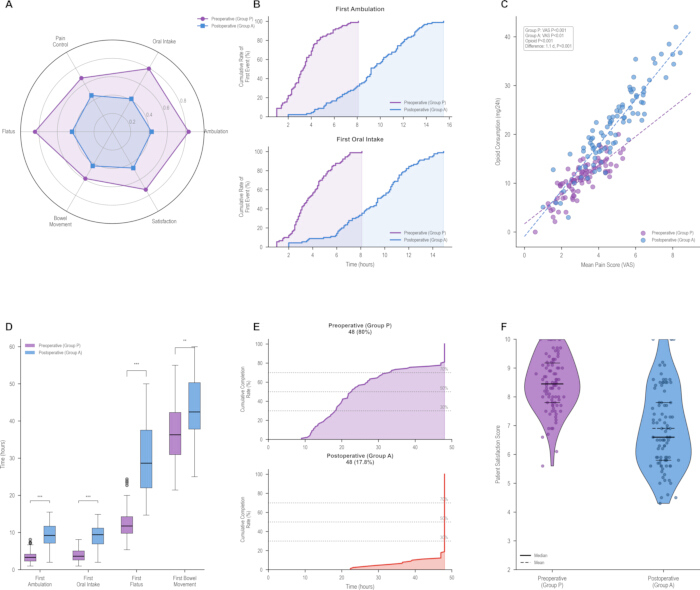
Figure 4. Enhanced Recovery After Surgery outcomes according to the timing of dexamethasone administration. Please click here to view a larger version of this figure.
Enhanced Recovery After Surgery (ERAS) outcomes are compared between the preoperative dexamethasone group (Group P; n = 90) and the postoperative dexamethasone group (Group A; n = 90). (A) Radar plot comparing normalized recovery domains, including pain control, oral intake, ambulation, flatus, bowel movement, and patient satisfaction. Recovery domain scores were normalized to a 0–100 scale using min–max normalization across the pooled cohort, with higher scores indicating better recovery. (B) Cumulative recovery curves showing the proportion of patients achieving first ambulation (upper panel) and first oral intake (lower panel) over time after surgery. (C) Scatter plot showing the relationship between mean postoperative pain score measured using the visual analog scale (VAS) and opioid consumption during the first 24 h after surgery, with linear regression lines for each treatment group. (D) Box-and-whisker plots comparing the time to first ambulation, first oral intake, first flatus, and first bowel movement between treatment groups. Boxes indicate the interquartile range, center lines indicate medians, whiskers extend to 1.5 times the interquartile range, and individual points indicate outliers. (E) Cumulative ERAS goal completion over time for the preoperative (upper panel) and postoperative (lower panel) dexamethasone groups; 30%, 50%, and 70% indicate the 30%, 50%, and 70% ERAS goal-completion reference levels, respectively. (F) Violin plots showing the distribution of patient satisfaction scores at discharge; individual observations are shown as points, horizontal lines indicate medians, dashed lines indicate means, and violin outlines show the distributions. Significance was assessed using the Mann–Whitney U test; * P < 0.05, ** P < 0.01, *** P < 0.001, ns not significant.
Subgroup Efficacy Consistency and Outcome Correlations of Dexamethasone Timing in ERAS Gynecological Laparoscopy
Subgroup analyses and postoperative outcome correlations are presented in Figure 5A–F. The association between preoperative dexamethasone administration and a lower 48-h incidence of PONV was observed across the evaluated age, ASA physical status grade, and surgical duration subgroups (Figure 5A). Overall, the odds of PONV were higher in Group A than in Group P (OR, 3.33; 95% CI, 1.66–6.69; P < 0.001). The association was greater among patients with longer surgical duration and ASA physical status grade II. Overall postoperative complication rates were comparable between groups and consisted predominantly of mild transient events (Figure 5B,D). Lower incidences of delayed ambulation, delayed oral intake, prolonged hospital stay, and rescue antiemetic use were observed in Group P. The relationship between 24-h IL-6 concentrations and postoperative complication risk scores is shown in Figure 5C. Higher 24-h IL-6 concentrations were positively correlated with higher complication risk scores in both groups (Group P: r = 0.382, P = 0.001; Group A: r = 0.521, P = 0.001); however, the strength of the correlations did not differ significantly between groups (Fisher’s z = 1.16, P = 0.246). The relationship between subgroup sample size and estimated OR is presented in Figure 5E, and the overall treatment performance across clinical domains is summarized in Figure 5F.
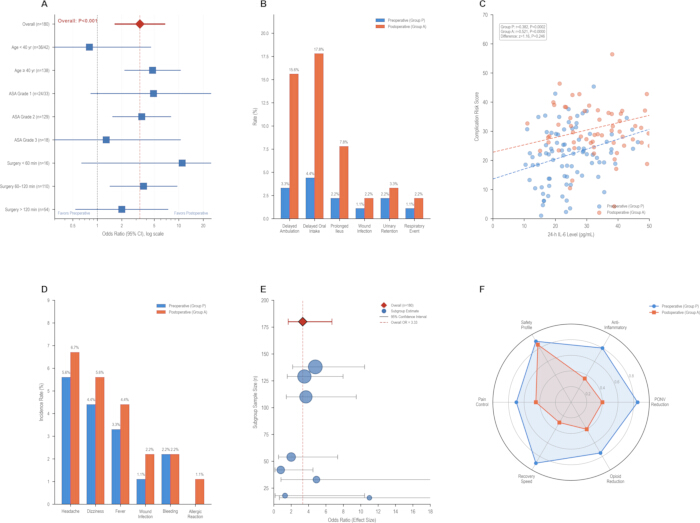
Figure 5. Subgroup analyses, postoperative outcomes, and treatment profile according to the timing of dexamethasone administration. Please click here to view a larger version of this figure.
Subgroup analyses and postoperative outcomes are compared between the preoperative dexamethasone group (Group P; n = 90) and the postoperative dexamethasone group (Group A; n = 90). (A) Forest plot showing subgroup analyses of the association between dexamethasone administration timing and the 48-h incidence of postoperative nausea and vomiting (PONV); squares represent odds ratios (ORs), horizontal lines represent 95% confidence intervals (CIs), the diamond indicates the overall effect estimate, and the dashed vertical line represents the null effect (OR = 1). (B) Incidence of postoperative complications, including delayed ambulation, delayed oral intake, prolonged ileus, wound infection, urinary retention, and respiratory events. (C) Scatter plot showing the relationship between interleukin-6 (IL-6) concentration at 24 h after surgery and postoperative complication risk score, with linear regression lines for each treatment group. (D) Incidence of postoperative adverse events according to event type. (E) Bubble plot showing subgroup sample size versus estimated OR; bubble size is proportional to subgroup sample size, horizontal lines represent 95% CIs for subgroup-specific ORs, and the dashed vertical line indicates the overall OR. (F) Radar plot comparing normalized treatment performance across multiple clinical domains, including PONV reduction, anti-inflammatory effect, safety profile, opioid reduction, recovery speed, and pain control. Treatment performance domains were normalized to a 0–1 scale using min–max normalization across the pooled cohort for comparative visualization, with higher values indicating better performance. American Society of Anesthesiologists (ASA) physical status grade is used for the corresponding subgroup classification. Between-group comparisons were performed using the chi-squared test or Fisher's exact test for categorical outcomes and the Mann–Whitney U test for continuous outcomes, as appropriate. All P values are two-tailed; significance annotations correspond to * P < 0.05, ** P < 0.01, *** P < 0.001, and ns (not significant) for P ≥ 0.05.
Data Availability:
The de-identified individual participant data supporting the principal analyses reported in this article are provided in Supplementary Data File 1. Baseline characteristics before and after propensity score matching are provided in Supplementary Table 1, and propensity score matching diagnostics are provided in Supplementary Figure 1. Supplementary Data File 1 contains de-identified patient-level data for the 180 propensity score-matched participants included in the final analysis and contains no direct patient identifiers.
Supplementary Figure 1. Propensity score matching diagnostics. (Left) Love plot showing the absolute standardized mean differences (SMDs) for baseline covariates before (open circles) and after (filled squares) 1:1 nearest-neighbor propensity score matching with a caliper width of 0.2 standard deviations of the logit of the propensity score. The dashed vertical line indicates the prespecified covariate balance threshold (SMD = 0.1). (Right) Distribution of propensity scores in Group P and Group A before (dashed outlines) and after (filled histograms) propensity score matching, demonstrating improved overlap of propensity score distributions following matching. Please click here to download this file.
Supplementary Table 1. Baseline characteristics of the study population before and after propensity score matching. Baseline demographic, clinical, and perioperative characteristics of patients who received preoperative or postoperative dexamethasone before and after 1:1 propensity score matching. Data are presented as mean ± standard deviation (SD) or number (%). Standardized mean differences (SMDs) were calculated to assess covariate balance before and after matching. Please click here to download this file.
Supplementary Data File 1. De-identified participant-level data for the propensity score-matched cohort. The dataset contains de-identified patient-level data for 180 participants included in the final propensity score-matched analysis, comprising 90 patients in the preoperative dexamethasone group (Group P) and 90 patients in the postoperative dexamethasone group (Group A). Variables include demographic and baseline clinical characteristics, surgical characteristics, 48-h PONV outcomes, postoperative recovery outcomes, 24-h inflammatory biomarker concentrations, postoperative complication risk scores, and patient satisfaction scores. Patient identifiers are study-specific de-identified codes. Please click here to download this file.
Discussione
This retrospective cohort study indicates that preoperative dexamethasone administration is associated with improved PONV control, attenuated perioperative inflammation, and faster postoperative recovery in patients undergoing gynecological laparoscopy managed under standardized ERAS protocols. The present study extends previous observations by directly comparing the timing of dexamethasone administration within a standardized ERAS pathway while simultaneously evaluating inflammatory biomarkers and multiple postoperative recovery outcomes. Consistent with our findings, several earlier investigations in gynecological and laparoscopic populations reported superior antiemetic efficacy with preoperative dexamethasone administration. Lim and colleagues demonstrated that preoperative dexamethasone provided more favorable PONV control than postoperative dosing in patients undergoing gynecological laparoscopy11. Similarly, a meta-analysis by Choi and colleagues found that dexamethasone administered before anesthesia induction was associated with significantly reduced early PONV compared with administration at the end of surgery15. These observations are further supported by pharmacodynamic data indicating that the onset of the biologic action of glucocorticoids occurs approximately 1–2 h after administration, providing a pharmacological rationale for administering dexamethasone before rather than after surgery16. In contrast, several other investigations reported no statistically significant difference in PONV prevention between preoperative and postoperative dexamethasone administration12,13,14. For instance, Gautam and colleagues found comparable PONV rates with preoperative versus postoperative dexamethasone in patients undergoing laparoscopic cholecystectomy14, while Ismail and colleagues observed similar antiemetic efficacy across timing groups in the same surgical population12. This discrepancy may partly reflect differences in surgical populations, perioperative care pathways, and outcome definitions. These studies were conducted outside the standardized ERAS framework used in the present study, and differences in perioperative management may have contributed to the differing findings. Furthermore, previous trials primarily evaluated PONV outcomes and may not have been designed to evaluate differences across broader recovery domains such as time to ambulation, oral intake, and length of stay. The standardized ERAS pathway used in the present study reduced variations in perioperative care, allowing the associations between dexamethasone administration timing and antiemetic, anti-inflammatory, and recovery outcomes to be evaluated within a consistent perioperative framework.
Mechanistically, the superior outcomes associated with preoperative dexamethasone administration may arise from earlier modulation of the surgical stress response. By achieving therapeutic glucocorticoid concentrations before surgical injury, dexamethasone may suppress early transcriptional activation of pro-inflammatory cytokines, including IL-6 and TNF-α, rather than counteracting inflammatory cascades that have already been initiated17,18. The anti-inflammatory patterns observed in the present study are consistent with previous reports linking preoperative glucocorticoid administration to attenuation of the surgical stress response17. Biologically, dexamethasone suppresses cytokine production through inhibition of inflammatory mediator gene expression, providing a plausible explanation for the association between preoperative administration and improved postoperative recovery indicators18,19. Earlier attenuation of the perioperative inflammatory response may also reduce inflammation-associated gastrointestinal dysfunction and chemoreceptor trigger zone sensitization while facilitating earlier recovery milestones, as excessive postoperative inflammation has consistently been associated with delayed recovery and prolonged hospitalization19.
The findings also have practical implications for optimization of standardized ERAS pathways. All patients received identical perioperative ERAS care, and key baseline covariates were balanced using propensity score matching to minimize potential confounding from other perioperative factors. The observed effect sizes may therefore reflect the combined associations of improved PONV control and attenuation of the early inflammatory response following preoperative dexamethasone administration, which together may facilitate earlier achievement of ERAS recovery milestones. The earlier mobilization, improved oral intake, and shorter hospital stay observed in this cohort are consistent with previous dose-ranging studies reporting improved recovery outcomes with appropriate dexamethasone dosing8. The observed reduction in opioid consumption is also consistent with ERAS principles, in which minimizing opioid exposure is associated with fewer opioid-related complications and improved postoperative recovery20.
From a clinical perspective, integrating preoperative dexamethasone into standardized ERAS pathways may represent a practical strategy for patients undergoing gynecological laparoscopy, in whom female sex and pneumoperitoneum contribute to an increased risk of PONV. The favorable associations observed across multiple recovery domains and patient subgroups suggest that preoperative administration may provide broad clinical utility while maintaining a safety profile comparable to postoperative administration. Nevertheless, implementation should continue to account for individual contraindications, patient characteristics, and appropriate perioperative safety monitoring.
Several important limitations warrant consideration. First, the retrospective observational design has inherent methodological constraints because data were extracted from electronic medical records rather than collected according to a prospective protocol, introducing the potential for information bias; therefore, definitive causal inferences cannot be drawn from the observed associations. Second, although 1:1 propensity score matching effectively balanced all measured baseline covariates, it cannot account for unmeasured or incompletely documented factors, including subtle variations in anesthetic management, intraoperative hemodynamic fluctuations, or postoperative nursing practices; consequently, residual confounding remains possible. Third, this study was conducted at a single specialized maternal and child health hospital using highly standardized ERAS protocols, which may limit the generalizability of the findings to general hospitals, institutions using different perioperative care pathways, or settings with different resource availability. Fourth, the study population was restricted to women aged 25–65 years with ASA physical status I–III undergoing elective gynecological laparoscopy, and patients with severe comorbidities or contraindications to glucocorticoid therapy were excluded. Accordingly, these findings cannot be directly extrapolated to emergency surgery, open gynecological procedures, or patients with substantial comorbid conditions. Future prospective multicenter randomized controlled trials are needed to validate these findings, establish causality, and support broader clinical implementation. In addition, further studies involving elderly patients, patients with diabetes, and patients with metabolic syndrome are warranted to refine dosing strategies and safety monitoring21.
Overall, this study provides observational evidence relevant to optimization of perioperative care within standardized ERAS pathways. Preoperative dexamethasone was associated with a lower 48-h incidence of PONV, attenuated perioperative inflammatory responses, earlier achievement of ERAS recovery milestones, and a safety profile comparable to that of postoperative administration. These findings support the potential role of preoperative dexamethasone as a component of standardized ERAS protocols for gynecological laparoscopic surgery. Future research should further evaluate optimal dosing strategies, combination antiemetic regimens, long-term clinical outcomes, and implementation across diverse clinical settings to confirm these observations and refine perioperative management.
Dichiarazioni
Conflict of Interest:
The authors declare that they have no competing financial interests or other conflicts of interest related to this study.
Ringraziamenti
The authors thank the nursing and anesthesia staff of the Maternal and Child Health Hospital of Hubei Province for their contributions to patient care and assistance with data collection. This research received no specific grant from any funding agency in the public, commercial, or not-for-profit sectors.
Materiali
| Nome | Azienda | Numero di catalogo | Commenti |
|---|---|---|---|
| 0.9% Sodium Chloride Injection (Normal Saline) | Sichuan Kelun Pharmaceutical Co., Ltd., Sichuan, China | H51021156 | Drug / Diluent. 10 mL/ampoule; diluent for dexamethasone |
| 96-well microplates (for ELISA) | Corning Inc., Corning, NY, USA | 3590 | Consumable. High-binding, flat-bottom, polystyrene |
| Adjustable micropipettes (single-channel) | Eppendorf AG, Hamburg, Germany | 3120000011 / 3120000054 / 3120000062 | Instrument / Equipment. Research plus; 0.5–10 μL (cat. no. 3120000011), 20–200 μL (cat. no. 3120000054), and 100–1,000 μL (cat. no. 3120000062); single-channel variable-volume pipettes |
| Anesthesia workstation | Drägerwerk AG & Co. KGaA, Lübeck, Germany | MK06000-18 | Instrument / Equipment. Dräger Perseus A500; mechanical ventilation and sevoflurane vaporizer |
| Centrifuge (for serum separation) | Eppendorf AG, Hamburg, Germany | 5424 R | Instrument / Equipment. Refrigerated benchtop centrifuge; approximately 1,000 × g for 10 min at 4 °C |
| Cisatracurium Besylate for Injection | Jiangsu Hengrui Pharmaceutical Co., Ltd., Jiangsu, China | H20060869 | Drug. 10 mg/vial; 0.15–0.2 mg/kg IV |
| Crystalloid solution (lactated Ringer's solution or normal saline) | Sichuan Kelun Pharmaceutical Co., Ltd., Sichuan, China | H20043818 | Drug / IV fluid. 500 mL/bag lactated Ringer's solution; 5–7 mL/kg/h intraoperatively. 0.9% normal saline is listed separately as cat. no. H51021156 |
| Dexamethasone Sodium Phosphate Injection | Chenxin Pharmaceutical Co., Ltd., Shandong, China | H37021967 | Drug. 4 mg/mL, 2 mL/ampoule; 8 mg IV dose |
| Dezocine Injection | Yangtze River Pharmaceutical Group Co., Ltd., Jiangsu, China | H20080329 | Drug. 5 mg/mL, 1 mL/ampoule; 5–10 mg IV rescue dose |
| Diclofenac Sodium Suppositories | Hubei Dongxin Pharmaceutical Co., Ltd., Hubei, China | H20058516 | Drug. 50 mg/suppository; administered per rectum every 12 h |
| Disposable syringes (5 mL, 10 mL, and 20 mL) | Becton, Dickinson and Company, Franklin Lakes, NJ, USA | 309653 / 302995 / 302830 | Consumable. Sterile, single-use, Luer-Lok tip; 5 mL (cat. no. 309653), 10 mL (cat. no. 302995), and 20 mL (cat. no. 302830) |
| Electronic anesthesia record system | Lepu Medical Technology (Beijing) Co., Ltd., Beijing, China | AI-Care | Instrument / Equipment / Software. Anesthesia information management system; minute-level drug administration logging |
| Electronic medical record system | DHC Software Co., Ltd., Beijing, China | DHC-HIS | Instrument / Equipment / Software. Hospital information system; clinical data extraction source |
| ggplot2 package (R) | CRAN / Posit | N/A | Software / R package. Version 3.4.4; figure generation and data visualization |
| Human C-Reactive Protein (CRP) ELISA Kit | R&D Systems, Inc., Minneapolis, MN, USA | DCRP00 | Reagent / Assay Kit. Quantikine ELISA; 96-well plate; serum samples |
| Human Interleukin-6 (IL-6) ELISA Kit | R&D Systems, Inc., Minneapolis, MN, USA | D6050 | Reagent / Assay Kit. Quantikine ELISA; 96-well plate; serum samples |
| Human Tumor Necrosis Factor-alpha (TNF-α) ELISA Kit | R&D Systems, Inc., Minneapolis, MN, USA | HSTA00E | Reagent / Assay Kit. High-sensitivity Quantikine ELISA; 96-well plate; serum samples |
| IBM SPSS Statistics | IBM Corp., Armonk, NY, USA | N/A | Software. Version 26.0; statistical analysis |
| Intravenous catheters (18 G and 20 G) | Becton, Dickinson and Company, Franklin Lakes, NJ, USA | 382223 / 382212 | Consumable. Insyte Autoguard BC; sterile; 18 G (cat. no. 382223) and 20 G (cat. no. 382212) |
| Laparoscopic surgery system | Karl Storz SE & Co. KG, Tuttlingen, Germany | 22220131-3 | Instrument / Equipment. IMAGE1 S camera system, 30° laparoscope, and insufflator |
| MatchIt package (R) | CRAN / Posit | N/A | Software / R package. Version 4.5.5; 1:1 nearest-neighbor propensity score matching; caliper = 0.2 SD |
| Microplate reader (absorbance) | Tecan Group Ltd., Männedorf, Switzerland | 30060032 | Instrument / Equipment. Infinite 200 PRO; 450 nm wavelength; ELISA absorbance readout |
| Microplate sealing film | Thermo Fisher Scientific, Waltham, MA, USA | 15036 | Consumable. Adhesive, optically clear |
| Microsoft Excel | Microsoft Corporation, Redmond, WA, USA | N/A | Software. Microsoft Excel 2019 (Version 2108); data entry, double-entry verification, and database management |
| Multiparameter patient monitor | Philips Healthcare, Best, Netherlands | 862198 | Instrument / Equipment. Philips IntelliVue MX550; ECG, SpO2, NIBP, EtCO2, and temperature monitoring |
| Pipette tips (10 μL, 200 μL, and 1,000 μL) | Eppendorf AG, Hamburg, Germany | 022491205 / 022491531 / 022491213 | Consumable. Sterile, filtered, low-binding pipette tips; 10 μL (cat. no. 022491205), 200 μL (cat. no. 022491531), and 1,000 μL (cat. no. 022491213) |
| Propofol Injectable Emulsion | Fresenius Kabi Austria GmbH, Graz, Austria | NDC 0409-4699-21 | Drug. 10 mg/mL, 20 mL vial; 1.5–2.0 mg/kg IV induction |
| R (programming language for statistical computing) | R Foundation for Statistical Computing, Vienna, Austria | N/A | Software. Version 4.3.1; propensity score matching, forest plots, and data visualization |
| Remifentanil Hydrochloride for Injection | Yichang Humanwell Pharmaceutical Co., Ltd., Hubei, China | H20030197 | Drug. 1 mg/vial; 0.1–0.3 μg/kg/min IV infusion |
| Remimazolam Besylate for Injection | Jiangsu Hengrui Pharmaceutical Co., Ltd., Jiangsu, China | H20190033 | Drug. 36 mg/vial; 0.3–0.6 mg/kg/h IV infusion |
| RStudio (integrated development environment for R) | Posit Software, PBC, Boston, MA, USA | N/A | Software. Version 2023.06.1+524; integrated development environment |
| Sevoflurane (inhalation anesthetic) | Maruishi Pharmaceutical Co., Ltd., Osaka, Japan | H20150020 | Drug. 250 mL/bottle; 1.0–1.5 minimum alveolar concentration for maintenance |
| Sufentanil Citrate Injection | Yichang Humanwell Pharmaceutical Co., Ltd., Hubei, China | H20054171 | Drug. 50 μg/10 mL; 0.2–0.4 μg/kg IV |
| Temperature management system (forced-air warming) | 3M Company, St. Paul, MN, USA | 87500 / 87501 | Instrument / Equipment. Bair Hugger 875 warming unit (cat. no. 87500) and disposable warming blankets (cat. no. 87501); core temperature maintained at ≥36.0 °C |
| Tropisetron Hydrochloride Injection | Shandong Luoxin Pharmaceutical Group Co., Ltd., Shandong, China | H20050535 | Drug. 5 mg/5 mL; 5 mg IV rescue antiemetic dose |
| Venous blood collection tubes (serum separator) | Becton, Dickinson and Company, Franklin Lakes, NJ, USA | 367955 | Consumable. 5 mL; clot activator and gel separator |
Riferimenti
- Klek S, et al. Enhanced recovery after surgery (ERAS) protocol is a safe and effective approach in patients with gastrointestinal fistulas undergoing reconstruction: results from a prospective study. Nutrients. 2021;13(6):1953.
- Xing N, Wang H, Huang Y, Peng J. Enhanced recovery after surgery program alleviates neutrophil-to-lymphocyte ratio and platelet-to-lymphocyte ratio in patients undergoing gynecological surgery. Front Med (Lausanne). 2023;10:1057923.
- Shalaby S, et al. The impact of ERAS protocol on laparoscopic sleeve gastrectomy and one anastomosis gastric bypass (OAGB): analysis of length of stay, complications, and readmission. Updates Surg. 2025;77(7):2107-12.
- Lee HJ, et al. Effectiveness of ERAS program on postoperative recovery after gastric cancer surgery: a randomized clinical trial. Int J Surg. 2025;111(5):3306-13.
- Palumbo V, et al. Enhanced recovery after surgery pathway in patients undergoing open radical cystectomy is safe and accelerates bowel function recovery. Urology. 2018;115:125-32.
- Dong F, Li Y, Jin W, Qiu Z. Effect of ERAS pathway nursing on postoperative rehabilitation of patients undergoing gastrointestinal surgery: a meta-analysis. BMC Surg. 2025;25(1):239.
- Wang B, Wang X, Liu Y. Effect of prophylactic dexamethasone on nausea and vomiting after laparoscopic gynecological operation: meta-analysis. Middle East J Anaesthesiol. 2011;21(3):397-402.
- De Oliveira GS Jr, et al. Dose-ranging study on the effect of preoperative dexamethasone on postoperative quality of recovery and opioid consumption after ambulatory gynaecological surgery. Br J Anaesth. 2011;107(3):362-71.
- Inam K, et al. Efficacy and safety of dexamethasone in postoperative recovery following hysterectomy: a systematic review and meta-analysis. BMJ Open. 2025;15(10):e099097.
- Sekhavat L, Davar R, Behdad S. Comparison of intraperitoneal versus intravenous dexamethasone on postoperative nausea and vomiting after gynecological laparoscopy: a randomized clinical trial. BMC Anesthesiol. 2019;19(1):25.
- Lim BS, et al. Preoperative dexamethasone has a more favorable effect on postoperative nausea and vomiting than postoperative administration in patients undergoing gynecological laparoscopy. Korean J Anesthesiol. 2014;66(3):212-7.
- Ismail EA, Bakri MH, Abd-Elshafy SK. Dexamethasone alone versus in combination with intra-operative super-hydration for postoperative nausea and vomiting prophylaxis in female patients undergoing laparoscopic cholecystectomy: a randomized clinical trial. Korean J Anesthesiol. 2017;70(5):535-41.
- Erhan Y, et al. Ondansetron, granisetron, and dexamethasone compared for the prevention of postoperative nausea and vomiting in patients undergoing laparoscopic cholecystectomy: a randomized placebo-controlled study. Surg Endosc. 2008;22(6):1487-92.
- Gautam B, Shrestha BR, Lama P, Rai SM. The effect of preoperative versus postoperative dexamethasone on postoperative nausea and vomiting in patients undergoing laparoscopic cholecystectomy. JNMA J Nepal Med Assoc. 2013;52(194):814-9.
- Choi GJ, et al. Is timing of dexamethasone administration important for prevention of postoperative nausea and vomiting? A systematic review and meta-analysis. PLoS One. 2018;13(5):e0196832.
- Song YK, et al. The impact of prophylactic dexamethasone on nausea and vomiting after thyroidectomy: a systematic review and meta-analysis. PLoS One. 2014;9(10):e110930.
- Mølgaard AK, et al. Dexamethasone versus placebo modulation of the perioperative blood immune proteome in patients undergoing total knee arthroplasty. BMC Anesthesiol. 2025;25(1):136.
- Cihoric M, et al. Preoperative high dose of dexamethasone in emergency laparotomy: randomized clinical trial. Br J Surg. 2024;111(7):znae130.
- Gupta P. Role of pre-operative dexamethasone as prophylaxis for postoperative nausea and vomiting in laparoscopic surgery. J Minim Access Surg. 2006;2(1):12-5. doi:10.4103/0972-9941.25671.
- Murphy GS, et al. Small-dose dexamethasone improves quality of recovery scores after elective cardiac surgery: a randomized, double-blind, placebo-controlled study. J Cardiothorac Vasc Anesth. 2011;25(6):950-60.
- Ortiz Vazquez EF, et al. Minimally invasive gynecologic surgery, enhanced recovery, and outcomes: a literature review. Cureus. 2025;17(5):e84814.