Questo studio presenta un sistema costiero simulato che utilizza un modello murino per valutare quantitativamente la percentuale di ritenzione e l'efficacia fotoprotettiva dei filtri solari in condizioni di stress ambientali complessi, inclusa l'irradiazione ultravioletta, l'immersione in acqua di mare, il risciacquo da onde e l'essiccazione al vento. Costituisce uno strumento di screening preclinico e non sostituisce i trial clinici standardizzati.
Articolo metodologico
Un Sistema Murino Simulato In Vivo per la Valutazione dell'Efficacia e della Durata dei Filtri Solari
* These authors contributed equally
In questo articolo
Sommario
Abstract
Ultraviolet (UV) radiation is a primary environmental factor causing skin photoaging, sunburn, and acute UV-induced skin injury. Sunscreen is the most common method of photoprotection; however, current evaluation methods fail to accurately simulate complex seaside environments or pose high costs and ethical limitations. This study presents a novel simulated seaside testing system combined with a live murine model to quantitatively evaluate the efficacy and durability of sunscreens under complex environmental stressors. The custom-designed chamber integrates controllable UV irradiation, seawater immersion with simulated waves, and wind-drying mechanisms. Depilated BALB/c mice were treated with different sunscreens and exposed to a standardized 120-minute simulated seaside cycle. The retention rate of the sunscreens was quantified using fluorescence imaging, while the photoprotective efficacy was evaluated by Hematoxylin and Eosin (H&E) staining for epidermal thickness and inflammatory infiltration. The results demonstrated that this system could effectively differentiate the performance of various sunscreens. Specifically, a high-protection water-resistant sunscreen exhibited the highest retention rate and provided the best protection against UV and environmental damage. This protocol offers a cost-effective, highly reproducible, and ethical preclinical screening alternative for exploring skin protection products under simulated extreme environments, serving as an exploratory bridge rather than a validated replacement for mandatory human SPF testing.
Introduzione
La radiazione ultravioletta (UV), in particolare UVA e UVB, è la principale causa di fotoaging cutaneo, scottature solari e lesioni cutanee acute indotte da UV1,2,3. L'uso di prodotti solari è la strategia più diffusa per ridurre questi effetti avversi4,5. Pertanto, una valutazione accurata dell'efficacia dei prodotti solari è di fondamentale importanza sia per la ricerca dermatologica che per l'industria cosmetica.
Attualmente, i metodi principali per testare l'efficacia dei filtri solari comprendono analisi strumentali in vitro e prove cliniche su esseri umani6,7. I metodi in vitro, come la spettrofotometria UV su lastre di quarzo o su pelle artificiale, sono economici e altamente riproducibili8,9. Tuttavia, non riescono a simulare la complessa dinamica della formazione del film del filtro solare, della resistenza all'acqua e del risciacquo sulla pelle viva. Al contrario, le prove cliniche su esseri umani, che misurano la Dose Eritemogenica Minima (MED) sulla schiena di volontari, sono considerate il gold standard per determinare il Fattore di Protezione Solare (SPF) in conformità con le linee guida dell'Organizzazione Internazionale per la Normazione (ISO) (SPF: ISO 24444, resistenza all'acqua: ISO 16217) e della FDA10,11,12,13,14. Nonostante la loro affidabilità, le prove cliniche sono costose, richiedono molto tempo, sono soggette a notevoli variazioni individuali e sono fortemente limitate da considerazioni etiche, specialmente quando i test vengono effettuati in condizioni ambientali estreme o potenzialmente dannose.
Una limitazione significativa delle tecniche di valutazione esistenti è l'incapacità di simulare in modo esaustivo gli ambienti marini reali. Durante le attività balneari, i filtri solari subiscono un processo di degradazione sinergico che comprende l'immersione in acqua di mare ad alta salinità e il risciacquo provocato dalle onde15,16. Questi fattori compromettono drasticamente la stabilità dell'adesione e la durata della protezione dei prodotti applicati. Per superare tali limitazioni, questo studio introduce un nuovo sistema di prova simulato per ambienti marini, basato su un modello murino BALB/c. Questo sistema integra diversi parametri ambientali chiave — tra cui intensità UV, salinità dell'acqua di mare, temperatura dell'acqua, forza delle onde e velocità del vento — in un'unica piattaforma altamente controllabile. Combinando questa strumentazione con imaging fluorescente quantitativo e analisi istologica, il protocollo consente una valutazione precisa sia del tasso di ritenzione del filtro solare sia dell'efficacia protettiva fisiologica. Questo metodo fornisce una soluzione affidabile, a basso costo ed efficiente per valutare le prestazioni dei filtri solari in scenari marini complessi e realistici.
Protocollo
All methods involving vertebrate animals were performed in compliance with the institutional guidelines and approved by the laboratory animal care and ethics committee of Guangdong Laidi Biomedical Research Institute Co., Ltd., under approval No. LDSW2025050-4.
1. Setup of the simulated seaside chamber
- Assemble the test chamber, which consists of a transparent, airtight metal box (dimensions: 40 cm length × 30 cm width × 30 cm height) with access ports for the animals.
- Integrate the UV Simulation Unit: Install UV lamps (6W) at the top of the chamber, providing an approximate intensity of 2 mW/cm2. This simulates the average strong midday seaside sunlight.
CAUTION: UV radiation is hazardous to the eyes and skin. Ensure the chamber is fully sealed and wear appropriate safety goggles and protective clothing when operating the UV unit. - Integrate the water environment unit. Fill the built-in water tank with artificial seawater.
- Prepare the seawater by dissolving commercial sea salt in purified water at a ratio of 1 kg (± 0.05 kg) salt to 30 L (± 0.5 L) water. Set the water temperature controller to maintain a constant temperature of 25 °C (± 1 °C).
- Activate the wave-maker at a flow rate of approximately 10 L/min to simulate the mechanical friction of moderate shore waves.
- Position the blower fan to direct airflow across the animal holding area. Calibrate airflow to 35 cubic feet per minute (CFM) to simulate a seaside breeze.
- Connect all components to a central control interface. Prior to testing, input the target environmental parameters into the control system and calibrate them using the corresponding measurement instruments.
NOTE: Execute this initial verification by utilizing an external handheld digital UV radiometer, a waterproof thermometer, and an anemometer, ensuring that the UV intensity (2 mW/cm2), water temperature (25 °C), and wind speed (35 CFM) match the intended setpoints prior to initiating the biological experiments. - During the experiment, toggle the UV lamps, wave-maker, and water drainage on or off via the interface to precisely execute the alternating immersion and emersion phases.
2. Preparation of the animal model
- House adult BALB/c mice (weighing approximately 20 g to 25 g) in standard conditions and allow them to acclimatize for one week prior to the experiment.
- Briefly anesthetize the mice using 1.5% isoflurane via inhalation to minimize stress. Pre-shave the fur on the backs of the mice using an animal hair removal device.
- Next, apply a commercial chemical depilatory cream evenly to the dorsal skin of the mice. After 3 to 5 min, gently wipe away the hair using warm, damp gauze.
CAUTION: Chemical depilatory creams and paraformaldehyde used in histology are toxic and irritants. Handle them in a well-ventilated area while wearing protective gloves. Disposal: Dispose of all chemical waste (paraformaldehyde) and biological waste (animal carcasses and tissues) in designated biohazard and chemical waste containers strictly in accordance with institutional and local regulatory requirements. - House the depilated mice for an additional 2 days to allow recovery. Before the experiment, visually inspect the dorsal skin to confirm the complete absence of erythema or irritation from the depilatory process.
- Draw a cross on the exposed dorsal skin using a black marker to divide the area into four distinct quadrants (Quadrants 1 to 4).
3. Sunscreen application and pre-treatment
- Prepare the test sunscreens. Randomly select three commercial sunscreens: A, B, and C.
- Apply the sunscreen to the designated areas using a 20 μL micropipette, and spread the formulation evenly with a sterile gloved fingertip in a gentle circular motion for 10 s to ensure the formation of a uniform film as follows:
NOTE: Ensure the pressure applied by the fingertip remains consistent across all quadrants. Uneven spreading or excessive pressure can lead to irregular film thickness, which will directly compromise the reproducibility of the subsequent retention evaluation. - Quadrant 1 (Top-Left): Apply 20 mg/cm2 of Sunscreen A.
- Quadrant 2 (Top-Right): Apply 20 mg/cm2 of Sunscreen B.
- Quadrant 3 (Bottom-Left): Apply 20 mg/cm2 of Sunscreen C.
- Quadrant 4 (Bottom-Right): Leave untreated (Unprotected control).
- Place the mice in a resting position for 5 min to ensure that the sunscreen is evenly and stably distributed on the dorsal skin.
4. Sunscreen retention assessment
- Mix a safe fluorescent marker (0.01% w/w Sulfo Cy7) into Sunscreen A, Sunscreen B, and Sunscreen C.
- Apply the fluorescently labeled sunscreens to the dorsal skin of the mice as described in section 3.
- Capture the initial baseline fluorescence image (F0) of the dorsal skin using an in vivo fluorescence imaging system.
NOTE: Verify that the imaging parameters, including exposure time and focal plane, remain strictly locked for each animal. An inaccurate baseline (F0) capture will invalidate the final calculation of the sunscreen retention rate. - Place the mice into the testing chamber. Turn off the UV lamps and set the water temperature to 25 °C.
- Raise the water level and activate the wave-maker so that the mice undergo a 30-minute immersion phase (swimming), ensuring their heads safely remain above the water surface.
- Next, turn off the wave-maker and lower the water level to expose a stepped metal platform inside the chamber, allowing the mice to rest safely on the platform for 30 min (emersion phase).
- Repeat the 30-minute immersion phase and the 30-minute emersion phase for a second cycle (120 min in total).
- Capture the post-exposure fluorescence image (F1) using the in vivo imaging system.
- Calculate the retention level using the formula:
Retention level = (F1 / F0) × 100% (1) - Calculate the relative fluorescence intensity using the formula:
Fluorescence intensity = (F1(X) / F1(A)) × 100% (2)
where F0 is the baseline fluorescence intensity, F1 is the post-experiment fluorescence intensity, F1(A) is the post-experiment fluorescence intensity of the area applied with Sunscreen A, and F1(X) is the post-experiment fluorescence intensity of the area applied with Sunscreen B or C.
NOTE: Ensure the UV lamps remain off during the fluorescence monitoring experiment to prevent UV-induced quenching of fluorescence. The total exposure time is 120 min, and ensure constant monitoring of the animals' respiratory rate and activity status throughout the immersion phase to confirm the absence of signs of distress or exhaustion.
5. Photoprotective efficacy detection
- Apply the standard (non-fluorescent) sunscreens to the backs of the mice as described in section 3.
- Apply a piece of black, UV-blocking tape to the upper neck area of the mouse to serve as a UV-shielded internal control. Record the baseline skin conditions via macroscopic photography.
NOTE: Press the edges of the tape firmly to prevent water seepage or accidental detachment during the wave wash phase. If the tape detaches, the internal control area will be compromised by exposure to UV and water, confounding the histological baseline. - Expose the mice to the same water cycling program described in section 4, with the UV simulation unit activated: raise the water level for 30 min (immersion), lower the water level for 30 min (emersion phase), and repeat for a second cycle (total 120 min).
- Remove the mice from the chamber and record the presence of erythema, peeling, or hardening on the skin using macroscopic photography.
NOTE: Based on the chamber dimensions (40 cm × 30 cm × 30 cm) and the animals' activity space relative to the light source, the cumulative UV dose delivered during the 120-minute cycle is estimated at approximately 2.5 J/cm2. Dosages around this level effectively induce measurable epidermal thickening and acute inflammation while ensuring the safety of the mice and strictly maintaining animal welfare limits3. - At the experimental endpoint, euthanize the mice humanely via cervical dislocation under deep isoflurane anesthesia, strictly following the American Veterinary Medical Association (AVMA) Guidelines for the Euthanasia of Animals, to harvest skin tissues for the subsequent histological evaluation. Excise the dorsal skin tissues from the four quadrants and the tape-protected area.
- Fix the tissues in 4% paraformaldehyde for 24 h, followed by standard dehydration, paraffin embedding, and sectioning.
- Stain the sections with hematoxylin and eosin (H&E). Briefly, deparaffinize the sections in xylene, rehydrate through graded ethanol solutions, stain with hematoxylin for 5 min, rinse in running tap water, counterstain with eosin for 1 min, dehydrate, and mount with a resinous mounting medium.
- Observe the stained sections under a light microscope. Measure the thickness of the epidermis and assess the level of skin inflammation by counting the infiltrating inflammatory cells.
NOTE: The UV dose delivered during the cycle is sufficient to induce acute erythema for efficacy evaluation but remains well within the safe, non-lethal threshold, as evidenced by the mice showing no signs of severe systemic damage and maintaining normal physical activity after the testing cycle.
6. Statistical analysis
- Perform statistical analysis using GraphPad Prism 9.5. Express quantitative variables as mean ± standard deviation. Use one-way ANOVA followed by Tukey’s post-hoc test for comparisons among multiple groups. Statistical significance was defined as *p < 0.05, **p < 0.01, and ns indicates no significance (p > 0.05).
Risultati
Caratterizzazione ambientale del sistema di prova
Prima della valutazione in vivo, i parametri fisici della camera simulata di ambiente marino sono stati calibrati per garantire un'elevata fedeltà ambientale. L'unità di simulazione UV utilizzava una lampada da 6 W che emetteva uno spettro ampio compreso tra 300 e 420 nm, con una lunghezza d'onda di picco a 340 nm. Questa specifica distribuzione spettrale assicura un'emissione dominante di UVA accompagnata da una frazione biologicamente rilevante di UVB, replicando efficacemente lo spettro ultravioletto tipico della luce solare a mezzogiorno che raggiunge la superficie terrestre17. L'onda generata funzionava a una portata di 10 L/min, generando uno sforzo di taglio fluido lieve, paragonabile al moto ondoso costiero delicato. Inoltre, l'unità di flusso d'aria forniva una velocità costante di 35 CFM, corrispondente a una velocità del vento di circa 3-4 m/s sull'area di prova. Questo valore corrisponde a una brezza leggera (scala di Beaufort 3), tipica delle condizioni meteorologiche marine18. Questi parametri combinati riproducono in modo affidabile gli stress meccanici e ambientali ciclici cui si è esposti durante le normali attività in ambiente costiero.
Valutazione della ritenzione della protezione solare
Innanzitutto, è stato assemblato l'apparato simulato di ambiente marino. Come mostrato in Figura 1A, il sistema è composto principalmente da un ventilatore, un sistema di irradiazione UV, un serbatoio di acqua di mare simulata e un sistema di controllo, utilizzati rispettivamente per l'essiccazione con vento, l'irradiazione UV, l'immersione in acqua di mare e il controllo centralizzato. Dopo aver posizionato i topi nell'apparato e avviato il sistema, sono state correttamente simulate le condizioni delle fasi di immersione ed emersione sulla riva (Figura 1B). Sulla base di questa configurazione, abbiamo inizialmente studiato la ritenzione della protezione solare in tali condizioni. Inizialmente, creme solari commerciali A, B e C, etichettate con un marcatore fluorescente, sono state applicate sul dorso dei topi. Successivamente, questi animali sono stati sottoposti a un ciclo alternato nell'apparato di simulazione, costituito da 30 min di immersione (simulazione della nuotata) e 30 min di fase di emersione (simulazione dell'abbronzatura sulla spiaggia). Dopo 2 h, al termine di un ciclo completo di onde e vento, la fluorescenza residua sulla pelle è stata rilevata mediante imaging in vivo. Come mostrato in Figura 2A–B, rispetto ai valori pre-simulazione, tutti i gruppi trattati con protezione solare hanno mostrato una riduzione dell'intensità fluorescente, indicando che l'effetto di risciacquo delle onde dell'acqua di mare provoca la rimozione di una quantità significativa di prodotto. Tra questi, il quadrante trattato con la Protezione Solare C ha mantenuto una quantità relativamente elevata di fluorescenza, la Protezione Solare B ha mostrato una ritenzione moderata e la Protezione Solare A ha mostrato la minore ritenzione (Figura 2C). Ciò indica che le protezioni solari C e B possiedono capacità di ritenzione relativamente più elevate. Questi dati confermano che il nostro apparato è in grado di differenziare quantitativamente la durata di diverse formulazioni sotto stress ambientali complessi.
Efficacia fotoprotettiva
Per approfondire gli effetti protettivi nei confronti dei raggi UV di queste creme solari in un ambiente costiero simulato, sono state effettuate osservazioni macroscopiche della cute dorsale dei topi. Come mostrato in Figure 3A e 3B, il controllo non protetto ha mostrato danni indotti dai raggi UV, caratterizzati da marcata eritema, rossore e scottatura solare. Al contrario, le regioni trattate con schermi solari hanno evidenziato sintomi di scottatura solare significativamente ridotti. Inoltre, l'analisi istologica utilizzando H&La colorazione #38;E è stata eseguita e era coerente con le osservazioni macroscopiche sopra menzionate (Figura 4A–B). Quando il controllo non protetto è stato esposto al simulatore di ambiente marino, si è osservato un notevole ispessimento dell'epidermide e una marcata infiltrazione di cellule infiammatorie (Figura 4C) nel derma sono stati osservati, dimostrando che il sistema di prova simulato in ambiente marino replica efficacemente l'ustione cutanea solare in un ambiente litorale reale. L'applicazione di filtri solari ha attenuato in modo significativo questi cambiamenti patologici. In particolare, lo spessore dell'epidermide e l'infiltrazione di cellule infiammatorie nei tessuti cutanei trattati con Filtro Solare C erano notevolmente simili a quelli del controllo interno protetto dai raggi UV, sottoposto allo stesso stress ambientale. Ciò indica che il Filtro Solare C offre l'effetto protettivo ottimale nell'ambiente marino simulato, probabilmente attribuibile alla sua elevata capacità di ritenzione e alle sue proprietà fotoprotettive intrinseche.
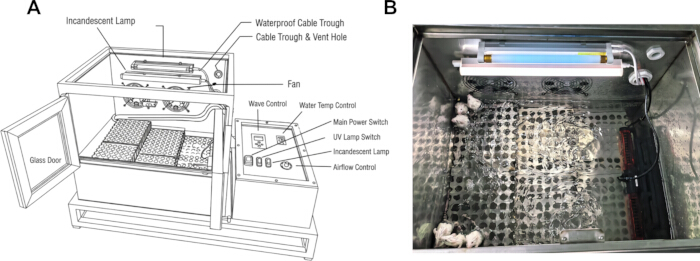
Figura 1: Panoramica del sistema di prova simulato in ambiente marino. (A) Diagramma schematizzato dell'apparato. (B) Topi all'interno della camera di prova. La camera di prova personalizzata integra un dispositivo di irradiazione UV, una vasca idrica con generatore di onde e un ventilatore, simulando efficacemente un ambiente marino reale. Non sussistono problemi di copyright relativi a questa figura, poiché è stata ottenuta dagli autori. Cliccare qui per visualizzare una versione ingrandita di questa figura.
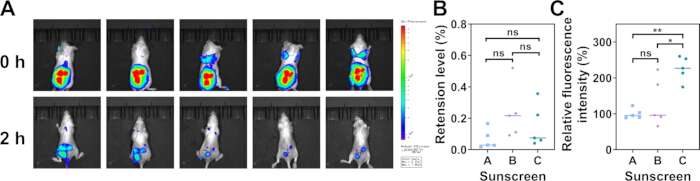
Figura 2: Analisi fluorimetrica della ritenzione della protezione solare. (A) Immagini fluorimetriche rappresentative della cute dorsale del topo prima e dopo l'esperimento della durata di 120 minuti. (B) Analisi quantitativa della ritenzione della fluorescenza. (C) Analisi dell'intensità fluorescente relativa. I dati sono espressi come media ± DS (n = 5). L'analisi statistica è stata eseguita mediante ANOVA a un fattore seguita dal test post-hoc di Tukey. *p < 0,05, **p < 0,01. Cliccare qui per visualizzare una versione ingrandita di questa figura.
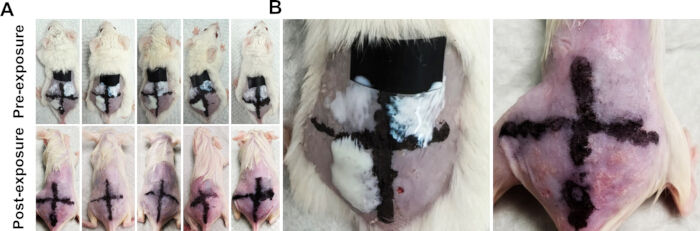
Figura 3: Aspetto macroscopico della pelle del topo dopo esposizione ambientale. (A) Immagini macroscopiche rappresentative della pelle dorsale del topo dopo 120 minuti di esposizione a un ambiente marino simulato. (B) Ingrandimenti locali che mostrano la comparsa di eritema e desquamazione nell'area di controllo non protetta, rispetto alle aree protette con crema solare e al controllo interno schermato dai raggi UV (Normale). Cliccare qui per visualizzare una versione ingrandita di questa figura.
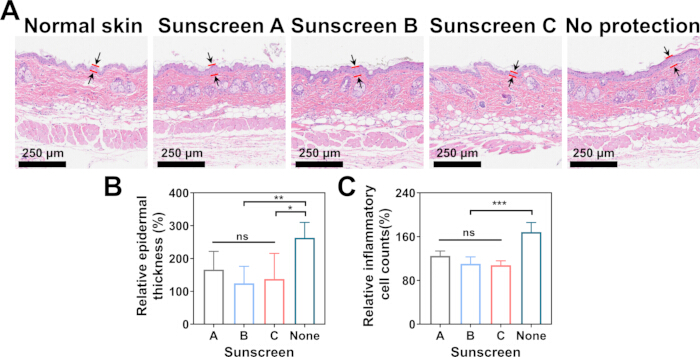
Figura 4: Valutazione istologica dell'efficacia fotoprotettiva. (A) Esempio di H&Sezioni colorate con ematossilina ed eosina della pelle dorsale del mouse provenienti da diverse aree trattate dopo esposizione ambientale. Le linee indicatrici identificano i confini dell'epidermide misurata. Barra della scala = 250 µm. (B) Analisi quantitativa dello spessore epidermico in ciascuna area designata. (C) Valutazione quantitativa delle percentuali relative di cellule infiammatorie. Il controllo interno protetto dai raggi UV (Normale) è stato impostato come valore di riferimento (100%). I dati sono espressi come media ± SD (n = 5). L'analisi statistica è stata eseguita mediante ANOVA ad un fattore seguita dal test post-hoc di Tukey. *p < 0.05, **p < 0.01, ***p < 0.001. Cliccare qui per visualizzare una versione ingrandita di questa figura.
Discussione
In this study, a multi-factor simulated seaside testing system combined with a live murine model was successfully developed and validated. Beyond providing a novel apparatus, this integrated protocol enables the dynamic evaluation of sunscreen durability and photoprotective efficacy under synergistic environmental stressors. By bridging the gap between simplified in vitro assays and complex human clinical trials, this method establishes a comprehensive preclinical platform for understanding how skin barrier formulations perform in practical marine settings.
The primary advantage of this protocol over conventional methods is its high environmental fidelity. Standard water-resistance tests typically involve static water immersion in a laboratory tub19. In contrast, our system integrates the mechanical friction of wave action, the osmotic stress of high-salinity seawater, the evaporative effect of wind, and continuous UV irradiation. These factors act synergistically to break down the sunscreen film, providing a much more rigorous and realistic stress test. It should be noted that during the fluorescence retention assessment, UV lamps were turned off to prevent fluorophore quenching. Consequently, this specific test evaluates physical durability against mechanical washout and osmotic stress, but lacks the UV-induced chemical degradation factor. To compensate for this, the subsequent histological evaluation was conducted with the UV module activated, providing a holistic assessment of practical efficacy. The results clearly demonstrated that while all sunscreens provided some baseline protection, the retention rate (Figure 2) and the corresponding histological protection (Figure 4) varied significantly depending on the formulation's resistance to these combined dynamic forces.
The use of BALB/c mice provides an excellent in vivo platform that accounts for biological variables such as sebum secretion, transepidermal water loss, and dynamic skin movement, which artificial skin models cannot replicate. The UV dose delivered during the 120-minute cycle was strictly controlled to effectively induce acute sunburn on the exposed skin area without causing any systemic toxicity or severe damage, keeping it strictly within ethical limits for BALB/c mice. Furthermore, by dividing a single mouse's back into four quadrants, we eliminated inter-individual biological variation, allowing for highly accurate paired comparisons between different sunscreen formulations.
A critical step in this protocol is ensuring the complete recovery of the murine skin after depilation, as any baseline irritation will confound the histological readout. Furthermore, the uniform application of the sunscreen film, stable calibration of the environmental parameters prior to testing, and precise timing of the immersion and emersion phases are vital to ensuring high reproducibility between batches. Regarding troubleshooting, several foreseeable issues may arise. If uneven sunscreen spreading is observed, recalibrate the pipetting volume and ensure a gentle circular motion. If erythema resulting from depilation persists, the recovery period should be extended, or the affected animals should be excluded. To prevent animal fatigue during immersion, strictly monitor their activity and ensure the resting platform is fully accessible during the immersion phase.
A limitation of this model is the anatomical and physiological difference between murine skin and human skin (e.g., hair follicle density and epidermal thickness). Murine skin possesses higher hair follicle density and a thinner epidermis, which may alter sunscreen film formation. The abundant hair follicle invaginations might act as micro-reservoirs, potentially favoring the mechanical retention of particulate-based (inorganic) sunscreens over strictly organic formulations. While it is a robust comparative tool for screening formulations, human clinical trials remain necessary for final SPF labeling. Future applications of this system are broad. Beyond sunscreens, this apparatus can be adapted to evaluate the durability of other topical cosmetics, barrier creams, wound dressings, and even UV-protective textiles under harsh environmental conditions. The integration of this system streamlines the R&D process, offering cosmetic chemists and dermatological researchers a rapid, cost-effective, and ethical screening method before moving to human trials.
Dichiarazioni
Gli autori non hanno interessi concorrenti da dichiarare.
Ringraziamenti
Questo lavoro è stato sostenuto da finanziamenti del Progetto di Innovazione Scientifica e Tecnologica Autonomo di Foshan (n. 2220001004842).
Materiali
| Nome | Azienda | Numero di catalogo | Commenti |
|---|---|---|---|
| Eosina | Macklin | 770427 | Utilizzata per la colorazione ematossilina-eosina (H&E) |
| Etanolo | Macklin | E809059 | Utilizzato per la colorazione ematossilina-eosina (H&E) |
| Crema depilatoria | Veet | TMG-001 | Utilizzata per rimuovere i peli fini |
| Ematossilina | Macklin | H810910 | Utilizzata per la colorazione ematossilina-eosina (H&E) |
| Image J | Utilizzato per l'analisi delle immagini | ||
| Sistema di imaging in vivo | Perkinelmer | IVIS Lumina III | Utilizzato per rilevare il mantenimento della fluorescenza |
| Isoflurano | RWD Life Science | R510-22-10 | Utilizzato per anestetizzare i topi |
| Paraformaldeide | Biosharp | BL539A | Utilizzata per fissare i tessuti cutanei |
| Rasoio | Chemmole | CM700015 | Utilizzato per rimuovere la maggior parte dei peli |
| Cloruro di sodio | Macklin | S805285 | Utilizzato per la preparazione dell'acqua marina simulata |
| Sulfo Cy7 | Ruixibio | R-Z54515 | Utilizzato per marcare la protezione solare |
| Lampada UV | Kanfu Lighting Technology | T5-6W | Utilizzata per fornire raggi ultravioletti |
| Xilene | Macklin | X821391 | Utilizzato per la colorazione ematossilina-eosina (H&E) |
Riferimenti
- RK Gupta, L Parvadiya, K Dudhat. Advancements in skin cancer prevention and treatment: harnessing technology, natural therapies, and emerging diagnostic approaches. Crit Rev Ther Drug Carrier Syst. 2025; 5: 1-54.
- Q Gao, C Xu, M Tan, et al. Hydrogel-based therapies for photoaging: current advances and future perspectives. J Cosmet Dermatol. 2025; 6: e70295.
- Hong S, Peng Z, Wu M, et al. Human-hair-derived natural particles as multifunctional sunscreen for effective UV protection. ACS nano. 2023; 17(15): 14943-14953.
- S Lautenschlager, HC Wulf, MR Pittelkow. Photoprotection. Lancet. 2007; 9586: 528-37.
- E Biba. Protection: the sunscreen pill. Nature. 2014; 7527: S124-5.
- M Pelizzo, E Zattra, P Nicolosi, et al. In vitro evaluation of sunscreens: an update for the clinicians. ISRN Dermatol. 2012; 352135.
- S Bielfeldt. Performance metrics of sunscreen formulations: in vitro and in vivo techniques. Curr Probl Dermatol. 2021; 124-132.
- J Akrman, L Kubác, H Bendová, et al. Quartz plates for determining sun protection in vitro and testing the photostability of commercial sunscreens. Int J Cosmet Sci. 2009; 2: 119-29.
- DL Lott, J Stanfield, RM Sayre, et al. Uniformity of sunscreen product application: a problem in testing, a problem for consumers. Photodermatol Photoimmunol Photomed. 2003; 1: 17-20.
- SM Tuchayi, Z Wang, J Yan, et al. Sunscreens: misconceptions and misinformation. J Invest Dermatol. 2023; 8: 1406-1411.
- A Breneman, DV Belsito. Sun protection factor testing: a call for an in vitro method. Cutis. 2022; 2: E15-e17.
- U Osterwalder, JC Hubaud, E Perroux-David, et al. Sun-protection factor of zinc-oxide sunscreens: SPF(in vitro) too low compared to SPF(in vivo)-a brief review. Photochem Photobiol Sci. 2024; 10: 1999-2009.
- International Organization for Standardization. ISO 24444:2019 Cosmetics — Sun protection test methods — In vivo determination of the sun protection factor (SPF). Geneva: ISO; 2019.
- International Organization for Standardization. ISO 16217:2020 Cosmetics — Sun protection test methods — Water resistance percentage. Geneva: ISO; 2020.
- G Ruiz-Gutiérrez, A Rodríguez-Romero, A Tovar-Sánchez, et al. Analysis and modeling of sunscreen ingredients’ behavior in an aquatic environment. Oceans. 2022; 3: 340-363.
- JK Saxe, L Mullins, R Jones, et al. Influence of sunscreen formulation on the transfer of mineral and organic ultraviolet filters from skin to seawater in simulated ocean bathing tests. Int J Cosmet Sci. 2023; 84-92.
- D’orazio, J, Jarrett S, Amaro-Ortiz A, et al. UV radiation and the skin. Int J Mol Sci. 2013; 14(6): 12222-12248.
- Met Office. Beaufort wind force scale [Internet]. Exeter: Met Office. Available from: https://weather.metoffice.gov.uk/guides/coast-and-sea/beaufort-scale
- K Geoffrey, A Mwangi, S Maru. Sunscreen products: rationale for use, formulation development and regulatory considerations. Saudi Pharmaceutical Journal. 2019; 7: 1009-1018.
Ristampe e permessi
Questo articolo è stato pubblicato
Video in arrivo