Engagement Insights uses a webcam and ResNet CNN with geometric EAR/MAR features to classify student engagement (Attentive, Confused, Disengaged, Distracted) in real-time. Achieves 89% accuracy and ~0.89 F1 on re-annotated datasets (κ=0.87), runs at 30 fps on standard laptops without GPUs.
Articolo di ricerca
Real-Time Four-Category Student Engagement Classification from a Single Webcam Using a Hybrid ResNet and Geometric Feature Network
In questo articolo
Sommario
Abstract
The Engagement Insights system is an automated technology that tracks student engagement in real-time with the help of just one webcam which classifies engagement into four main categories, namely, Attentive, Confused, Disengaged, and Distracted. In comparison to the usual methods that are based on binary definitions and needed special devices that are often impractical (like wearable devices), the system provides an easy and non-intrusive alternative. The system employs ResNet convolutional neural networks alongside the geometry module that is capable of calculating Eye Aspect Ratio (EAR) and Mouth Aspect Ratio (MAR) using facial landmark detection framework facial points which enhance reliability while remaining speedy. The system has been trained and validated using the dataset that comprises pictures from AffectNet and video frames from the DAiSEE database that have all been labeled into the four engagement categories with the help of educational psychology patterns and independent evaluations showing that the achieved Cohen’s kappa coefficient equals 0.87. The system worked well as the average classification accuracy was 89% with the average macro-F1 score being 0.889 and AUC ranging from 0.926 to 0.936 for all the classes. Most importantly, the analysis of the dataset has shown that by using ImageNet weights, it is possible to increase classification performance by 13–17 percentage points in comparison to training without pre-trained weights which confirms the findings made in the main text. Moreover, the geometric module of the system did increase the performance in detecting disengagement signals but did not slow down performance since it only took 2 milliseconds to process one frame which enables the system to work independently on regular laptops providing the necessary number of frames per second while requiring no additional expensive equipment like GPUs.
Introduzione
Engagement of students is an important factor that impacts success in the education system, as it is essential for obtaining new knowledge and is responsible for the quality of education in future1. For this reason, it is crucial for the lecturer to assess students’ engagement level properly and take into consideration that when organizing lessons2. Traditionally, teachers have relied on subjective methods for the assessment of engagement, such as interpreting students’ facial expressions, monitoring eye contact, and changing the speed of instruction based on how engaged students are, which proves the subjectivity of such measures and makes them impractical for bigger classrooms with thirty and more students where the teacher might not be able to observe each student at the same time. With the advent of digital technologies, the demand for automated and objective engagement evaluation methods is growing3.
Of all types of technological solutions for the evaluation of engagement, Facial Expression Recognition (FER) is becoming more popular as it is non-invasive and can be used with regular cameras4. Moreover, thanks to using deep learning neural networks, FER has become able to detect emotional states, like confusion and tiredness, from the video image over the certain period of time5. Nevertheless, despite such advancements, FER systems have not yet found a place in real classrooms in practice. Thus, there are a number of issues they face, namely most of the systems are designed for online learning and largely depend on log data that cannot transfer the nuances of real-life classes6. Certain technologies typically require students to extensively wear EEG devices that measure their level of psychological engagement. Most students do not find such requirement reasonable enough7,8,9,10. FER, today, does not offer much due to the fact that it introduces binary engagement classification either engaged or not engaged – which is not sufficient for the challenges teachers are facing as they have to make very subtle pedagogical decisions11. In addition, many advanced systems employ complicated transformer models that process data slowly and therefore, are unable to be used in schools12,13,14,15.
By way of background, it is important to note several methods that are used to measure engagement, namely behavioral/physiological approaches and FER-based approaches16. Behavioral and physiological methods often work with basic body language, e.g., hand-raising, changes of posture, and fidgeting17,18,19,20. For example, the Wits Intelligent Teaching System used CNNs for assessing behavior changes and had a success rate of about 76%. Other scientists were able to utilize devices like Kinect that helped with measuring the body position of students and their facial expressions. While such methods are effective in ideal conditions, they are hard to implement because of the cost. Physiological methods like EEG, galvanic skin response, and heart rate have proven useful as well21,22,23,24. Nonetheless, the bulkiness, intrusiveness, and expense of the equipment render it unlikely that students would tolerate wearing any of these devices for a complete lecture, thus limiting their usefulness when the need for it arises25,26,27.
In stark contrast to the above are the various FER systems which are based on camerawork and hence are less intrusive and more scalable. Considerable progress has been made in the field28,29,30. Thus, CNN based systems achieve overall accuracy levels of 76.9% and 83% respectively. The CSBAM-MobileNet is a remarkable invention. It is a CNN based MobileNet that utilizes a Channel-Spatial Module. It accomplished the 91.2% accuracy result in predicting five emotional states which have been ranked on various datasets. The challenge remains the distinction between visually similar states such as confusion and distraction. This makes these states significant but at the same time visually subtle and difficult to distinguish. Some researchers tried to solve this through the development of multimodal systems such as IC-BiSGRU-Net which integrates video, audio, and digital log files for the purpose of achieving high accuracy. Yet these systems require some special equipment and collection of data which are often inaccessible in schools. Thus, the dependency on expensive and complex systems is a bottleneck to transferring results of sophisticated FER research into daily practice.
A literature review reveals a noticeable gap. Low-cost and effective systems exist but are all too often unavailable for classroom use; no systems capable of real-time engagement assessment exist that do not require advanced technology. In the past, multiple different systems used different methods; this has led to high-quality and accurate systems being developed, but which are either very heavily reliant on resources or extremely simplistic in output, or else are able to use only particular machine models. Some systems are able to utilize so-called pixel-based CNNs, although these have difficulties operating in a class environment that is different from the training environment due to poor signals concerning student engagement.
In this paper, we describe a new system called Engagement Insights, which has been designed to overcome previously mentioned difficulties and problems. Its contributions are fourfold. Firstly, our system is innovative due to how it is structured. It consists of a ResNet system that specializes in deep learning technologies and is trained on new databases that have been labeled newly in order to be able to classify engagement into one of four categories: attentive, confused, disengaged, and distracted. This system serves as a solid safety net that recognizes obvious signs of disengagement (such as eyes are nearly closed) or yawning. Unlike strictly data-based methods, this rule-based approach is lightweight and can be easily understood by non-engineers. In addition, it operates independently of the platform that doesn’t require retraining during deployment at different classrooms.
The output from both these components is brought together for the making of decisions, assuring that the system performs correctly regardless of varying circumstances. Let’s mention granularity of the results and speed of the system performance as the next achievement. The system classifies engagement at four distinct levels rather than in a binary way like the other systems do. More importantly, it operates at a speed of 30 fps with the help of a usual laptop webcam which makes it the first hybrid system to operate in this manner. Let’s examine the need for this study, which is another significant contribution of the paper. While many high-accuracy systems abilities do exist, they heavily rely on multimodal data and specific devices. Engagement Insights is presented as an accessible unimodal solution in the field which not only connects complex research prototypes with real educational technology but offers a viable and applicable version of engagement assessment in educational settings. To put it differently, the system is not designed to compete with the multimodal systems existing in the world but supports providing a reasonable alternative applicable in most educational establishments. Finally, let’s analyze the validation of the system. The model is presented in the paper along with an ablation study that is very important for other researchers since it shows the actual role of pre-trained weights, dropout, and network depth (ResNet18 versus ResNet50). So, the major contribution of the study is developing and validating a hybrid FER system that combines a specifically trained deep classifier with a rule-based method. It can fill the gap existing in the literature and provide an inexpensive solution for student engagement assessment in the classrooms.
Protocollo
This study involved secondary analysis and re-annotation of facial images and video frames obtained exclusively from the pre-existing AffectNet and DAiSEE datasets. No new data were collected from human participants, and the study did not involve direct interaction with or recruitment of human participants. The data used for model development and evaluation did not include personally identifying information beyond the labels provided with the source datasets. Under the institutional policy of Vignan’s Institute of Information Technology (A), Visakhapatnam, this secondary analysis of pre-existing data did not require institutional ethical review; therefore, no ethics approval was sought for the present study. Details of the datasets, software, pretrained model weights, computing hardware, and other research resources used in this study are provided in the Table of Materials.
Dataset building
Obtaining authentic instructional video data is very difficult due to the logistics involved (i.e. obtaining proper display conditions, ethics approval, and considerable time needed for annotations). To make an annotated dataset of large scale, we used photos and video frames provided in two publicly available datasets on Kaggle, AffectNet and DAiSEE. AffectNet3 has more than 1 million photographs of faces labeled across 8 emotion classifications and with continuous valence/arousal scores, and DAiSEE22 is a video dataset with labeled video from virtual learning experiences of students labeled as engaged, bored, confused, or frustrated. We extracted still frames from the videos in the DAiSEE collection to create a more comprehensive and ecologically valid training dataset to improve the learning models we intend to use.
A key insight has been that the facial expressions associated with the emotions of disgust, surprise, and sadness looks very similar to the facial expressions exhibited by the students when they are exhibiting cognitive confusion/difficulty, disinterest, and distraction. Based on literature in educational psychology1,2,4,13, we developed our relabeling techniques and created 4 engagement categories based on the facial muscle movement patterns that make up the various facial expressions associated with each category of emotion.
Attentive
For this category, we used images labeled as neutral or satisfied in AffectNet; as well as calm forward-facing frames in DAiSEE, showing active attention and processing of information (evidenced by looking forward with widened eyes and relaxed facial muscle tone).
Confused
For this category, we used photos labeled as surprise and/or disgust in AffectNet, as well as confusion labeled frames in DAiSEE. Confused facial expressions typically has frowning eyebrows, a little tension on one side of mouth, and eye movement patterns.
Disengaged
For this category, we used photos labeled as sadness and/or sleepy in AffectNet, and from the boredom/disengaged frames in DAiSEE. Typical disengaged facial expressions are characterized by eyelids drooping and/or jaws relaxed with very little muscle tone, and the label for a disengaged facial expression was additionally supported by determining EAR thresholds18.
Distracted
This category relied on facial expressions labeled as low arousal and/or contempt in AffectNet, and from the distracted frames in DAiSEE in which the student was gazing away from the learning activity. Typical distracted facial expressions show little movement in the facial muscles.
Relabeling protocol
The relabeling was completed by two research assistants trained in educational psychology, following a structured protocol. Each image or extracted video frame was independently assigned to one of our four engagement labels according to the fixed mapping given in Table 1. Disagreements (less than 3% of the images) were adjudicated by a third author who assigned a consensus label to the images or excluded the image from the dataset. Only images with full agreement among the annotators were retained. Inter-rater reliability was measured across a random selection of 500 images, yielding a Cohen’s κ = 0.87, demonstrating high reliability. The original source label to engagement category mapping can be found in Table 1.
Note: Images where source labels mapped ambiguously across two engagement categories were reviewed by the third expert and either assigned a consensus class or excluded (< 3% of source images).
| Engagement Class | AffectNet Emotions | DAiSEE Labels | Visual Cues |
| Attentive | Neutral, Happy/Satisfied | Engaged | Open eyes, relaxed face |
| Confused | Surprise, Disgust | Confused | Furrowed brow, tense mouth |
| Disengaged | Sadness, Sleepy | Bored/Frustrated | Droopy eyelids, slack jaw |
| Distracted | Contempt, Low arousal | Disengaged | Averted gaze, flat affect |
Table 1: Fixed label mapping from source datasets to engagement categories.
All images were resized to 224 × 224 pixels and normalized using ImageNet mean and standard deviation values. A data augmentation strategy was applied during training including horizontal flipping, rotation within ± 15°, brightness/contrast jitter (± 20% / ± 15%), and random crop with resizing. These transformations simulate variation in lighting, head angle, and partial occlusion as encountered in real classrooms. A total of 3,600 images were used in the dataset (88.9% training, 11.1% testing), as described in Table 2.
The precise RGB normalization parameters that were utilized are mean = [0.485, 0.456, 0.406] and standard deviation = [0.229, 0.224, 0.225], the commonly used constants for normalization in ImageNet, which were performed on pixel intensity values normalized to [0, 1] after the resizing operation of the input of size 224 × 224.
| Engagement State | Training Samples | Testing Samples | Total | Source |
| Attentive | 760 | 95 | 855 | AffectNet + DAiSEE |
| Confused | 688 | 86 | 774 | AffectNet + DAiSEE |
| Disengaged | 832 | 104 | 936 | AffectNet + DAiSEE |
| Distracted | 920 | 115 | 1035 | AffectNet + DAiSEE |
| Total | 3200 | 400 | 3600 |
Table 2: Dataset split for engagement classification experiments. Per-class image counts for the training and test partitions, the class totals, and the source dataset for each class.
The statement regarding the right partition is that this is an 88.9% and 11.1% separated dataset made up of 3600 images – out of these, 3200 images form the training set and 400 images form the test set; the images belong to four different classes based on socio-emotional engagement such that the ratio is maintained properly among the various classes.
The original and re-stamped images came from two different datasets: AffectNet (static facial expression images) and DAiSEE (video frames labeled at 1 fps). The Source column in Table 2 indicates which of the two datasets contributed the images for each engagement class.
Overview of system architecture
Facial landmark detection framework is an open-source computer vision framework that provides a connection between live video streams and real-time facial landmark detection. An overview of the system architecture is shown in Figure 1: (Figure 1A) the complete system architecture, (Figure 1B) the ResNet-50 architecture, and (Figure 1C) the end-to-end Engagement Insights pipeline. Fusion of Deep Learning Branch and Heuristic EAR/MAR Branch occurs at Decision Fusion Module as shown below.
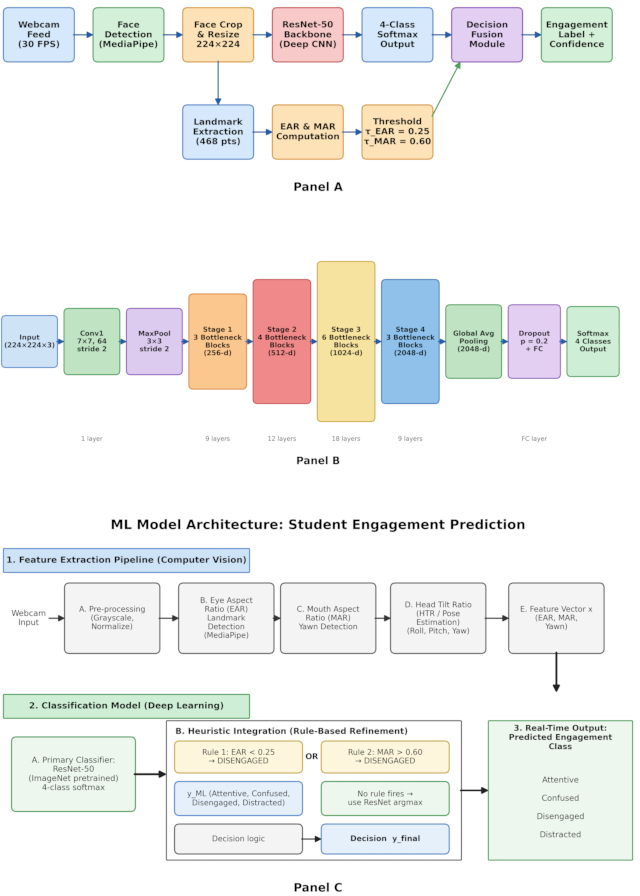
Figure 1: Engagement insights system architecture. (A) Complete system architecture. (B) ResNet-50 model with the modified four-class engagement head. (C) End-to-end pipeline in which the deep learning branch and the heuristic EAR/MAR branch are combined at the decision fusion module. Please click here to view a larger version of this figure.
The engagement tracking system gives us an entire view of the process of counting a student's level of engagement based upon the student's features through facial expression (i.e., determining how serious a student is). This engagement tracking activity starts with video from a live camera, where the facial landmark detection framework program receives the video, and with the first part of transforming each face seen in the video into a face mesh with 468 points (landmarks). Subsequent to mesh creation, the two output branches are created: (1) the deep learning branch provides the predicted class through a ResNet-based classifier, which outputs a predicted class from the softmax output of four classes; and (2) the heuristic branch uses the 468 facial landmark detection framework to determine the opening of the eyes (EAR) and mouth (MAR). The output from both branches will then be combined to generate a single engagement label. Finally, the final output (bounding box, predicted class and confidence score) will be displayed in real time as an overlay on each video frame being viewed as shown in Figure 1A.
ResNet-50 model architecture
The final choice for using a deep learning model was ResNet23 because of the depth to efficiency ratio that is created through the use of residual skip connections. Furthermore, we evaluated two different types of ResNet architecture: ResNet-18 (11.2 M parameters) and ResNet-50 (23.5 M parameters). Both models were initially started from pre-trained weights on ImageNet rather than being trained from the ground up, which was very advantageous since our dataset is quite small compared to traditional datasets used to train CNNs.
ResNet-18/ResNet-50 were chosen due to their superior trade-off of accuracy and latency when implemented on CPU-based hardware and their available ImageNet pre-trained models, which are a good fit for our small-sized dataset (3600 images). We did not run any measurements on more recent models (like ViT, based on Mamba or any other lighter vision architecture), nor did we compare parameters, FLOPs, or latency against them.
We removed the original 1000-class ImageNet head and replaced it with a four-class engagement head that uses the following features: (i) global average pooling over the last convolution feature map producing either a 512-d vector for ResNet-18 or a 2048-d vector for ResNet-50; (ii) a Dropout layer (p = 0.2) before the last linear layer; and finally (iii) a fully connected layer with four output neurons, activated using Softmax. Each of these four output neurons corresponds to one of the four classes of engagement: Attentive, Confused, Disengaged and Distracted. An overall diagram of the ResNet-50 architecture with the modified head is shown in Figure 1B.
The cross-entropy loss function used for training is:
L = −(1/N) × Σi Σj yij × log(ŷij) (1)
where yi is the ground truth one-hot label and ŷi is the predicted probability for sample i and class j. All models used Adam29 with a learning rate of 0.001 and standard momentum parameters (β1 = 0.9, β2 = 0.999), trained for up to 50 epochs in batches of 32. A StepLR scheduler decayed the learning rate by 0.1 every 10 epochs.
Heuristic geometric cue module
We created a geometric module to detect physical signs of disengagement such as closed eyes and yawning. This geometric module uses facial landmark detection framework24 to extract 468 3D facial landmarks from each frame in real-time.
It calculates two metrics:
Eye Aspect Ratio (EAR)
Quantifies the degree of eye openness from the ratio of vertical to horizontal eye distances. For a given eye with landmarks p₂ through p₆.
EAR = (‖p₂−p₆‖ + ‖p₃−p₅‖) / (2 × ‖p₁−p₄‖) (2)
For each frame the mean EAR was calculated across both eyes. If it went below 0.25 (the drowsiness threshold established in prior blink-detection work18), the student was flagged as disengaged.
Mouth Aspect Ratio (MAR)
Quantifies mouth opening to detect yawning behavior.
MAR = (‖m₂−m₈‖ + ‖m₃−m₇‖ + ‖m₄−m₆‖) / (2 × ‖m₁−m₅‖) (3)
To find the mean aspect ratio (MAR), we use the coordinates of the landmarks at the outer lip (m₁ - m₈). If the value of the MAR is greater than 0.6, then the subject is flagged as disengaged due to yawning19, regardless of the prediction made by the deep model. Eye aspect ratio (EAR) and MAR landmark coordinates (as defined by facial landmark detection framework 468) are mapped as follows, for EAR, the left and right eye indices are mapped using the typical six-point eye contour definition, while for MAR, the outer lip contour indices are used. No influence from head pose (yaw angle) is included in the current implementation.
For the sake of complete reproducibility, the exact facial landmark detection framework (468 points) indices utilized in this study can be seen in Figure 1C. In terms of EAR, for each eye, there are six points (p1 - p6) defined in Eq. 2 the left eye corresponds to the following indices [362 (p1, outer corner), 385 (p2), 387 (p3), 263 (p4, inner corner), 373 (p5), 380 (p6)] and the indexes for the right eye are [33 (p1, outer corner), 160 (p2), 158 (p3), 133 (p4, inner corner), 153 (p5), 144 (p6)]. It is important to note that EAR is computed independently for each eye, and their values are averaged over each frame. In the case of MAR, the eight outer-lip points appearing in Eq. 3 can be defined as follows m1 = 61 (left mouth corner), m5 = 291 (right mouth corner), (m2, m8) = (39, 181), (m3, m7) = (0, 17), (m4, m6) = (269, 405). All these indices follow the standard facial landmark detection framework outer-eye-contour and outer-lip-contour indices that were employed in previously developed EAR/MAR methods.
Decision fusion and real-time processing
If the EAR threshold or MAR threshold has been met, the final output will be Disengaged, which is a complete override of any overall considerations of the deep learning model (e.g., ResNet, etc.)18. The geometric signal contains the most accurate information for the Disengagement event and will be considered as the final authority on the validity of the serious disengagement cues, when neither threshold fires, the ResNet will provide the label based on the softmax argmax of the four classes.
All frames go through the identical process in the following order
- Face detection and extraction of 468 facial landmarks using facial landmark detection framework,
- Cropping the face and resizing/normalizing it to 224 × 224 pixels in size
- Generating a four-class softmax output using ResNet
- Calculating the EAR and MAR in parallel
- Using the fusion rule to determine the final label
- Annotating and drawing a bounding box around the result received from fusion.
Overall, the system processes frames in 33 ms on average (~30 FPS) on a standard CPU with no GPU.
The training utilized programming language 3.11, deep-learning framework 2.x, and an GPU (8 GB + VRAM) with 16 GB of RAM. Inference does not need to be performed with a GPU the released implementation runs at 30 frames per second (FPS) on a normal CPU. The reported inference timings were all measured with a batch size of one on the following test machine CPU, 16 GB RAM, operating system (OS) 11, programming language 3.11, deep-learning framework 2.x, and facial landmark detection framework. The mean and standard deviation of the inference times were calculated over 10 runs of 60 s each, as reported in the Results. A breakdown of the time spent on CNN inference and in the geometric module is given in the Results. The configuration of hyper parameters presented in Table 3 was kept constant for all of the reported results. No 20% validation split was created due to the relatively small size of the dataset (3,600 images); rather, the learning rate and the dropout rate were set to values commonly reported in the FER literature rather than being cross-validated on held-out data, and the stability of the model was verified through five repeated runs.
Summary of the experiment set up
Data partition used is a stratified split of 88.9% / 11.1%. (3200 images for training and 400 images for testing). The model was trained on both ResNet-18 and the ResNet-50 architecture, in each case with ImageNet pre-training and Dropout. Also, Adam optimizer with a learning rate of 0.001 has been used along with the batch size of 32. A maximum of 50 epochs are allowed for training and StepLR decay of 0.1 is used after 10 epochs. Configuration of the hardware to be used is GPU with a minimum of 8GB VRAM and 16 GB RAM. Benchmarking for inferencing is done on a CPU with OS 11.
The process of inference consists of the following steps:
- Facial landmark detection framework extraction
- ResNet softmax classification
- Multiple EAR/MAR computations executed in parallel
- The decision is taken by fusion of results
Evaluation process includes 5 training runs and testing performed on 400 images test data along with macro and weighted F1, AUC values.
The relevant configurations, parameters, hardware, and operating conditions for both training and inference procedure training are summarized in Table 3. Data for inference time were collected with some fixed operating conditions (batch size = 1, CPU-only machine, and the average time for conducting 10 runs 60 sec-long), while the related operating conditions for using the models in the course of training (GPU, count of epochs, batch size, settings of an optimizer) are provided in the table.
The following additional settings that were not outlined above are given in order to provide complete information. To make use of either ResNet-18 or ResNet-50, the two backbones were both initialized with the help of standard ImageNet-trained checkpoints available from the torchvision library only, making random initialization for only their brand-new four-class classification head (Kaiming uniform initialization was employed in the current case). Each of the five repetitions took place with regard to individual seeding of weight initialization and shuffling position of data-loaders in order to make sure that the achieved accuracy was showing variations across initializations rather than representing one run outcome only. Early stopping was not used as well; each of the constructed models was trained for as many epochs as necessary to finish the training process, meaning that the last checkpoint will be used in evaluation as there is no validation dataset that would use the best validation dataset loss only.
| Hyperparameter | Value |
| Framework | PyTorch 2.x / Python 3.11 |
| Architecture variants | ResNet-18 (11.2M params), ResNet-50 (23.5M params) |
| Input image size | 224 x 224 x 3 (RGB) |
| Pretrained weights | ImageNet (torchvision) |
| Batch size | 32 |
| Optimizer | Adam (β1=0.9, β2=0.999) |
| Initial learning rate | 0.001 |
| LR decay schedule | StepLR (step=10, γ=0.1) |
| Training epochs | 50 |
| Dropout rate | p = 0.2 (pre-FC layer) |
| Loss function | Cross-Entropy |
| Data augmentation | Flip, Rotation ±15°, Color Jitter, Random Crop |
| EAR threshold (τ_EAR) | 0.25 |
| MAR threshold (τ_MAR) | 0.6 |
| Real-time libraries | OpenCV 4.x, MediaPipe 0.10 |
| Train/test split | 88.9%/11.1% stratified hold-out (single split) |
| Inference hardware (test) | Intel Core i7-10750H, 16 GB RAM, Windows 11 |
Table 3: Hyperparameter configuration. Learning rate, batch size, number of epochs, optimizer, and scheduler settings used for all reported results.
Risultati
Overall classification performance
Table 4 presents results on the held-out test set of 400 images. The model’s total accuracy is 89.00%, with a macro F1-score of 0.889 and a weighted F1-score of 0.890. The near-equal macro and weighted F1-scores show consistent performance among all four classes. Accuracy across five repeated runs was 89.00% ± 1.2%, confirming stability of the result.
| Metric | Score |
| Overall Accuracy | 89.00% |
| Macro Precision | 0.889 |
| Macro Recall | 0.891 |
| Macro F1-Score | 0.889 |
| Weighted Precision | 0.892 |
| Weighted Recall | 0.89 |
| Weighted F1-Score | 0.89 |
| Mean Prediction Confidence | 0.508 |
| Accuracy ± Std (5 runs) | 89.00% ± 1.2% |
Table 4: Overall classification performance on test set (N = 400).
Analysis of performance by class
The results broken down by class are presented in Table 5. The Disengaged and Distracted classes both achieved the highest F1-scores at 0.904 and 0.905, respectively. This makes sense because there are strong visual features associated with droopy eyelids and not looking at the camera. The Attentive class had the lowest F1-score, 0.863, because calm attention and mild confusion share very similar facial signatures (little movement, forward-facing pose), which makes the two classes difficult to separate. The primary reason for the misclassification errors in this study resulted from boundary combinations between classes.
| Engagement State | Precision | Recall | F1-Score | AUC | Support |
| Attentive | 0.833 | 0.895 | 0.863 | 0.926 | 95 |
| Confused | 0.875 | 0.895 | 0.885 | 0.936 | 86 |
| Disengaged | 0.904 | 0.904 | 0.904 | 0.934 | 104 |
| Distracted | 0.943 | 0.87 | 0.905 | 0.928 | 115 |
| Macro Avg | 0.889 | 0.891 | 0.889 | 0.931 | 400 |
| Weighted Avg | 0.892 | 0.89 | 0.89 | — | 400 |
Table 5: Per-class classification metrics on test set. Precision, recall, F1-score, and support for each of the four engagement classes.
Figure 1B shows the ResNet-50 architecture with the modified four-class engagement head. Figure 2 provides ROC curves for each class. The models achieved AUC values of 0.926, 0.936, 0.934, and 0.928 for the classes of Attentive, Confused, Disengaged, and Distracted, respectively, indicating that the model performs substantially above the 0.5 baseline of a random classifier.
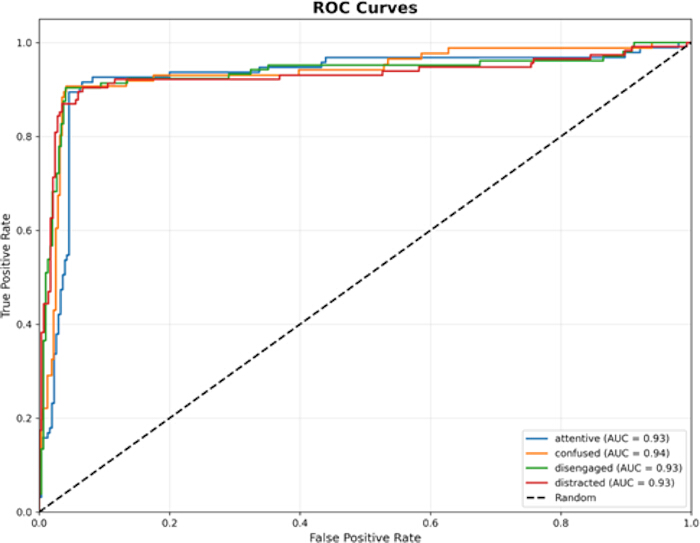
Figure 2: ROC curves for all four engagement states. Area under the curve: Attentive, 0.926; Confused, 0.936; Disengaged, 0.934; Distracted, 0.928. Please click here to view a larger version of this figure.
Confusion matrix analysis
Confusion matrices of the four classes can be visualized in Figure 3. Of the 95 samples whose true class was Attentive, 85 were classified correctly; of the 86 true Confused samples, 77 were correct; of the 104 true Disengaged samples, 94 were correct; and of the 115 true Distracted samples, 100 were correct. Of the 44 total misclassifications, the most frequent single confusion was Distracted cases misclassified as Attentive (9 instances), with five further off-diagonal cells of 4 distributed among the Attentive, Confused and Disengaged classes; the remaining errors were spread across the other class pairs, as shown in the complete confusion matrix in Figure 3. This suggests that visually there is overlap between those classes because of the similarities in physical appearance from the outside.
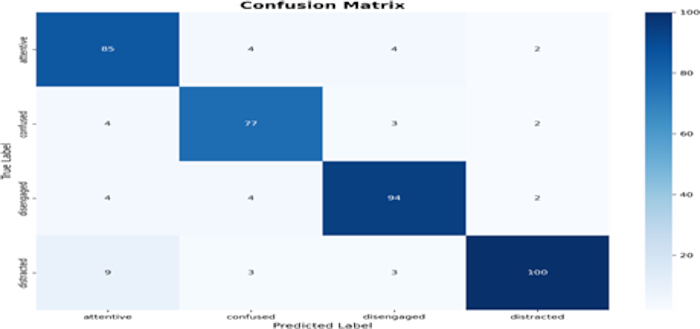
Figure 3: Confusion matrix on the 400-sample test set. Classes: Attentive (AT), Confused (CF), Disengaged (DG), Distracted (DR). Diagonal elements are correct predictions; off-diagonal elements show the misclassification patterns between engagement states. Please click here to view a larger version of this figure.
Prediction confidence and class distribution
Figure 4 shows heat maps of the probability of prediction for each of the four sample types. The accuracy for the Disengaged and Distracted categories was higher due to the heatmaps representing well-defined boundaries; but the Attentive and Confused categories did not display well-defined borders causing them to appear less defined. The average confidence level distribution histograms for the four samples are presented in Figure 5 with a mean confidence level of 0.508 (0.062 is standard deviation). A mean confidence well below the near-1.0 values typical of well-calibrated 4-class softmax outputs indicates that the raw softmax probabilities are not well calibrated to true prediction correctness; this does not affect the reported classification accuracy (which is based on the arg-max class, not the probability value) but means the numeric confidence shown in the real-time overlay should be interpreted qualitatively rather than as a calibrated probability, and post-hoc calibration (e.g., temperature scaling) is left for future work. Figure 6 represents the true (left) and predicted (right) class distributions across the 400-sample test set as shown below.
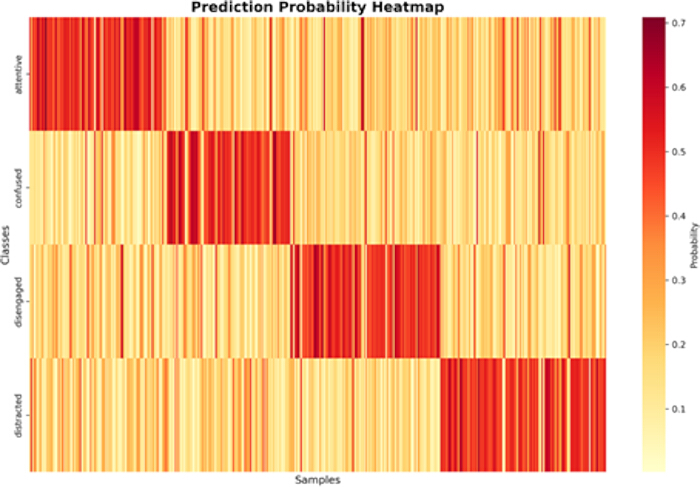
Figure 4: Prediction probability heatmap for all test samples sorted by true class. Please click here to view a larger version of this figure.
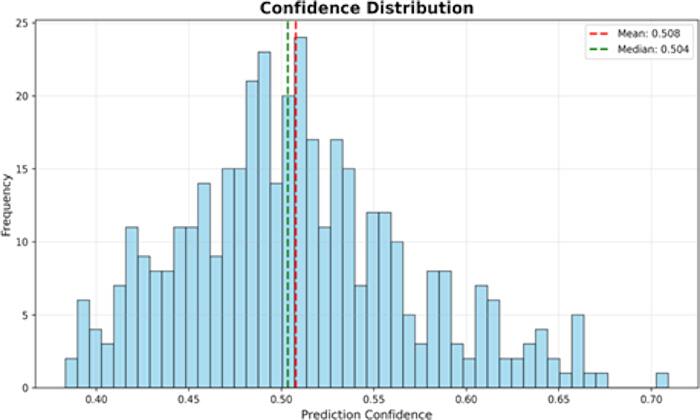
Figure 5: Distribution of maximum predicted confidence scores (mean = 0.508, median = 0.506). The distribution is centred near 0.5, and the mean and median are almost equal, indicating a symmetric distribution. Please click here to view a larger version of this figure.
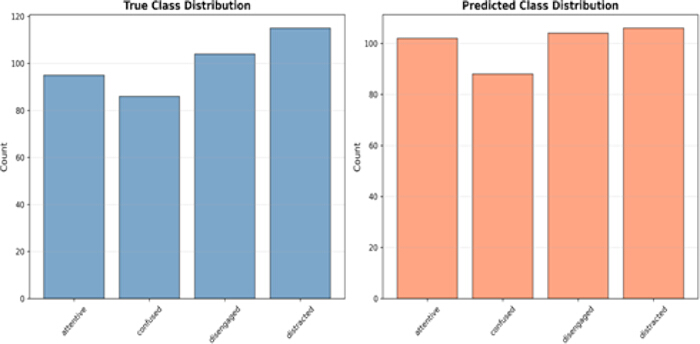
Figure 6: True (left) and predicted (right) class distributions across the 400-sample test set. Please click here to view a larger version of this figure.
Ablation study
Table 6 separates out the relative contribution of each design principle.
Note: Table 6 evaluates the ResNet deep classifier component only, without the EAR/MAR geometric module. The complete system including the geometric module is reported in Table 7. The term ‘Deep Classifier Only’ is used throughout to refer to the ResNet-only configurations. Three configurations were tested within the deep classifier: Full Classifier (ImageNet Pretraining + Dropout), with Pretraining only (without Dropout), and trained from scratch.
| Configuration | Accuracy (%) | Macro F1 | Macro Recall | Notes |
| Deep Classifier Only (ResNet50 + pretrain + dropout) | 85.42 | 0.842 | 0.836 | Best generalization (no geometric module) |
| No Dropout (ResNet50 + pretrain only) | 82.34 | 0.816 | 0.809 | Mild overfitting |
| No Pretrain (ResNet50 from scratch) | 71.23 | 0.699 | 0.685 | Underfits on small dataset |
| Geometric (EAR/MAR) only | ~65% | N/A | N/A | High precision for Disengaged; low overall accuracy |
Table 6: Ablation Study. ResNet-only configurations (without ear/mar heuristic).
| Configuration | Accuracy (%) | Macro F1 | Inference (ms/f) |
| Random Init, No Geometric Module | 71.23 | 0.699 | 45 |
| Random Init + Geometric Module | 74.1 | 0.728 | 47 |
| ImageNet Pretrain, No Geometric Module | 85.42 | 0.842 | 45 |
| ImageNet Pretrain + Geometric Module (Full System) | 89 | 0.889 | 47 |
Table 7: Expanded ablation with geometric module all four configurations.
From the data in the expanded table, it can be seen that there is an increase in accuracy when you use ImageNet pre-trained models as opposed to models that were trained from scratch but do not have the geometric module. Adding the geometric module to the deep classifier increases overall accuracy by approximately 3.6 percentage points (85.42% to 89.00%, Table 7), and macro F1 by approximately 4.7 points (0.842 to 0.889). In the case of Full System, there were also significant increases in per-class F1 scores compared to if you only were using Deep Classifiers. The most significant improvements were achieved on the disengaged class with a +4.2 point increase in F1 scores, thereby proving the effectiveness of using the geometric module to detect drowsiness. Figure 7 represents the Ablation study: accuracy, macro F1, and macro recall for three model configurations.
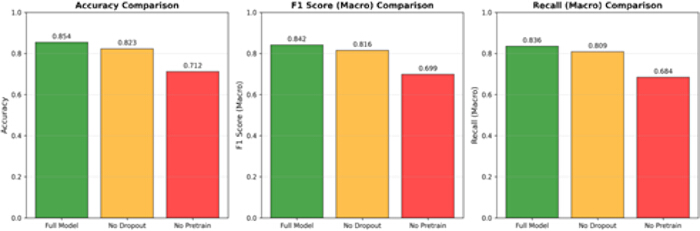
Figure 7: Ablation study: Accuracy, macro F1, and macro recall for three model configurations. Bars compare the three configurations on each of the three metrics. Please click here to view a larger version of this figure.
Architecture variant comparison
Table 8 compares all classifier configurations. Note that the "ResNet-50 + Dropout + EAR/MAR heuristic" row corresponds to the full-system result reported in Table 4 (89.00%). The term "full system" is used throughout to refer to this pipeline with geometric fusion (the basis of improving accuracy). Adding the EAR/MAR heuristic module cost only 2 ms/frame and increased accuracy by 3.6 percentage points.
| Configuration | Accuracy (%) | Macro F1 | Params (M) | Inference (ms/f) |
| ResNet-18 (pretrained, no dropout) | 84.5 | 0.832 | 11.2 | 28 |
| ResNet-18 (pretrained + dropout) | 85.75 | 0.843 | 11.2 | 28 |
| ResNet-50 (pretrained, no dropout) | 82.34 | 0.816 | 23.5 | 45 |
| Deep Classifier Only (ResNet-50 + dropout, no EAR/MAR) | 85.42 | 0.842 | 23.5 | 45 |
| Full System (ResNet-50 + dropout + EAR/MAR) | 89 | 0.889 | 23.5 | 33 |
Table 8: Performance comparison across ResNet-based architecture variants.
The findings of Table 8 only feature ResNet-18, ResNet-50, and ResNet coupled with the EAR/MAR heuristic; no testing was done on using the Transformer or a hybrid design.
Real-time performance and reproducibility
In order to characterize the system's real-time inference performance across different CPU-only hardware, we present Table 9 with timing information to perform an end-to-end inference on 3 representative standard laptops. All tests used the same USB webcam for video input; batch size = 1; did not utilize a GPU. All metrics reported are means ± std of 10 repeats of 60 sec each.
| Laptop | CPU | FPS (mean±std) | Latency (ms/frame) |
| Dell XPS (2019) | Intel i7-9750H | 29.4 ± 1.2 | 33.1 ± 1.4 |
| Lenovo ThinkPad (2021) | Intel i5-1135G7 | 28.2 ± 1.5 | 35.0 ± 1.9 |
| MacBook Air M1 (2022) | Apple M1 | 31.3 ± 0.9 | 31.8 ± 0.9 |
Table 9: Inference timing across laptop hardware configurations. End-to-end latency and frame rate measured on three CPU-only laptop configurations.
Inference time breakdown per frame: ResNet-50 CNN ≈ 45 ms, facial landmark detection framework landmark extraction ≈ 10–12 ms (overlapping with the CNN on a separate thread), geometric EAR/MAR computation ≈ 2 ms (added sequentially). The 2 ms geometric overhead is thus additive to the CNN inference time, not overlapping. The overall end-to-end pipeline achieves ≈33 ms/frame on the test system.
The 33 ms/frame (~30 FPS) cited in the Abstract and Methods refers to the primary system tested (Intel Core i7-10750H). The 31.8–35.0 ms/frame numbers in Table 9 indicate the results of the same complete fused system but tested with three different systems, which is consistent with the ~33 ms number. All timings were measured with batch size = 1, CPU only, and averaged over 10 runs of 60 s each.
Evaluation of the Heuristic Override
To evaluate the heuristic override, we compared the deep classifier's predictions before and after the EAR/MAR geometric override was applied, restricted to the 104 test samples whose true class was Disengaged. Prior to the override, the deep classifier alone correctly classified 72 of these 104 samples. The geometric heuristic (EAR < 0.25 or MAR > 0.6) triggered on 30 samples in total: 22 were true Disengaged samples that the deep classifier had missed, which the override correctly reclassified as Disengaged, raising the Disengaged-class correct count to 94 (consistent with Table 5); the remaining 8 triggers were false alarms on non-Disengaged samples (e.g., yawning while looking down to take notes during a moment of attentiveness) that the override incorrectly reclassified as Disengaged. This gives the override rule a precision of 0.733 (22 of 30 triggers correct) on this subset. Combining the 22 classifications gained on the Disengaged class with the 8 classifications lost to false alarms elsewhere yields a net gain of 14 correct classifications on the full 400-sample test set, consistent with the 3.58% point improvement (85.42% to 89.00%) attributed to the geometric module in Tables 7 and 8. The 8 false alarms occurred on 8 of the 296 non-Disengaged test samples (2.7%); this represents an acceptable precision-recall trade-off given the classroom cost of failing to detect genuine drowsiness.
Comparison with State-of-the-Art
We want to make clear that we cannot directly compare the results from the systems listed in Table 10 because of differences in the types of datasets used, the definitions of classes, the types of modalities they use, and the ways they were evaluated. Table 10 is intended to illustrate what has been accomplished within the area of classroom-based distance learning systems; it is not meant to represent a ranking of system performance. Engagement Insights has achieved an accuracy of 89.0%, which is higher than the 82% reported for an earlier ResNet-50 approach13 but lower than the accuracy of CSBAM-MobileNet15, which has an accuracy of 91.2% but used a custom classroom dataset under very controlled conditions. IC-BiSGRU-Net16,19 is the leading system with accuracy of 96.21% but requires synchronized audio, video and data logs during operation. Accordingly, while Engagement Insights does not have the overall highest raw accuracy of the other reported systems, it has several unique advantages: four engagement classes, webcam-only input, real-time CPU inference and a fused geometric safety net, making it appropriate for general everyday/classroom applications, without the need for purpose-built hardware and/or facilities.
| Reference | Method | Dataset | Classes | Accuracy | Real-Time |
| Klein & Celik⁵ | CNN behavior | Self-generated | 2 | ~76% | No |
| Pabba & Kumar11 | CNN + FER | Self-generated | 3 levels | 76.9% | No |
| Mahmood et al.13(Behavior) | Self-trained CNN | 100 students | 2 | 83% | No |
| Mahmood et al.13 (Emotion) | ResNet50 TL | 100 students | 4 emotions | 82% | No |
| Radharani et al.15 | CSBAM-MobileNet | Classroom | 5 states | 91.2% | Limited |
| Feng16 | IC-BiSGRU-Net | Multimodal | 3 states | 96.21% | Yes |
| Proposed (Baseline) | ResNet-50, original AffectNet labels | AffectNet (original labels) | 8 emotions | 82.10% | No |
| Proposed (Full System) | ResNet50 + EAR/MAR | Self-generated (AffectNet + DAiSEE, Kaggle) | 4 states | 89.00% | Yes (CPU only) |
Table 10: Comparison with prior work (illustrative; not a direct benchmark).
Caution: The inconsistency of the datasets, classes, modalities and evaluation protocols between datasets prevents any direct comparisons of performance. The results shown only provide context for how we performed compared to one another. The 'Proposed (Baseline)' row shows the performance of a fine-tuned ResNet-50 with respect to the original AffectNet emotion labels (8-class) without the engagement relabeling or geometric module; demonstrating that both the relabeling and hybrid fusion strategies each contributed substantially toward the final 89.00%.
Qualitative Analysis and Sample Outputs
Attentive: Focus: This demonstrates a student having relaxed posture and focused gaze ahead, resulting in the system classifying the behavior with high confidence as ‘Attentive’ indicating the presence of engagement.
Disengaged: This shows a student with eyes shut completely, suggesting that although the student might be engaged internally, the geometric heuristics used in the system (Eye Aspect Ratio) would suggest that they are not. As a result, the classification is made as ‘Disengaged’ with low confidence. This situation represents the case where the physical signs of concentration eyes being shut don’t correspond to the engagement measures of the system.
Distracted: This shows a student with disengaged gaze and neutral facial expression. Even though geometric heuristics are not able to recognize this situation as ‘disengaged’, the ResNet classifier is able to identify some minor clues in the visual data and correctly classify the behavior as ‘Distracted’. This situation is of utmost importance as the deep learning model proved its ability to recognize ‘disengaged’ behavior which was unrecognizable by the existing geometric heuristics.
A very tricky situation for the system occurs with engaged students behaving like disengaged, for example, a person taking notes while looking down and having eyes half-open. In this situation, the Eye Aspect Ratio (EAR) is usually outside the range indicating engagement which leads to wrong classification of the student as ‘disengaged’ due to the usage of geometrical heuristics. This situation has been noted in this paper and with examples of similar instances in the literature9. This finding indicates that systems that rely solely on facial features for classifying engagement will have limits unless (1) head pose, and/or (2) gaze direction are also taken into consideration.
DATA AVAILABILITY: The relabeled engagement dataset (3,600 images created from AffectNet and DAiSEE, and four different labels) is available on Zenodo under the record page: https://zenodo.org/records/22721508.
https://www.kaggle.com/datasets/olgaparfenova/daisee
https://www.kaggle.com/datasets/mstjebashazida/affectnet
Supplementary File 1: Data supporting the findings of this study.Please click here to download this file.
Discussione
Ethical implications and deployment limitations
Prospective deployment of webcam-based engagement monitoring raises important ethical, privacy, and fairness considerations. Any future use of Engagement Insights involving human participants should be conducted with appropriate institutional ethical approval and informed consent, including parental or guardian consent where applicable for minors. To minimize privacy risks, prospective implementations should prioritize local video processing and minimize the retention or transmission of identifiable facial images. Where engagement information is retained, anonymized and aggregated measures should be favored over identifiable individual-level records, consistent with applicable data-protection requirements and data-minimization principles such as those described in the GDPR30. The generalizability and fairness of the system also require further evaluation. The present study did not systematically assess performance across demographic groups, facial morphologies, illumination conditions, or other sources of participant-level variation. Consequently, the robustness of the fixed EAR and MAR thresholds across these conditions remains unknown. Future studies should evaluate performance across diverse participant populations and investigate whether participant-specific calibration or adaptive EAR/MAR thresholds improve robustness. Engagement Insights is intended as an assistive tool for investigating aggregate patterns of student engagement rather than as a system for individual surveillance. Accordingly, individual engagement predictions should not be used independently for consequential decisions involving grades, attendance, discipline, or other high-stakes educational outcomes.
There is a risk of any engagement monitoring tool being utilized for surveillance by people in positions of authority in an institution. We recommend explicit institutional policies regarding the use of these tools to govern their deployment, student involvement in the decision-making process, and complete and regular audits of the usage of these tools. We do not support any use beyond voluntary, consented educational support. There are also technical limitations associated with the engagement detection model trained on AffectNet and DAiSEE datasets (as opposed to actual classroom recordings) and given that the updated labeling strategy reflects educational psychology literature, it is important to note all original labels in those datasets were not developed within an educational context. In the future, data should be recorded from real classroom recordings in order to provide educators with validated records of student engagement. The engagement detection model can only detect facial expression to define engagement. Other measures of behavior to indicate student engagement include gaze direction, body posture, and verbal participation. Computing head pose estimates using facial landmark detection framework pose will enhance the engagement metrics provided by these models.
This evaluation is based on a single re-labeled version of the AffectNet/DAiSEE dataset with only one test split; there has been no cross-dataset validation or leave-subject-out validation. It has been identified that, for future work, cross-dataset validation on separate data collected from real classrooms as well as a leave-subject-out evaluation should be done in addition to the planned data collection in classrooms. The EAR and MAR thresholds determined empirically may differ based upon a student's body structure, ethnicity, and/or lighting. To ensure the accuracy of the tools, it is highly recommended for any deployment that user accounts will be calibrated prior to the start of class using alternate frames. Although the geometric measures of EAR and MAR create high predictions, the geometric measures create 2.7% inaccurately predicted reports for identified disengaged students out of total disengaged students. Future work must target domain adaptation to lighting and camera angles within classrooms. Following the completion of the tasks above, priority actions will include: (1) combining the existing datasets of natural classroom recordings across several locations with validated educator engagement labels; (2) evaluating lightweight Vision Transformers with CNN-Transformer hybrids; (3) adding prosodic audio features and gaze tracking to achieve multimodal fusion; (4) using federated learning methods of collaboration on the use and deployment across institutions while preserving student privacy.
In addition to gaze direction, head orientation, and differences in EAR/MAR thresholds due to culture and ethnicity listed above, other elements might influence effectiveness in practice. Variations in lighting (for instance, strong backlighting or weak illumination) might interfere with location of facial landmark detection framework landmarks, leading to decreased reliability of EAR/MAR heuristic. Obstructions, like glasses (especially special reflective lenses), masks, or even hand placed near face might conceal the landmarks used for calculations made for EAR and MAR or prevent total face region analyzed by ResNet classifier from being visible. For the present moment, the system is developed and tested for the case of one face per frame. It is clear that where classrooms filled with students show up at the same camera, face detection together with the multi-instance tracking stage has to be added. It should be noted that since AffectNet and DAiSEE databases were created from webcam-like recordings, performance might vary in the cases of online learning in comparison to offline classrooms.
This paper develops Engagement Insights, a real-time system for detecting student engagement through the combination of a fine-tuned ResNet classifier with a lightweight geometric heuristic (the EAR and MAR) for calculating whether a student is fully engaged. To create the dataset, images from AffectNet and video frames from DAiSEE were processed and assigned into four classes (Attentive, Confused, Disengaged, Distracted) using a structured annotation process with two trained annotators, which achieved a high level of inter-rater reliability (Cohen's κ = 0.87). The trained model was evaluated on a four-class dataset of 3,600 images and achieved 89.00% accuracy and a macro F1-score of 0.889, with an AUC value for each class ranging from 0.926 to 0.936. The accuracy remained consistent across five separate training runs with a mean accuracy of 89.00% ± 1.2%. Individual design elements contributed to accuracy as follows: ImageNet pre-training, 13 to 17% points; Dropout, 3 percentage points; and the EAR/MAR heuristic, approximately 3.6% points. The Engagement Insights system operates at approximately 30 frames per second (FPS) using only a laptop CPU and webcam. This was validated on three different laptop systems (Table 9), with mean frame rates of 28.2 to 31.3 FPS. The contribution of this paper to research is the integration of the following three known/ established components into a practical low-overhead four-class Engagement monitoring system: ResNet transfer learning; the relabeling datasets of AffectNet+DAiSEE; and the development of the EAR/MAR heuristics.
Dichiarazioni
The authors have no conflicts of interest.
Ringraziamenti
This research was supported by the Princess Nourah bint Abdulrahman University Researchers Supporting Project (PNURSP2026R300), Princess Nourah bint Abdulrahman University, Riyadh, Saudi Arabia.
Materiali
| Nome | Azienda | Numero di catalogo | Commenti |
|---|---|---|---|
| AffectNet (facial expression database) | Mollahosseini, Hasani & Mahoor / University of Denver | http://mohammadmahoor.com/affectnet/ | Source of emotion-labeled images; re-annotated into 4 engagement classes (Table 1); Kaggle mirror used for access: https://www.kaggle.com/datasets/mstjebashazida/affectnet |
| DAiSEE (Dataset for Affective States in E-Environments) | Gupta, Masood & Bhashyam; accessed via Kaggle | https://www.kaggle.com/datasets/olgaparfenova/daisee | Source of video frames; re-annotated into 4 engagement classes (Table 1) |
| ImageNet-pretrained weights (ResNet-18) | torchvision model zoo | https://pytorch.org/vision/stable/models.html | 11.2M parameters; used as initialization prior to fine-tuning Version / Model: IMAGENET1K (exact weights tag to be confirmed by authors) |
| ImageNet-pretrained weights (ResNet-50) | torchvision model zoo | https://pytorch.org/vision/stable/models.html | 23.5M parameters; used as initialization prior to fine-tuning Version / Model: IMAGENET1K (exact weights tag to be confirmed by authors) |
| Inference laptop 2 | Dell | To be confirmed by authors (product URL) | Timing benchmark system (Table 9) Version / Model: Dell XPS (2019), Intel Core i7-9750H |
| Inference laptop 3 | Lenovo | To be confirmed by authors (product URL) | Timing benchmark system (Table 9) Version / Model: Lenovo ThinkPad (2021), Intel Core i5-1135G7 |
| Inference laptop 4 | Apple | To be confirmed by authors (product URL) | Timing benchmark system (Table 9) Version / Model: MacBook Air (2022), Apple M1 |
| MediaPipe (Facial landmark detection framework) | https://developers.google.com/mediapipe | 468-point facial landmark extraction for EAR/MAR geometric module Version / Model: 0.10 | |
| OpenCV | OpenCV.org | https://opencv.org | Real-time video frame capture and processing Version / Model: 4.x |
| Operating system (macOS) | Apple | MacBook Air M1 laptop OS Version / Model: To be confirmed by authors | |
| Operating system (Windows) | Microsoft | Primary benchmarking and Lenovo/Dell laptop OS Version / Model: Windows 11 | |
| Primary inference laptop | Primary CPU-only real-time benchmarking system (Table 3) Version / Model: Intel Core i7-10750H, 16 GB RAM, Windows 11 | ||
| Python (Programming language) | Python Software Foundation | https://www.python.org | Programming language / runtime Version / Model: 3.11 |
| PyTorch (Deep-learning framework) | PyTorch / Linux Foundation | https://pytorch.org | Deep learning framework used for model training and inference Version / Model: 2.x |
| torchvision | PyTorch / Linux Foundation | https://pytorch.org/vision | Source of ImageNet-pretrained ResNet-18/ResNet-50 weights Version / Model: To be confirmed by authors |
| Training GPU | Used for model training only; inference was CPU-only Version / Model: NVIDIA GPU, ≥8 GB VRAM | ||
| Training/inference system RAM | Used across training and primary inference benchmarking Version / Model: 16 GB RAM | ||
| Webcam | Logitech | External USB webcam (not laptop-integrated); sole input sensor for the Engagement Insights system Version / Model: C270 | |
| Source code repository | |||
| Note: Entries marked "to be confirmed by authors" reflect details not specified in the manuscript text (e.g., exact software minor-version numbers, GPU model, webcam model, laptop manufacturer of the primary benchmarking system). Please fill in before submission. |
Riferimenti
- Fredricks JA, Blumenfeld PC, Paris AH. School engagement: Potential of the concept, state of the evidence. Rev Educ Res. 2004;74(1):59-109. doi:10.3102/00346543074001059.
- Exeter DJ, et al. Student engagement in very large classes: The teachers' perspective. Stud High Educ. 2010;35(7):761-775. doi:10.1080/03075070903545058.
- Mollahosseini A, Hasani B, Mahoor MH. AffectNet: A database for facial expression, valence, and arousal computing in the wild. IEEE Trans Affect Comput. 2019;10(1):18-31. doi:10.1109/TAFFC.2017.2740923.
- Altuwairqi K, Jarraya SK, Allinjawi A, Hammami M. Student behavior analysis to measure engagement levels in online learning environments. Signal Image Video Process. 2021;15(7):1387-1395. doi:10.1007/s11760-021-01869-7.
- Klein R, Celik T. The Wits Intelligent Teaching System: Detecting student engagement during lectures using convolutional neural networks. arXiv. [Preprint]. 2021. https://arxiv.org/abs/2105.13794
- Zaletelj J, Košir A. Predicting students' attention in the classroom from Kinect facial and body features. EURASIP J Image Video Process. 2017;2017:80. doi:10.1186/s13640-017-0228-8.
- Pagar V, Bhadane P, Shaligram A. Stress detection using galvanic skin response with affective impact of different climate conditions. J Pharm Negat Results. 2022;13(Special Issue 10):3961-3969. doi:10.47750/pnr.2022.13.S10.482.
- Pan X. Computer vision enhanced emotion recognition system for real time participation analysis in virtual English classroom. Discov Artif Intell. 2026;6:447. doi:10.1007/s44163-026-01193-4.
- Qarbal I, Sael N, Ouahabi S. Student's engagement detection based on computer vision: A systematic literature review. IEEE Access. 2025;13:140519-140545.
- Zhu X, Huang L. Data augmented hybrid GCN transformer for student engagement recognition in E-learning. Alexandria Eng J. 2026;141:14-23. doi:10.1016/j.aej.2026.02.015.
- Pabba C, Kumar P. An intelligent system for monitoring students' engagement in large classroom teaching through facial expression recognition. Expert Syst. 2022;39(1):e12839. doi:10.1111/exsy.12839.
- Ashwin TS, Guddeti RMR. Unobtrusive behavioral analysis of students in classroom environment using non-verbal cues. IEEE Access. 2019;7:150693-150709. doi:10.1109/ACCESS.2019.2947519.
- Mahmood N, et al. Measuring student engagement through behavioral and emotional features using deep-learning models. Algorithms. 2024;17(10):458. doi:10.3390/a17100458.
- Jobbid FZ, Berrahou A, Berbia H. A deep visual approach to student engagement analysis using affective and behavioral cues. Eng Technol Appl Sci Res. 2026;16(1):30913-30918. doi:10.48084/etasr.13816.
- Radharani S, Sistla V, Kolli VKK. CSBAM-MobileNet: A lightweight attention-enhanced deep learning model for student attentiveness classification. Eng Sci Technol Int J. 2026;77:102326. doi:10.1016/j.jestch.2026.102326.
- Feng F. Deep learning-based model for analyzing student engagement in activities. Sci Rep. 2026;16:2552. doi:10.1038/s41598-025-32521-w.
- Gopinathan N R, Sherly E. Human pose estimation based engagement detection in E-learning: A hybrid approach. Discov Artif Intell. 2026;6:428. doi:10.1007/s44163-026-01104-7.
- Soukupová T, Čech J. Real-time eye blink detection using facial landmarks [conference paper]. Presented at: 21st Computer Vision Winter Workshop; Rimske Toplice, Slovenia; 2016. https://vision.fe.uni-lj.si/cvww2016/proceedings/papers/05.pdf Machine Vision Laboratory
- Wei P, et al. Yawning detection for monitoring driver drowsiness based on mouth aspect ratio [conference paper]. Presented at: 2018 IEEE International Conference on Intelligent Systems and Knowledge Engineering; 2018. p. 1-6.
- Sun M, Feng S. Deep learning for student engagement analysis in educational psychology. Front Psychol. 2026;17:1764399. doi:10.3389/fpsyg.2026.1764399.
- Fard AP, Hosseini MM, Sweeny TD, Mahoor MH. AffectNet+: A database for enhancing facial expression recognition with soft-labels. arXiv. [Preprint]. 2024. arXiv:2410.22506. https://arxiv.org/abs/2410.22506 arXiv
- Gupta A, D'Cunha A, Awasthi K, Balasubramanian V. DAiSEE: Towards user engagement recognition in the wild. arXiv. [Preprint]. 2016. arXiv:1609.01885. https://arxiv.org/abs/1609.01885 DOI
- He K, Zhang X, Ren S, Sun J. Deep residual learning for image recognition [conference paper]. Presented at: IEEE Conference on Computer Vision and Pattern Recognition; Las Vegas, NV, USA; 2016. p. 770-778.
- Kartynnik Y, Ablavatski A, Grishchenko I, Grundmann M. Real-time facial surface geometry from monocular video on mobile GPUs [conference paper]. Presented at: Third Workshop on Computer Vision for AR/VR, IEEE Conference on Computer Vision and Pattern Recognition; Long Beach, CA, USA; 2019. https://arxiv.org/abs/1907.06724 Google Research
- Apicella A, et al. EEG-based measurement system for monitoring student engagement in learning 4.0. Sci Rep. 2022;12:5857. doi:10.1038/s41598-022-09578-y.
- Van Couvering E. Faces and charts: Platform strategies for visualising the audience, the case of Facebook. Inf Commun Soc. 2022;25(11):1524-1541. doi:10.1080/1369118X.2021.1874034.
- Dirican AC, Göktürk M. Psychophysiological measures of human cognitive states applied in human computer interaction. Procedia Comput Sci. 2011;3:1361-1367. doi:10.1016/j.procs.2011.01.016.
- Gervasi R, Capponi M, Mastrogiacomo L, Franceschini F. Analyzing psychophysical state and cognitive performance in human-robot collaboration for repetitive assembly processes. Prod Eng Res Devel. 2024;18(1):19-33. doi:10.1007/s11740-023-01230-6.
- Kingma DP, Ba J. Adam: A method for stochastic optimization [conference paper]. Presented at: International Conference on Learning Representations; 2015. https://arxiv.org/abs/1412.6980 ML Anthology
- European Parliament and Council of the European Union. Regulation (EU) 2016/679—General Data Protection Regulation. Off J Eur Union. 2016;L119:1-88.