Questo studio retrospettivo monocentrico analizza isolati di Pseudomonas aeruginosa (PA) privi di duplicati dal 2023 al 2025 e ne esamina le tendenze di resistenza prima e dopo un intervento di gestione degli antimicrobici in quattro componenti nel Resp-TB.
Articolo di ricerca
Tendenze nella resistenza di Pseudomonas aeruginosa dopo un intervento di gestione degli antimicrobici in quattro dimensioni
* These authors contributed equally
In questo articolo
Sommario
Abstract
Questo studio retrospettivo monocentrico ha analizzato isolati di Pseudomonas aeruginosa privi di duplicati raccolti presso l'Ospedale Municipale per le Malattie Infettive di Huaian dal 2023 al 2025. Sono stati inclusi un totale di 121 isolati unici, di cui l'83,5% provenienti da espettorato. I test di suscettibilità agli antimicrobici (AST) sono stati eseguiti mediante un sistema automatizzato di microbiologia e i risultati delle concentrazioni minime inibitorie (MIC) sono stati interpretati secondo il documento CLSI M100, 33ª edizione. All'inizio del 2024, è stata attuata un'intervento mirato di gestione degli antimicrobici basato su un collegamento quadridimensionale nel Dipartimento di Malattie Respiratorie e Tubercolosi (Resp-TB) (n = 97), costituito da: (1) sorveglianza dinamica della resistenza agli antimicrobici con feedback trimestrali; (2) prescrizione di antimicrobici stratificata per rischio basata sui dati locali di suscettibilità; (3) protocolli standardizzati per la raccolta dei campioni; e (4) misure rafforzate di prevenzione e controllo delle infezioni. Nel reparto Resp-TB, i tassi complessivi di resistenza sono stati del 74,19% nel 2023, dell'81,63% nel 2024 e dell'82,93% nel 2025, senza una riduzione significativa dopo l'intervento (p ≈ 0,37). Nel 2025, la resistenza alla tobramicina era di 0/41 (0,00%), alla cefepima di 1/41 (2,44%) e al pipercillina-tazobactam di 0/41 (0,00%); la resistenza alla levofloxacina ha raggiunto 15/41 (36,59%). La resistenza al trimetoprim-sulfametossazolo è rimasta elevata per tutto il periodo dello studio. Questi risultati indicano una persistente resistenza agli antimicrobici nel reparto Resp-TB dopo l'attuazione dell'intervento, mentre la resistenza ad alcuni agenti selezionati, tra cui tobramicina, cefepima e pipercillina-tazobactam, è rimasta bassa nel 2025.
Introduzione
Pseudomonas aeruginosa (PA) è una delle principali cause di infezioni nosocomiali ed è uno dei bacilli Gram-negativi non fermentanti più comunemente isolati nella pratica clinica1. La sua resistenza intrinseca e acquisita a numerosi antimicrobici è associata a una bassa permeabilità della membrana esterna, a un'eccessiva espressione delle pompe di efflusso e alla produzione di enzimi degradanti i farmaci. Sotto pressione selettiva degli antibiotici, PA può acquisire facilmente nuovi fenotipi resistenti2,3. Negli ultimi anni, l'aumento della diffusione di ceppi di PA multiresistenti (MDR) ed estensivamente resistenti (XDR) ha ridotto le opzioni terapeutiche ed è stato associato a un prolungamento del ricovero ospedaliero e a un aumento della mortalità4,5,6,7. L'approccio One Health, che riconosce l'interconnessione tra la salute umana, animale e ambientale, è sempre più raccomandato come un quadro importante per la prevenzione e il controllo della resistenza agli antimicrobici4,6. In questo contesto, i dati locali di sorveglianza sulla resistenza agli antimicrobici, come le tendenze della resistenza di PA riportate in questo studio, possono contribuire a orientare le strategie di gestione responsabile degli antimicrobici e di controllo delle infezioni.
Queste sfide sono particolarmente rilevanti negli ospedali specializzati nelle malattie infettive. I pazienti affetti da tubercolosi spesso ricevono trattamenti antitubercolari a lungo termine che possono includere fluorochinoloni, aumentando il rischio di resistenza crociata ad agenti come la levofloxacina e complicando la gestione degli isolati di PA ottenuti contemporaneamente8,9. Inoltre, lo stato di immunodepressione e le degenze ospedaliere prolungate in questa popolazione di pazienti possono aumentare la suscettibilità agli isolati di PA multiresistenti e portare a esiti clinici peggiori10,11.
Molti studi di sorveglianza precedenti hanno utilizzato conteggi totali di isolati senza tenere conto del potenziale bias causato da campionamenti ripetuti dello stesso paziente. Sia il Sistema Globale di Sorveglianza sulla Resistenza agli Antimicrobici dell'Organizzazione Mondiale della Sanità (WHO GLASS) che l'Istituto per gli Standard Clinici e di Laboratorio (CLSI) raccomandano strategie di de-duplicazione per migliorare l'accuratezza dei dati, come mantenere solo il primo isolato per paziente per ogni episodio di infezione12.
Sebbene la resistenza antimicrobica del PA sia un problema globale ben riconosciuto, le evidenze riguardo interventi mirati di gestione prudente degli antimicrobici nei Resp-TB specializzati rimangono limitate. La maggior parte degli studi esistenti si concentra sulle terapie intensive o sui reparti respiratori generali, lasciando un vuoto nella comprensione di come interventi strutturati e multicomponente si comportino in contesti con elevata prevalenza di tubercolosi e complesse storie di esposizione agli antibiotici. Questo studio retrospettivo monocentrico ha analizzato isolati di PA privi di duplicati raccolti presso l'Ospedale Municipale per le Malattie Infettive di Huaian dal 2023 al 2025, con particolare attenzione al Resp-TB. Abbiamo ipotizzato che sarebbero state osservate modifiche nei profili di resistenza antimicrobica del PA dopo l'attuazione di un intervento mirato di gestione prudente degli antimicrobici basato su un collegamento quadridimensionale, comprendente sorveglianza dinamica, prescrizione stratificata per rischio, raccolta standardizzata di campioni e potenziamento della prevenzione e del controllo delle infezioni. Lo studio mirava a descrivere le tendenze locali di resistenza e a valutare se tali dati potessero sostenere le pratiche di gestione prudente degli antimicrobici e di controllo delle infezioni in questo ospedale.
Protocollo
Le informazioni sui campioni per gli isolati di Pseudomonas aeruginosa raccolti tra il 2023 e il 2025 sono state ottenute dal database di laboratorio dell'Ospedale Popolare N. 4 di Huai’an. Tutti i campioni sono stati anonimizzati prima dell'analisi e lavorati in conformità con i protocolli approvati dal Comitato Etico dell'Ospedale Popolare N. 4 di Huai’an (Numero di approvazione: HASY2024011).
Soggetti dello studio e criteri di inclusione
Questo studio retrospettivo monocentrico ha incluso isolati clinici di Pseudomonas aeruginosa (PA) raccolti dal Laboratorio di Microbiologia dell'Ospedale per Malattie Infettive di Huaian tra gennaio 2023 e dicembre 2025. Gli isolati erano idonei se identificati in modo definitivo come PA mediante un sistema microbiologico automatizzato con una scheda di identificazione GN e se possedevano risultati completi e leggibili dei test di sensibilità agli antimicrobici (AST). I campioni provenivano principalmente da sorgenti respiratorie, inclusi espettorato e liquido di lavaggio broncoalveolare, ma sono stati inclusi anche isolati provenienti da altri siti.
La procedura di de-duplicazione ha seguito un rigoroso principio di "un paziente–un isolato per anno solare" ed è stata applicata in due fasi. Prima, all'interno di ciascun anno solare, quando venivano identificati più isolati di PA dallo stesso paziente, abbinati per nome, veniva conservato solo il primo isolato clinicamente significativo ai fini dell'analisi di quell'anno. Secondo, in anni solari diversi, un paziente con ricoveri separati e corrispondenti isolati di PA in più di un anno veniva considerato un'osservazione indipendente in ciascun coorte annuale. Pertanto, lo stesso paziente poteva teoricamente essere incluso in più di una coorte annuale. Questa regola è conforme al principio di de-duplicazione WHO GLASS/CLSI13.
I criteri di esclusione includevano isolati ripetuti dallo stesso paziente entro lo stesso anno solare, informazioni del paziente incomplete e risultati AST tecnicamente illeggibili, come una crescita anomala nei pozzetti di controllo positivo. Gli isolati con pannelli incompleti di suscettibilità antimicrobica sono stati esclusi dalle corrispondenti analisi specifiche per antibiotico, e il numero effettivo di isolati testati (n) è stato riportato per ciascun antibiotico. Un totale di 121 pazienti con 121 isolati di PA è stato incluso: 31 nel 2023, 49 nel 2024 e 41 nel 2025. Figura 1 mostra lo schema del disegno dello studio.
Per i campioni respiratori, è stata applicata la valutazione standard della qualità del laboratorio. I campioni di espettorato sono stati valutati secondo i criteri di Murray-Washington, che richiedono <10 cellule epiteliali squamose e >25 leucociti polimorfonucleati per campo a basso ingrandimento per garantire la validità del campione. Tutti gli isolati sono stati ottenuti da campioni clinici inviati per scopi diagnostici di routine da pazienti con sospetta infezione. Tuttavia, a causa del disegno dello studio retrospettivo e della mancanza di dati sistematici di correlazione clinica, inclusi segni e sintomi, reperti radiografici, marcatori infiammatori e risposta al trattamento, non è stata effettuata una distinzione formale tra vera infezione e colonizzazione per singoli isolati. Pertanto, il termine neutro «isolati clinici» viene utilizzato in tutto il testo per indicare microrganismi con potenziale rilevanza clinica, senza affermare che ogni isolato rappresenti necessariamente una vera infezione.
Raggruppamento dei dati
I dati sono stati stratificati per anno, dipartimento e origine del campione. Per il confronto longitudinale, gli isolati sono stati raggruppati per anno: 2023, 2024 e 2025. Per l'analisi per dipartimento, gli isolati sono stati suddivisi come segue: Resp-TB (n = 97/121, 80,17%), Dipartimento di Gastroenterologia ed Epatologia (n = 12/121, 9,92%), Dipartimento di Malattie Infettive (n = 5/121, 4,13%) e altri dipartimenti (n = 7/121, 5,79%). Il gruppo Resp-TB è stato la coorte principale di osservazione. Le fonti dei campioni sono state raggruppate in espettorato, liquido di lavaggio broncoalveolare e altre fonti, al fine di quantificare il contributo dei campioni respiratori.
Coltura microbica, identificazione e test di suscettibilità agli antimicrobici
I ceppi sono stati coltivati su agar sangue di pecora al 5%, agar MacConkey e agar soia triptica con bacitracina a 35–37 °C per 18–24 h. L'identificazione presuntiva si è basata sulla morfologia delle colonie e su un test ossidasi positivo. L'identificazione definitiva e il test di suscettibilità agli antimicrobici (AST) sono stati eseguiti utilizzando un sistema automatizzato di microbiologia con schede per l'identificazione GN e AST-N399. Le sospensioni batteriche sono state preparate a uno standard di McFarland 0,50–0,63 in soluzione salina sterile, seguendo le istruzioni del produttore. Sono stati testati complessivamente 10 agenti antimicrobici: tobramicina, cefepime, piperacillina-tazobactam, amikacina, meropenem, imipenem, gentamicina, cefazolina, levofloxacina e trimetoprim-sulfametossazolo. Questi agenti sono stati selezionati in base al pannello AST di routine del laboratorio, agli agenti comunemente utilizzati per le infezioni da P. aeruginosa nell'istituzione e agli agenti considerati nell'intervento di stewardship antimicrobico quadridimensionale. I risultati sono stati interpretati secondo le linee guida CLSI M100, 33ª edizione14. I risultati intermedi sono stati classificati come resistenti quando sono stati calcolati i tassi di resistenza.
Controllo di qualità
Per garantire riproducibilità e accuratezza, è stato eseguito un controllo di qualità giornaliero dell'AST utilizzando il ceppo di riferimento Pseudomonas aeruginosa ATCC 27853. Il ceppo è stato testato contro lo stesso pannello antimicrobico per confermare che le concentrazioni minime inibitorie (MIC) fossero entro i limiti raccomandati dal CLSI. Se i risultati del controllo di qualità risultavano al di fuori dei limiti accettabili, il lotto di test veniva scartato e ripetuto solo dopo la ricalibrazione del sistema microbiologico automatico e la verifica dell'integrità dei reagenti.
Intervento mirato a quattro dimensioni nel Resp-TB
A partire da gennaio 2024, è stata attuata nella Resp-TB un'intervento mirato di gestione prudente degli antimicrobici, denominato "Collegamento in Quattro Dimensioni". L'intervento è stato coordinato dal direttore del dipartimento, da medici specializzati in malattie infettive, farmacisti clinici e personale dedicato alla prevenzione e al controllo delle infezioni (IPC). Esso comprendeva quattro componenti.
In primo luogo, è stata implementata una sorveglianza dinamica della resistenza antimicrobica con relativa retroazione. È stato istituito un sistema di allarme precoce a livello dipartimentale per la resistenza di PA e le variazioni nei profili di resistenza sono state sintetizzate in rapporti trimestrali al fine di orientare le decisioni relative alla gestione prudente degli antimicrobici. In secondo luogo, è stata attuata una gestione prudente degli antimicrobici stratificata per rischio, basata sui dati di suscettibilità locali. Il percorso gerarchico per la prescrizione privilegiava agenti con tassi di resistenza costantemente bassi, tra cui tobramicina e cefepime, come opzioni empiriche; raccomandava cautela nell’uso di agenti con resistenza in aumento o elevata, come la levofloxacina; ed escludeva il trimetoprim-sulfametossazolo, che presenta una scarsa attività intrinseca nei confronti di PA. Queste misure si basavano sui dati locali di AST e sulle politiche istituzionali di gestione prudente degli antimicrobici, senza costituire linee guida cliniche formali.
Terzo, è stata standardizzata la raccolta dei campioni respiratori. Ai pazienti è stato chiesto di effettuare un respiro profondo, di schiarirsi la gola e di raccogliere l'espettorato secondo il protocollo di laboratorio. Questa procedura aveva lo scopo di ridurre la contaminazione orofaringea e migliorare l'affidabilità dei test di suscettibilità per i campioni delle vie respiratorie inferiori. Quarto, sono state rafforzate le misure di prevenzione e controllo delle infezioni. Tali misure includevano controlli regolari della compliance all'igiene delle mani prima e dopo il contatto con i pazienti, procedure rigorose per la manipolazione e lo smaltimento delle secrezioni respiratorie e disinfezioni ambientali programmate per ridurre il rischio di diffusione nosocomiale di PA. Ai fini della valutazione, il periodo dello studio è stato suddiviso in un periodo preintervento (gennaio 2023 - dicembre 2023) e un periodo postintervento (gennaio 2024 - dicembre 2025).
Analisi statistica
I dati sono stati inseriti due volte e verificati. I tassi di resistenza sono stati espressi come percentuali con intervalli di confidenza al 95% (IC). I confronti annuali, per reparto e tra pre- e post-intervento sono stati analizzati mediante il test χ2 di Pearson; il test esatto di Fisher è stato utilizzato quando le frequenze attese erano <5. Per l'analisi delle tendenze è stato impiegato il test χ2 di Cochran-Armitage. I valori p aggiustati sono riportati laddove applicabili. Per il confronto principale tra il 2023 e il 2025 relativamente ai 10 antibiotici, è stata applicata la correzione di Bonferroni per aggiustare la soglia di significatività (α = 0,05/10 = 0,005). Un valore p a due code < 0,05 è stato considerato statisticamente significativo per i confronti non aggiustati; i valori p aggiustati sono riportati laddove applicabili. I dettagli del software sono forniti nella Tabella dei Materiali.
Risultati
Overall distribution of strains and patients
Based on the study criteria and grouping strategy described above, a total of 121 non-duplicate PA isolates from 121 patients were included in the analysis (Figure 1). The annual distribution was 31 isolates in 2023, 49 in 2024, and 41 in 2025 (Table 1). Sputum was the main specimen source, accounting for 83.5% of all samples (Figure 2). The Resp-TB contributed the largest proportion of isolates (n = 97/121, 80.17%), followed by the Digestive and Hepatology Department (n = 12/121, 9.92%), the Infectious Diseases Department (n = 5/121, 4.13%), and other departments (n = 7/121, 5.79%) (Table 2 and Figure 2).
The proportion of sputum specimens remained relatively stable across the study period: 82.9% in 2023, 83.5% in 2024, and 83.0% in 2025. Bronchoalveolar lavage fluid and protected specimen brush samples together accounted for approximately 7.6% of specimens, while blood, urine, and other sample types accounted for the remaining 8.9%. These findings indicate that PA isolates in this hospital were concentrated mainly in respiratory specimens.
Overall, PA isolates were concentrated among patients from the Resp-TB and among respiratory specimens. This distribution supported selecting the Resp-TB as the primary cohort for evaluating the targeted intervention described above.
Annual trends in antimicrobial resistance of Pseudomonas aeruginosa across the hospital
Based on the AST protocol described above, annual antimicrobial resistance patterns for PA are summarized in Table 1 and Figure 3. Because susceptibility and intermediate rates in Table 1 are weighted summary measures, formal comparisons were performed at the individual-antimicrobial level. The resulting p-values are presented in Table 3 for the 2023 versus 2025 comparison. Pearson’s χ2 test or Fisher’s exact test showed no statistically significant differences after Bonferroni correction (all adjusted p > 0.05; Table 3).
The weighted resistance rate was 4.25 percentage points lower in 2025 than in 2023, while the weighted susceptibility rate increased by 4.25 percentage points over the same period. However, these summary measures should be interpreted descriptively because they aggregate results across multiple antimicrobial agents. Antibiotic-specific trends are therefore reported separately in Table 3.
The intermediate rate increased slightly in 2025 after a lower value in 2024. This change should be interpreted cautiously because intermediate results may vary by antimicrobial agent and were categorized as resistant for resistance-rate calculations. Overall, PA resistance remained a surveillance concern throughout the study period, underscoring the need for ongoing antimicrobial stewardship and infection prevention and control.
Resistance profiles of major antibiotics
Building on the AST data described above, divergent resistance patterns among the 10 tested antimicrobial agents were observed over the three-year period, as detailed in Table 3 and illustrated in Figure 4 and Figure 5. Four descriptive resistance patterns were identified.
First, resistance to tobramycin, cefepime, and piperacillin-tazobactam decreased over the study period. Tobramycin resistance decreased from 3.23% in 2023 to 0.00% in 2025, cefepime resistance decreased from 12.90% to 2.44%, and piperacillin-tazobactam resistance decreased from 9.68% to 0.00%. By 2025, all three agents showed low resistance rates in this dataset (Figure 4). Second, amikacin resistance remained low, fluctuating between 0.00% and 4.08% over the three years. Third, carbapenem resistance increased in 2024 and then decreased in 2025. Meropenem resistance increased from 9.68% in 2023 to 18.37% in 2024, then decreased to 12.20% in 2025. Imipenem resistance increased from 12.90% to 24.49%, then decreased to 17.07%. These findings indicate a transient peak in carbapenem resistance in 2024. Fourth, fluoroquinolone resistance remained a concern. Ciprofloxacin resistance remained high throughout the study period, and levofloxacin resistance increased from 16.13% in 2023 to 36.59% in 2025. Trimethoprim-sulfamethoxazole resistance remained consistently high (>79%) across all three years. Annual comparisons of resistance rates for individual antibiotics are illustrated in Figure 5.
Overall, these findings show heterogeneous antibiotic-specific resistance patterns in PA isolates at this institution. The increase in levofloxacin resistance and the persistently high trimethoprim-sulfamethoxazole resistance support continued antimicrobial stewardship monitoring.
Comparative analysis of antimicrobial resistance rates across three key departments
Based on the departmental stratification described above, resistance rates across the three main departments are summarized in Table 2 and Figure 6. The Resp-TB was the primary target of the intervention and had a high resistance rate throughout the study period: 74.19% in 2023 (23/31, 95% CI: 55.39–85.78%), 81.63% in 2024 (40/49, 95% CI: 67.98–89.76%), and 82.93% in 2025 (34/41, 95% CI: 67.94–91.18%). No statistically significant reduction was observed (Cochran–Armitage linear trend test, Z = 0.89, p ≈ 0.37; Fisher’s exact test for 2023 versus 2025, p ≈ 0.37). These findings do not support a clear temporal association between the intervention and a reduction in departmental resistance.
The Infectious Diseases Department had a few isolates across the study period (n = 5). The corresponding rates were 6.45% in 2023 (2/31), 4.08% in 2024 (2/49), and 2.44% in 2025 (1/41). Because of the small number of isolates, these results should be interpreted cautiously and are not suitable for robust trend analysis.
The Digestive and Hepatology Department also had a small number of isolates (n = 12). The reported rates were 0.00% in 2023, 55.56% in 2024, and 0.00% in 2025. This fluctuation likely reflects the small annual sample sizes, in which a small number of resistant isolates can strongly influence percentage estimates.
Overall, the Resp-TB accounted for most PA isolates and maintained high rates of resistance throughout the study period. The smaller departmental groups had limited sample sizes, reducing the reliability of cross-departmental comparisons. Annual departmental trends are shown in Figure 6.
Targeted intervention in the Resp-TB
Following implementation of the four-dimensional linkage-targeted intervention in January 2024, the departmental proportion reported for the Resp-TB did not decline as hypothesized (Figure 6). The reported value was 74.19% in 2023, 81.63% in 2024, and 82.93% in 2025, with no statistically significant reduction (Cochran–Armitage linear trend test, Z = 0.89, p ≈ 0.37; Fisher’s exact test for 2023 versus 2025, p ≈ 0.37; Table 2 and Figure 6). For descriptive context, the annual departmental values were plotted alongside Chinese multicenter and international reference values from previous surveillance reports (Figure 7)15,16. These external reference values are presented solely to provide contextual information and are not directly comparable with the present dataset because the studies differed in their definitions of resistance, patient populations, sampling strategies, isolate de-duplication procedures, and antimicrobial panels. Therefore, Figure 7 should not be interpreted as demonstrating a significant reduction, cumulative reduction, convergence toward an external benchmark, achievement of a target, or effectiveness of the intervention.
Antibiotic-specific patterns varied. Tobramycin resistance remained low, with no resistant isolates detected in 2025. Cefepime resistance decreased from 12.90% in 2023 to 2.44% in 2025. In contrast, levofloxacin resistance increased from 5/31 (16.13%) in 2023 to 11/49 (22.45%) in 2024 and 15/41 (36.59%) in 2025, despite the restriction of levofloxacin use as part of the intervention. This increase may reflect cross-selective pressure from fluoroquinolone-containing antituberculosis regimens, although the absence of prescription data limits direct assessment of the intervention’s effect on prescribing behavior. Trimethoprim-sulfamethoxazole resistance remained consistently high: 96.77% in 2023, 79.59% in 2024, and 92.68% in 2025.
Overall, the annual departmental proportion in the Resp-TB remained high throughout the study period, and the available data did not demonstrate a clear intervention-associated reduction. Nevertheless, the antibiotic-specific findings—including the low resistance to tobramycin and cefepime and the increasing resistance to levofloxacin—may inform continued local antimicrobial resistance surveillance and stewardship monitoring. Because this study lacked patient-level antimicrobial consumption data, contemporaneous control departments, and adjustment for changes in patient case mix, no causal relationship between the four-dimensional intervention and the observed resistance patterns should be inferred.
Summary of findings in relation to the study hypothesis
This study hypothesized that implementation of the four-dimensional linkage-targeted antimicrobial stewardship intervention would be associated with reduced Pseudomonas aeruginosa resistance in the Resp-TB. However, the departmental resistance rate did not decline after intervention: 74.19% in 2023, 81.63% in 2024, and 82.93% in 2025, with no statistically significant reduction (Cochran–Armitage linear trend test, Z = 0.89,p ≈ 0.37; Table 2 and Figure 6). These findings do not support the study hypothesis at the departmental level. Antibiotic-specific trends varied, with low resistance to tobramycin, cefepime, and piperacillin-tazobactam by 2025, while levofloxacin resistance increased to 36.59% (Table 3, Figure 4, and Figure 5).
DATA AVAILABILITY:
The raw datasets underlying all figures and tables in this article are provided as Supplemental Table S1, Supplemental Table S2, and Supplemental Table S3.
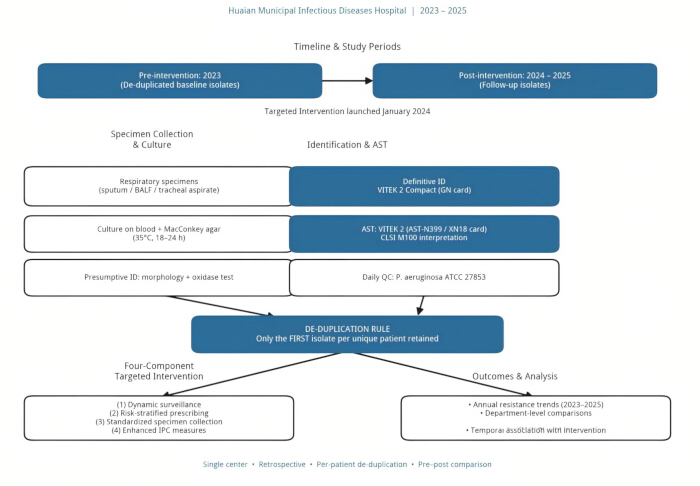
Figure 1. Overall study design schematic. The schematic summarizes specimen collection, culture, bacterial identification, antimicrobial susceptibility testing, quality control, de-duplication, intervention timing, and outcome assessment in this single-center retrospective surveillance study. Respiratory and other clinical specimens were cultured, presumptive identification was based on colony morphology and oxidase testing, and definitive identification and AST were performed using an automated microbiology system. MIC results were interpreted according to CLSI M100, 33rd edition. Daily quality control used Pseudomonas aeruginosa ATCC 27853. A one-patient–one-isolate-per-calendar-year deduplication rule was applied. The pre-intervention period was 2023, and the post-intervention period was 2024–2025. Abbreviations: AST = antimicrobial susceptibility testing; CLSI = Clinical and Laboratory Standards Institute; MIC = minimum inhibitory concentration. Please click here to view a larger version of this figure.
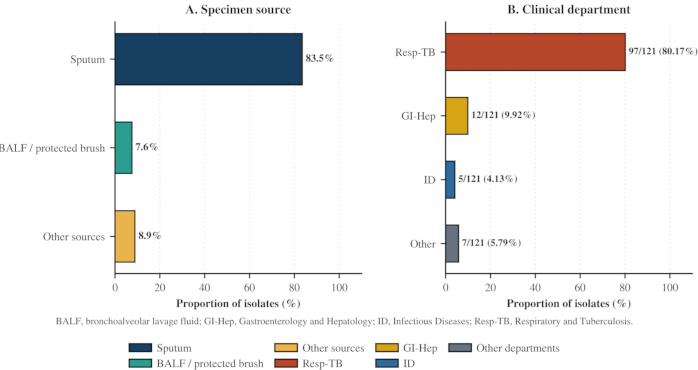
Figure 2. Composition of Pseudomonas aeruginosa isolates by specimen type and department, 2023–2025. The figure shows the distribution of isolates by specimen source and clinical department. (A) Number and proportion of isolates by specimen source, including sputum, BALF, blood, urine, and other sources. (B) Number and proportion of isolates by clinical department. Abbreviations: BALF = bronchoalveolar lavage fluid; GI-Hep = Digestive and Hepatology Department; ID = Infectious Diseases Department; Resp-TB = Respiratory and Tuberculosis Department. Please click here to view a larger version of this figure.
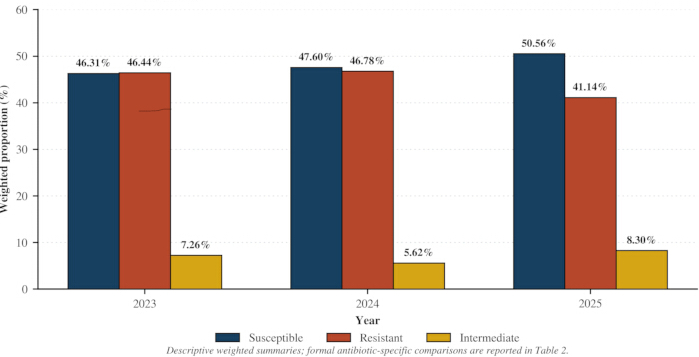
Figure 3. Annual antimicrobial susceptibility profile of Pseudomonas aeruginosa isolates, 2023–2025. Bars show the annual proportions of resistant, susceptible, and intermediate results across the tested antimicrobial agents. Formal antibiotic-specific statistical comparisons are provided in Table 2. Abbreviations: I = intermediate; R = resistant; S = susceptible. Please click here to view a larger version of this figure.
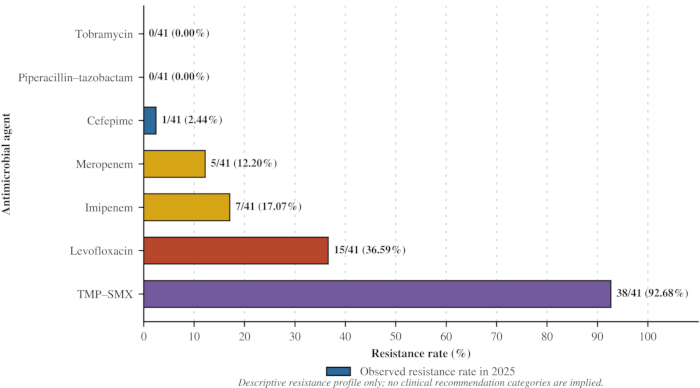
Figure 4. Resistance rates of Pseudomonas aeruginosa to major antimicrobial agents in 2025. Antibiotics are ranked by resistance rate in 2025. The dashed reference line indicates the weighted summary resistance rate for the tested antimicrobial agents. No clinical recommendation categories are implied. Please click here to view a larger version of this figure.
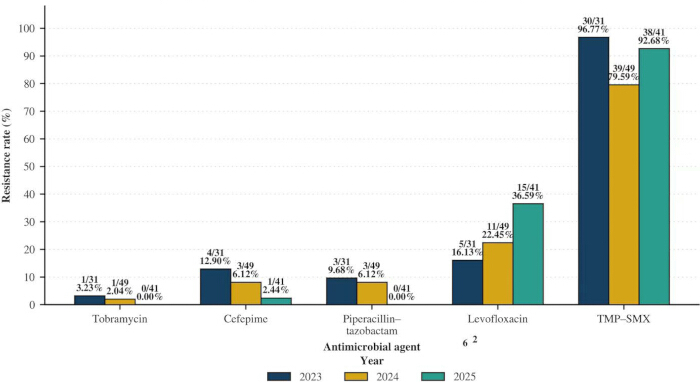
Figure 5. Annual resistance rates of Pseudomonas aeruginosa to five selected antimicrobial agents, 2023–2025. Bars show annual resistance rates for tobramycin, cefepime, piperacillin-tazobactam, levofloxacin, and trimethoprim-sulfamethoxazole. Formal statistical comparisons are provided in Table 2 and described in the Results section. Abbreviation: PA = Pseudomonas aeruginosa. Please click here to view a larger version of this figure.
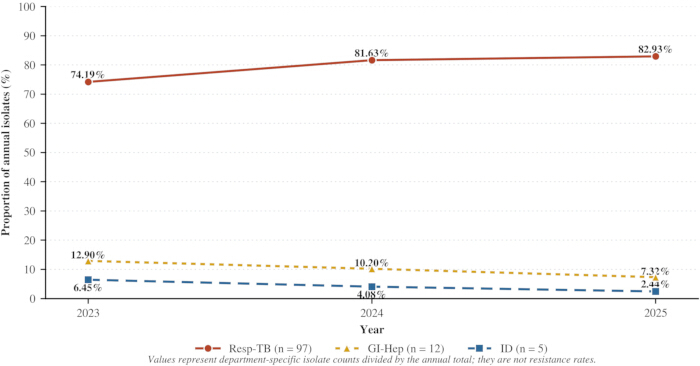
Figure 6. Annual departmental distribution of Pseudomonas aeruginosa isolates, 2023–2025. The figure compares the annual proportion of isolates contributed by three clinical departments. The red solid line denotes the Resp-TB, the intervention target department. The blue dashed line denotes the Infectious Diseases Department. The yellow dotted line denotes the Digestive and Hepatology Department. Abbreviations: ID = Infectious Diseases Department; Resp-TB = Respiratory and Tuberculosis Department. Please click here to view a larger version of this figure.
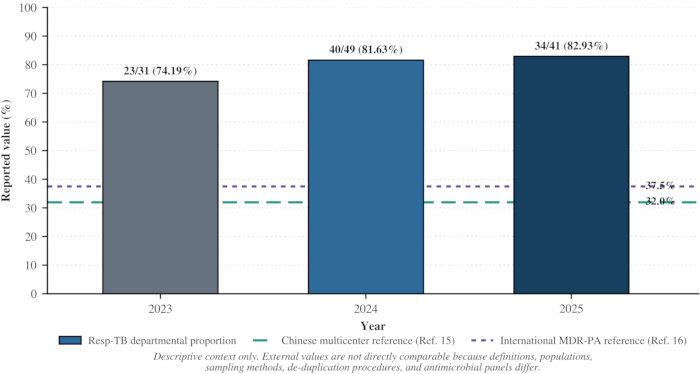
Figure 7. Descriptive presentation of annual departmental values alongside external antimicrobial-resistance reference values. The figure descriptively presents the annual values reported for the Resp-TB together with reference values from a Chinese multicenter surveillance study and an international tertiary-hospital study15,16. The red solid line denotes the annual value for the Resp-TB. The gray bar represents 2023, whereas the blue bars represent 2024 and 2025. The green dashed line denotes the Chinese multicenter reference value, and the purple dotted line denotes the international reference value. These external reference values are presented solely for descriptive context and are not directly comparable with the present data because the underlying studies differed in their definitions of resistance, study populations, sampling strategies, isolate de-duplication procedures, and antimicrobial panels. Accordingly, the figure should not be interpreted as demonstrating a statistically significant reduction, cumulative reduction, convergence toward an external benchmark, achievement of a predetermined target, or effectiveness of the intervention. Abbreviations: PA = Pseudomonas aeruginosa; Resp-TB = Respiratory and Tuberculosis Department. Please click here to view a larger version of this figure.
| Indicator | 2023 (n=31) | 2024 (n=49) | 2025 (n=41) | Trend |
| Numbers of patients/isolates | 31/31 | 49/49 | 41/41 | Initial increase followed by a decrease |
| Overall susceptibility rate (%) | 46.31 | 47.6 | 50.56 | Continuously increase |
| Intermediate rate (%) | 7.26 | 5.62 | 8.3 | Slight fluctuation |
| Resistant rate (%) | 46.44% | 46.78% | 41.14% | Slight fluctuation |
Table 1: Overall antimicrobial susceptibility profile of non-duplicate Pseudomonas aeruginosa isolates, 2023–2025. The table summarizes annual weighted percentages of resistant, susceptible, and intermediate AST results across the tested antimicrobial agents. These summary percentages are descriptive and are not derived from a single binomial denominator; therefore, Pearson’s χ2 p-values are not applicable at this summary level. Antibiotic-specific statistical comparisons are provided in Table 2. Abbreviations: AST = antimicrobial susceptibility testing; I = intermediate; R = resistant; S = susceptible. These are descriptive weighted summary measures, not patient-level resistance rates.
| Department | 2023 (N=31) | 2024 (N=49) | 2025 (N=41) | Total (N=121) |
| Respiratory-TB Department | 23/31 (74.19%) | 40/49 (81.63%) | 34/41 (82.93%) | 97 (80.17%) |
| Digestive & Hepatology Dept. | 4/31 (12.90%) | 5/49 (10.20%) | 3/41 (7.32%) | 12 (9.92%) |
| Infectious Diseases Department | 2/31 (6.45%) | 2/49 (4.08%) | 1/41 (2.44%) | 5 (4.13%) |
| Others | 2/31 (6.45%) | 2/49 (4.08%) | 3/41 (7.32%) | 7 (5.79%) |
| Total | 31/31 (100.00%) | 49/49 (100.00%) | 41/41 (100.00%) | 121 (100.00%) |
Table 2: Distribution of Pseudomonas aeruginosa isolates by department, 2023–2025. Values are presented as n/N (%), where n is the number of isolates from the specified department and year, and N is the total number of isolates that year. The unit of analysis is the isolate after application of the one-patient–one-isolate-per-calendar-year deduplication rule. The Resp-TB was the primary observation cohort for the four-dimensional linkage-targeted intervention. Abbreviations: GI-Hep = Digestive and Hepatology Department; ID = Infectious Diseases Department; PA = Pseudomonas aeruginosa; Resp-TB = Respiratory and Tuberculosis Department.
| Antimicrobial agent | 2023 (N=31) | 2024 (N=49) | 2025 (N=41) | P value* |
| Tobramycin | 1/31 (3.23) | 1/49 (2.04) | 0/41 (0.00) | ns |
| Cefepime | 4/31 (12.90) | 3/49 (6.12) | 1/41 (2.44) | ns |
| Piperacillin/Tazobactam | 3/31 (9.68) | 3/49 (6.12) | 0/41 (0.00) | ns |
| Levofloxacin | 5/31 (16.13) | 11/49 (22.45) | 15/41 (36.59) | ns |
| Trimethoprim/Sulfamethoxazole | 30/31 (96.77) | 39/49 (79.59) | 38/41 (92.68) | ns |
| Meropenem | 3/31 (9.68) | 9/49 (18.37) | 5/41 (12.20) | ns |
| Imipenem | 4/31 (12.90) | 12/49 (24.49) | 7/41 (17.07) | ns |
| Gentamicin | 2/31 (6.45) | 6/49 (12.24) | 2/41 (4.88) | ns |
| Amikacin | 0/31 (0.00) | 2/49 (4.08) | 1/41 (2.44) | ns |
| Cefazolin | 6/31 (19.35) | 10/49 (20.41) | 4/41 (9.76) | ns |
Table 3: Annual resistance rates of Pseudomonas aeruginosa to 10 antimicrobial agents, 2023–2025. Values are presented as R/n (%), where R is the number of resistant isolates and n is the number of tested isolates for each antimicrobial agent and year. p-values compare 2023 versus 2025 using Fisher’s exact test. The Bonferroni-adjusted significance threshold was α = 0.005. The 95% confidence intervals were calculated using the Clopper–Pearson exact method. Denominators reflect the annual de-duplicated isolate counts unless incomplete antimicrobial panels require antibiotic-specific denominators. De-duplication was performed using a one-patient–one-isolate-per-calendar-year rule, with the first isolate retained. Abbreviations: CI = confidence interval; TMP-SMX = trimethoprim-sulfamethoxazole. ns = not significant.
Supplemental Table S1: Analysis of microbiological bacterial specimen data; reporting period: January 01, 2023 00:00:00 – December 31, 2023 23:59:59. Please click here to download this file.
Supplemental Table S2: Analysis of microbiological bacterial specimen data; reporting period: January 01, 2024 00:00:00 – December 31, 2024 23:59:59. Please click here to download this file.
Supplemental Table S3: Analysis of microbiological bacterial specimen data; reporting period: January 01, 2025 00:00:00 – December 31, 2025 23:59:59. Please click here to download this file.
Discussione
La gestione degli antimicrobici basata sulla qualità dei dati di sorveglianza
I metodi tradizionali basati sul conteggio degli isolati possono sovrastimare la resistenza agli antimicrobici a causa del campionamento ripetuto dello stesso paziente, in particolare nelle unità in cui i pazienti spesso presentano degenze prolungate. L'uso di una strategia di de-duplicazione basata sul primo isolato per paziente è conforme alle raccomandazioni dell'OMS per il programma GLASS e contribuisce a ridurre questo potenziale bias17,18. Nello studio attuale, l'approccio "un paziente–un isolato per anno solare" ha permesso di valutare i profili annuali di resistenza del PA utilizzando un insieme di dati centrato sul paziente, piuttosto che un accumulo di isolati ripetuti. Tuttavia, poiché lo stesso paziente potrebbe teoricamente essere incluso in più di un coorte annuale, i dati devono essere interpretati come sorveglianza annuale a livello di isolato e non come coorte longitudinale di pazienti.
Dopo la rimozione dei duplicati, i profili di resistenza antimicrobica di PA sono stati analizzati in tutta l'ospedale e confrontati in modo descrittivo tra i tre anni dello studio. Il profilo di resistenza ponderato a livello ospedaliero ha mostrato solo lievi modifiche dal 2023 al 2025, e i dati disponibili non hanno dimostrato una riduzione significativa della resistenza successiva all'attuazione dell'intervento quadridimensionale. Pertanto, i risultati attuali non devono essere interpretati come prova dell'efficacia dell'intervento. Un effetto ritardato del programma di ottimizzazione dell'uso degli antimicrobici rimane possibile, poiché i cambiamenti nel comportamento prescrittivo, nel consumo di antimicrobici e nella pressione selettiva potrebbero richiedere più di un ciclo clinico per diventare misurabili19,20. Studi precedenti hanno riportato riduzioni graduali della resistenza di PA a seguito di interventi combinati di ottimizzazione dell'uso degli antimicrobici e prevenzione delle infezioni21,22. Tuttavia, tali studi sono stati condotti in contesti sanitari diversi e hanno utilizzato popolazioni di pazienti, componenti degli interventi, definizioni di resistenza, periodi di osservazione e misure di esito differenti. I loro risultati devono pertanto essere confrontati con cautela con quelli dello studio retrospettivo monocentrico qui presentato.
I rapporti di sorveglianza esterni sono stati utilizzati esclusivamente per fornire un contesto descrittivo ai modelli di resistenza osservati in questo ospedale. I dati di sorveglianza CHINET della Cina hanno riportato una riduzione della resistenza di PA all'imipenem e al meropenem entro il 2024, mentre altri studi multicentrici e regionali hanno descritto modifiche della resistenza di PA nel tempo23,24,25,26. Al contrario, lo studio attuale è stato condotto in un ospedale specializzato in malattie infettive in cui la maggior parte degli isolati di PA proveniva dalla Resp-TB. I pazienti di questo reparto potrebbero aver subito un ricovero prolungato, una storia complessa di infezioni, malattie polmonari strutturali ed esposizioni ripetute ad antimicrobici, tutti fattori che potrebbero aver influenzato i modelli di resistenza osservati. Uno studio condotto in un ospedale terziario in Arabia Saudita ha riportato una percentuale di MDR-PA di circa il 37,5%16, ma questo valore non può essere confrontato direttamente con i risultati attuali a causa delle differenze nel disegno dello studio, nelle caratteristiche dei pazienti, nei metodi di campionamento, nelle procedure di de-duplicazione, nelle definizioni di resistenza e nei pannelli antimicrobici. È necessaria una cautela analoga quando si confrontano i dati attuali con studi longitudinali di altre regioni27. Di conseguenza, i valori di riferimento esterni mostrati nella Figura 7 hanno carattere puramente descrittivo e non devono essere interpretati come evidenza di una riduzione significativa, di un miglioramento cumulativo, di una convergenza verso un valore di riferimento, del raggiungimento di un obiettivo o dell'efficacia di un intervento.
L'aumento temporaneo della resistenza ai carbapenemici nel 2024 dovrebbe essere interpretato con cautela. La resistenza al meropenem è aumentata dal 9,68% nel 2023 al 18,37% nel 2024, per poi diminuire al 12,20% nel 2025. Analogamente, la resistenza all'imipenem è aumentata dal 12,90% al 24,49% e successivamente è diminuita al 17,07%. Queste fluttuazioni potrebbero riflettere cambiamenti nella pressione selettiva degli antimicrobici, nella composizione dei casi clinici dei pazienti, nell'uso empirico dei carbapenemici o in potenziali dinamiche di trasmissione. Tuttavia, la diffusione clonale, la produzione di carbapenemasi, le alterazioni delle porine, l'espressione delle pompe di efflusso e altri meccanismi molecolari di resistenza non sono stati indagati direttamente. Pertanto, questi meccanismi dovrebbero essere considerati come possibili spiegazioni derivate da studi precedenti28,29,30,31,32, piuttosto che conclusioni sostenute dal presente insieme di dati. Il numero relativamente ridotto di isolati annuali potrebbe inoltre aver amplificato le variazioni apparenti anno dopo anno nelle percentuali di resistenza.
Le traiettorie di resistenza dei 10 agenti antimicrobici valutati hanno mostrato schemi eterogenei specifici per antibiotico. La resistenza alla tobramicina, al cefepime e al pipercillina–tazobactam è diminuita nel corso del periodo di studio ed è rimasta bassa nel 2025. La resistenza alla tobramicina e al pipercillina–tazobactam ha raggiunto entrambe lo 0,00% nel 2025, mentre la resistenza al cefepime si è ridotta al 2,44%. La resistenza all'amikacina è rimasta anch'essa bassa per tutto il periodo di studio, oscillando tra lo 0,00% e il 4,08%. Questi risultati potrebbero riflettere le pratiche locali di prescrizione, le misure di gestione degli antimicrobici, le differenze nell'esposizione agli antimicrobici e i cambiamenti nella pressione selettiva33,34. Tuttavia, non erano disponibili dati individuali sui pazienti riguardo alle prescrizioni, alle dosi giornaliere definite, ai giorni di terapia, alle indicazioni terapeutiche, ai regimi posologici e alla durata del trattamento. Di conseguenza, i cambiamenti specifici osservati per antibiotico non possono essere attribuiti causalmente all'intervento quadridimensionale.
La resistenza ai carbapenemici ha raggiunto il picco nel 2024 ed è successivamente diminuita nel 2025. Questo andamento potrebbe essere stato associato all'uso empirico di carbapenemici tra pazienti più gravemente malati, a cambiamenti nelle caratteristiche cliniche dei pazienti ricoverati, a una pressione selettiva antimicrobica o a fattori di controllo delle infezioni non misurati. La tolleranza associata ai biofilm e altri meccanismi adattativi sono stati descritti in studi precedenti su PA35,36. Tuttavia, il presente studio non ha incluso test sui biofilm, rilevamento di carbapenemasi, analisi molecolari della resistenza, sequenziamento dell'intero genoma o valutazione della trasmissione clonale. Queste spiegazioni rimangono quindi possibilità basate sulla letteratura e non devono essere considerate meccanismi dimostrati nella coorte attuale.
La resistenza alla levofloxacina è aumentata progressivamente dal 16,13% nel 2023 al 22,45% nel 2024 e al 36,59% nel 2025. Nei pazienti con TB respiratorio (Resp-TB), è possibile un'esposizione prolungata o ripetuta a regimi antitubercolari contenenti fluorochinoloni, tra cui moxifloxacina e levofloxacina. Tale esposizione potrebbe esercitare una pressione selettiva crociata su PA e altri patogeni batterici37,38. Tuttavia, lo studio attuale non ha raccolto dati a livello individuale sui regimi antitubercolari, sull'esposizione precedente ai fluorochinoloni, sulle dosi cumulative di antimicrobici, sulla durata del trattamento o sull'aderenza alla terapia. Pertanto, non è stato possibile verificare un'associazione diretta tra la terapia antitubercolare contenente fluorochinoloni e l'aumento della resistenza alla levofloxacina. La tendenza osservata dovrebbe essere considerata un segnale di sorveglianza che richiede ulteriori indagini, piuttosto che una prova di una relazione causale confermata.
La resistenza al trimetoprim-sulfametossazolo è rimasta costantemente elevata durante tutto il periodo dello studio, con valori del 96,77% nel 2023, del 79,59% nel 2024 e del 92,68% nel 2025. Pseudomonas aeruginosa (PA) è intrinsecamente scarsamente suscettibile al trimetoprim-sulfametossazolo; pertanto, questi risultati non devono essere interpretati allo stesso modo della resistenza acquisita agli agenti antipseudomonas di normale attività. Al contrario, i dati confermano il limitato valore del trimetoprim-sulfametossazolo nel trattamento mirato a PA e l'importanza di interpretare i risultati dei test di sensibilità antimicrobica alla luce delle caratteristiche di resistenza intrinseca e degli attuali standard per i test di suscettibilità.
Il Resp-TB è stato selezionato come obiettivo primario della sorveglianza e dell'intervento contro PA poiché ha contribuito alla quota maggiore di isolati durante il periodo dello studio. I pazienti con tubercolosi polmonare possono presentare danni strutturali ai polmoni, un ricovero prolungato, esposizioni ripetute ad agenti antimicrobici, risposte immunitarie compromesse e numerose malattie sottostanti, tutti fattori che possono aumentare la suscettibilità alla colonizzazione o all'infezione da PA39,40,41,42,43,44,45. Inoltre, nei reparti di tubercolosi si raccolgono e manipolano frequentemente campioni respiratori e secrezioni, e vi è un contatto ravvicinato tra pazienti, caregiver e personale sanitario. Queste condizioni possono creare opportunità di contaminazione ambientale e trasmissione nosocomiale46,47. L'elevata concentrazione di isolati di PA in questo reparto giustifica quindi la prosecuzione della sorveglianza sulla resistenza, il campionamento respiratorio standardizzato, la pulizia ambientale, la gestione delle secrezioni e il rafforzamento delle pratiche di igiene delle mani.
Nell'ambito dei limiti imposti da questo disegno retrospettivo monocentrico, la proporzione annuale dipartimentale riportata per la Resp-TB non è diminuita dopo l'attuazione dell'intervento. I valori riportati sono stati del 74,19% nel 2023, dell'81,63% nel 2024 e dell'82,93% nel 2025, senza una riduzione statisticamente significativa (test del trend lineare di Cochran–Armitage, Z = 0,89, p ≈ 0,37). Questi valori descrivono la distribuzione annuale dipartimentale degli isolati di PA e non devono essere interpretati come un tasso diretto di resistenza specifico per antibiotico. Di conseguenza, i risultati non dimostrano una chiara riduzione associata all'intervento della resistenza di PA a livello dipartimentale. Tuttavia, il modello in quattro componenti—monitoraggio dinamico della resistenza, prescrizione stratificata per rischio, raccolta standardizzata dei campioni e potenziamento della prevenzione e del controllo delle infezioni—potrebbe fornire una struttura pratica per coordinare le attività di stewardship antimicrobica, diagnostica microbiologica e controllo delle infezioni sulla base dei dati di sorveglianza locale.
L'assenza di una riduzione statisticamente significativa non indica necessariamente che ogni componente dell'intervento fosse priva di valore. La raccolta standardizzata dei campioni potrebbe aver migliorato la qualità e la rappresentatività dei campioni respiratori, mentre i rapporti di sorveglianza trimestrali potrebbero aver aumentato la consapevolezza dei medici riguardo ai pattern locali di resistenza. L'igiene migliorata delle mani e la disinfezione ambientale potrebbero inoltre aver sostenuto le pratiche abituali di prevenzione delle infezioni. Tuttavia, il presente dataset retrospettivo non includeva indicatori di processo, come il consumo di antimicrobici, l'appropriatezza delle prescrizioni empiriche, la conformità ai protocolli di raccolta dei campioni, l'aderenza all'igiene delle mani, i risultati delle colture ambientali o il tempo necessario per iniziare una terapia appropriata. Pertanto, non è stato possibile valutare la fedeltà di attuazione e gli effetti indipendenti dei quattro componenti dell'intervento.
Nella ricerca futura dovrebbero essere prioritizzate diverse direzioni. In primo luogo, sono necessari studi prospettici multicentrici con campioni di dimensioni maggiori e reparti di controllo contemporanei per convalidare le tendenze di resistenza osservate e determinare se quadri di gestione simili siano applicabili in diversi contesti sanitari. In secondo luogo, andrebbero inclusi dati clinici a livello del singolo paziente, come diagnosi, gravità dell'infezione, comorbilità, esposizione agli antimicrobici, durata del trattamento, esiti clinici e la distinzione tra infezione e colonizzazione. In terzo luogo, il consumo di antimicrobici dovrebbe essere quantificato mediante misure standardizzate, come le dosi giornaliere definite o i giorni di terapia, al fine di valutare la relazione tra le pratiche prescrittive e la successiva resistenza.
Studi futuri dovrebbero inoltre incorporare metodi di epidemiologia molecolare. Il sequenziamento dell'intero genoma, il rilevamento dei geni codificanti carbapenemasi, l'analisi delle alterazioni di OprD e la valutazione dell'espressione delle pompe di efflusso contribuirebbero a chiarire i meccanismi alla base della resistenza ai carbapenemi e a determinare se i cambiamenti temporali siano legati all'acquisizione indipendente di resistenza o alla trasmissione clonale. È necessario un follow-up longitudinale per valutare la sostenibilità di interventi mirati in contesti ad alta prevalenza, come i reparti di pneumologia e di tubercolosi. Inoltre, un approccio One Health che includa il monitoraggio ambientale delle acque reflue ospedaliere, delle superfici ad alto contatto, delle attrezzature per la terapia respiratoria e dei dati regionali sulla resistenza agli antimicrobici potrebbe aiutare a chiarire le implicazioni più ampie per la salute pubblica della resistenza locale di PA.
In conclusione, questo studio retrospettivo monocentrico ha utilizzato un approccio di deselezione basato su un paziente–un isolato per anno solare per descrivere i profili di resistenza antimicrobica degli isolati clinici di PA raccolti dal 2023 al 2025. La proporzione annuale del reparto riportata per la Resp-TB non è diminuita dopo l'attuazione dell'intervento mirato a quattro dimensioni, e i dati disponibili non hanno dimostrato una riduzione della resistenza antimicrobica associata all'intervento. I valori di riferimento esterni sono stati utilizzati esclusivamente come contesto descrittivo e non erano direttamente confrontabili a causa delle differenze nelle definizioni di resistenza, nei metodi di campionamento, nelle popolazioni di pazienti, nelle procedure di deselezione e nei pannelli antimicrobici. I profili specifici per antibiotico erano eterogenei: la resistenza alla tobramicina, al cefepime e al piperacillina–tazobactam è rimasta bassa entro il 2025, mentre la resistenza alla levofloxacina è aumentata e quella al trimetoprim–sulfametossazolo è rimasta costantemente elevata. Questi risultati sostengono la necessità di proseguire la sorveglianza locale sulla resistenza e il monitoraggio del razionale impiego degli antimicrobici, in particolare nella Resp-TB, che ha contribuito alla maggior parte degli isolati di PA.
Questo studio presenta diversi limiti. In primo luogo, il disegno retrospettivo monocentrico e la dimensione relativamente ridotta del campione (n = 121) hanno limitato la potenza statistica e la generalizzabilità, in particolare per i reparti con pochi isolati. In secondo luogo, i dati clinici dettagliati non erano disponibili in modo sistematico. Pertanto, gli isolati sono descritti come “isolati clinici” piuttosto che come infezioni confermate, e non è stato possibile effettuare una distinzione formale tra infezione e colonizzazione. In terzo luogo, non erano disponibili dati sui singoli pazienti riguardo alla prescrizione e al consumo di antimicrobici, il che ha limitato la valutazione della relazione tra l'intervento di stewardship, l'uso di antimicrobici e i profili di resistenza.
Quarto, lo studio non prevedeva un reparto di controllo contemporaneo e non ha utilizzato un disegno sperimentale a serie temporale interrotta. Di conseguenza, non è stato possibile distinguere i cambiamenti temporali dalle tendenze secolari, dalle variazioni nella composizione dei casi dei pazienti o da altre attività contemporanee di controllo delle infezioni. Quinto, non sono stati indagati i meccanismi molecolari di resistenza, tra cui i geni codificanti carbapenemasi, alterazioni di OprD, l'espressione delle pompe di efflusso, la tolleranza associata ai biofilm e la trasmissione clonale. Sesto, la deduplicazione si è basata sui nomi dei pazienti e su una regola di un-paziente–un-isolato-per-anno-solari. Non può quindi essere esclusa una classificazione errata o l'inclusione ripetuta dello stesso paziente in anni diversi.
Infine, i fenotipi MDR e XDR non sono stati classificati sistematicamente in questo dataset retrospettivo, e lo studio si è concentrato sui tassi di resistenza specifici per antibiotico piuttosto che sui fenotipi di resistenza composti. Anche gli indicatori di processo che riflettono la fedeltà dell'intervento, inclusi il consumo di antimicrobici, l'appropriatezza della terapia empirica, l'aderenza all'igiene delle mani, i tassi di rifiuto per scarsa qualità dei campioni e l'efficacia della disinfezione ambientale, non erano disponibili. Studi prospettici futuri, multicentrici e su larga scala dovrebbero utilizzare identificatori paziente robusti, definizioni standardizzate di MDR/XDR, dati a livello di prescrizione, controlli contemporanei, test molecolari e periodi di osservazione sufficientemente lunghi per convalidare questi risultati e determinare il valore a lungo termine degli interventi mirati di stewardship antimicrobica.
Dichiarazioni
Gli autori non hanno conflitti di interessi da dichiarare.
Ringraziamenti
Grazie ai membri del team per il loro supporto e contributo a questo esperimento. Questo lavoro è stato sostenuto dal progetto dell'Ufficio di Scienza e Tecnologia di Huaian (Grant No. HAB2024030).
Materiali
| Nome | Azienda | Numero di catalogo | Commenti |
|---|---|---|---|
| Standard 0,5 McFarland | bioMérieux, Francia | 21182 | Standardizzazione dell'inoculo |
| Agar al sangue di pecora al 5% | Thermo Fisher Scientific, USA | PKR01200 | Coltura di campioni clinici |
| Scheda AST-N399 | bioMérieux, Francia | REF 423701 | Test di sensibilità antimicrobica per il pannello antimicrobico |
| CLSI M100 (33ª ed.) | CLSI, USA | M100-ED33 | Interpretazione dei valori di soglia |
| Scheda per identificazione GN | bioMérieux, Francia | 21341 | Identificazione definitiva di isolati Gram-negativi |
| GraphPad Prism | GraphPad Software, USA | Versione 9.0 | Generazione di figure |
| Agar MacConkey | Thermo Fisher Scientific, USA | R01552 | Differenziazione dei batteri Gram-negativi |
| P. aeruginosa ATCC 27853 | ATCC, USA | ATCC 27853 | Stirpe di riferimento per il controllo di qualità quotidiano |
| SPSS Statistics | IBM Corp., USA | Versione 26.0 | Analisi statistica |
| Agar Tripticaso-soia con bacitracina | BD, USA | ICN1010617 | Coltura selettiva |
| Sistema VITEK 2 Compact | bioMérieux, Francia | V2COMPACT | ID/AST automatizzata |
Riferimenti
- Elfadadny A et al. Antimicrobial resistance of Pseudomonas aeruginosa: navigating clinical impacts, current resistance trends, and innovations in breaking therapies. Front Microbiol. 2024;15:1374466.
- Algammal AM et al. Multidrug resistant Pseudomonas aeruginosa: pathogenesis, resistance mechanisms, and novel therapeutic strategies. Microb Pathog. 2024;195:106913.
- Zhao Y et al. Multidrug resistance in Pseudomonas aeruginosa: genetic control mechanisms and therapeutic advances. Mol Biomed. 2024;5(1):62.
- Naghavi M et al. Global burden of bacterial antimicrobial resistance 1990-2021: a systematic analysis with forecasts to 2050. Lancet. 2024;404(10459):1199-226.
- Murray CJL et al. Global burden of bacterial antimicrobial resistance in 2019: a systematic analysis. Lancet. 2022;399(10325):629-55.
- World Health Organization. WHO bacterial priority pathogens list, 2024. Geneva: World Health Organization; 2024.
- Pipitò L et al. Antimicrobial resistance in ESKAPE pathogens: a retrospective epidemiological study at the University Hospital of Palermo, Italy. Antibiotics (Basel). 2025;14(2):186.
- Sinha S et al. Prevalence of co-infection of culture-proven bacterial pathogens in microbiologically confirmed pulmonary tuberculosis patients from a tertiary care center. Cureus. 2024;16(8):e67423.
- Kawa DE et al. Characterization of beta-lactamase and fluoroquinolone resistance determinants in Escherichia coli, Klebsiella pneumoniae, and Pseudomonas aeruginosa isolates from a tertiary hospital in Yolo, Nigeria. Trop Med Infect Dis. 2023;8(11):500.
- Hernandez-Jimenez P et al. Risk factors and outcomes for multidrug resistant Pseudomonas aeruginosa infection in immunocompromised patients. Antibiotics (Basel). 2022;11(11):1459.
- Tumbarello M et al. Multidrug-resistant Pseudomonas aeruginosa bloodstream infections: risk factors and mortality. Epidemiol Infect. 2011;139(11):1740-9.
- Mitamura M et al. Comparison of de-duplication methods used by WHO Global Antimicrobial Resistance Surveillance System (GLASS) and Japan Nosocomial Infections Surveillance (JANIS) in the surveillance of antimicrobial resistance. PLoS One. 2020;15(6):e0228234.
- Clinical and Laboratory Standards Institute. Analysis and presentation of cumulative antimicrobial susceptibility test data. 5th ed. CLSI supplement M39. Wayne (PA): Clinical and Laboratory Standards Institute; 2022.
- Clinical and Laboratory Standards Institute. Performance standards for antimicrobial susceptibility testing. 33rd ed. CLSI supplement M100. Wayne (PA): Clinical and Laboratory Standards Institute; 2023.
- Wan Y et al. Navigating an evolving microbial landscape: emerging antimicrobial resistance trends and precision stewardship in Tianjin tertiary hospitals (2021-2023). Front Cell Infect Microbiol. 2025;15:1629038.
- Shabi Y et al. A decade of antimicrobial resistance trends in Pseudomonas aeruginosa: insights from a tertiary care hospital in Saudi Arabia (2013-2022). Front Microbiol. 2025;16:1617522.
- Kim S, Yoo SJ, Chang J. Importance of susceptibility rate of 'the first' isolate: evidence of real-world data. Medicina (Kaunas). 2020;56(10):507.
- Simner PJ et al. What's new in antibiograms? Updating CLSI M39 guidance with current trends. J Clin Microbiol. 2022;60(10):e02210-21.
- Aiesh BM et al. Impact of an antibiotic stewardship program on antibiotic utilization, bacterial susceptibilities, and cost of antibiotics. Sci Rep. 2023;13(1):5040.
- Sartelli M et al. Preventing and controlling healthcare-associated infections: the first principle of every antimicrobial stewardship program in hospital settings. Antibiotics (Basel). 2024;13(9):896.
- Guo L et al. Successful control of resistance in Pseudomonas aeruginosa using antibiotic stewardship and infection control programs at a Chinese university hospital: a 6-year prospective study. PLoS One. 2018;13(5):e0196932.
- Eljaaly K et al. Impact of an antimicrobial stewardship programme on antimicrobial utilization and the prevalence of MDR Pseudomonas aeruginosa in an acute care hospital in Qatar. JAC Antimicrob Resist. 2021;3(3):dlab095.
- Guo Y et al. Antimicrobial resistance profile of clinical isolates from hospitals across China: CHINET 2024 surveillance report. One Health Adv. 2025;3:23.
- Qin X et al. Antimicrobial resistance of clinical bacterial isolates in China: current status and trends. JAC Antimicrob Resist. 2024;6(2):dlae052.
- Li J et al. Trends and implications of antimicrobial resistance in Pseudomonas aeruginosa: insights from a 19-year study in Zhejiang Province. Medicine (Baltimore). 2024;103(46):e40606.
- Xiao S, Liang X, Han L, Zhao S. Incidence, antimicrobial resistance and mortality of Pseudomonas aeruginosa bloodstream infections among hospitalized patients in China: a retrospective observational multicenter cohort study from 2017 to 2021. Front Public Health. 2023;11:1294141.
- Cimpeanu O et al. Trends in antimicrobial resistance of Acinetobacter baumannii and Pseudomonas aeruginosa from bloodstream infections: an eight-year study in a Romanian tertiary hospital. Microorganisms. 2025;13(7):1558.
- Zhao Y et al. Epidemiological and genetic characteristics of clinical carbapenem-resistant Pseudomonas aeruginosa strains in Guangdong Province, China. Microbiol Spectr. 2023;11(3):e0426122.
- Flores-Vega VR et al. High-risk Pseudomonas aeruginosa clones harboring beta-lactamases: 2024 update. Heliyon. 2025;11(1):e41540.
- Dobrescu MS et al. The difference a year can make: how antibiotic resistance mechanisms in Pseudomonas aeruginosa have changed in Northwestern Transylvania. Biomolecules. 2025;15(1):1.
- Xie X et al. Molecular epidemiology and carbapenem resistance mechanisms of Pseudomonas aeruginosa isolated from a hospital in Fujian, China. Front Microbiol. 2024;15:1431154.
- Huang W et al. Carbapenem-resistant Pseudomonas aeruginosa infections in critically ill children: prevalence, risk factors, and impact on outcome in a large tertiary pediatric hospital of China. Front Public Health. 2023;11:1088262.
- Falcone M, Galfo V, Tiseo G. Not all carbapenem-resistant Pseudomonas aeruginosa strains are alike: tailoring antibiotic therapy based on resistance mechanisms. Curr Opin Infect Dis. 2024;37(6):594-601.
- Schwartz B et al. Multidrug resistant Pseudomonas aeruginosa in clinical settings: a review of resistance mechanisms and treatment strategies. Pathogens. 2024;13(11):975.
- Ciofu O, Tolker-Nielsen T. Tolerance and resistance of Pseudomonas aeruginosa biofilms to antimicrobial agents-how P. aeruginosa can escape antibiotics. Front Microbiol. 2019;10:913.
- Higazy D et al. In vivo evolution of antimicrobial resistance in a biofilm model of Pseudomonas aeruginosa lung infection. ISME J. 2024;18(1):wrae036.
- Anggriawan IMB, Rochmawati ID. Prevalence and risk factors of fluoroquinolone resistance in major bacterial pathogens: a systematic review and meta-analysis. Int J Microbiol. 2026;2026:3173058.
- Panholzer J et al. Ciprofloxacin-resistant Pseudomonas aeruginosa lung abscess complicating COVID-19 treated with the novel oral fluoroquinolone delafloxacin. Case Rep Pulmonol. 2022;2022:1008330.
- Jiang J et al. Disseminated tuberculosis is associated with impaired T cell immunity mediated by the non-canonical NF-kappaB pathway. J Infect. 2024;89(3):106231.
- Moreira-Teixeira L et al. T cell-derived IL-10 impairs host resistance to Mycobacterium tuberculosis infection. J Immunol. 2017;199(2):613-23.
- Schwander S, Dheda K. Human lung immunity against Mycobacterium tuberculosis: insights into pathogenesis and protection. Am J Respir Crit Care Med. 2011;183(6):696-707.
- Yuan Q et al. Risk factors and outcomes of inpatients with carbapenem-resistant Pseudomonas aeruginosa bloodstream infections in China: a 9-year trend and multicenter cohort study. Front Microbiol. 2023;14:1137811.
- Maraolo AE et al. Clinical outcomes and predictors of mortality in patients with difficult-to-treat resistant Pseudomonas aeruginosa infections: a retrospective cohort study. Antibiotics (Basel). 2026;15(1):33.
- Abdul Jabar K et al. Predictors of mortality in Pseudomonas aeruginosa bloodstream infections: a scoping review. Pathogens. 2026;15(1):61.
- Geremia N et al. Risk factors for 30-day mortality and the role of empirical therapy in Pseudomonas aeruginosa bloodstream infections. Infection. 2025;53(5):2243-56.
- Boyce JM. Hand and environmental hygiene: respective roles for MRSA, multi-resistant Gram-negative bacteria, Clostridioides difficile, and Candida spp. Antimicrob Resist Infect Control. 2024;13(1):110.
- Glowicz JB et al. SHEA/IDSA/APIC practice recommendation: strategies to prevent healthcare-associated infections through hand hygiene: 2022 update. Infect Control Hosp Epidemiol. 2023;44(3):355-76.