苗の洪水アッセイは、シュードモナスシリンガエ細菌に対する耐性のための野生のトマトの受診の迅速なスクリーニングを促進する。このアッセイは、苗菌増殖アッセイと組み合わせて使用され、細菌に対する根底にある耐性をさらに特徴付けるのに役立ち、かつ、マッピング集団をスクリーニングして抵抗の遺伝的基礎を決定するために使用することができる。
このコンテンツを表示するには、JoVEへの購読が必要です。 または、無料トライアルをお申し込みください。
この記事について
訂正のお知らせ
Important: There has been an erratum issued for this article. View Erratum Notice
サマリー
要約
トマトは、グラム陰性細菌であるシュードモナスシリンゲに感染し、細菌斑点病を引き起こす可能性のある農事学的に重要な作物です。トマト-P. シリンガエpv.トマトパソシステムは、植物の自然応答と耐病性の遺伝的基盤を解剖するために広く使用されています。ソラナム・ピンピネリフォリウムから栽培トマトへのPto/Prf遺伝子クラスターの導入により、病気は何十年もの間正常に管理されていましたが、P.シリンガエのレース1株はPto/Prf遺伝子クラスターによって与えられた抵抗を克服するために進化し、世界中で発生しています。
野生のトマト種は、異なる病原体の圧力を持つ多様な環境で進化したため、病原体認識における自然の多様性の重要な貯水池です。野生のトマトの耐病性の典型的なスクリーンでは、大人の植物が使用され、成長時間の延長と成長スペースの要件の増加のためにスクリーニングできる植物の数を制限することができます。植物の成長時間と成長室空間を最小限に抑え、植物の急速な回転を可能にし、大きなサンプルサイズをテストできる耐性のために10日齢のトマト苗をスクリーニングする方法を開発しました。生存または死の苗の結果は、離散表現型として、または洪水後に生き残った苗の新たな成長の量によって定義される抵抗スケールで扱うことができる。この方法は、2つのP.シリンガ株に対する耐性のために10日齢のトマト苗をスクリーニングするように最適化されており、他のP.シリンゲ株に容易に適応することができる。
概要
シュードモナスシリンゲは、広範囲の植物宿主に感染するグラム陰性病原菌である。細菌は、宿主植物に住み、または、心の傷を通して、アポプラスト1に増殖する。植物は、細菌病原体による感染から保護するために、2層の免疫応答を進化させた。第1レベルは植物細胞表面で起こり、植物細胞膜上のパターン認識受容体はPAMP誘発免疫(PTI)2と呼ばれるプロセスにおいて高度に保存された病原体関連分子パターン(PMP)を知覚する。このプロセスの間に、宿主植物は、細胞壁へのカロキスの沈着、気孔の閉鎖、活性酸素種の産生、および病原性関連遺伝子の誘導を含む防御応答経路を上方制御する。
細菌は、エフェクターと呼ばれるタンパク質を植物細胞3に直接送達するためにIII型分泌システムを利用することによってPTIを克服することができる。エフェクタータンパク質は、一般的にPTIの成分を標的とし、病原体の毒性を促進する 4.植物免疫の第2層は、エフェクタータンパク質の認識時に植物細胞内で発生する。この認識は、受容体(NlRs)を含むヌクレオチド結合部位ロイシンリッチリピートをコードする耐性遺伝子に依存する。NlRは、エフェクターを直接認識するか、毒性目標またはおとり5に対する活性を認識することができる。次いで、エフェクター誘発免疫(ETI)と呼ばれるプロセスにおいて二次免疫応答を引き起こし、これはしばしば過敏応答(HR)に関連する、感染部位における局所細胞死の一種である6。ETIに関連する遺伝子耐性とは対照的に、植物は、複数の遺伝子7の寄与に依存する定量的な部分抵抗性を示すことができる。
P. シリンガエpv.トマト(Pst)はトマトの細菌斑点の因果剤であり、持続的な農業上の問題である。この分野における主な株は、典型的には、タイプIIIエフェクターAvrPtoおよびAvrPtoBのいずれかまたは両方を発現するPstレース0株であった。DC3000(Pst DC3000)は、代表的なレース0株およびトマトに細菌斑点を引き起こす可能性のある病原体のモデルである。細菌斑病と闘うために、ブリーダーはPto[P.シリンガエpv.トマト]/Prf [Pto耐性とフェンチオン感受性]遺伝子クラスターを野生のトマト種ソラナムピンピネリフォリウムから現代の品種8,9に浸透させた。Pto遺伝子は、セリンスレオニンプロテインキナーゼをコードし、Prf NLRと共に、エフェクターAvrPtoおよびAvrPtoB 10、11、12、13、14の認識を介して、PstDC3000に対する耐性を付与する。しかし、この抵抗は、近年15、16で彼らの急速かつ積極的な広がりを可能にする、新興のレース1株に対して効果がありません。レース1株は、Pto/Prfクラスターによる認識を回避し、AvrPtoがこれらの株で失われるか変異し、AvrPtoBは最小15、17、18を蓄積するように見える。
野生のトマト集団は、Pst抵抗のための自然変動の重要な貯水池であり、以前に潜在的な抵抗loci19、20、21を同定するために使用されてきた。しかし、病原体耐性の現在のスクリーンは、4〜5週齢の成虫植物20,21を利用する。したがって、それらは、成長時間、成長室空間、および比較的小さいサンプルサイズによって制限される。従来のアプローチの限界に対処するために、我々は10日齢のトマト苗22を用いて高スループットトマトP.シリンゲ耐性アッセイを開発した。このアプローチは、大人の植物を使用する上で、いくつかの利点を提供します: すなわち、より短い成長時間、スペースの要件を減らし、より高いスループット。さらに、このアプローチが、成体植物22で観察される疾患耐性のフェノタイプを忠実に再現することを実証した。
このプロトコルに記載されている苗の洪水アッセイでは、トマトの苗は10日間無菌ムラシゲとスクーグ(MS)メディアのペトリ皿で栽培され、その後、関心のある細菌と界面活性剤を含む接種物であふれています。洪水の後、苗は細菌増殖アッセイを介して耐病性について定量的に評価することができる。さらに、苗の生存または死は、洪水の7〜14日後に離散性抵抗または疾患表現型として作用することができます。このアプローチは、Pst株T1(Pst T1)などのPstレース1株に対する耐性のために多数の野生トマトの受け入れをスクリーニングするためのハイスループットの代替手段を提供し、関心のある他の細菌株に容易に適応することができる。
アクセスが制限されています。このコンテンツを表示するにはログインするか、トライアルを開始してください。
プロトコル
1. バイオセーフティキャビネットの作成と使用
- バイオセーフティキャビネットを70%エタノールで拭き取ります。
- サッシを閉じ、バイオセーフティキャビネットの紫外線を15分間点灯します。
- 15分後、バイオセーフティキャビネットの紫外線を消します。サッシを持ち上げ、ブロワーを15分間オンにします。
- 滅菌されたキャビネットに入れる前に、バイオセーフティキャビネットで使用するすべてのアイテムを70%エタノールで拭いてください。
- バイオセーフティキャビネットで作業する前に、手袋または素手で70%エタノールを使用してください。
- ブロワーから離れて、バイオセーフティキャビネットの中央で動作します。
- 実験には、オートクレーブ滅菌10 mM MgCl2と超純粋なH2Oの未開封ボトルを使用してください。ボトルをバイオセーフティキャビネットに入れ、ベンチトップではなく殺菌されたバイオセーフティキャビネットで開けてください。
- 殺菌されたバイオセーフティキャビネットの仕事のための専用ガラスピペットおよびピペットの先端を使用する。これらはバイオセーフティキャビネットでのみ開かれ、ベンチトップには絶対に開かないようにしてください。
- バイオセーフティキャビネットを使用した後、すべての廃棄物(漂白剤廃棄物を除く)をオートクレーブし、70%エタノールで表面を拭き取ります。
2. 植物培地の準備
- 0.5倍のMS基底塩を超純粋なH2O.に計量して溶解し、0.8%のバクト寒天を計量し、溶解した0.5倍MSに加えます。
- オートクレーブとは、注ぐまたはピペットする前に1時間の50°C水浴でメディアを冷却することができます。
- プレートが過剰充填されないように、ポリスチレン使い捨て滅菌100 x 25 mmプレートを40 mLの充填レベルにマークします。滅菌バイオセーフティキャビネットの100 x 25 mmの滅菌プレートにメディアを注ぎます。
3. 植物材料の製造と成長条件
- トマトの種を2.2 mLマイクロ遠心分離チューブに入れ、2.0 mLの50%漂白剤溶液を加えます。
- ロッカーにチューブを25分間揺らします。
- 25分後、ロッカーから種子を取り除き、滅菌バイオセーフティキャビネットのピペットで漂白剤溶液を取り除きます。すべての漂白剤が取り除かれていることを確認します。
- 種子を洗浄するために滅菌超純粋なH2 Oの2mLを加えます。チューブを5倍に反転します。
- ピペットでチューブから液体を取り出します。
- ステップ 3.3 ~ 3.5 を繰り返して、さらに 4 倍のシードを洗浄します。
- 滅菌超純粋なH2 Oの2 mLを追加し、空の滅菌ペトリ皿に種子を注ぎます。
- エタノールの火炎の鉗子と0.5x MS + 0.8%寒天培地を含む100 x 25 mmの版に種を移し、均等に間隔を空ける前に冷却することを可能にする。
- 1つのプレートの中央に5~7種の種子を入れ、外科用テープ(1.25cm x 9.1m)でプレートの端を密封します。
- 殺菌を同期させるために少なくとも3日間、暗闇の中で4°Cで殺菌された種子を層化する。プレートが平らに積み重ねられ、プレート上に面合っていることを確認して、プレート上でシードがずれないようにします。
- 成長チャンバーに移るとき、種子のラインが水平に向くように、プレートの表面に沿って根が成長するようにプレートを垂直方向に向けます。
注:成長チャンバーを22°Cに設定し、光強度で16時間の光を提供します-200〜220 μEメートル-2 s-1と暗闇の8時間。 - 洪水の前に、苗を成長室で10日間栽培し、その時点で苗は通常、完全に出現し、拡大されたコチルドンと新興の最初の真の葉を表示する(図1)。

図1:典型的な10日齢のトマト苗の発生段階。リオグランデ-PtoRトマト種子を滅菌、メッキ、4°Cで暗闇の中で少なくとも3日間層状化した。苗は、浸水する前に22°Cで10日間0.5倍のMSプレート上で栽培されました。典型的には、10日でコチルドンは完全に拡張され、最初の真の葉が現れ始めています。この図の大きなバージョンを表示するには、ここをクリックしてください。
4. 国王B23(KB)メディアの準備
- ビーカーに超純粋なH2Oの500 mLを充填し、攪拌板でかき混ぜます。
- 20gのバクトペプトン、1.5gの無水K2HPO4、および12.5mLのグリセロールを超純度H2Oでビーカーに完全に溶解する。
- 溶解した混合物を1 Lの等流シリンダーに注ぎ、超純粋なH2Oで1L最終容積に持ち込む。
- スープをビーカーに戻し、混ぜるまでかき混ぜます。
- 2つの500 mLガラス瓶にバクト寒天の7.5 gを計量し、各ボトルにステップ4.4からKBスープの500 mLを追加します。オートクレーブ 20分間
- オートクレーブからボトルを取り出し、寒天を分配するために穏やかに渦巻きます。
- ボトルを50°Cの水浴に1時間移します。
- 1時間後、ボトルをバイオセーフティキャビネットに移し、無菌条件下で1,600μLの無菌1 M MgSO4を加え、適切な抗生物質を培地に加えます。
注:リフィンピシン耐性株の場合は、PstDC3000およびPstT1、ジメチルホルムアミドに溶解リフィンピシンを使用して、最終的な濃度50 μg/mLで。プレート上の真菌の成長を防ぐために、50 μg/mLの最終濃度でエタノールに溶解したシクロヘキシミドを使用してください。 - メディアをそっと回し混ぜ合わせ、プレートの底を覆うために注ぎます。
- プレートを固めるのに少なくとも1時間を許し、4°Cで逆さまに保管してください。
5. 細菌株の維持と培養条件
- 飽和菌培養物の1mL、滅菌80%グリセロールの333μLとして、細菌の単一コロニーからグリセロールストックを-80°Cで維持する。
- 適切な抗生物質を用いて、グリセロールストックからKB寒天にパッチ細菌(すなわち、PstT1)(セクション4)を適用する。
- 細菌は、平らな、無菌の爪楊枝を使用して選択的なKB寒天に新鮮な細菌をストリークする前に、28°Cで2日間回復することができます。
- グリセロールストックから、平らな無菌の爪楊枝を使用して適切な選択的KB寒天に新鮮な細菌をストリーク。
注:パッチを当てたグリセロールストックが2週間以上前のものではないことを確認してください。 - PstDC3000 の場合、洪水実験で細菌を使用する前に、28 °C で 24 時間インキュベートします。
- PstT1 の場合、洪水実験で細菌を使用する前に、KB プレートを 28 °C で 48 時間インキュベートします。
6. PstT1接種の準備
- 無菌で細菌を再中断します無菌 10 mM MgCl2光密度で 600 nm (OD600) で 0.1, または約 5 x 10⁷コロニー形成ユニット (CFU)/mL).
- バイオセーフティキャビネットで滅菌10 mMMgCl2溶液を使用してシリアル希釈を行います。PstT1 の場合は、分光光度計を使用して、OD600 = 0.1 の開始濃度で接種を行います。
- PstT1 の場合、OD600 = 0.1 で最初の再懸濁液から 1/10 希釈して、OD600 = 0.01 の濃度で連続希釈を得る。
- ステップ6.3からOD600 = 0.01のシリアル希釈を使用して、3/4希釈を行い、最終的なOD600 = 0.0075を得る。
- 非イオン性有機シリコーン界面活性剤C13H34O4 Si3(すなわち、 界面活性剤)を10 mMMgCl2に、渦は15s.最後のシリアル希釈(OD600 = 0.0.0075)に界面活性剤の1/10ストックを加えて、最終的な濃度0.015%にし、よく旋回して混合します。
7. PSTDC3000接種の準備
- 無菌で細菌を再懸濁し、滅菌10mMMgCl2を600 nm(OD600)で光学密度0.1(約5 x 10 7 CFU/mL)の光学密度にします。
- バイオセーフティキャビネットで滅菌10 mMMgCl2溶液を使用してシリアル希釈を行います。PstDC3000 の場合は、分光光度計を使用して、OD600 = 0.1 の開始濃度で接種を行います。
- PstDC3000の場合、OD600 = 0.1で最初の再懸濁液から1/10希釈して、OD600 = 0.01の濃度で連続希釈を得る。
- ステップ3からOD600 = 0.01でシリアル希釈を使用して、1/2希釈を行い、最終的なOD600 = 0.005を得る。
- 10 mMMgCl2で界面活性剤を1/10希釈し、15sの渦を加え、最後の連続希釈液(OD600 = 0.005)に界面活性剤の1/10ストックを0.015%の最終濃度に加え、よく混ぜ合わせます。
8. トマト苗の洪水法
- 成長室から10日齢の苗を持つプレートを取り出し、洪水のためのプレートを準備するためにバイオセーフティキャビネットに入れます。
- 2枚のプレートから外科テープを取り外します。
- 3分のタイマーを設定します( 6 mLの最終接種(PstT1 OD600 = 0.0075 [セクション 6]またはPstDC3000 OD600 = 0.005 [セクション 7])、6 mLの接種を 10 日齢の苗で各プレートに移します。
- 苗を滅菌ピペットチップで接種器にそっと押し込みます。タイマーを開始します。
- 各手に1枚のプレートを持つ。プレートの前部を傾けて接種を蓄積し、主に苗のコチルドンと葉を水没させます。
- 側面に5〜7xをスウィッシュし、その後、根とプレート全体をカバーするためにプレートを戻します。
- プレートをもう一度傾けてコチルドンと葉を沈め、合計3分間繰り返します。
- プレートからイノキュラムを注ぎ、平らな表面にプレートを置き、残りの接種を2回目に注ぎます。
- 外科用テープでプレートを再包装し、残りのプレートに対してステップ8.2~8.8を繰り返します。
- すべてのプレートが浸水した後、成長チャンバー内のプレートを再インキュベートします(ステップ3.11注を参照)。
- PstDC3000 の 7 ~ 10 日後の表現型、PstT1 の場合は 10 ~ 14 日 (セクション 11)細菌増殖アッセイを実施する場合は、4日後(セクション9および10)後に表現型(セクション11)の後に葉組織を採取する。あるいは、植物の別々のセットに対して表現型分析および細菌増殖アッセイを行う。
細菌増殖アッセイのためのコチルドンの表面殺菌
- 成長室(セクション8)で苗を浸水し再インキュベートした4日後に、成長室からトマト苗を入れたプレートを取り除きます。
- 各遺伝子型のプレートに苗が取り付けるプレートの下部の外側に個々の苗木に番号を付けます。
- 個々の苗木番号とラベル滅菌1.5 mLマイクロ遠心チューブと、ビードビーターで使用するために、各チューブに1つの3ミリメートル滅菌ホウケイ酸ビーズをドロップするためにきれいな鉗子を使用しています。(ステップ10.1の注を参照してください。
- ピペット200 μLの10 mMMgCl2を各チューブに入れ、チューブを閉じます。
- 70%エタノールを調製し、清潔なビーカーに100 mLを注ぎます。100 mLの無菌超純粋H2Oを別のクリーンビーカーに注ぎます。
- エタノールと鋸歯状の先端ときれいなステンレス鋼のまっすぐなファインポイント鉗子。プレートを少し開けて、きれいな鉗子で1つのコチルドンを無菌除去できるようにします。
- コチルドンの基部にあるペティオールをつまんで葉を取り除き、70%エタノールでビーカーに落とし、10 sの表面滅菌を行い、コティレドンを超純粋なH2Oで10sの間でリンスします。
- ペーパータオルの上にコチルドンを置き、繊細な科学のワイプで乾燥させます。
- 表面滅菌およびブロッティング後の各コチルドンを個別に秤量し、重量を記録する。
- 以前に準備した1.5 mLマイクロ遠心分離チューブ(ステップ9.3と9.4から)に、対応する遺伝子型と個体数でラベル付けされたコチルドンを入れる。
- 滅菌テープでプレートを再密封し、成長室で苗を再インキュベートします(ステップ3.11注を参照)。
10. 細菌増殖アッセイ
- ステップ9.10のサンプルを使用して、ビーズビーターを使用して10 mMMgCl2で1〜2分間組織を均質化します。組織が十分に浸食されていない場合は、再び均質化する。
注:多くのメーカーは、ビーズビーターホモジナイザーを製造しています。ビーズの数と種類、およびホモジナイザの時間と速度(プログラム可能な場合)は、ホモジナイザーの種類ごとに最適化する必要があります。均質化中にサンプルが過熱しないようにしてください。 - ステップ10.1から浸食した組織を含む各チューブに10mMMgCl2の800 μLを加え、数回反転して混合します。
- マルチチャンネルピペットを使用して、各サンプルのシリアル希釈液を96ウェルプレート(10 0、10-1、10-2、10 -3、10-4、10-5)で調製します(図2A)。
- マルチチャネルピペットを使用した各希釈シリーズのピペット5 μLは、シクロヘキシミドを有するKB寒天プレート(150mm x 15 mm)に、目的とする細菌株に適した選択を行う(ステップ4.8注を参照)。プレートを完全に乾燥させます。
- プレートを36時間28°Cで逆さまにインキュベートし、解剖顕微鏡を使用してプレート上のコロニーを視覚化(図2B)し、コロニーが数えるのに十分な大きさであるかどうかを判断します。
注:コロニーが十分に大きくない場合は、プレートを再インキュベートし、数時間ごとにコロニーのサイズを再確認してください。典型的には、コロニーは、インキュベーション後に〜36〜48時間の個数である。

図2:細菌増殖アッセイを苗に用いるための連続希釈液。(A)感染した植物からのマセレートされた葉組織は、コロニーカウントの前に希釈される。希釈は、96ウェルプレートで行われる(100は希釈されていない)。一般的に、希釈は 10-1から 10-5に作成されます。(B)細菌コロニーカウントのためのめっき希釈剤。希釈シリーズの各カラムの合計5 μLは、最も希薄なものから最も濃縮まで、メッキされます。コロニーが完全に乾燥した後、プレートは36〜48時間28°Cでインキュベートされ、コロニーは10倍の解剖顕微鏡で数えられる。この図の大きなバージョンを表示するには、ここをクリックしてください。
- コロニーが結合する前に、解剖顕微鏡で数える(図2B)。100未満のコロニーを持つ希釈シリーズプレートからコロニーを数えます。
- コロニーカウント(図2B)を得た後、苗の組織の0.01gにカウントを正規化し、細菌増殖をログに変換する(表1)。
注:1つのマネーメーカー-PtoSコチルドンの平均質量は0.01 gであり、経験的に22を決定します。
| 遺伝子型1列 A | 組織重量 (g) Bカラム | スポット列C内のコロニーの数 | スポット2カラム D の希釈係数 | 調整されたコロニーの数 3列 E | シリアル希釈用希釈係数列F | コロニー列Gの合計数(cfu/0.01 g)4 | コロニーの平均数 (cfu/0.01 g) 列 H | 平均ログ成長率 (cfu/0.01 g (ログ10)) 列 I |
| サンプル 1 | 0.004 g | 10 | 200 | 計算: (C2 x 0.01 g) / B2 = 25 | 1000 | 計算: (D2 x E2 X F2) = 5000000 | サンプル1から最後のサンプルの平均:(すなわち平均G1:G3)=7000000 | 平均すなわちのログ。ログ(H2) = 6.85 |
| サンプル 2 | 0.003 g | 15 | 200 | 50 | 1000 | 10000000 | ||
| サンプル 3 | 0.002 g | 6 | 200 | 30 | 1000 | 6000000 | ||
| 13つのサンプルに関するデータ | ||||||||
| 2めっき 5 μL x 200 をベースに 1 mL | ||||||||
| 3コチルドンはコアには小さすぎるので、コロニー数は1つのMoneyMaker -PtoS cotyledonの平均質量に基づいて組織の0.01 gに正規化されました(データは示されていません) | ||||||||
| 4メッキされた容積に基づいてmL当たり調節される | ||||||||
表1:細菌増殖アッセイの苗を採取するためのサンプル計算サンプル計算は、細菌数を正規化し、ログ細菌の増殖を決定する方法を示しています。
- 野生のアクセスや複雑な遺伝的背景を持つ他の線については、セクション11に記載されているように、個々の苗の細菌増殖のレベルを表現型と相関させる。
11. 抵抗のためのフェノタイピング
- 成長室からプレートを取り出し、7-14日後に死(病気による)または生存(抵抗による)のために個々の苗を表現します。
- フェノタイプ植物は、洪水接種後7〜10日で、PstDC3000などの非常に毒性の高い株に感染した。
- フェノタイプ植物は、洪水の接種後10〜14日でPstT1に感染した。
- 観察された抵抗型の範囲に基づいてスコアリングシステムを決定する。品種、アイソジェニックライン、および野生のアクセスに対するバイナリ型を、中間抵抗型に対して一貫した強い(図4A,4B)と記録する。
- 苗木が表現型の時間枠内で円錐形のメリステムから新しい成長を示す場合は、生存期間としてカウントします。苗が茶色の円状のメリステムを持ち、新しい緑色の栄養成長を示さない場合は、それを死として数えます(図3)。

図3:トマト苗の模式図。トマトの苗の異なる部分は、低血糖、コチルレドン、エピコチル、シュートアパイオメリステム、および真の葉を含む描かれています。この図の大きなバージョンを表示するには、ここをクリックしてください。
- F2 マッピング集団などの集団の疾患スペクトルに対して、幅広い耐性表現型を記録する (図 4C)。
- 病気の症状や死の出現について苗を注意深く監視し、表現型に適したウィンドウを特定します。
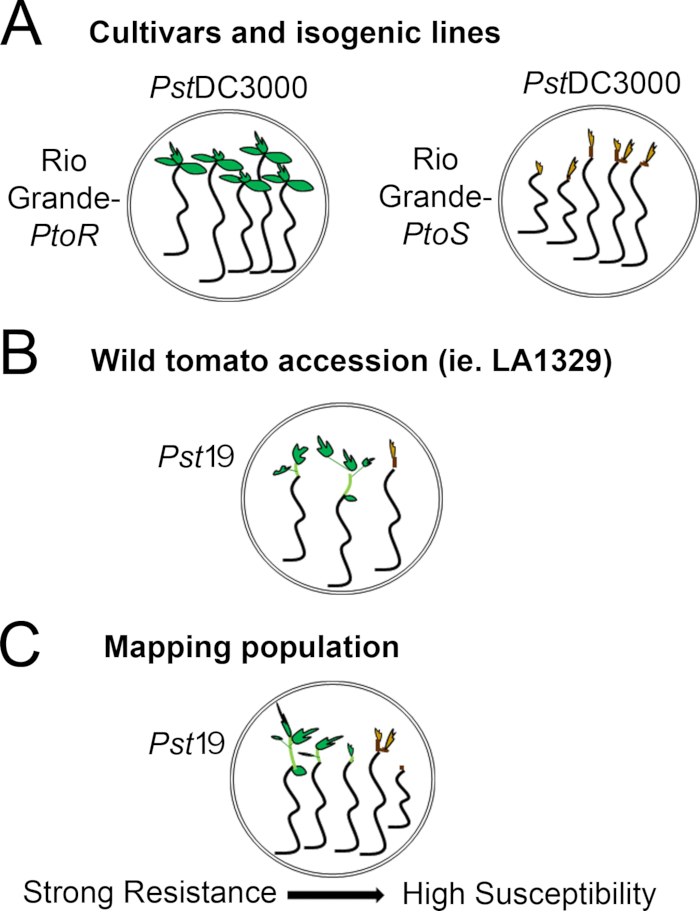
図4:様々な遺伝的背景における苗耐性および死に対する予測表現の概略的表現。(A)リオグランデ-PtoRの苗とほぼ同種の品種リオグランデ-プトスはPstDC3000(OD600 = 0.005)+0.015%界面活性剤で洪水の7日後に表示されます。リオグランデ-PtoRは一貫した抵抗を表示し、リオグランデ- PtoSは、PstDC3000での感染に一貫した感受性を表示します。これらの線は、離散型とバイナリ型を生じさせる。(B)ソラナム・ネオリッキー LA1329 などの野生のアポンションの苗は、Pst1(OD600 = 0.0075) + 0.015% 界面活性剤であふれた10日後に示されます。苗は表現型の変動を示すが、バイナリ表現型として記録された。フェノミティ可変の量と、フェノタイピングの方法(バイナリ抵抗または抵抗スペクトル)は、試験された特定のアクセスに依存します。(C) 野生の侵入を受けやすい品種に対して放出されるマッピング集団は、F2分離集団においてより広いスペクトルの型素を示す可能性がある。この場合、スペクトル上の苗型を記録することが最も適切である可能性があります。マッピング集団から非常に影響を受けやすい苗は、PstT1が浸水すると早ければ7日目に死に対してフェノノタイプされる可能性があり、典型的には茶色の尖極性メリステムを示し、エピコチルの延長はほとんどなく、新しい緑色の栄養成長はありません。影響を受けやすい苗の素端メリステムは、より多くの時間のために緑色または非常に明るい茶色のままであり、エピコチルのいくつかの延長があり、10日目までに茶色になり、逮捕される栄養成長が非常に少ない可能性があります。個々の苗は、14日目までに新しく継続的な栄養成長の量に基づいて抵抗性を求めて定型することができます。苗は、弱い、中程度、または強い抵抗などの抵抗の異なるカテゴリに上記の表現型に基づいてグループ化することができます。この図の大きなバージョンを表示するには、ここをクリックしてください。
アクセスが制限されています。このコンテンツを表示するにはログインするか、トライアルを開始してください。
結果
苗抵抗アッセイを用いた品種および等原性ラインにおけるPtoR媒介性免疫の検出
図 5は、PstDC3000 が氾濫した後の Moneymaker-PtoRおよび Moneymaker-PtoSカルティバーの代表的な結果を示しています。感染前に、10日齢の苗木が完全に出現し、拡大されたコチルドンと新興の最初の真の葉。苗は、マイナスコントロール(データは示されていない)として10 mM MgCl2 + 0.015%界面活性剤と0.005+0.015%界面活性剤の光学密度でPstDC3000であふれました。苗は、洪水の7~10日後にフェノタイプされた(図5)。Moneymaker-PtoRや Moneymaker-PtoSのような、典型的な均質なラインからの個々の苗は、苗の洪水アッセイで非常に一貫したバイナリ表現型を与える。Pto/...
アクセスが制限されています。このコンテンツを表示するにはログインするか、トライアルを開始してください。
ディスカッション
トマト苗のこれらの細菌株に対する耐性を検出するように最適化されたPstDC3000またはPstT1による洪水接種のプロトコルについて説明します。苗の抵抗性アッセイにおいて最適な結果を得るためのいくつかの重要なパラメータがあり、細菌濃度および界面活性剤濃度を含む、経験的に22を決定した。PstDC3000の場合、光学密度は、Pto/Prfクラスタを含む耐性品種上で完全な生存を達成し、Pto/Prfクラスタ22を欠いている感受性の品種上で完全死を達成するように最適化された。耐性品種が知られていないPstT1のような株については、光学密度は、一貫した完全な植物死22のために可能な限り低くなるように最適化された。Uppalapatiら24は、PstDC3000の病因とコロナチンの病理機能を調べるためのトマト苗アッセイを設計した。この...
アクセスが制限されています。このコンテンツを表示するにはログインするか、トライアルを開始してください。
開示事項
著者らは開示するものは何もない。
謝辞
メディアボリュームが病気や抵抗の結果に及ぼす影響をテストしてくれたジェイミー・カルマに感謝します。ルイス・ラボのマエル・ボーディン博士とカール・J・シャイバー博士が、原稿に関する建設的なコメントや提案をしてくれたことに感謝します。ルイス研究所における植物免疫に関する研究は、USDA ARS 2030-21000-046-00Dおよび2030-21000-050-00D(JDL)とNSF生物科学局IOS-1557661(JDL)によって支えられていました。
アクセスが制限されています。このコンテンツを表示するにはログインするか、トライアルを開始してください。
材料
| 名前 | 会社 | カタログ番号 | コメント |
|---|---|---|---|
| 3Mテープ微細孔1/2 "x 10 YD CS 240(1.25 cm x 9.1 m) | VWRインターナショナル | 56222-182 | |
| 3mmホウケイ酸ガラスビーズ | フリードリッヒ&Dimmock | GB3000B | |
| Bacto Peptone | BD | 211677 | |
| Bacto agar | BD | 214010 | |
| Biophotometer Plus | Eppendorf | E952000006 | |
| Biosafety cabinet, class II type A2 | |||
| BRAND Disposable Plastic Cuvettes, ポリスチレン | VWR International | 47744-642 | |
| シェニールクラフトフラットウッドつまようじVWR | インターナショナル | 500029-808 | |
| シクロヘキシミド | 研究製品インターナショナル | C81040-5.0 | |
| 塩基性リン酸カリウム無水、ACSグレード | フィッシャーサイエンティフィック | P288-500 | |
| ジメチルホルムアミド | |||
| 解剖顕微鏡(少なくとも10倍の倍率) | |||
| エタノール - 190プルーフ | |||
| ファルコンポリスチレン96ウェルマイクロプレート、平底 | フィッシャーサイエンティフィック | 08-772-3 | |
| ガラスアルコールバーナー ウィック | フィッシャーサイエンティフィック | S41898A / No. W-125 | |
| ガラスアルコールバーナー | フィッシャーサイエンティフィ | S41898 / No.BO125 | |
| グリセロールACS試薬 | VWRインターナショナル | EMGX0185-5 | |
| キンバリークラーク&貿易;キムテックサイエンス&貿易;キムワイプ&トレード;デリケートタスクワイパーフィ | ッシャーサイエンティフィック | 06-666-A | |
| 塩化マグネシウム、ACSグレード | VWRインターナショナル | 97061-356 | |
| 硫酸マグネシウム七水和物、ACSグレード | VWRインターナショナル | 97062-130 | |
| マイクロ遠心チューブ、1.5mL | |||
| 遠心チューブ、2.2mL | |||
| ミニビーズビーター-96、115ボルト | バイオスペックプロダクツ株式会社 | 1001 | |
| 村重 &Skoog、基礎塩 | ケーソン研究所株式会社 | MSP01-50LT | |
| Pipet-Lite XLS LTS 8-CH ピペット 20-200uL | レイニン | L8-200XLS | |
| Pipet-Lite XLS LTS 8-CH ピペット 2-20uL | レイニン | L8-20XLS | |
| ポリスチレン 100mm x 25mm 滅菌ペトリ皿 | VWR インターナショナル | 89107-632 | |
| ポリスチレン 150mm x 15mm 滅菌ペトリ皿 | フィッシャーサイエンティフィック | FB08-757-14 | |
| ポリスチレン 150x15mm 滅菌ペトリ皿 | フィッシャーサイエンティフィック | 08-757-148 | |
| ピュアブライト殺菌性超漂白剤 5.7% 利用可能 塩素 (100% 漂白剤と定義) | ステープル | ||
| リファンピシン | ゴールド バイオテクノロジー | R-120-25 | |
| シルウェット L-77 (非イオン性有機シリコーン界面活性剤 共重合体 C13H34O4Si3界面活性剤) | Fisher Scientific | NCO138454 | |
| Tips LTS 20 μL 960/10 GPS-L10 | レイニン | 17005091 | |
| チップ LTS 250 μL 960/10 GPS-L250 | ニン | 17005093 | |
| VWR解剖鉗子ファインチップ、4.5インチ | VWRインターナショナル | 82027-386 |
参考文献
- Underwood, W., Melotto, M., He, S. Y. Role of plant stomata in bacterial invasion. Cell Microbiology. 9 (7), 1621-1629 (2007).
- Zipfel, C. Early molecular events in PAMP-triggered immunity. Current Opinion in Plant Biology. 12 (4), 414-420 (2009).
- Galan, J. E., Wolf-Watz, H. Protein delivery into eukaryotic cells by type III secretion machines. Nature. 444 (7119), 567-573 (2006).
- Lewis, J. D., Desveaux, D., Guttman, D. S. The targeting of plant cellular systems by injected type III effector proteins. Seminars in Cell and Developmental Biology. 20 (9), 1055-1063 (2009).
- Schreiber, K. J., Baudin, M., Hassan, J. A., Lewis, J. D. Die another day: molecular mechanisms of effector-triggered immunity elicited by type III secreted effector proteins. Seminars in Cell and Developmental Biology. 56, 124-133 (2016).
- Heath, M. C. Hypersensitive response-related death. Plant Molecular Biology. 44 (3), 321-334 (2000).
- Boyd, L. A., Ridout, C., O'Sullivan, D. M., Leach, J. E., Leung, H. Plant-pathogen interactions: disease resistance in modern agriculture. Trends in Genetics. 29 (4), 233-240 (2013).
- Pitblado, R. E., MacNeill, B. H. Genetic basis of resistance to Pseudomonas syringae pv. tomato in field tomatoes. Canadian Journal of Plant Pathology. 5 (4), 251-255 (1983).
- Pedley, K. F., Martin, G. B. Molecular basis of Pto-mediated resistance to bacterial speck disease in tomato. Annual Reviews of Phytopathology. 41, 215-243 (2003).
- Ronald, P. C., Salmeron, J. M., Carland, F. M., Mehta, A. Y., Staskawicz, B. J. The cloned avirulence gene AvrPto induces disease resistance in tomato cultivars containing the Pto resistance gene. Journal of Bacteriology. 174 (5), 1604-1611 (1992).
- Martin, G. B., et al. Map-based cloning of a protein kinase gene conferring disease resistance in tomato. Science. 262 (5138), 1432-1436 (1993).
- Salmeron, J. M., Barker, S. J., Carland, F. M., Mehta, A. Y., Staskawicz, B. J. Tomato mutants altered in bacterial disease resistance provide evidence for a new locus controlling pathogen recognition. Plant Cell. 6 (4), 511-520 (1994).
- Salmeron, J. M., et al. Tomato Prf is a member of the leucine-rich repeat class of plant disease resistance genes and lies embedded within the Pto kinase gene cluster. Cell. 86 (1), 123-133 (1996).
- Scofield, S. R., et al. Molecular basis of gene-for-gene specificity in bacterial speck disease of tomato. Science. 274 (5295), 2063-2065 (1996).
- Kunkeaw, S., Tan, S., Coaker, G. Molecular and evolutionary analyses of Pseudomonas syringae pv. tomato race 1. Molecular Plant-Microbe Interactions. 23 (4), 415-424 (2010).
- Cai, R., et al. The plant pathogen Pseudomonas syringae pv. tomato is genetically monomorphic and under strong selection to evade tomato immunity. PLoS Pathogens. 7 (8), 1002130(2011).
- Almeida, N. F., et al. A draft genome sequence of Pseudomonas syringae pv. tomato T1 reveals a type III effector repertoire significantly divergent from that of Pseudomonas syringae pv. tomato DC3000. Molecular Plant-Microbe Interactions. 22 (1), 52-62 (2009).
- Lin, N. C., Abramovitch, R. B., Kim, Y. J., Martin, G. B. Diverse AvrPtoB homologs from several Pseudomonas syringae pathovars elicit Pto-dependent resistance and have similar virulence activities. Applied and Environmental Microbiology. 72 (1), 702-712 (2006).
- Rose, L. E., Langley, C. H., Bernal, A. J., Michelmore, R. W. Natural variation in the Pto pathogen resistance gene within species of wild tomato (Lycopersicon). I. Functional analysis of Pto alleles. Genetics. 171 (1), 345-357 (2005).
- Thapa, S. P., Miyao, E. M., Davis, R. M., Coaker, G. Identification of QTLs controlling resistance to Pseudomonas syringae pv. tomato race 1 strains from the wild tomato Solanum habrochaites LA1777. Theoretical and Applied Genetics. 128 (4), 681-692 (2015).
- Bao, Z. L., et al. Identification of a candidate gene in Solanum habrochaites for resistance to a race 1 strain of Pseudomonas syringae pv. tomato. Plant Genome. 8 (3), 1-15 (2015).
- Hassan, J. A., Zhou, Y. J., Lewis, J. D. A rapid seedling resistance assay identifies wild tomato lines that are resistant to Pseudomonas syringae pv. tomato race 1. Molecular Plant-Microbe Interactions. 30 (9), 701-709 (2017).
- King, E. O., Ward, M. K., Raney, D. E. Two simple media for the demonstration of pyocyanin and fluorescin. Journal of Laboratory and Clinical Medicine. 44 (2), 301-307 (1954).
- Uppalapati, S. R., et al. Pathogenicity of Pseudomonas syringae pv. tomato on tomato seedlings: phenotypic and gene expression analyses of the virulence function of coronatine. Molecular Plant-Microbe Interactions. 21 (4), 383-395 (2008).
- Bhardwaj, V., Meier, S., Petersen, L. N., Ingle, R. A., Roden, L. C. Defence responses of Arabidopsis thaliana to infection by Pseudomonas syringae are regulated by the circadian clock. PLoS One. 6 (10), 26968(2011).
- Lu, H., McClung, C. R., Zhang, C. Tick tock: circadian regulation of plant innate immunity. Annual Review of Phytopathology. 55, 287-311 (2017).
- Wang, W., et al. Timing of plant immune responses by a central circadian regulator. Nature. 470 (7332), 110-114 (2011).
アクセスが制限されています。このコンテンツを表示するにはログインするか、トライアルを開始してください。
再版と許可
訂正
Formal Correction: Erratum: High-Throughput Identification of Resistance to Pseudomonas syringae pv. Tomato in Tomato using Seedling Flood Assay
Posted by JoVE Editors on 10/18/2023. Citeable Link.
An erratum was issued for: High-Throughput Identification of Resistance to Pseudomonas syringae pv. Tomato in Tomato using Seedling Flood Assay. The Introduction, Protocol, Representative Results and Discussion sections were updated.
The last paragraph of the Introduction section was updated from:
In the seedling flood assay described in this protocol, tomato seedlings are grown on Petri dishes of sterile Murashige and Skoog (MS) media for 10 days and then are flooded with an inoculum containing the bacteria of interest and a surfactant. Following flooding, seedlings can be quantitatively evaluated for disease resistance via bacterial growth assays. Additionally, seedling survival or death can act as a discrete resistance or disease phenotype 7–14 days after flooding. This approach offers a high-throughput alternative for screening large numbers of wild tomato accessions for resistance to Pst race 1 strains, such as Pst strain T1 (PstT1), and can easily be adapted to other bacterial strains of interest.
to:
In the seedling flood assay described in this protocol, tomato seedlings are grown on Petri dishes of sterile Murashige and Skoog (MS) media for 10 days and then are flooded with an inoculum containing the bacteria of interest and a surfactant. Following flooding, seedlings can be quantitatively evaluated for disease resistance via bacterial growth assays. Additionally, seedling survival or death can act as a discrete resistance or disease phenotype 7–14 days after flooding. This approach offers a high-throughput alternative for screening large numbers of wild tomato accessions for resistance to Pst race 1 strains, such as Pst strain 19 (Pst19), and can easily be adapted to other bacterial strains of interest.
Step 4.8 of the Protocol section was updated from:
- After 1 h, transfer the bottle to the biosafety cabinet and under aseptic conditions, add 1,600 µL of sterile 1 M MgSO4, and appropriate antibiotics to the media.
NOTE: For rifampicin resistant strains PstDC3000 and PstT1, use rifampicin dissolved in dimethylformamide at a final concentration of 50 µg/mL. Use cycloheximide dissolved in ethanol at a final concentration of 50 µg/mL to prevent fungal growth on the plates.
to:
- After 1 h, transfer the bottle to the biosafety cabinet and under aseptic conditions, add 1,600 µL of sterile 1 M MgSO4, and appropriate antibiotics to the media.
NOTE: For rifampicin resistant strains PstDC3000 and Pst19, use rifampicin dissolved in dimethylformamide at a final concentration of 50 µg/mL. Use cycloheximide dissolved in ethanol at a final concentration of 50 µg/mL to prevent fungal growth on the plates.
Step 5.2 of the Protocol section was updated from:
- Patch bacteria (i.e., PstT1) from a glycerol stock onto KB agar with appropriate antibiotics (section 4).
to:
- Patch bacteria (i.e., Pst19) from a glycerol stock onto KB agar with appropriate antibiotics (section 4).
Step 5.6 of the Protocol section was updated from:
- For PstT1, incubate the KB plate at 28 ˚C for 48 h prior to using bacteria in the flood experiment.
to:
- For Pst19, incubate the KB plate at 28 ˚C for 48 h prior to using bacteria in the flood experiment.
Step 6 of the Protocol section was updated from:
6. Preparation of PstT1 inoculum
to
6. Preparation of Pst19 inoculum
Step 6.2 of the Protocol section was updated from:
- Perform serial dilutions using sterile 10 mM MgCl2 solution in the biosafety cabinet. For PstT1, use a spectrophotometer to make inoculum with a starting concentration of OD600 = 0.1.
to:
- Perform serial dilutions using sterile 10 mM MgCl2 solution in the biosafety cabinet. For Pst19, use a spectrophotometer to make inoculum with a starting concentration of OD600 = 0.1.
Step 6.3 of the Protocol section was updated from:
- For PstT1, make a 1/10 dilution from the initial resuspension at OD600 = 0.1 to obtain a serial dilution at a concentration of OD600 = 0.01.
to:
- For Pst19, make a 1/10 dilution from the initial resuspension at OD600 = 0.1 to obtain a serial dilution at a concentration of OD600 = 0.01.
Step 8.3 of the Protocol section was updated from:
- Set a timer for 3 min. Measure 6 mL of final inoculum (PstT1 OD600 = 0.0075 [section 6] or PstDC3000 OD600 = 0.005 [section 7]) and transfer 6 mL of inoculum to each plate with the 10-day-old seedlings.
to:
- Set a timer for 3 min. Measure 6 mL of final inoculum (Pst19 OD600 = 0.0075 [section 6] or PstDC3000 OD600 = 0.005 [section 7]) and transfer 6 mL of inoculum to each plate with the 10-day-old seedlings.
Step 8.11 of the Protocol section was updated from:
- Phenotype after 7–10 days for PstDC3000 or 10–14 days for PstT1 (section 11). If carrying out bacterial growth assays, collect leaf tissue after 4 days (sections 9 and 10) and then phenotype (section 11). Alternatively, perform phenotypic analysis and bacterial growth assays on separate sets of plants.
to:
- Phenotype after 7–10 days for PstDC3000 or 10–14 days for Pst19 (section 11). If carrying out bacterial growth assays, collect leaf tissue after 4 days (sections 9 and 10) and then phenotype (section 11). Alternatively, perform phenotypic analysis and bacterial growth assays on separate sets of plants.
Step 10.7 of the Protocol section was updated from:
- After obtaining colony counts (Figure 2B), normalize the counts to 0.01 g of tissue for seedlings and convert to log bacterial growth (Table 1).
NOTE: The average mass of one Moneymaker-PtoS cotyledon is 0.01 g and is empirically determined22.
| Genotype1 Column A | Tissue Weight (g) Column B | # of Colonies in a spot Column C | Dilution factor for spot2 Column D | Adjusted # of Colonies3 Column E | Dilution factor for serial dilution Column F | Total # of Colonies Column G (cfu/0.01 g)4 | Average # of Colonies (cfu/0.01 g) Column H | Average Log Growth (cfu/0.01 g (log10)) Column I |
| Sample 1 | 0.004 g | 10 | 200 | calculated as: (C2 x 0.01 g) / B2 = 25 | 1000 | calculated as: (D2 x E2 x F2) = 5000000 | average for sample 1 through last sample: (ie. average G1:G3) = 7000000 | log of average ie. log(H2) = 6.85 |
| Sample 2 | 0.003 g | 15 | 200 | 50 | 1000 | 10000000 | ||
| Sample 3 | 0.002 g | 6 | 200 | 30 | 1000 | 6000000 | ||
| 1Data shown for 3 samples | ||||||||
| 2Based on plating 5 µL x 200 for 1 mL | ||||||||
| 3Cotyledons are too small to core so colony counts were normalized to 0.01 g of tissue based on the average mass of one MoneyMaker-PtoS cotyledon (data not shown) | ||||||||
| 4Adjusted per mL based on volume plated | ||||||||
Table 1: Sample calculations for seedling bacterial growth assay. Sample calculations demonstrate how to normalize bacterial counts and determine log bacterial growth.
to:
- After obtaining colony counts (Figure 2B), normalize the counts to 0.1 g of tissue for seedlings and convert to log bacterial growth (Table 1).
NOTE: The average mass of one Moneymaker-PtoS cotyledon is 0.1 g and is empirically determined22.
| Genotype1 Column A | Tissue Weight (g) Column B | # of Colonies in a spot Column C | Dilution factor for spot2 Column D | Adjusted # of Colonies3 Column E | Dilution factor for serial dilution Column F | Total # of Colonies Column G (cfu/0.01 g)4 | Average # of Colonies (cfu/0.01 g) Column H | Average Log Growth (cfu/0.1 g (log10)) Column I |
| Sample 1 | 0.04 g | 10 | 200 | calculated as: (C2 x 0.1 g) / B2 = 25 | 1000 | calculated as: (D2 x E2 x F2) = 5000000 | average for sample 1 through last sample: (ie. average G1:G3) = 7000000 | log of average ie. log(H2) = 6.85 |
| Sample 2 | 0.03 g | 15 | 200 | 50 | 1000 | 10000000 | ||
| Sample 3 | 0.02 g | 6 | 200 | 30 | 1000 | 6000000 | ||
| 1Data shown for 3 samples | ||||||||
| 2Based on plating 5 µL x 200 for 1 mL | ||||||||
| 3Cotyledons are too small to core so colony counts were normalized to 0.1 g of tissue based on the average mass of one MoneyMaker-PtoS cotyledon (data not shown) | ||||||||
| 4Adjusted per mL based on volume plated | ||||||||
Table 1: Sample calculations for seedling bacterial growth assay. Sample calculations demonstrate how to normalize bacterial counts and determine log bacterial growth.
Step 11.3 of the Protocol section was updated from:
- Phenotype plants infected with PstT1 at 10–14 days after flood inoculation.
to:
- Phenotype plants infected with Pst19 at 10–14 days after flood inoculation.
Figure 4 in the Protocol section was updated from:
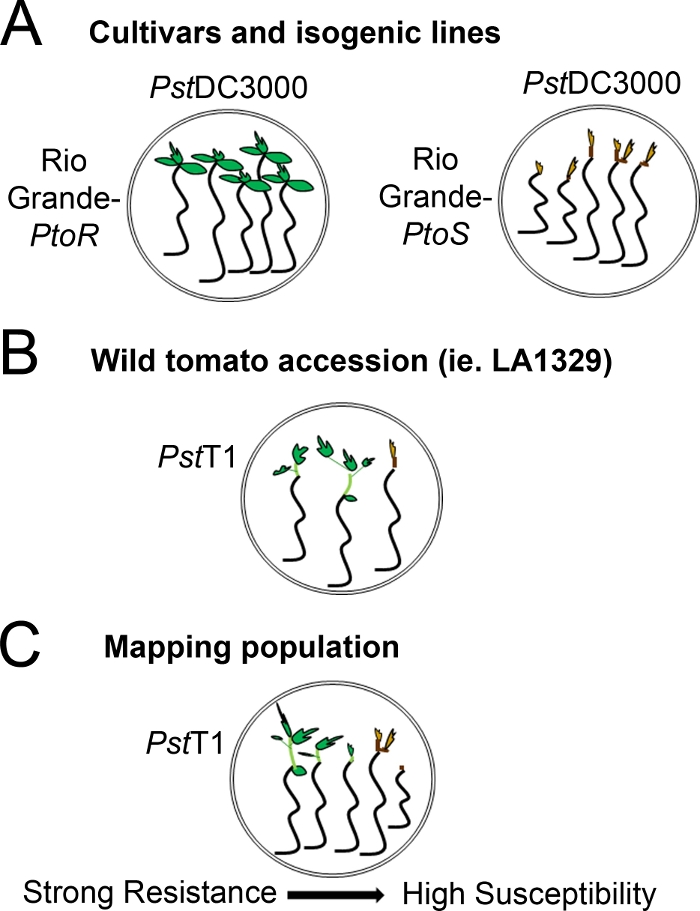
Figure 4: Schematic representation of expected phenotypes for seedling resistance and death in various genetic backgrounds. (A) Seedlings of Rio Grande-PtoR and the near-isogenic cultivar Rio Grande-PtoS are displayed 7 days after flooding with PstDC3000 (OD600 = 0.005) + 0.015% surfactant. Rio Grande-PtoR displays consistent resistance, and Rio Grande-PtoS displays consistent susceptibility to infection with PstDC3000. These lines give rise to discrete and binary phenotypes. (B) Seedlings of a wild accession, such as Solanum neorickii LA1329, are shown 10 days after flooding with PstT1 (OD600 = 0.0075) + 0.015% surfactant. Seedlings display phenotypic variability but were recorded as binary phenotypes. The amount of phenotypic variability and the method of phenotyping (binary resistance or resistance spectrum) will depend on the particular accession tested. (C) Mapping populations generated by outcrossing wild accessions to susceptible cultivars may display a wider spectrum of phenotypes in F2 segregating populations. In this case, it may be most appropriate to record seedling phenotypes on a spectrum. Highly susceptible seedlings from a mapping population may be phenotyped for death as early as day 7 when flooded with PstT1, and typically show a brown apical meristem, no to very little extension of the epicotyl, and no new, green vegetative growth. The apical meristem of susceptible seedlings may stay green or very light brown for more time, and there may be some extension of the epicotyl and very little vegetative growth, which turns brown and arrests by day 10. Individual seedlings can be phenotyped for resistance based on the amount of new and ongoing vegetative growth by day 14. Seedlings can then be grouped based on the phenotypes described above into different categories of resistance such as weak, medium, or strong resistance. Please click here to view a larger version of this figure.
to:
Figure 4: Schematic representation of expected phenotypes for seedling resistance and death in various genetic backgrounds. (A) Seedlings of Rio Grande-PtoR and the near-isogenic cultivar Rio Grande-PtoS are displayed 7 days after flooding with PstDC3000 (OD600 = 0.005) + 0.015% surfactant. Rio Grande-PtoR displays consistent resistance, and Rio Grande-PtoS displays consistent susceptibility to infection with PstDC3000. These lines give rise to discrete and binary phenotypes. (B) Seedlings of a wild accession, such as Solanum neorickii LA1329, are shown 10 days after flooding with Pst19 (OD600 = 0.0075) + 0.015% surfactant. Seedlings display phenotypic variability but were recorded as binary phenotypes. The amount of phenotypic variability and the method of phenotyping (binary resistance or resistance spectrum) will depend on the particular accession tested. (C) Mapping populations generated by outcrossing wild accessions to susceptible cultivars may display a wider spectrum of phenotypes in F2 segregating populations. In this case, it may be most appropriate to record seedling phenotypes on a spectrum. Highly susceptible seedlings from a mapping population may be phenotyped for death as early as day 7 when flooded with Pst19, and typically show a brown apical meristem, no to very little extension of the epicotyl, and no new, green vegetative growth. The apical meristem of susceptible seedlings may stay green or very light brown for more time, and there may be some extension of the epicotyl and very little vegetative growth, which turns brown and arrests by day 10. Individual seedlings can be phenotyped for resistance based on the amount of new and ongoing vegetative growth by day 14. Seedlings can then be grouped based on the phenotypes described above into different categories of resistance such as weak, medium, or strong resistance. Please click here to view a larger version of this figure.
The second paragraph of the Representative Results section was updated from:
Phenotypic screening of wild accessions using the seedling resistance assay
Figure 6 shows representative results for seedlings of susceptible and resistant accessions 10–14 days after flooding with PstT1. Susceptible accessions include RG-PtoR, S. pimpinellifolium LA1375, and S. pimpinellifolium LA1606, and resistant accessions include S. neorickii LA1329. Ten-day-old seedlings were flooded with 10 mM MgCl2 + 0.015% surfactant as a negative control, and PstT1 at an optical density of 0.0075 + 0.015% surfactant. The seedlings were phenotyped at least 10 days after flooding, as PstT1-infected seedlings died more slowly than PstDC3000-infected seedlings. Mock-inoculated seedlings were green, healthy, and actively growing. This control is important to ensure that the accessions are not sensitive to the concentration of surfactant, and to ensure there is no bacterial contamination. Susceptible accessions (Rio Grande-PtoR [n = 7], S. pimpinellifolium LA1375 [n = 7], and S. pimpinellifolium LA1606 [n = 5]) were dead, had brown apical meristems, and lacked new growth 10–14 days after inoculation with PstT1. In contrast, two S. neorickii LA1329 (n = 3) seedlings displayed a high level of new, green growth and survived infection with PstT1 (Figure 6). Three LA1329 seedlings did not germinate. Typically, 5–7 individuals were screened for each accession in a primary screen to determine the prevalence of resistance in the population. When a more genetically complex wild accession, such as LA1329, is flooded with PstT1, the resistance phenotypes display slightly more variability among individual seedlings, compared to Moneymaker-PtoR treated with PstDC3000. However, the resistance phenotypes were usually less variable than those seen in F2 mapping populations. Thus, binary phenotyping criteria was used for LA1329.
to:
Phenotypic screening of wild accessions using the seedling resistance assay
Figure 6 shows representative results for seedlings of susceptible and resistant accessions 10–14 days after flooding with Pst19. Susceptible accessions include RG-PtoR, S. pimpinellifolium LA1375, and S. pimpinellifolium LA1606, and resistant accessions include S. neorickii LA1329. Ten-day-old seedlings were flooded with 10 mM MgCl2 + 0.015% surfactant as a negative control, and Pst19 at an optical density of 0.0075 + 0.015% surfactant. The seedlings were phenotyped at least 10 days after flooding, as Pst19-infected seedlings died more slowly than PstDC3000-infected seedlings. Mock-inoculated seedlings were green, healthy, and actively growing. This control is important to ensure that the accessions are not sensitive to the concentration of surfactant, and to ensure there is no bacterial contamination. Susceptible accessions (Rio Grande-PtoR [n = 7], S. pimpinellifolium LA1375 [n = 7], and S. pimpinellifolium LA1606 [n = 5]) were dead, had brown apical meristems, and lacked new growth 10–14 days after inoculation with Pst19. In contrast, two S. neorickii LA1329 (n = 3) seedlings displayed a high level of new, green growth and survived infection with Pst19 (Figure 6). Three LA1329 seedlings did not germinate. Typically, 5–7 individuals were screened for each accession in a primary screen to determine the prevalence of resistance in the population. When a more genetically complex wild accession, such as LA1329, is flooded with Pst19, the resistance phenotypes display slightly more variability among individual seedlings, compared to Moneymaker-PtoR treated with PstDC3000. However, the resistance phenotypes were usually less variable than those seen in F2 mapping populations. Thus, binary phenotyping criteria was used for LA1329.
Figure 6 in the Representative Results section was updated from:
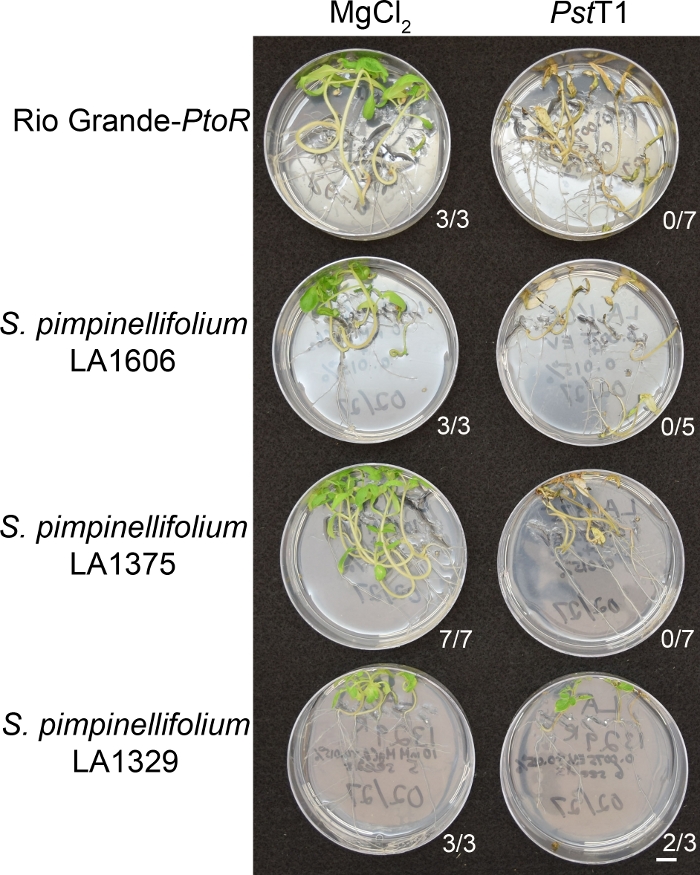
Figure 6: Phenotypic characterization of resistance or disease symptoms 10–14 days post-infection in wild accessions. Rio Grande-PtoR, S. pimpinellifolium LA1606, S. pimpinellifolium LA1375 and S. neorickii LA1329 tomato seedlings were grown on 0.5x MS plates for 10 days, and then flooded with PstT1 (OD600 = 0.0075) + 0.015% surfactant. The number of surviving seedlings for each wild accession out of the total number tested is shown. Scale bar = 1 cm. Please click here to view a larger version of this figure.
to:
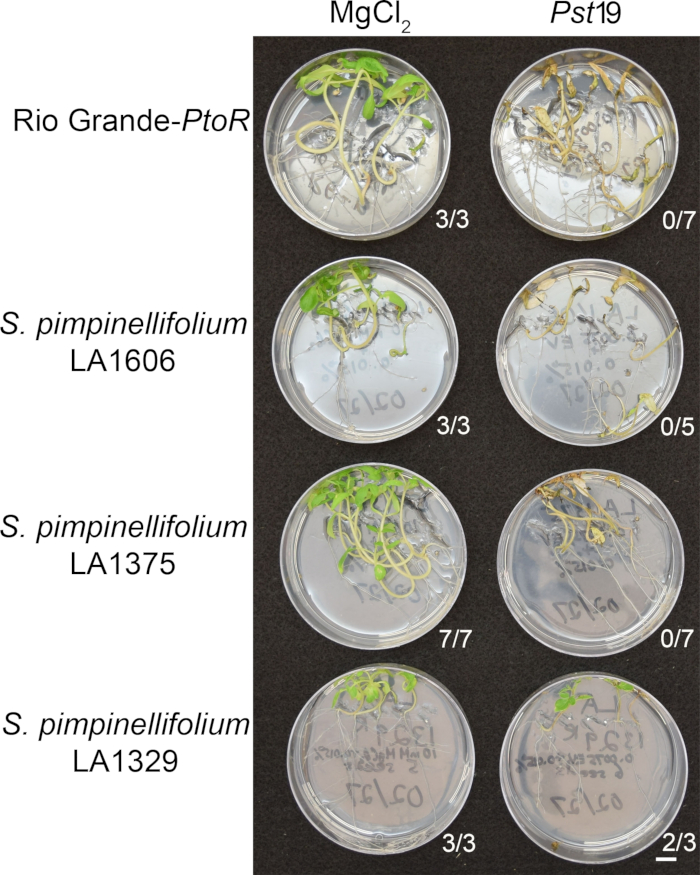
Figure 6: Phenotypic characterization of resistance or disease symptoms 10–14 days post-infection in wild accessions. Rio Grande-PtoR, S. pimpinellifolium LA1606, S. pimpinellifolium LA1375 and S. neorickii LA1329 tomato seedlings were grown on 0.5x MS plates for 10 days, and then flooded with Pst19 (OD600 = 0.0075) + 0.015% surfactant. The number of surviving seedlings for each wild accession out of the total number tested is shown. Scale bar = 1 cm. Please click here to view a larger version of this figure.
The third paragraph of the Representative Results section was updated from:
Quantitative assessment of bacterial growth using the seedling flood assay
To confirm that the observed resistance in LA1329 to PstT1 resulted in lower bacterial growth, bacterial growth assays were carried out in tomato seedlings. The level of PstT1 growth in Moneymaker-PtoS and S. neorickii LA1329 was determined 4 days post-infection. Moneymaker-PtoS is a near-isogenic line with consistent susceptibility among individual seedlings. Wild accessions such as S. neorickii LA1329 are often more genetically complex. LA1329 displays approximately 60% resistance to PstT1 across the population22. Because seedlings may drop their cotyledons after infection, one seedling was grown on each plate to correlate bacterial growth in the harvested cotyledon with overall seedling survival or death as determined phenotypically at least 10 days after flooding. The bacterial counts on day 4 for each seedling were normalized to 0.01 g of tissue and converted to log growth (CFU/0.01 g(log10)). Log growth for phenotypically resistant LA1329 seedlings (LA1329RES) or phenotypically susceptible seedlings (LA1329SUS) were separately pooled and compared to each other and the susceptible cultivar Moneymaker-PtoS. For example, there was a 1.7 log difference in bacterial growth between LA1329RES (log 6.3) and LA1329SUS (log 8.0), and a 1.6 log difference between LA1329RES (log 6.3) and Moneymaker-PtoS (log 7.9) (Figure 7). Therefore, phenotypic resistance correlated with quantitative resistance in the seedling assays.
to:
Quantitative assessment of bacterial growth using the seedling flood assay
To confirm that the observed resistance in LA1329 to Pst19 resulted in lower bacterial growth, bacterial growth assays were carried out in tomato seedlings. The level of Pst19 growth in Moneymaker-PtoS and S. neorickii LA1329 was determined 4 days post-infection. Moneymaker-PtoS is a near-isogenic line with consistent susceptibility among individual seedlings. Wild accessions such as S. neorickii LA1329 are often more genetically complex. LA1329 displays approximately 60% resistance to Pst19 across the population22. Because seedlings may drop their cotyledons after infection, one seedling was grown on each plate to correlate bacterial growth in the harvested cotyledon with overall seedling survival or death as determined phenotypically at least 10 days after flooding. The bacterial counts on day 4 for each seedling were normalized to 0.01 g of tissue and converted to log growth (CFU/0.01 g(log10)). Log growth for phenotypically resistant LA1329 seedlings (LA1329RES) or phenotypically susceptible seedlings (LA1329SUS) were separately pooled and compared to each other and the susceptible cultivar Moneymaker-PtoS. For example, there was a 1.7 log difference in bacterial growth between LA1329RES (log 6.3) and LA1329SUS (log 8.0), and a 1.6 log difference between LA1329RES (log 6.3) and Moneymaker-PtoS (log 7.9) (Figure 7). Therefore, phenotypic resistance correlated with quantitative resistance in the seedling assays.
Figure 7 in the Representative Results section was updated from:
x
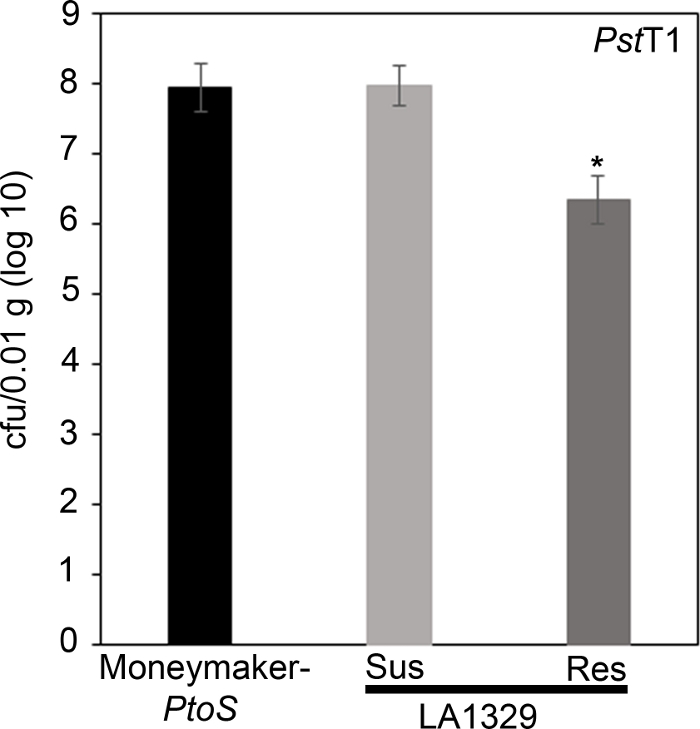
Figure 7: Resistant Solanum neorickii LA1329 seedlings support lower bacterial growth than Moneymaker-PtoS or susceptible S. neorickii LA1329. Bacterial counts were determined 4 days post-inoculation from S. neorickii LA1329 (n = 14) and Moneymaker-PtoS (n = 10) seedlings infected with PstT1 and normalization was performed to 0.01 g of tissue. For LA1329, the two phenotypic groups, susceptible (SUS) or resistant (RES), were observed and counted separately. Above the bar * = statistically significant difference determined by a one-factor analysis of variance. A general linear model procedure (p < 0.001) followed by a multiple comparison of means using Tukey's post hoc test was used. Error bars = standard error. The figure indicates one representative experiment. Please click here to view a larger version of this figure.
x
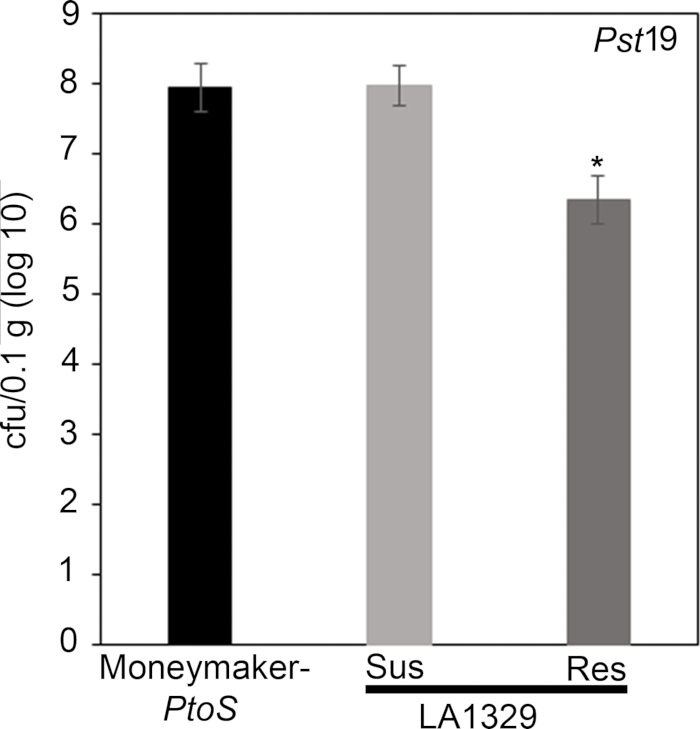
Figure 7: Resistant Solanum neorickii LA1329 seedlings support lower bacterial growth than Moneymaker-PtoS or susceptible S. neorickii LA1329. Bacterial counts were determined 4 days post-inoculation from S. neorickii LA1329 (n = 14) and Moneymaker-PtoS (n = 10) seedlings infected with Pst19 and normalization was performed to 0.1 g of tissue. For LA1329, the two phenotypic groups, susceptible (SUS) or resistant (RES), were observed and counted separately. Above the bar * = statistically significant difference determined by a one-factor analysis of variance. A general linear model procedure (p < 0.001) followed by a multiple comparison of means using Tukey's post hoc test was used. Error bars = standard error. The figure indicates one representative experiment. Please click here to view a larger version of this figure.
The first paragraph of the Discussion section was updated from:
A protocol for flood inoculation with PstDC3000 or PstT1 optimized to detect resistance to these bacterial strains in tomato seedlings is described. There are several critical parameters for optimal results in the seedling resistance assay, including bacterial concentration and surfactant concentration, which were empirically determined22. For PstDC3000, the optical density was optimized to achieve complete survival on a resistant cultivar containing the Pto/Prf cluster and complete death on a susceptible cultivar lacking the Pto/Prf cluster22. For a strain such as PstT1, where there are no known resistant varieties, the optical density was optimized to be the lowest possible for consistent and complete plant death22. Uppalapati et al.24 designed a tomato seedling assay to investigate the pathogenesis of PstDC3000 and the virulence function of coronatine. In this virulence assay, infections were performed using bacteria concentrated to an OD600 of 0.124, 20x higher than the optical density of strains used in our resistance assay. Recognition of PstDC3000 effectors AvrPto and AvrPtoB in tomato seedlings carrying the Pto/Prf gene cluster results in ETI and a macroscopic HR22. In the context of a strong immune response such as ETI, a lower bacterial titer was used for PstDC3000 to avoid overwhelming genetic resistance from the Pto/Prf gene cluster22. In addition, these results suggest that a high bacterial concentration could overwhelm weaker immune responses such as PTI or quantitative partial resistance, where multiple genes contribute to the overall phenotype. Surfactant is necessary for the bacteria to adhere to the leaf surface; however, high concentrations can cause chlorosis of the leaf22. We previously tested a range of surfactant concentrations to empirically determine the ideal concentration in 10-day-old tomato seedlings22. When testing new species that may differ in their sensitivity to surfactant, the surfactant concentration should be optimized to identify a concentration that does not cause damage or chlorosis in the absence of bacteria. Appropriate assay conditions will require optimization of a surfactant concentration that does not cause damage, and a bacterial concentration that causes disease in all susceptible controls.
to:
A protocol for flood inoculation with PstDC3000 or Pst19 optimized to detect resistance to these bacterial strains in tomato seedlings is described. There are several critical parameters for optimal results in the seedling resistance assay, including bacterial concentration and surfactant concentration, which were empirically determined22. For PstDC3000, the optical density was optimized to achieve complete survival on a resistant cultivar containing the Pto/Prf cluster and complete death on a susceptible cultivar lacking the Pto/Prf cluster22. For a strain such as Pst19, where there are no known resistant varieties, the optical density was optimized to be the lowest possible for consistent and complete plant death22. Uppalapati et al.24 designed a tomato seedling assay to investigate the pathogenesis of PstDC3000 and the virulence function of coronatine. In this virulence assay, infections were performed using bacteria concentrated to an OD600 of 0.124, 20x higher than the optical density of strains used in our resistance assay. Recognition of PstDC3000 effectors AvrPto and AvrPtoB in tomato seedlings carrying the Pto/Prf gene cluster results in ETI and a macroscopic HR22. In the context of a strong immune response such as ETI, a lower bacterial titer was used for PstDC3000 to avoid overwhelming genetic resistance from the Pto/Prf gene cluster22. In addition, these results suggest that a high bacterial concentration could overwhelm weaker immune responses such as PTI or quantitative partial resistance, where multiple genes contribute to the overall phenotype. Surfactant is necessary for the bacteria to adhere to the leaf surface; however, high concentrations can cause chlorosis of the leaf22. We previously tested a range of surfactant concentrations to empirically determine the ideal concentration in 10-day-old tomato seedlings22. When testing new species that may differ in their sensitivity to surfactant, the surfactant concentration should be optimized to identify a concentration that does not cause damage or chlorosis in the absence of bacteria. Appropriate assay conditions will require optimization of a surfactant concentration that does not cause damage, and a bacterial concentration that causes disease in all susceptible controls.
The third paragraph of the Discussion section was updated from:
Pst is a foliar pathogen that preferentially colonizes the aerial parts of tomato seedlings, including the cotyledons24 (Figure 3). Therefore, qualitative phenotyping in the seedling flood assay focuses on growth and disease symptoms in aerial portions of the seedling, and tissue for the bacterial growth assay is sampled from the cotyledons for quantitative analysis. After flood inoculation, seedlings may die within 7–10 days after inoculation with PstDC3000 or 10–14 days after inoculation with PstT1, as discussed in section 11. Seedling death is visualized by a brown apical meristem, arrested epicotyl elongation, and/or arrested vegetative growth. If different bacterial strains are used, the timing will have to be empirically determined. In addition, the progression of disease on control plants should be monitored daily after flooding until a consistent time frame from the onset of disease symptoms to seedling death can be identified. Depending on the genotypes and treatments used in the flood assay, seedling phenotypes can be recorded as binary phenotypes or on a disease spectrum (Figure 4). A broader spectrum of phenotypes may be observed when flood inoculating F2 mapping populations from wild tomato accessions crossed to susceptible cultivars (Figure 4C). It may be best to phenotype segregating populations on a disease spectrum depending on how quickly the seedling dies and the degree of new vegetative growth and branching (Figure 4C). The seedling flood assay can also be used in conjunction with the seedling bacterial growth assay to quantitatively assess levels of bacterial growth associated with qualitative phenotypes in individual seedlings (Figure 7). Very large reductions (i.e., ~log 3) in bacterial growth or strong resistance in resistant seedlings of a wild accession compared to a susceptible cultivar suggest that the underlying genetic basis of resistance may be due to ETI22. Smaller reductions in bacterial growth (i.e., ~log 1.7), as observed in LA1329 seedlings, may be due to the contribution of weaker resistance from quantitative trait loci and/or PTI. Thus, the seedling growth assay can be an important tool in further characterizing resistance in wild tomato lines.
to:
Pst is a foliar pathogen that preferentially colonizes the aerial parts of tomato seedlings, including the cotyledons24 (Figure 3). Therefore, qualitative phenotyping in the seedling flood assay focuses on growth and disease symptoms in aerial portions of the seedling, and tissue for the bacterial growth assay is sampled from the cotyledons for quantitative analysis. After flood inoculation, seedlings may die within 7–10 days after inoculation with PstDC3000 or 10–14 days after inoculation with Pst19, as discussed in section 11. Seedling death is visualized by a brown apical meristem, arrested epicotyl elongation, and/or arrested vegetative growth. If different bacterial strains are used, the timing will have to be empirically determined. In addition, the progression of disease on control plants should be monitored daily after flooding until a consistent time frame from the onset of disease symptoms to seedling death can be identified. Depending on the genotypes and treatments used in the flood assay, seedling phenotypes can be recorded as binary phenotypes or on a disease spectrum (Figure 4). A broader spectrum of phenotypes may be observed when flood inoculating F2 mapping populations from wild tomato accessions crossed to susceptible cultivars (Figure 4C). It may be best to phenotype segregating populations on a disease spectrum depending on how quickly the seedling dies and the degree of new vegetative growth and branching (Figure 4C). The seedling flood assay can also be used in conjunction with the seedling bacterial growth assay to quantitatively assess levels of bacterial growth associated with qualitative phenotypes in individual seedlings (Figure 7). Very large reductions (i.e., ~log 3) in bacterial growth or strong resistance in resistant seedlings of a wild accession compared to a susceptible cultivar suggest that the underlying genetic basis of resistance may be due to ETI22. Smaller reductions in bacterial growth (i.e., ~log 1.7), as observed in LA1329 seedlings, may be due to the contribution of weaker resistance from quantitative trait loci and/or PTI. Thus, the seedling growth assay can be an important tool in further characterizing resistance in wild tomato lines.
The fourth paragraph of the Discussion section was updated from:
Typically, genetic screens have been performed on four- to five-week-old adult tomato plants to identify the genetic basis of P. syringae resistance in wild accessions20,21. Adult tomato plants require much longer growth times, require more space in the growth chamber, and are much larger plants, which means that usually few individuals are screened for each line. The seedling flood assay provides a powerful, alternative approach in the identification of P. syringae resistance in wild tomato accessions. Screening at the seedling stage permits a large sample size to be tested which can be particularly advantageous in detecting resistance in genetically complex populations. Reduced growth chamber space requirements and growth time facilitate a high-throughput approach and rapid detection of natural resistance in wild accessions to emerging pathogens. Furthermore, P. syringae resistance that was identified at the seedling stage in this assay is not restricted to the developmental stage. S. neorickii LA1329 and S. habrochaites LA1253 were initially identified at the seedling stage and also display resistance to PstT1 in adult plants as previously described22.
to:
Typically, genetic screens have been performed on four- to five-week-old adult tomato plants to identify the genetic basis of P. syringae resistance in wild accessions20,21. Adult tomato plants require much longer growth times, require more space in the growth chamber, and are much larger plants, which means that usually few individuals are screened for each line. The seedling flood assay provides a powerful, alternative approach in the identification of P. syringae resistance in wild tomato accessions. Screening at the seedling stage permits a large sample size to be tested which can be particularly advantageous in detecting resistance in genetically complex populations. Reduced growth chamber space requirements and growth time facilitate a high-throughput approach and rapid detection of natural resistance in wild accessions to emerging pathogens. Furthermore, P. syringae resistance that was identified at the seedling stage in this assay is not restricted to the developmental stage. S. neorickii LA1329 and S. habrochaites LA1253 were initially identified at the seedling stage and also display resistance to Pst19 in adult plants as previously described22.
