本プロトコルでは、Baiduのヒートマップデータ、POI(ポイント・オブ・インタレスト)、ストリートビュー画像、およびマルチスケール地理的加重回帰を統合し、都市の活力を定量化することで、中国の煙台市における都市の空間構造が昼夜の活力パターンにどのように影響するかを評価します。
この記事について
サマリー
要約
都市の空間構造が都市の活力にどのような影響を与えるかを理解することは、人間中心の都市計画戦略を策定する上で不可欠です。しかし、これらの関係における空間的な不均一性や、昼夜の活力に対する異なる都市空間構造要素の相対的な寄与については、いまだ十分に解明されていません。本研究は、中国の煙台市の中心市街地を対象に、都市の活力を定量化し、都市空間構造がその時空間的変動にどのように影響するかを調査することを目的としました。Baiduヒートマップデータ、POI(Points of Interest)、ストリートビュー画像、道路ネットワーク、建物情報、および土地利用データを含むマルチソース空間データセットを統合し、都市の活力と都市空間構造を特徴づけました。都市の活力の空間分布および都市空間構造変数のスケール依存的な影響を評価するために、カーネル密度推定、空間自己相関分析、およびマルチスケール地理的加重回帰(MGWR)を用いました。その結果、都市の活力は、複合的な「中心ー周辺」および「一核多点」パターンを特徴とする顕著な空間的極性を示し、有意な正の空間自己相関が認められました。都市空間構造の影響は、空間的および昼夜間で大きく異なっていました。昼間の活力においてはPOIの多様性と近接性が支配的な要因であったのに対し、夜間の活力においては居住機能とPOIの多様性が最大の影響を及ぼしていました。歩行可能性は、昼夜両方の期間において一貫して都市の活力と正の相関を示しており、人間中心の街路環境の重要性が浮き彫りとなりました。これらの知見は、都市の活力を評価するためにマルチソース空間データとMGWRを統合することの価値を証明し、エビデンスに基づいた都市計画と空間最適化を支援するための実用的なフレームワークを提供するものです。
概要
都市の活力は、持続可能な都市開発のレベル、住民の生活の質、および高品質な都市建設の有効性を測定するための核心的な指標である。そのため、都市地理学ならびに都市計画および地域計画の研究者の間で、長らく多大な関心を集めてきた。1,2段階的な都市化と急速な空間拡大の過程において、不均衡な都市空間開発に伴う問題がますます顕著になっている。非効率な土地利用配分、環境汚染、交通渋滞、そして職住分離のような根深い都市課題が、近隣地域の活力を弱め続けている。3現在、中国は都市化の新たな段階に入っており、都市開発の焦点は粗放的な「都市建設」から精緻な「都市管理」へと移行し、人間中心の空間開発が重要な優先事項となっています。人間中心のスケールでは、住民が直接的に知覚できる微小空間単位に焦点を当てており、これは従来の区画や近隣住区スケールの分析を拡張し、精緻化したものです。18世紀以来、th 中国共産党全国代表会議において、人間中心の開発は国土空間ガバナンスの基本原則となり、生活環境の質の向上は都市計画の主要な目標となりました。このような背景から、都市の活力における時空間パターンの正確な特性評価を行い、人間中心の構築環境が活力に影響を及ぼす異質的なメカニズムを明らかにすることは、街路レベルの都市再開発や近隣住区の改善を含む、精緻な計画実践のための科学的根拠を提供し得ます。同時に、煙台市は第14次th 第14次5ヵ年計画において、2021年に住居和都市・農村建設部により最初の国家都市更新パイロット都市の一つに選定され、2026年には都市更新のための追加的な中央財政支援を受けた。これらの政策的および財政的な優位性は、煙台の既存の都市空間の質を向上させ、沿岸都市に特有の都市更新戦略を模索し、それによって高品質な都市発展を促進するための好条件となっている。
都市の活力(urban vitality)という概念は、アメリカの学者ジェーン・ジェイコブスによって最初に提唱されました。彼女は、機能的な多様性、小規模な街区、異なる築年数の建物、そして高密度という4つの要素が、活気ある都市にとって不可欠な条件であると論じました4。初期の研究では、主にフィールド調査やアンケート調査に基づいた理論的枠組みが構築されていましたが、その後の研究では徐々にマイクロスケールへと移行し、人間活動の空間的な集中に焦点が当てられるようになりました5。また、きめ細かな時間的ダイナミクスと空間的変動が、都市の活力を理解する上で重要な役割を果たすことが多くの証拠によって示されています6。高解像度の地理空間ビッグデータの急速な発展により、都市の活力を大規模かつ動的にモニタリングする新たな機会が生まれました。その結果、研究者は携帯電話のシグナリングデータ、位置トラジェクタリ、ソーシャルメディアのチェックイン、ヒートマップデータ、およびPOI(ポイント・オブ・インタレスト)を含むマルチソースデータセットを活用し、異なる空間単位における人間活動の強度を定量化し、マルチスケールで都市の活力を調査することが増えています7,8,9,10,11,12。これらのデータソースの中で、ヒートマップデータは人口集中の空間分布と時間的ダイナミクスを正確に捉えることができ、区画、街区、および都市スケールでの都市の活力を定量化するために広く適用されてきました13,14,15。例えば、Wang Chenggangら16は、ヒートマップデータを用いて広州中心部の活力パターンを特定し、建築環境の非線形関係と閾値効果を定量化し、平日の時間帯による影響の違いを区別することで、都市の活力研究に貴重な実証的根拠を提供しました。
都市の活力は、人間の活動を収容する都市空間構造によって根本的に形成され、制約を受けます。都市空間構造が都市の活力に影響を与えるメカニズムを理解することは、精緻な都市計画やエビデンスに基づく都市統治にとって重要な指針となります。既存の研究では、都市規模、機能配置、空間形態、コンパクトさ、社会経済的特性を包含する、都市空間構造の多次元的な評価システムが構築されてきました。これらの研究により、立地条件、人口密度、建物の形態、土地利用の混合、施設の多様性、経済発展、機能の多様性、街路構成、アクセシビリティ、および歩行適性が、都市の活力の空間的分化に影響を与える主要な要因であることが一貫して示されています17,18,19,20,21,22。しかしながら、これまでの研究の多くは、物理的、社会的、場所ベースの空間および移動空間の間のマクロスケールの関係に焦点を当てており、人間中心のスケールにおける精緻な分析への注目は比較的限定的でした。マルチソースのオープン地理空間データと知的分析アルゴリズムに基づく新たな研究パラダイムは、このより微細なスケールでの空間知覚と定量的分析に新たな機会を提供します23。機械学習技術とストリートビュー画像の分析を統合することで、このアプローチは広範な空間的カバー範囲と人間中心の分析精度を両立させると同時に、従来の空間評価手法に伴う主観性や精度の限界を軽減します。手法面では、先行研究では主に最小二乗法や地理的加重回帰モデルを用いて、建築環境と都市の活力との関係を検証してきました24,25。しかし、これらの手法は一般的に静的な空間特性に焦点を当てており、都市空間構造と都市の活力との関係における空間的な異質性と昼夜の時間的な分化の両方を見落としがちです。
要約すると、都市の活力に関する研究は、伝統的なマクロスケールの理論的調査から、地理空間ビッグデータに裏付けられた時空間的な定量分析へと進化してきました。それにもかかわらず、重要な限界が依然として存在します。既存の研究では、物理的な空間特性のマクロレベルでの定量化が引き続き重視されており、都市の空間構造が都市の活力にどのように影響を与えるかという時空間的な不均一性については、相対的に十分な関心が払われていません。さらに、人間の知覚次元を組み込んだ精緻な測定手法は依然として限られており、既存のアプローチでは、街路レベルの都市再開発などの詳細な計画実務を支援する能力が制限されています。これらの知識の空白に基づき、本研究では以下の仮説を提案します。(1) 都市の空間構造は、都市の活力に対して時空間的に差別化された重要な影響を及ぼす。(2) 都市の活力に対する都市空間構造指標の影響は、顕著な空間的非定常性を示す。
本研究の主要な革新性は3点あります。第一に、Baiduヒートマップデータやストリートビュー画像を含むマルチソースの地理空間データセットを統合することで、住民の日々の活動という視点から都市の活力を定量化し、人間中心のスケールでの精緻かつ客観的な測定を可能にした点です。従来の「5D」フレームワークに基づき、本研究では人間知覚の次元を組み込み、機能性、建築形態、アクセシビリティ、社会経済的特性、生態空間、および人間知覚からなる6次元の都市空間構造指標体系を構築しました。このフレームワークは、主に物理的な空間変数や社会経済的変数を強調していた先行研究の限界を解消し、マクロスケールの空間分析とミクロスケールの人間中心の測定の統合を可能にします。第二に、本研究ではマルチスケール地理的加重回帰(MGWR)モデルを採用し、従来の回帰アプローチにおけるグローバルな定常性の仮定を克服した点です。このモデルにより、局所的な空間効果および都市空間構造と昼夜の都市活力との間のスケール依存的な関係の特定が可能となり、それによって都市空間構造と都市活力の間の時空間的な非定常な結合関係が明らかになりました。第三に、代表的な沿岸都市である煙台を事例として、沿岸都市の空間的特性という文脈の中で、昼夜の都市活力を駆動する差別化されたメカニズムを人間中心の視点から体系的に調査した点です。本研究の知見は、同様の沿岸都市における空間最適化、都市活力の向上、および都市再生のための実証的根拠と手法的な枠組みを提供するものであり、同時に、人間中心で精緻な都市空間ガバナンスを支援するための定量的な根拠を提示しています。
プロトコル
This study used anonymized and aggregated heatmap data at the spatial grid level. The data do not contain personal identifiers or individual-level information, and no human subjects were directly involved. Therefore, ethics approval, exemption, or institutional review was not required.
Research Framework
To explore the influence mechanism of urban spatial structure under the human-centered scale on the spatiotemporal differentiation of urban vitality, this study proposes a research framework as shown in Figure 1. Firstly, based on the heat map data measuring the spatiotemporal attributes of daily and nighttime urban activities of urban residents, the daily and nighttime urban vitality of the main urban area of Yantai City is measured; secondly, a multidimensional urban spatial structure index system including functionality, accessibility, architectural form, social economy, ecological space, and human perception is constructed; finally, the MGWR model is used to reveal the influence mechanism of urban spatial structure on the spatiotemporal differentiation of urban vitality. Detailed workflows for data acquisition, preprocessing, indicator calculation, image analysis, and model implementation are provided in Supplementary Files 1–4, and the corresponding computational workflows are provided in Supplementary Codes 1–4. The aim is to provide a theoretical basis and reference for urban renewal and the creation of vibrant cities under the new urbanization strategy.
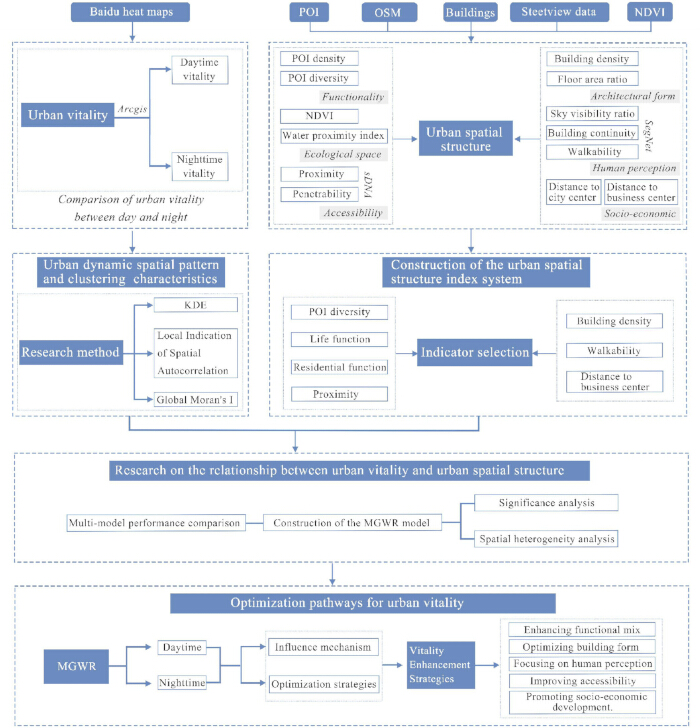
Figure 1. Research framework diagram. This diagram summarizes the complete analytical workflow, including multisource spatial data acquisition, data processing, urban spatial structure indicator construction, urban vitality measurement, multiscale geographically weighted regression (MGWR) modeling, and vitality optimization strategies. Please click here to view a larger version of this figure.
Overview of the Study Area
Yantai City is located in the northeastern part of the Shandong Peninsula, bordering the Yellow Sea and the Bohai Sea. It is an important port city in Shandong Province. It has five districts and six county-level cities under its jurisdiction, with a total area of 13,930.1 km2. This study selects the main urban area of Yantai City (Zhifu District) as the research area. The district covers 179.18 km2, has a registered population of 707,700, and comprises 12 subdistricts (Figure 2).
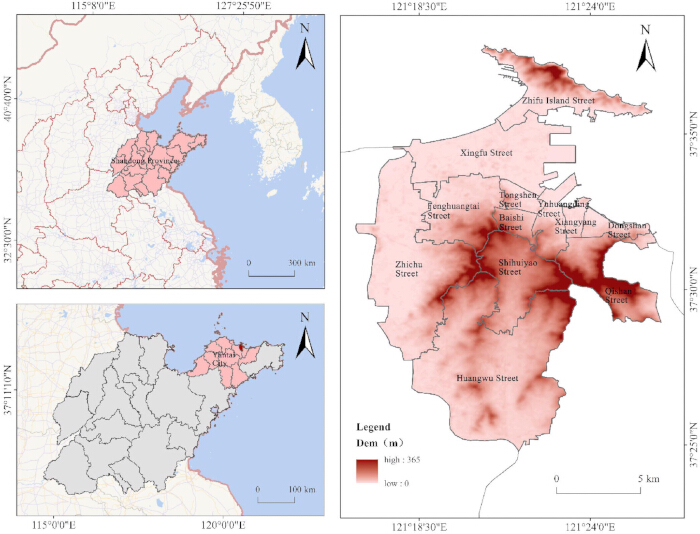
Figure 2. Schematic diagram of the study area. The maps show the location of Yantai City, the main urban study area in Zhifu District, subdistrict boundaries, and terrain elevation. Darker colors indicate higher elevation. Please click here to view a larger version of this figure.
Given that this study focuses on the urban core, where the study area is relatively small and the road network is dense, the traditional block scale is insufficient for accurately characterizing urban vitality. By contrast, the 300 m scale aligns closely with the spatial extent of the “5-minute living circle” and can better represent the basic spatial unit of residents’ daily activities. The selection of grid scale essentially involves a trade-off between information granularity and statistical stability: a smaller scale preserves more spatial details but reduces the sample size within each unit, increases statistical noise, and may fragment contiguous walking activity spaces, whereas a larger scale tends to smooth local variations and obscure spatial heterogeneity. A 300 m grid can retain fine-grained spatial characteristics while improving statistical stability and reducing analytical errors caused by scale selection. In addition, this scale is well matched to the spatial resolution of multisource data, including Baidu heatmap data, points of interest, and street-view imagery, thereby enhancing analytical accuracy and result reliability. Therefore, this study divided the research area into 2,221 cells using a 300 m × 300 m grid to visualize the spatiotemporal patterns of urban vitality at a fine scale and explore their relationship with urban spatial structure. The grid was generated in ArcGIS 10.4 using the Create Fishnet tool under the CGCS2000 three-degree Gauss coordinate system. The fishnet was anchored at the minimum XY coordinate of the study area and clipped to the study boundary, resulting in 2,221 analysis units.
Construction of the Indicator System
Constructing an index system for urban spatial structure is an important part of evaluating urban vitality. It reflects the comprehensive characteristics of a city in terms of spatial layout, functional mixture, accessibility, and related characteristics. This study is based on the “5D” theory of density, design, diversity, distance to transit, and destination accessibility. It expands the representation method of urban spatial structure elements on the basis of existing research and divides them into six categories and 15 factors: functionality, architectural form, accessibility, social economy, ecological space, and human perception. Each factor is analyzed individually (Table 1). The complete definitions, computational equations, parameter settings, preprocessing procedures, and normalization methods for all indicators are provided in Supplementary File 2.
Table 1: Urban spatial structure indicator system. The table summarizes the six dimensions and 15 indicators used to characterize urban spatial structure, including functionality, architectural form, accessibility, socioeconomic characteristics, ecological space, and human perception. Definitions and computational equations are provided for each indicator. Abbreviations: POI, point of interest; FAR, floor area ratio; NDVI, normalized difference vegetation index. Please click here to download this Table.
Among them, functionality is one of the important indicators for measuring urban spatial vitality, reflecting the degree of interconnection and integration between different functional areas. High functional mixture means that residential, economic, and living functional areas are evenly distributed and interwoven, thereby promoting human activities and enhancing urban vitality26. The evolution of architectural form is associated with vitality, and building density and floor area ratio are important indicators reflecting urban compactness. Accessibility directly affects the connectivity and transportation efficiency of urban space. This study selects proximity and permeability indicators to represent accessibility. Social economy reflects the concentration of economic activities and the level of regional economic development. The distance to the city center and commercial center is used to characterize socioeconomic activity, with shorter distances generally indicating more active economic activities27. Ecological space is an important factor affecting the economic, social, and cultural vitality of the city. This study uses the near-water index and normalized difference vegetation index (NDVI) to represent environmental quality and ecological vitality. Human perception focuses on the urban spatial forms and related environmental characteristics that residents frequently encounter in their daily lives, including urban public spaces and the external interfaces of buildings (such as streets, buildings, greenery, and parks) and their associated economic, social, and ecological impacts. In this study, building continuity, sky view factor, and walkability are selected to represent this dimension. These indicators better capture the contribution of human perception to urban vitality and complement conventional indicator systems that rely primarily on objective variables.
Notably, the measurement of traditional built environments differs fundamentally from the human-oriented urban spatial structure assessment adopted in this research. Traditional methods use macro-scale physical units, including land parcels and districts, as the analytical units. Relying on static datasets such as land-use classification, building footprints, and road network data, they quantify development intensity and functional layout. These conventional evaluations assess spatial physical conditions from a top-down planning perspective. While such methods accurately characterize the material attributes of urban space, they fail to capture residents’ on-site perceptions and micro-scale walking experiences. By contrast, the human-oriented framework shifts the research focus from inherent spatial attributes to human-environment interactions. This paradigm transformation includes three major changes. First, in terms of measurement content, the study extends beyond conventional physical indicators such as building density and land-use proportion by incorporating experiential dimensions including visual perception, walkability, safety, and comfort. Three corresponding indicators are selected in this study: building continuity, sky view factor, and walkability. Second, with regard to data sources, planning maps and remote sensing data are supplemented with street-view images and deep-learning semantic segmentation, which capture spatial characteristics from the eye-level perspective of pedestrians. Third, the analytical unit is further refined from the block scale to street segments or individual visual fields. It should be emphasized that the human-oriented measurement does not replace traditional built-environment evaluation but instead complements it by changing the research perspective and spatial scale. The two approaches differ in research focus, indicator system, analytical scale, and practical objectives, and together provide a comprehensive analytical framework for evaluating urban spatial structure.
Data Sources and Processing
Baidu Heatmap Data:
The urban thermal heat data adopted in this research originates from the open location service of Baidu Maps, which is generated by mining massive anonymous user behavioral records. The dataset captures real-time population distribution by aggregating location information from mobile app users and mapping such geographic coordinates onto spatial grids via real-time location service requests.
We retrieved heatmap data covering Yantai’s central urban area from June 13 to 17, 2022 (five consecutive working days) by invoking the API of the Baidu Map Open Platform (https://lbsyun.baidu.com/). Data was collected every 2 h from 07:00 to 24:00 each day. The complete workflow for data acquisition, preprocessing, denoising, temporal classification, spatial transformation, kernel density estimation, and urban vitality calculation is provided in Supplementary File 1, and the corresponding preprocessing script is provided in Supplementary Code 1. We further divided each day into daytime (07:00–18:00) and nighttime (18:00–24:00) periods to quantify diurnal variations in urban vitality separately. API requests included the Baidu Maps access key (AK) and a BD09-defined study-area boundary. The map zoom level was fixed at 16 with a tile size of 256 × 256 pixels, and the interface returned heat map data in JSON format. During post-processing, all BD09 coordinates were converted to the WGS84 coordinate system to ensure spatial accuracy and consistency for subsequent analyses. The remaining preprocessing workflow is provided in Supplementary File 1 and Supplementary Code 1. All spatial visualization was completed in ArcGIS (v10.4) (RRID: SCR_011081).
June represents early summer in Yantai, with mild weather conducive to outdoor activities, and residents’ daily travel patterns in this month reflect regular average activity levels. All sampling days were clear and cloudless, eliminating disturbances to human mobility caused by extreme weather and making population heatmaps suitable for identifying routine urban vitality patterns.
To verify the reliability of heatmap-derived vitality measurements, we incorporated NPP-VIIRS nighttime light data for cross-comparison. The nighttime light dataset was published by Chen Zuqi et al. in Earth System Science Data, entitled Cross-sensor calibrated extended time series of global NPP-VIIRS-like nighttime light data (2000–2018), and is publicly accessible via the Harvard Dataverse repository (https://dataverse.harvard.edu/dataset.xhtml?persistentId=doi:10.7910/DVN/YGIVCD).
Spatial comparison results demonstrated high consistency between hotspots of urban vitality identified from nighttime light imagery and the high- and low-vitality zones extracted from the heat map data in this study. The comparison between nighttime light intensity and heat map-derived urban vitality is presented in Supplementary Figure 1. To evaluate data reliability, outliers were first removed and the datasets were normalized before being reprojected to the WGS84 coordinate system. The nighttime light data were then resampled to a 300 m × 300 m grid using bilinear interpolation to ensure spatial alignment with the heat map data. Agreement between the two datasets was evaluated using the Pearson correlation coefficient (r ≥ 0.6) and the spatial overlap rate of LISA clusters (≥70%) as the acceptance criteria.
From the perspective of data sources, mobile-phone signaling data offer comprehensive population coverage and fine-grained trajectory information, but they are difficult to obtain and require complex preprocessing, making them less suitable for long-term, fine-scale studies. Social media check-in and review data, meanwhile, mainly capture consumption- and leisure-oriented activities, with pronounced behavioral bias and relatively poor temporal stability. In contrast, the Baidu heatmap data used in this study are easy to access, temporally continuous, and available at a higher spatial resolution, making them well suited for grid-scale monitoring of day–night vitality dynamics in the main urban area. Combined with POI and street-view data to enrich spatial attribute representation, this framework can more accurately reflect residents’ everyday activity patterns and is well aligned with the research scale and analytical objectives of this study.
Urban Spatial Structure Elements:
Basic Urban Spatial Data:
Based on the online map service interface, a total of 37,851 points of interest (POIs) were collected, spanning 11 functional categories, including accommodation, shopping, dining, residential areas, transportation infrastructure, daily-life facilities, sports and leisure venues, and public service facilities. Additional preprocessing procedures and computational details are provided in Supplementary File 2. POI data were retrieved in July 2024 using the Baidu Map API with a 500 m grid-based search strategy. During preprocessing, duplicate records were removed, and invalid records were excluded based on the Zhifu District administrative boundary, missing attribute labels, and substantial coordinate offsets to ensure the spatial accuracy and integrity of the dataset.
Urban building footprints and road network data were obtained from OpenStreetMap (OSM; RRID: SCR_007854), an open-source geospatial platform (https://www.openstreetmap.org). Land-use data were acquired from the National Basic Geographic Information Center (https://www.gscloud.cn/search).
As presented in Table 1, the spatial density of each facility type reflects the functional character of individual spatial units through clustering patterns; meanwhile, entropy values quantify the degree of functional diversity within each unit. The complete computational equations, preprocessing procedures, parameter settings, and normalization methods are provided in Supplementary File 2.
Building vector data were analyzed from both two-dimensional (2D) and three-dimensional (3D) perspectives to assess urban construction intensity—specifically, via building density and floor area ratio (FAR) metrics. Using the urban road network data, accessibility for each spatial unit was computed with the spatial design network analysis (sDNA) toolkit (RRID: SCR_017646)28, incorporating both proximity and betweenness indicators.
Selecting a 300-m radius as the analytical scale for this indicator, this distance is defined based on street segments and encompasses all topologically connected roads within the radius. This enables a comprehensive statistical analysis of changes in road network morphology—including corner density and node connectivity—within the designated spatial extent. The approach deliberately emphasizes local spatial correlation patterns among streets, thereby facilitating precise identification of highly connected streets at the block level—a methodological choice aligned with the theoretical framework of urban spatial vitality focused on the block scale29,30. A topological road network was constructed from OSM vector road data by collapsing bidirectional road segments into a single centerline. Accessibility was calculated using the sDNA plugin in ArcGIS 10.4 based on the proximity and betweenness indices, with grid-based POI totals applied as weights to represent spatial activity potential. All sDNA parameters were kept at their default values except for a user-defined search radius of 300 m. Moreover, this spatial scale corresponds closely to the “5-minute living circle” concept and is well matched to both the physical dimensions of historic blocks in Zhifu District, Yantai City, and the typical range of residents' daily walking activities.
Street View Image Data:
Combining OSM road network data with GIS technology, street-view image sampling points were laid out. Firstly, the centerlines of roads in the study area were extracted, and the two-way roads were simplified into single lines. Sampling points were evenly spaced at 50 m intervals along the centerlines of the roads. Then, all sampling points were assigned the same projection coordinate system used for the GIS analysis to ensure precise spatial position matching.
Using Python (RRID: SCR_008394), the Street View Image API (http://api.map.baidu.com/lbsapi/) was used to collect images. The complete acquisition workflow is provided in Supplementary File 3 and Supplementary Code 3. A total of 1,599 sampling points were generated. During image acquisition, the perspective width of each image was set to 90°, and the horizontal viewing angle was set to 0°. Images were collected in the front, back, left, and right directions at each sampling point, and image acquisition was performed only under clear weather conditions, without rain, snow, or heavy fog, to ensure image quality. Finally, the OpenCV program was used to stitch multidirectional images and optimize image transitions, generating panoramic images that achieved full-view coverage of the street spatial environment. The study area covered a total of 3,251 street segments. The API request parameters included the developer access key (AK), point coordinates, image viewpoint, and shooting orientation. Captured images were uniformly resized to 480 × 360 pixels (RGB) for subsequent analysis. Image quality was ensured through weather-based screening, multidirectional image acquisition, and subsequent SegNet-based semantic segmentation to verify image usability and extract street-view indicators.
We adopted the deep learning SegNet network (RRID: SCR_017042), a fully convolutional neural network, to extract streetscape features. The model classifies image pixels into five categories: sky, sidewalks, road lanes, buildings, and green space. The pixel classification results were then used to calculate the area proportion of each spatial element within every street-view image. Detailed model implementation, semantic segmentation workflow, validation procedures, and calculation of the human-perception indicators are provided in Supplementary File 3, Supplementary Code 2, and Supplementary Code 4. SegNet was implemented in PyTorch (v1.0) using publicly available pretrained weights trained on the MIT ADE20K dataset. During inference, images were processed individually to generate pixel-level semantic segmentation maps, which were subsequently used to calculate the proportional area of each streetscape element. Model performance was evaluated using five-fold cross-validation.
Research Methods
Quantitative Methods for Measuring Urban Vitality:
Kernel density analysis estimates the density of point or line features using a moving search window, enabling intuitive and accurate representation of the spatial clustering characteristics of urban elements and the concentration and dispersion of urban vitality. This study used kernel density estimation to perform continuous interpolation of heat map data to characterize the spatial aggregation of users and the spatiotemporal dynamics of urban vitality. Gaussian kernel density estimation was applied using a primary search radius (bandwidth) of 500 m. To evaluate the robustness of the results, eight additional bandwidths (200, 300, 400, 600, 700, 800, 900, and 1,000 m) were also tested, and the resulting mean RV values for each 300 m × 300 m grid cell showed high consistency across bandwidths. The interpolation used the Value field as the weighting variable, no edge correction was applied, and all kernel density analyses were performed in ArcGIS 10.4 (RRID: SCR_011081). Its mathematical expression is given as follows (Equation 1):
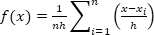 (1)
(1)
Here, n represents the number of data points; h is the bandwidth; and (x − xi) denotes the distance from the estimation point x to sample xi.
Analysis Method for Urban Dynamic Spatial Pattern:
Spatial autocorrelation is used to characterize the degree of spatial association among identical attribute values across different spatial units. It is divided into global autocorrelation and local autocorrelation.
Global Spatial Autocorrelation:
Global spatial autocorrelation (Global Moran’s I) was used to evaluate the degree of spatial association across the entire study area. It measures the similarity or correlation of variables in space by quantifying the relationship between the attribute value at one location and those of neighboring locations, represented by the Global Moran’s I coefficient. A spatial weights matrix was constructed using the 300 m × 300 m analysis grid with Queen contiguity to define neighboring units, and the weights were row-standardized. Global Moran’s I was calculated using the Spatial Statistics tools in ArcGIS 10.4 (RRID: SCR_011081), and statistical significance was assessed using the normal approximation (z-test) at the 95% confidence level. Its mathematical expression is given as follows (Equation 2):
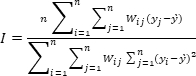 (2)
(2)
Here, I represents the autocorrelation index; n is the total number of study units; yi and yj are the classification indicators of regions i and j, respectively; y′ is the average of the classification indicators; and Wij is the spatial weight matrix representing the degree of association among different regions.
Local Spatial Autocorrelation:
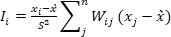
Local spatial autocorrelation (LISA) measures the degree of spatial association exhibited by the study object at the local level, allowing the identification of local clusters and spatial outliers within the study area and providing a more detailed understanding of spatial heterogeneity31. The most commonly used local statistic is Local Moran’s I. A spatial weights matrix was constructed using Queen contiguity, whereby neighboring grid cells were defined as those sharing either a common boundary or a vertex. Statistical significance was assessed at the 0.05 level using 999 random permutations. No multiple-testing correction was applied, and all analyses were performed using ArcGIS 10.4 (RRID: SCR_011081). The mathematical expression is given as follows (Equation 3):
 (3)
(3)
Here, xi and xj represent the urban vitality values of regions i and j, respectively; x′ is the mean urban vitality across all regions; S2 is the variance; and Wij is the spatial weight matrix representing the degree of spatial association between regions.
Research Methods for Spatial Heterogeneity of Urban Vitality:
Multiscale Geographically Weighted Regression (MGWR)
The MGWR model employs the Golden Section Search algorithm to iteratively narrow the search interval and identify the optimal bandwidth for each regression coefficient. This approach minimizes noise during parameter estimation and improves model predictive performance. Detailed information on the bandwidth selection method (adaptive or fixed), kernel function, bandwidth search range, convergence criteria, stopping tolerance, and predictor standardization procedures is provided in Supplementary File 4. The computation formula is as follows (Equation 4):
 (4)
(4)
Here, bwj represents the bandwidth used for the regression coefficient of the j-th variable; k denotes the number of explanatory variables; xij refers to the j-th predictor for the i-th grid; (ui, vi) represent the centroid coordinates of the i-th grid; β(bwj) is the regression coefficient estimated using the corresponding bandwidth; and εi is the random error term.
Detailed model configuration, bandwidth optimization procedures, and implementation workflow are provided in Supplementary File 4, while complete daytime and nighttime model outputs are available in Supplementary Files 5 and 6, respectively. Ordinary least squares regression diagnostics are provided in Supplementary File 7.
From the perspectives of urban development theory, research scope, and practical applicability, MGWR offers distinct advantages over both ordinary least squares regression (OLS) and conventional geographically weighted regression (GWR). OLS employs a global modeling framework, assuming uniform effects of all explanatory variables across the entire study area. This assumption overlooks the inherent spatial heterogeneity of urban systems, yielding averaged parameter estimates that often fail to capture localized realities and thus provide limited support for context-sensitive policy formulation. While traditional GWR accounts for spatial non-stationarity, it imposes a single bandwidth—that is, a uniform spatial scale—for all variables. This constraint contradicts empirical evidence indicating that different urban elements (e.g., transit infrastructure, land-use mix, or green space) exert influence over markedly different spatial extents. Consequently, such oversimplification may introduce model bias and compromise analytical validity. MGWR overcomes this limitation by estimating individual, variable-specific bandwidths based on the empirically observed spatial influence range of each predictor. As a result, it more faithfully captures the scale-dependent mechanisms through which urban spatial structure shapes urban vitality. This advancement not only enriches the theoretical understanding of human–environment interactions in cities but also enhances practical utility by enabling differentiated prioritization of spatial interventions and providing quantitative, evidence-based support for urban vitality enhancement. The computational workflows are provided in Supplementary Codes 1–4.
結果
都市活力の空間パターンの分析
都市活力の空間分布特性:
煙台市の中心市街地における昼夜の都市活力の時空間的進化をより詳細に検討するため、ヒートマップデータに基づくカーネル密度分析を実施し、住民の日常生活パターンと組み合わせて、地理情報システム(GIS)ソフトウェアを用いて異なる時間帯の都市活力を可視化した。図3に示すように、煙台市の中心市街地における都市活力は、07:00から23:00にかけて「集積ー分散ー集積」というパターンに特徴付けられる明確な時空間的ダイナミクスを示す。日中と夜間における高活力エリアおよび低活力エリアの空間分布は非常に類似しており、これらの時間帯間での都市活力の変動は比較的安定していることが示唆される。
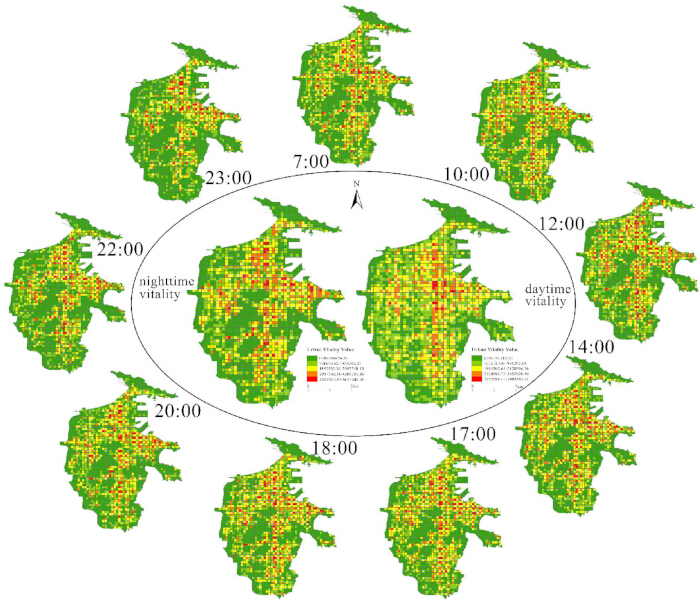
図 3。煙台市の中心市街地における都市活力の時空間分布。周辺の地図は異なる時点における都市活力を示し、中央の地図は昼間と夜間の活力パターンの要約を示している。暖色はより高い活力を示す。こちらのリンクをクリックして、この図の拡大版を表示してください。
空間的な視点から見ると、煙台市の主要市街地における都市活力は、概して北東部で高く南西部で低い傾向にあり、「中心-周辺」パターンと「マルチコア」構成の両方を特徴とする複雑な空間構造を示しています。都市活力が高いエリアは主に北東部に集中しており、同申街、玉皇頂街、襄陽街などの地域や、大海陽路および空港路沿いに見られます。加えて、直出街の東部や鳳凰台街の中央部でも活力は比較的高い状態にあります。また、煙台市の主要市街地における都市活力は、地形条件によっても強く影響を受けています。皇金頂、真山、金鉱頂などの中心地域の山岳地帯は、低活力ゾーンに分類されます。これらの地域では、日中はハイキングやレジャーなどの活動によって活力が多少高まりますが、夜間の活力は極めて低くなります。このパターンは、都市活力の分布に顕著な空間的格差があることを示しており、高密度住宅地やレクリエーション目的地、および交通アクセスの良い場所に集積する傾向があります。このような複合的な空間構造は、都市の機能的ゾーニングと人口移動の間の結合関係を裏付けています。さらに、地形と交通の重要な役割は、複数の都市空間構造が共同して都市活力を形成しているという仮説をさらに支持するものです。
時間的な視点から見ると、煙台市の中心市街地における都市の活力は、主に住民の就業およびレジャー活動によって形成されています。07:00から18:00までの時間帯は、朝のピーク時および日中の就業・学習時間をカバーしており、この間、住民は通常、自宅から職場へと通勤するため、都市活力の空間パターンは集積から分散へと移行します。18:00から23:00までの時間帯には、夜のピーク時とレジャー時間が含まれます。特に22:00以降は、都市活力の空間分布がより集中する一方で、活力レベル全体は低下します。これは、一方で住民が仕事やレジャー活動の後に帰宅し、もう一方で、それまで活発だった都市空間が夜に向けて徐々に静まり返るという実態を反映しています。全体として、都市活力の日中・夜間の変動は、住民の日常的な就業・休息のルーチンによって明確に駆動されています。日中(07:00–18:00)は都市活力のピーク期間であり、活力レベルが高く、空間的なカバー範囲が広く、活力の低いエリアが非常に少ないことが特徴です。対照的に、夜間(18:00–23:00)は活動範囲が徐々に縮小し、活力が住宅地にますます集中します。これらの知見は、煙台市の中心市街地における都市活力に対する就業・休息活動の時間依存的な影響を明確に示しており、その日周的な進化特性を明らかにしています。また、都市活力の時空間パターンを特定するという核心的な目的を達成し、住民の日常的な活動リズムが都市活力と密接に関連しているという仮説を支持しています。
都市活力の空間的クラスター特性:
煙台市中心市街地における都市活力の空間的自己相関を検証するため、グローバル・モラン I 統計量を用いた。その結果、日中および夜間の都市活力におけるモラン I 値は、それぞれ 0.722 と 0.736 であった。有意性検定により、煙台市中心市街地の都市活力は日夜ともに有意なクラスターを形成しており、特に夜間のクラスター効果の方が日中よりも顕著であることが示された。
図4に示すように、煙台市の中心市街地における都市活力は、主に「高-高」クラスターと「低-低」クラスターという2つの集積パターンに従っています。全体的な空間分布は、「中心-周辺」構造と「一核多点」構造が組み合わさった不規則な複合パターンを示していますが、「中心」と「周辺」は空間的に分離しており、それらの間の遷移帯には有意な集積が見られない領域が多く含まれています。空間的自己相関分析の結果から、都市活力の集積パターンと空間的分化が明確に特定され、パターン認識という研究目的が達成されました。これらの知見は、関連する研究仮説を裏付けるものであり、本研究の全体的な分析枠組みと密接に整合しており、空間構造による分化効果のさらなる分析のための基礎となるものです。
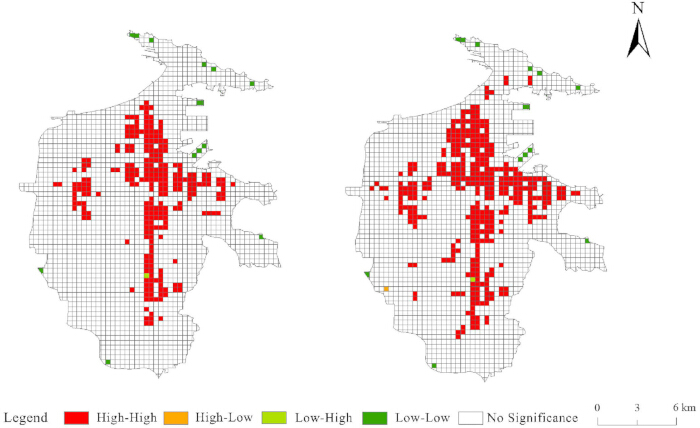
図4都市活力の昼夜における局所的空間集積。 局所空間的自己相関(LISA)マップは、昼間および夜間の活力における高-高、高-低、低-高、低-低、および有意でない空間的クラスターを示している。 こちらの図の拡大版を表示するには、ここをクリックしてください。
MGWRに基づいた都市空間構造が都市活力に及ぼす空間的異質性の影響
都市空間構造のさまざまな要因間の相互影響による推定バイアスを避けるため、分散拡大係数(VIF)を用いてすべての説明変数をテストしました。VIF値が大きいほど、多重共線性も強くなります。一般的に、VIF値が7.5を超えると、その説明変数は冗長であるとみなされます32。テスト結果を表2に示します。すべてのVIF値が7.5未満であり、選択した指標に多重共線性が認められないことが示されました。その後、p > 0.05の指標は、都市活力に有意な影響を及ぼさないと考えられたため除外しました。変数選択の結果、最終的にPOI多様性、生活機能、居住機能、建物密度、近接性、ビジネスセンターまでの距離(DBC)、およびウォーカビリティの7つの要因を、MGWRモデル(RRID: SCR_017651)を構築するための説明変数として選択しました。これにより変数選択プロセスが完了し、保持されたコア要因は研究フレームワークと一致しているため、その後のモデル分析で研究仮説を効果的に検証することが可能となります。
| 変数 | p-値 | 分散拡大係数 (VIF) |
| POI多様性 | 0 | 1.946 |
| 経済機能 | 0.025 | 3.15 |
| 生活機能 | 0.004 | 3.834 |
| 居住機能 | 0.001 | 1.925 |
| 建物密度 | 0 | 3.062 |
| 容積率 | 0.084 | 5.723 |
| 近接性 | 0 | 1.732 |
| 介在中心性 | 0.952 | 2.022 |
| 市中心部までの距離 | 0.458 | 1.407 |
| ビジネスセンターまでの距離 | 0.009 | 1.498 |
| 親水指標 | 0.06 | 1.132 |
| 正規化差植生指数 (NDVI) | 0.118 | 1.049 |
| 建物の連続性 | 0.364 | 2.746 |
| 天空率 | 0.22 | 1.177 |
| ウォカビリティ | 0.004 | 2.094 |
表2:候補説明変数の多重共線性評価。本表は、多スケール地理的加重回帰(MGWR)分析前の変数スクリーニングにおいて使用された各候補説明変数の統計的有意性(p値)および分散拡大係数(VIF)を示す。その後のモデリングに保持された変数は、事前に定義された統計的選択基準を満たしていた。略称:VIF、分散拡大係数。
モデル適合性の影響:
モデリング分析は、グローバルOLSモデル、従来のGWRモデル、およびMGWRモデルの3つのアプローチを用いて行われた。モデルの収束はSOC-f(平滑化f)基準に基づいており、2回の連続する反復間におけるすべての推定回帰係数の最大絶対変化量を収束基準として使用した。収束しきい値は1.0 × 10⁻5に設定し、最大反復回数は200回とした。結果の比較可能性を確保するため、昼間モデルと夜間モデルでは、カーネル関数、帯域幅探索ルール、収束基準、およびその他のパラメータ設定を含む同一の手法設定を採用した。異なるのは従属変数のみであり、したがって推定された最適帯域幅および回帰係数も異なっていた。結果として、昼間モデルは28回の反復後に、夜間モデルは34回の反復後に収束した。両モデルとも収束しきい値を満たしており、推定結果が安定し信頼できるものであることが示された。3つのモデルの指標を表3に示す。
| カテゴリー | 変数 | 最小二乗法 | 地理的加重回帰 | マルチスケール地理的加重回帰 |
| モデル性能 | AICc(補正赤池情報量基準) | 6703 | 4417 | 3463 |
| 自由度調整済み決定係数² | 0.62 | 0.56 | 0.8 | |
| 最適可変帯域幅 (MGWR) | POIの多様性 | — | 53 | 239 |
| 生命機能 | — | — | 724 | |
| 居住機能 | — | — | 256 | |
| 建物密度 | — | — | 237 | |
| 近接性 | — | — | 921 | |
| ビジネスセンターまでの距離 | — | — | 2220 | |
| ウォーカビリティ | — | — | 2220 |
表3:最小二乗法(OLS)、地理的加重回帰(GWR)、およびマルチスケール地理的加重回帰(MGWR)におけるモデル性能の比較。本表では、補正赤池情報量基準(AICc)および自由度調整済み決定係数(Adjusted R2)を用いて、最小二乗法(OLS)、地理的加重回帰(GWR)、およびマルチスケール地理的加重回帰(MGWR)モデルの性能を比較している。また、MGWRモデルにおいて各説明変数に対して推定された最適バンド幅を記載しており、回帰分析における変数固有の空間スケールを示している。略語:AICc:補正赤池情報量基準、OLS:最小二乗法、GWR:地理的加重回帰、MGWR:マルチスケール地理的加重回帰。
表3に示されるように、MGWRモデルはOLSモデルおよびGWRモデルよりもAICc値が低く、自由度調整済みR2が高く、モデルの適合度が優れていることが示されています。さらに、OLSおよびGWRモデルと比較して、MGWRモデルでは各説明変数に個別の最適帯域幅を持たせることができ、その帯域幅は237から2,220の範囲にわたっています。これは、都市の活力に対する異なる変数の影響が、空間スケールによって大きく異なることを示しています。
各変数の中で、DBCの帯域幅と歩行可能性(walkability)の帯域幅は全サンプルサイズに近く、それらの影響が局所的というよりも主に全体的であることを示唆しています。これは、これらの要因がほとんどの地域において空間的な変動が比較的限定的であるためと考えられます。社会経済的条件および人間の知覚に密接に関連する街路環境の特性を示す指標として、これらは都市の活力に全体的な影響を及ぼします。対照的に、POI多様性、生活機能、居住機能、建物密度、および近接性の5つの変数は帯域幅が比較的小さく、それらの影響が局所的な空間スケールに集中していることを示しています。これらの要因は、機能的な複雑さ、住環境、およびアクセシビリティに対する住民の差別化された需要を反映しており、したがって局所的な空間において異なる種類の活動を誘引または制約し、それによって都市の活力を形成している可能性があります。
具体的に、POI多様性、居住機能、および建物密度の帯域幅はそれぞれ239、256、237であり、全サンプルの11%、12%、11%を占めています。生活機能と近接性の帯域幅はサンプルのより大きな割合をカバーしており、それぞれ33%と41%に相当することから、これらの効果がより広範な空間スケールで作用していることが示唆されます。全体として、MGWRモデルの利点は明白です。説明変数の効果スケールが変動していることは、空間的不均一性の仮説をさらに支持し、本研究で選択したモデルの適切性を裏付けています。
影響の有意性:
MGWRモデルから得られた回帰係数の統計結果を表4に示す。平均回帰係数の絶対値に基づくと、日中における都市空間構造変数の寄与度は、POI多様性 > アクセシビリティ > 建物密度 > 生活機能 > 居住機能 > ウォーカービリティ > DBCの順となった。夜間には、この順位がわずかに変動し、POI多様性 > 生活機能 = 居住機能 > 建物密度 > ウォーカービリティ > DBC > アクセシビリティとなった。
| 変数 | 昼間平均 | 日中睡眠剥奪 | 日中の中央値 | 夜間平均値 | 夜間睡眠遮断 | 夜間中央値 |
| POIの多様性 | 0.226 | 0.126 | 0.196 | 0.322 | 0.096 | 0.315 |
| 生命機能 | 0.088 | 0.006 | 0.088 | 0.145 | 0.075 | 0.153 |
| 居住機能 | 0.019 | 0.158 | 0.004 | 0.145 | 0.173 | 0.123 |
| 建物密度 | 0.132 | 0.029 | 0.131 | 0.070 | 0.126 | 0.053 |
| 近接 | 0.165 | 0.188 | 0.121 | 0.030 | 0.048 | 0.024 |
| ビジネスセンターまでの距離 | −0.010 | 0.004 | −0.010 | 0.032 | 0.003 | 0.031 |
| ウォッカビリティ(歩きやすさ) | 0.011 | 0.002 | 0.011 | 0.039 | 0.002 | 0.039 |
表4:マルチスケール地理的加重回帰(MGWR)モデルによって推定された回帰係数の要約統計量。この表は、昼間および夜間の都市活力について、マルチスケール地理的加重回帰(MGWR)モデルにより推定された回帰係数の分布をまとめたものである。各説明変数について、回帰係数の平均、標準偏差(SD)、および中央値を記載しており、2つの時間帯における影響の大きさと変動性を比較することが可能となっている。略語:MGWR, multiscale geographically weighted regression(マルチスケール地理的加重回帰);SD, standard deviation(標準偏差)。
特筆すべき点として、POIの多様性は昼夜ともに都市の活力に対して一貫して最大の寄与を示し、正の効果をもたらしている。これは、多様な都市施設を備え、機能的混合度が高い地域が都市住民にとって特に魅力的であり、それによって都市の活力が向上することを示唆している。日中、住民の活動は主に通勤、オフィスワーク、および公共サービスに向いているため、近接性と建物の密度が重要な役割を果たす。夜間になると、住民の活動は居住、レジャー、および地域消費へと移行し、生活機能と居住機能の寄与が大幅に増加する一方で、近接性の寄与は著しく低下する。このようなランキングにおける昼夜の差は、住民の日々の活動パターンの変化に伴う都市活力駆動メカニズムの構造的変化を直接的に反映しており、今後の区域および時間帯別の差別化された計画策定に向けたマクロ的な根拠となる。
図5に示されているように、影響因子のスクリーニング後における回帰係数の変動および影響圏の差異を分析すると、日中において生活機能、DBC、および歩行可能性の影響は比較的安定していることがわかります。生活機能と歩行可能性は正の影響を及ぼしている一方、ビジネスセンターへの距離は正と負の両方の影響を示しています。POI多様性、居住機能、およびアクセシビリティの影響範囲は大幅に変動しており、同様に正と負の両方の影響を示しています。建物密度の影響はある一定の範囲内で変動していますが、正の影響を維持しています。夜間においては、DBCと歩行可能性の影響がより安定しており、どちらも正の影響を維持しています。対照的に、POI多様性、居住機能、および建物密度の影響はかなりの変動を示しており、POI多様性は正の影響を及ぼす一方で、居住機能と建物密度は都市の活力に対して正と負の両方の関係を示しています。生活機能とアクセシビリティの影響も、一定の範囲内で変動しています。
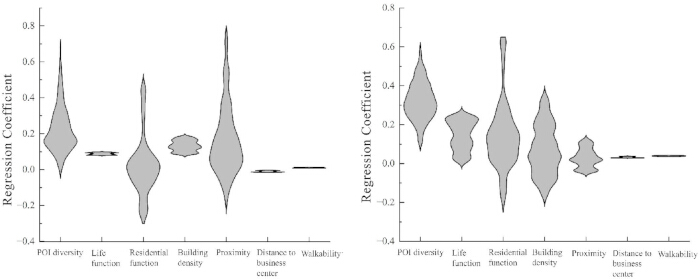
図5マルチスケール地理的加重回帰モデルによる回帰係数の分布。 バイオリン図は、各影響因子における昼間と夜間の係数分布を比較したものである。幅が広い領域は係数の密度が高いことを示し、正の値は促進的な効果を、負の値は抑制的な効果を示す。 こちらの図の拡大版を表示するには、ここをクリックしてください。
影響の空間的不均一性
都市空間構造が都市の活力に及ぼす影響の空間的不均一性をさらに分析するため、有意な影響レベルを持つサンプルを選択した。各都市空間構造要素の昼間および夜間の回帰係数を可視化した(図6および7)。自然ブレイク点分類法を用いて、回帰係数を10段階に分類し、影響の空間的な範囲、強度、および方向性の変化を明らかにした。
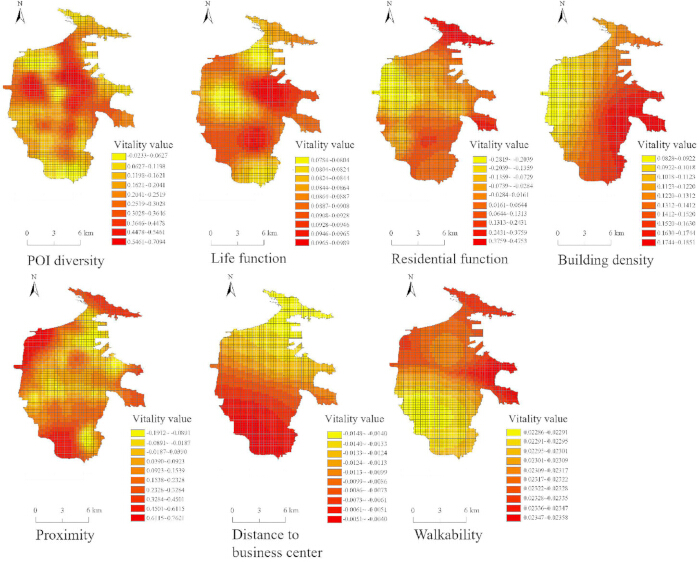
図 6。マルチスケール地理的加重回帰係数の昼間の空間分布。 これらの地図は、POI多様性、生活機能、居住機能、建物密度、近接性、S、およびウォーカビリティの昼間の回帰係数における空間的変動を示している。カラーグラデーションは、各パネルの凡例に示されている係数の大きさを表している。ここをクリックして、この図の拡大版を表示してください。
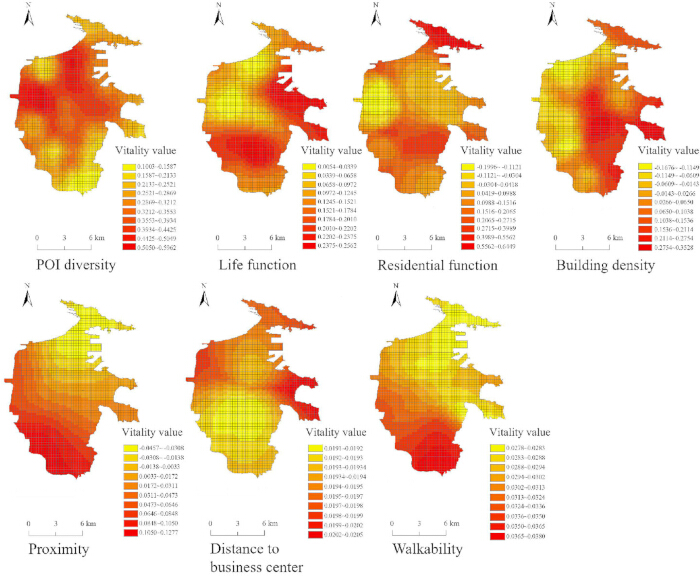
図7マルチスケール地理的加重回帰係数の夜間空間分布。 地図は、関心地点(POI)の多様性、生活機能、居住機能、建物密度、近接性、ビジネスセンターまでの距離、およびウォーカビリティに関する夜間の回帰係数の空間的変動を示している。カラーグラデーションは、各パネルの凡例に示されている通り、係数の大きさを表している。 この図の拡大版を表示するには、ここをクリックしてください。
POI多様性は、各空間単位内における都市機能の多様性と複雑さを測定するものである。都市の活力の根底にある核心的なメカニズムは、目的地の多様性と活動の相乗効果にある。ある地域のPOI多様性が高いほど、同じ空間内でショッピング、食事、娯楽、日常サービスといった住民の多様なニーズをより良く満たすことができ、その結果、地域をまたぐ移動の必要性が減少し、歩行者の滞在時間が延長され、空間利用の強度が高まる。分析結果から、POI多様性は都市活力に最も強い影響を及ぼし、顕著な空間的変動を示すことが明らかになった。具体的には、その分布は影響力の高い地域と低い地域に比較的集中しており、主に都市中心部で強い影響が観察される一方、都市周辺部では影響力が弱くなる傾向にある。回帰係数全体としては主に正の値を示しており、少数の弱い負の相関を除いて、明確な正の相関関係があることが示された。これは、ほとんどの地域において、POI多様性の向上が都市活力の増大に関連していることを示唆している。さらに、POI多様性が都市活力に及ぼす影響の空間的分化は、昼間よりも夜間に顕著であり、夜間において最も影響力のある要因となっている。この昼夜の差は、昼間と夜間の住民の活動需要における構造的な分化に起因すると考えられる。昼間、土地利用の複合化は主に通勤や休憩中の短期的かつ断片的な消費需要に対応しており、歩行者の活動を惹きつける役割は比較的限定的である。しかし夜間になると、人々の活動はレジャー、社会的交流、体験型消費へと移行する。このような状況下では、POI多様性の高い地域が多様で連続的な夜間消費シナリオを提供することができ、住民の屋外滞在時間を効果的に延長させ、その結果、夜間の活力に対してより顕著な推進効果を及ぼすのである。
生活機能とは、教育、科学、文化、保健、交通、および公共サービスに関連する施設であり、住民の日常的なニーズを満たすものである。その影響メカニズムは、活動ー目的地ネットワークの形成にあり、これらの施設はそれ自体が歩行者の流れを惹きつけるだけでなく、他の機能との相乗効果を通じて、安定した活動フローを創出する。回帰分析の結果、生活機能が日中の活力に与える正の影響は安定しており、係数は0.078から0.098の範囲で、影響の強度にわずかな変動が見られるのみであった。対照的に、夜間の係数範囲は0.005~0.256に拡大しており、空間的な影響が著しく広範であることを示している。智楚街(Zhichu Street)と幸福街(Xingfu Street)をコアエリアとすると、影響度は中心部から周辺地域に向かって徐々に増加する。この地域は人口分布が集中しているという特徴がある一方で、都市計画が比較的古く、経済発展による制約を受けているため、市東部に比べて娯楽施設やその他の生活機能アメニティの全体的な提供レベルが低い。その結果、住民に対する誘引力が弱く、都市の活力に与える影響も限定的となっている。このような時間的変動は、住民の活動目的の変化を反映している。日中、生活機能は主に公共サービスに向けられており、歩行者の流れは比較的安定している。しかし夜間には、レジャーや娯楽への需要が加わり、飲食やショッピングなどの消費指向の機能と補完関係を形成するため、生活機能はより広い空間範囲において都市の活力に対してより強力な牽引効果を及ぼすことになる。
居住機能は、住民が夜間に帰宅し滞在するための空間的基盤を構成している。居住機能と都市活力との関係は、昼間と夜間で著しく異なるパターンを示す。昼間、居住エリアは人口流出の起点となるため、単に居住密度を高めても必ずしも都市活力が向上するとは限らない。商業施設やサービス施設などの支援機能がなければ、高密度の居住エリアはむしろ活力の弱い「ベッドタウン」となる可能性がある。しかし夜間になると住民が帰宅するため、居住エリアは夜間活動の空間的基盤となる。解析の結果、居住機能変数の全体的な平均効果は比較的弱いが、特定の地域では明らかな空間的異質性と分化が見られ、この影響の空間分布は昼夜を通じて概ね同様であることが示された。紅潤材料市場、果物卸売市場、鳳凰台小学校、および錦繍新城の周辺地域では、居住機能が密集しているが、都市活力との関係は負である。これは、これらの地域にさらに居住機能を加えても都市活力は向上せず、むしろ過度な居住の集中が空間的な混雑や支援施設の不足を招き、夜間の社会活動や消費活動を抑制する可能性があることを示唆している。対照的に、石輝窯通りでは居住機能が都市活力と正の相関にあり、この地域の居住施設が都市活力を支える上でより強い役割を果たし、住民にとってより大きな誘引力を持っていることが示された。
建ぺい率は、特定のエリアにおける開発の強度を反映しており、その根底にあるメカニズムは人口集積の物理的基盤を提供することにあります。建ぺい率が高いほど、人口収容能力が高まり、雇用機会や商業店舗がより密集して集中することを示します。本研究の結果、建ぺい率は日中の都市活力に全体として正の影響を与えており、その影響は東から西に向かって徐々に弱まり、明確な同心円構造を形成していることが示されました。市西部の建ぺい率が都市活力に及ぼす影響は東部よりも弱く、これは西部エリアにおける建ぺい率の向上が、東部エリアに比べて都市活力を高める効果が低いことを示唆しています。しかし、夜間になると、その影響は双方向のパターンを示します。建ぺい率が都市活力に及ぼす影響は、賈河付近の幸福街西部および知初街の低値クラスターにおいて負の相関を示し、その変動幅は比較的小さいものでした。この昼夜の差は機能的分化に起因します。日中、高密度の市街地にはオフィス機能や商業機能が集中し、人口流入の主要ゾーンとなります。しかし夜間になると、一部の高密度ビジネス街では人の分散が起こり、都市活力は周囲の居住エリアへと外側にシフトします。この意味で、高密度の市街地は、日中は活力集積の中心として機能し、夜間には活力拡散の源となり、外部へのスピルオーバーを通じて周囲の活力を促進していると考えられます。
近接性は道路ネットワークの接続効率を測定するものであり、住民がさまざまな種類の目的地にどれだけ便利に到達できるかを決定します。その核心的なメカニズムは、移動時間コストを削減し、活動の空間的範囲を拡大することにあり、近接性が高いほど、場所を訪れる可能性と頻度が直接的に高まります。本研究の結果、日中において近接性は、POIの多様性に次いで2番目に重要な推進要因であることが示されましたが、夜間になるとその影響は大幅に低下します。この顕著な昼夜の対比は、住民の活動パターンの根本的な変化を反映しています。日中は、通勤、用事、ビジネスなどの活動において交通への需要が比較的高く、アクセシビリティに大きく依存します。しかし夜間になると、住民の活動はより家庭中心となり、活動半径が縮小し、移動の主な目的がレジャーや消費へと移行するため、住民は道路ネットワークのアクセシビリティに対して著しく鈍感になります。さらに、近接性は双方向の局所的効果を示します。嘉河沿い、および直楚街と鳳凰台街では都市の活力と強い正の相関がある一方で、幸福街の北側の人口希薄地域では弱い負の相関を示しています。このことは、近接性が活力を推進する効果は、十分な歩行者需要の存在に依存していることを示唆しています。
DBCは、各空間単位から市中心部の商業地区までの近接性を測定するものであり、雇用機会、消費環境、および経済的外部性へのアクセスという観点からの立地上の優位性を反映しています。その基礎となるメカニズムは、集積経済と消費者のアクセシビリティにあります。商業中心に近い領域ほど、雇用機会がより密集し、消費者の選択肢が豊富になり、社会経済的な相互作用がより活発になるため、より多くの歩行者フローを引き寄せます。本研究の結果、DBCが日中の都市活力に与える影響は南から北にかけて減少し、負の相関を示すことが分かりました。南部の地域は商業中心から遠いため、都市活力への影響が弱いのに対し、 Kuiyu Road より北の地域は商業中心に近く、より強い影響を及ぼします。しかし、夜間になるとこの関係は正に転じ、Hongqi Road の南北に2つの環状ゾーンが形成され、中心部から周辺地域に向かって影響が徐々に増大します。この昼夜の逆転は、空間構造の潜在的な論理を明らかにしています。すなわち、日中には商業中心が雇用と消費の核心的な目的地として機能し、人口の内向きの集中を促しますが、夜間には住民が市内各地に分散した自宅に戻るため、商業中心から離れた住宅地でむしろ活力が高まるということです。
ウォカビリティ(歩きやすさ)は、街路環境の歩行者への親和性を測定するものであり、物理的空間と人間の知覚を繋ぐ重要な架け橋となります。その特有のメカニズムは、歩行者フローを直接的に生成することではなく、歩行体験を向上させ、安全性や快適性の感覚を高め、歩行者の滞在時間を延ばし、社会的相互作用を促進することにあり、それによって都市の活力に寄与します。本研究において、ウォカビリティは昼夜ともに都市活力に安定した正の影響を示しており、その影響が包括的な性質を持ち、歩行者に優しい街路環境が一般的に空間的な活力を高めることが示されました。日中、ウォカビリティが都市活力に与える影響は、朱家村(Zhujia Village)と鳳凰台街(Fenghuangtai Street)において低活力地帯を形成しています。これは主に、朱家村付近の歩行者フローが比較的限定的であり、住民の歩道への依存度が低いためであると考えられます。鳳凰台街では、建物の配置が密集しており、街路レイアウトが古く、歩道が狭い上に頻繁に占有されているため、非電動交通による活力の集積への支援が限定的となっています。夜間、ウォカビリティの影響は南西から北に向かって徐々に減少し、市内南部で効果が強く、北部で比較的弱い傾向にあります。このパターンは、煙台市の中心市街地における歩行者フローの分布、交通施設、および地域間の発展格差に関連しています。さらに、ウォカビリティの効果は夜間に比較的強く現れており、これは夜間の活動が知覚される安全性や環境品質により強く依存していることを反映しています。良好な照明、連続した歩道、および明確に定義された街路の囲い込み(エンクロージャー)は、夜間移動時の不安感を効果的に軽減し、それによって夜間の都市活力の潜在能力を引き出すことができます。
代表エリアおよび都市活力最適化フレームワーク
MGWR分析によって特定された空間的な不均質性をさらに具体化するため、異なる都市空間的特性を持つ代表的な近隣区域をフィールド調査 대상으로 選定した(図8および9)。これらの事例は、分析結果に関連する空間的条件の視覚的な証拠を提供するものである。
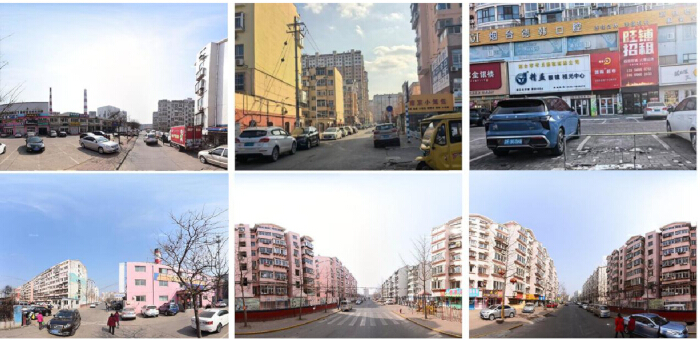
図 8幸福新町の旧街区における現状。 代表的な写真は、公共施設の不均等な分布や限定的な街路環境の質など、街路および建築環境の状況を示している。 この図の拡大版を表示するには、ここをクリックしてください。
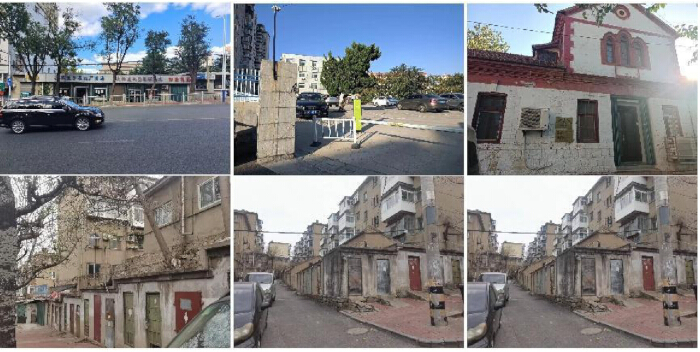
図9南郷街・金徳および白石・黄山的における古いコミュニティの既存状況。 代表的な写真には、密集した住宅地、限られた公共のオープンスペース、および現在の近隣地域の環境条件が示されている。 この図の拡大版を表示するには、ここをクリックしてください。
図 8は、公共サービス施設の分布が不均一で、街路の環境品質が比較的低いという特徴を持つ、代表的な旧市街地の興福新村(Xingfu New Town)を示しています。図 9は、南溝街-金徳(Nangou Street–Jinde)および白石-黄山(Baishi–Huangshan)エリアにおける代表的な住宅街を示しており、これらの地域は、住宅開発が密集し、公共のオープンスペースが限定的で、街路の界面が比較的単調であるという特徴があります。これらの観察された空間的特性は、生活機能と居住機能が都市の活力に及ぼす影響の差異を記述した分析結果と一致しています。
図 10は、都市空間構造の主要な次元間の関係と、それらが都市の活力に与える影響をまとめたものである。MGWR分析の結果に基づき、このフレームワークは特定された駆動要因とその相互作用を統合し、昼間および夜間の都市の活力に影響を与えるメカニズムの全体的な概念的表現を提示している。
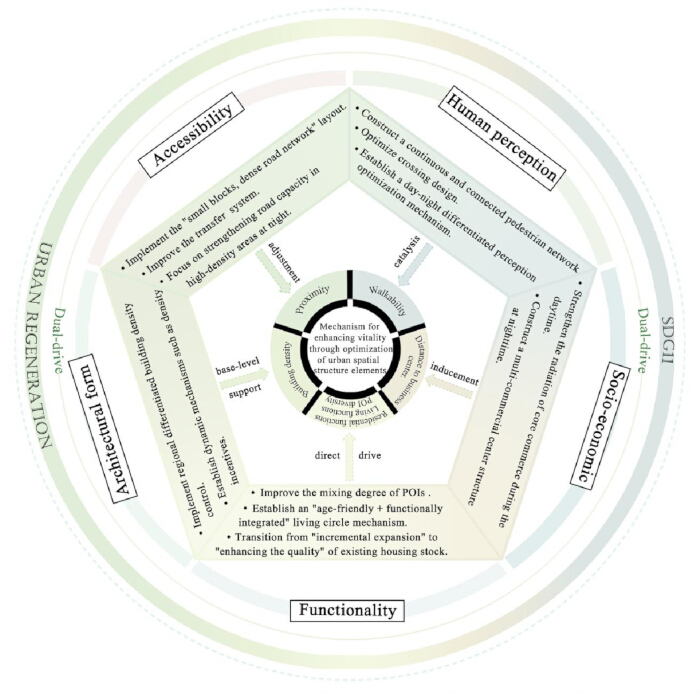
図10都市空間構造の最適化メカニズムと活力向上。 この図は、昼夜の活力の差を考慮し、機能的要素、建築形態、アクセシビリティ、社会経済的要因、生態学的空間、および人間の知覚にわたる活力向上戦略をまとめたものである。 こちらの図の拡大版を表示するには、ここをクリックしてください。
データの可用性:
本研究の結果を裏付けるすべてのデータは、本文および補足資料に提供されています。これらには、補足図1、データ収集、前処理、分析ワークフロー、モデル出力、および回帰診断を記述した補足ファイル1–7、データ前処理およびストリートビュー画像の処理に使用したPythonスクリプトとJupyterノートブックを含む補足コード1–4、ならびに分析に使用したオリジナルの標準化済みおよび処理済み都市空間構造指標データセットを提供する補足データ1–3が含まれます。
補足図1. 夜間光強度を用いたヒートマップ由来の都市活力の検証。夜間光強度(左)と、Baiduヒートマップデータから得られた夜間の都市活力(右)の空間分布の比較。代表的なホットスポット領域を強調することで、2つのデータセット間の空間的な一致を示し、本研究地域においてヒートマップ由来の活動強度が都市活力のプロキシとして利用可能であることを裏付けている。 こちらをクリックしてファイルをダウンロードしてください。
補足ファイル1. Baiduヒートマップデータの収集および処理ワークフロー。 このファイルでは、Baiduヒートマップデータの取得、前処理、デノイズ処理、時間的分類、空間変換、カーネル密度推定、および300 m × 300 mのグリッドスケールにおける昼間および夜間の都市活力の算出に関するワークフローについて説明します。 こちらをクリックしてファイルをダウンロードしてください。
補足ファイル 2. 都市空間構造指標の定義および算出手順。本ファイルでは、機能性、建築形態、アクセシビリティ、社会経済的特性、生態空間、および人間の知覚を含む、分析に使用されたすべての都市空間構造指標の定義、計算式、前処理手順、パラメータ設定、および正規化手法について説明します。 こちらをクリックしてファイルをダウンロードしてください。
補足ファイル3. ストリートビュー画像の取得および解析ワークフロー。 このファイルでは、ストリートビュー画像のサンプリング戦略、画像取得パラメータ、パノラマ画像の生成、SegNetモデルを用いたセマンティックセグメンテーション、モデルの検証、およびストリートビュー画像から導出される人間知覚指標の算出について説明します。 こちらのリンクからファイルをダウンロードしてください。
付録ファイル 4. マルチスケール地理的加重回帰(MGWR)モデリングのワークフロー。 このファイルでは、データの前処理、変数の選択、多重共線性の評価、モデル構成、帯域幅の最適化、パラメータ設定、モデルの実装、および最小二乗法(OLS)、地理的加重回帰(GWR)、MGWRモデルのパフォーマンス比較を含む、MGWRモデリングの手順について記述しています。 こちらのリンクからファイルをダウンロードしてください。
補足ファイル5. 日中のマルチスケール地理的加重回帰(MGWR)出力。グローバル回帰統計量、帯域幅の最適化、診断指標、パラメータ推定値、および日中の都市活気の空間的異質性を評価するために使用された要約統計量を含む、完全な日中MGWRモデルの出力。 こちらをクリックしてファイルをダウンロードしてください。
補足ファイル 6. 夜間マルチスケール地理的加重回帰(MGWR)出力。 全域回帰統計量、帯域幅の最適化、診断指標、パラメータ推定値、および夜間の都市活力の空間的不均一性を評価するために使用された要約統計量を含む、完全な夜間 MGWR モデルの出力。 こちらのリンクからファイルをダウンロードしてください。
補足ファイル 7. 普通最小二乗法(OLS)回帰診断およびモデル評価。 多重共線性評価、回帰診断、残差分析、および地理的加重回帰モデルとの比較に用いられた支持プロットを含む、OLSモデルの診断出力。 こちらのリンクをクリックしてファイルをダウンロードしてください。
補足コード 1. Baiduヒートマップデータ前処理用のPythonワークフロー。 重複データの削除、欠損値のフィルタリング、タイムスタンプの変換、昼夜の分類、座標の標準化、およびその後の空間解析に向けた処理済みデータセットのエクスポートを含む、生ヒートマップデータの前処理に使用したPythonスクリプト。 こちらのリンクからファイルをダウンロードしてください。
補足コード 2. ストリートビュー画像のスティッチングワークフロー。 画像のスティッチングおよび、その後のストリートスケープ解析のためのパノラマ画像生成を含む、ストリートビュー画像処理を実装したJupyter notebook。 こちらのリンクからファイルをダウンロードしてください。
補足コード3. ストリートビュー画像の取得ワークフロー。Baiduストリートビューのアプリケーションプログラミングインターフェース(API)を通じてストリートビュー画像を取得し、画像のメタデータを整理し、意味的セグメンテーションのための画像準備を行うために使用したJupyterノートブックです。 こちらのリンクからファイルをダウンロードしてください。
補足コード 4. ストリートビュー画像の処理ワークフロー。人間による知覚指標の抽出前に、ストリートビュー画像を処理および統合するために使用したJupyterノートブックです。 こちらのリンクからファイルをダウンロードしてください。
補足データ 1. オリジナルの都市空間構造指標データセット。本研究に含まれるすべての空間単位について、前処理および標準化前に収集された指標の生データ。 こちらをクリックしてファイルをダウンロードしてください。
補足データ 2. 標準化された都市空間構造指標データセット。 多スケール地理的加重回帰分析の入力として使用された標準化済み予測変数。 こちらのリンクからファイルをダウンロードしてください。
補足データ 3. フィルタリングおよび処理済みの都市空間構造指標データセット。前処理および変数スクリーニング後の品質管理済みデータセットであり、統計解析およびモデル開発に使用された。 こちらをクリックしてファイルをダウンロードしてください。
ディスカッション
煙台市の主要市街地における都市活力は、場所、空間範囲、および解析スケールによって異なる、多様なクラスターパターンと不均一な空間的影響を示している。本研究は、都市活力が、建物的環境の複数の次元が住民の日中および夜間の活動に共同的に影響を及ぼす、複合的かつ入れ子状の空間構造によって形成されていることを実証している。マルチソースの地理空間ビッグデータとMGWRモデルを用いることで、本研究は、機能性、建築形態、アクセシビリティ、社会経済的条件、および人間の知覚が都市活力に及ぼす影響に、大幅な空間的不均一性があることを特定した。従来のグローバル回帰アプローチと比較して、MGWRモデルはこれらの関係の空間的な非定常性をより効果的に捉え、都市活力を支えるメカニズムについてより精緻な理解を提供した。これらの知見は、都市活力を育成するための戦略が、住民の時空間的な活動ニーズに基づくべきであり、人々、時間、場所に応じて異なる、公平で文脈に即したアプローチを採用すべきであることを示唆している。さらに、効果的な活力向上には、リソース配分や環境的制約に伴う非効率性、不適切な介入、および負の影響を軽減しつつ、グローバルおよびローカルな空間構造の両方を協調的に最適化することが必要である。総括して、これらの知見は、都市活力向上戦略の効果と精度を高めるための、エビデンスに基づいたフレームワークを提供する(図10)。
検討した機能的要素の中で、POI多様性、生活機能、および居住機能が都市活力の主要な決定要因として特定された。POI多様性は都市活力に最も強い正の影響を及ぼしており、これは混合的な都市機能が人口の集積を促進し、空間的な活力を高めることを示したYeおよびZhuang33、ならびにCetinら34の知見と一致している。本研究では、日中の主要都市地区の大部分において、POI多様性と都市活力との間に有意な正の相関が認められたが、周辺地域では弱い負の相関しか観察されなかった。このパターンは、多様な居住、商業、レジャー、およびサービス機能が集中することで、人間活動の連続的な連鎖が形成され、時間的および空間的な活力がともに強化されることで説明できる。対照的に、単一機能の土地利用を特徴とする周辺地区では、活動連鎖が断片化し、都市空間の時間的利用が低下している。このような同心円状の分化は、Fangら35およびXuら36による先行研究とも一致している。同様のパターンは北京や武漢でも報告されており、機能統合のレベルが高いほど、歩行者および商業的な活力が強くなることが示されている37,38。比較的完全な支援施設を備えていることが多い北京の郊外住宅地区とは異なり、煙台の黄霧街や万華工業園などの工業地域では日常的なPOIが不足しており、機能的単一文化による負の影響がより顕著になっている。したがって、職住近接の複合開発、コミュニティサービス、および公共オープンスペースを通じて機能的多様性を高めることで、これらの地区の活力を向上させることができ、さらに夜間商業街や夜市を拡大することで、夜間の活動をさらに強化できると考えられる。生活機能もまた、日中および夜間の両方で、特に市東部において都市活力に一貫して正の効果を示した。教育、医療、文化、娯楽、交通、および公共サービスに関連する施設は、日々の繰り返し訪問を誘発し、移動や社会的相互作用の重要な目的地として機能する。これらの施設が商業サービスと空間的に重複することで、歩行者の滞在時間と活動強度がさらに高まり、都市の活力が維持される。これらの結果は、コミュニティの活力を高める上での公共サービス提供の重要性を強調したLiuおよびGe39や、バランスの取れた生活支援施設が一日を通じた住民の活動強度を有意に高めることを示した南京および武漢での研究40,41と一致している。したがって、包括的な都市再開発においては、生活機能施設の量と質の両方の改善を優先すべきである。図8に示すように、幸福新城などの古い近隣住区や周辺の都市村では、依然として公共サービスが不十分であり、空間的質も比較的低い。教育、医療、高齢者ケア、公共緑地、および緊急インフラへのアクセスを改善し、あわせて直初公園のような旧工業跡地を公園や公共広場に適応的に再利用することが、より強く持続可能な都市活力に寄与すると考えられる。居住機能は日中と夜間の両方で同様の空間パターンを示し、一般的に居住POIが密集している地域では弱い負の相関が見られた。これらの地域は、多くの場合、居住目的の土地利用が支配的であり、公共オープンスペースが限定的で、商業活動が不十分であり、社会的相互作用の機会が比較的少ないことを特徴としており、結果として居住属性は強いが活動強度は比較的低い環境となっている。Chenら42も同様に、都市インフラは、適切な密度に伴い継続的なアップグレードと更新が行われた場合にのみ活力を高めることを示した。広州の高密度都市地区で行われた研究でも、公共サービス、商業施設、歩行者インフラ、および高品質な公共空間による支援がない限り、単に住宅開発を増やすだけでは必ずしも活力を向上させないことが示されている。図9に示すように、住宅密集地の多くでは、依然として公共空間の不足や街路前面の活動停滞が見られる。したがって、住宅密集地区においては、公共サービス施設の重点的な改善、居住機能の最適化、グリーンビルディング技術の導入、コミュニティガバナンスの強化、および今後の住宅開発の慎重な計画を通じて、居住の質と都市活力の両方を向上させることが有益であると考えられる。
機能的要素だけでなく、本研究は、建築形態、アクセシビリティ、社会経済的条件、および人間の知覚がすべて、都市の活力という空間的不均一性に寄与していることを示している。建築密度は、近隣地域の活力における重要な決定要因として浮かび上がった。重慶におけるYangら43の知見と一致して、建築密度の向上は一般に人口の集積と経済活動を促進し、それによって近隣地域の活力を高める。同様に、本研究では、建築密度の影響が西から東に向かって徐々に増加することが示されており、これは煙台市の中心市街地の北東部コアにおける開発と商業活動の集中を反映している。広州での先行研究では、建築密度の増加は当初は都市の活力を促進するが、この関係はやがて最適な閾値に達し、それを超えて密度が高まると収穫逓減となることがさらに実証されている16。同様に、青島で行われた研究では、生態空間の周辺エリアは過度に集中的な開発には不向きであり44、また、海岸沿いの線形または自由形態の空間配置は、高度にコンパクトな都市形態よりも魅力的な環境を提供することが多いことが示されている。これらの知見は、建築密度は最大化させるのではなく、最適化させるべきであることを示唆している。したがって、煙台駅周辺や海尚世界(Haishang World)を含む高度に開発された商業・住宅地区では、公共の緑地やレクリエーションエリアを増やす一方で、地域の建築密度を適切に低減させるべきである。朝陽街(Chaoyang Street)や索城里(Suochengli)などの歴史地区では、歴史的建造物の保存を優先し、過度な再開発を避けるべきである。また、沿岸観光ベルトや中央山公園(Central Mountain Park)周辺の開発強度は、都市の活力を維持しつつ、生態学的および景観的資源を保存するために、慎重に制御されるべきである。アクセシビリティについても、顕著な時空間的不均一性が示された。先行研究45,46と一致して、日中の近接性は都市の活力と有意な正の相関を示したが、夜間にはその影響は南から北に向かって低下した。近接性は道路ネットワークの接続性と住民の移動コストを反映するため、アクセシビリティが高まれば移動時間が短縮され、頻繁で多目的な活動が促進される。同様に、夜間の活力は、特に開発密度の高い都市部において、人口密度と交通接続性と強く関連していることが先行研究で示されている47。Wei Weiら48はさらに武漢において、高度に接続された道路ネットワークと整備された低速交通システムが、特に夜間の近隣地域の活力を大幅に向上させることを実証した。これらの知見は、今後の道路ネットワーク計画において「小街区・高密度街路網」戦略を採用すべきであることを示唆している。南溝街–金徳(Nangou Street–Jinde)や白石–後山(Baishi–Hushan)など、山地に近い古い近隣地域では、袋小路の解消や歩行者、自転車、道路インフラの拡充を通じて接続性を改善することで、アクセシビリティと全体的な活力を強化できる。同様に、幸福街(Xingfu Street)北部の交通改善は、夜間の活力をさらに高めるであろう。DBCで表される社会経済的条件も、明確な昼夜の不均一性を示した。日中は、DBC値が低いほど強い人口集積と高い都市の活力に関連していたが、夜間の活力は逆のパターンを示し、これはWangら49によって報告された知見と一致している。この違いは、日中の通勤や買い物活動と、夜間のレジャーや居住活動の空間組織の対照性を反映している。日中、市の商業コアは雇用と消費の主要な目的地として機能し、強い活力の集中を生み出す。しかし、夜間にはレジャー活動がより分散し、住民が帰宅するため、周辺の住宅地域の活力が上昇する。このパターンはまた、煙台の主に単心的な商業構造における雇用と住宅の不均衡を反映している。Bianchiniの夜間経済理論50と一致して、多様な夜間商業活動を確立することは、郊外地区の活力を強化するための有効な戦略となる。したがって、黄務街道(Huangwu Subdistrict)のような郊外地域では、二次商業センターの開発、多様な夜間消費機会の創出、および郊外住宅地と市中心部の間の交通連携の改善が有益であり、それによって都市全域でよりバランスの取れた活力を促進できる。最後に、ウォーカビリティで表される人間の知覚は、日中と夜間の両方において一貫して都市の活力に正の影響を与えていた。Geursら51は、歩行可能なアクセシビリティが高いほど、住民が自発的に徒歩で移動しようとする意欲が高まり、それによって近隣地域の活力が促進されることを実証した。Mahmoodら52はさらに、夜間の都市活動は交通アクセシビリティ、歩行者の快適性、および知覚される安全性に大きく依存するため、高品質な歩行環境が夜間の活力を維持するために不可欠であることを強調した。今回の知見も同様に、日中の歩行活動は主に施設のアクセシビリティに影響されるのに対し、夜間の活力は環境的な快適さ、歩行ルートの連続性、および知覚される安全性により強く依存することを示している。Si Ruiら53も同様に、より安全な歩行環境が夜間の活力を促進し、多様な街路インターフェースが日中の活力を高めることを報告している。煙台では、古い近隣地域において断片的な歩行者施設や深刻な歩車分離の不全が依然として一般的であり、一日を通じた活力の放出を制限している。したがって、今後の計画では、連続した歩道、バリアフリーの歩行者施設、より安全な横断歩道、豊かな街路インターフェース、照明の改善、および夜間の環境品質の向上を優先し、住民の屋外活動を延長させ、社会的相互作用と商業活動を促進し、日夜の両方における都市の活力を強化すべきである。図10に、これらの知見から導き出された提案上の最適化戦略をまとめる。
総括すると、本研究は、マルチソースの地理空間ビッグデータとMGWRモデルを統合することで、都市空間構造の多次元的な要素が、異なる空間スケールおよび期間において都市の活力にどのように影響するかを定量化し、都市活力に関する理解を深めるものである。従来のグローバル回帰モデルとは異なり、MGWRアプローチでは各説明変数が独自の空間スケールで作用するため、機能性、建築形態、アクセシビリティ、社会経済的条件、人間の知覚、そして都市活力の間の関係における顕著な空間的非定常性を明らかにすることができる。この分析フレームワークは、都市活力の根底にあるメカニズムの解釈を向上させるだけでなく、エビデンスに基づいた都市計画およびガバナンスのための実践的な指針を提供する。市全体に一律の計画的介入を適用するのではなく、本研究の結果は、地域の機能的特性、開発強度、交通アクセシビリティ、社会経済的背景、および歩行者環境に合わせた差別化された最適化戦略を支持するものである。したがって、提案されたフレームワークは、都市再開発、近隣再生、公共空間の最適化、交通計画、ならびに持続可能な昼夜経済の開発に応用できる可能性がある。異なる空間的要素がどこでどのように活力に影響を与えるかを特定することで、本研究は、都市の空間的質を向上させると同時に、均衡ある持続可能な都市開発を促進する、精密で人間中心の計画戦略を実施するための科学的根拠を提供する。
本研究では、マルチソース地理空間データとMGWRモデルを用いて都市の活力を調査するための分析フレームワークを構築したが、いくつかの限界があることを認める必要がある。第一に、分析の時間的範囲が連続する平日5日間に収集されたヒートマップデータに限定されていたため、週末、祝日、あるいは異なる季節における住民の行動パターンの変動を捉えられておらず、時間的分析の完全性に限界がある。第二に、ヒートマップデータは膨大なユーザーベースを通じて広範な空間的カバー範囲を提供しているが、不可避的にサンプリングバイアスを含んでおり、都市人口全体を完全に代表させることはできず、その結果、サンプルの代表性に限界が生じている。第三に、本研究は煙台市芝罘区の主要市街地のみに焦点を当てたため、得られた知見は地域の造られた環境(built environment)の特性に密接に関連しており、山岳都市、郊外、沿岸都市、メガシティを含む他の都市環境への適用可能性については、比較研究を通じたさらなる検証が必要である。第四に、本分析では都市の空間構造が都市の活力に与える影響のみを検討しており、都市の活力と空間構造の間の潜在的な双方向の相互作用については調査していない。最後に、MGWRモデルは空間的な非定常性を効果的に捉えることができるが、根本的には線形仮定に基づいているため、都市の活力、人間活動、および空間要素間の複雑な非線形関係や相互作用効果を十分に特徴づけられていない可能性がある。これらの限界は、提案した分析フレームワークのさらなる手法の精緻化およびより広範な適用に向けた重要な方向性を示している。
今後の研究では、本研究をいくつかの方向へと拡張できる。週末、祝日、および異なる季節に収集されたヒートマップデータを組み込むことで、都市の活力の長期的な動的モニタリングが可能となり、その時空間的な進化をより包括的に理解できる。山岳都市、平原都市、沿岸都市、郊外地域、およびメガシティなど、異なる都市タイプ間での比較分析を行うことで、普遍的なメカニズムと地域固有の特性を区別でき、知見の汎用性を高めることができる。さらに、人口構成、産業分布、雇用特性、住民所得などの社会経済情報を統合することで、都市の活力形成の根底にあるメカニズムをより包括的に解釈することが容易になる。また、今後の研究では、携帯電話のシグナリングデータや高頻度の消費記録などの複数のデータソースを、機械学習やその他の非線形分析手法と組み合わせることで、都市の空間構造、人間行動、および都市の活力の間の複雑な相互作用をより適切に捉えることができるかもしれない。さらに、本研究で開発された分析フレームワークは、特に高齢化コミュニティ、郊外地区、および商業的な活力が比較的低い地域における都市再開発、近隣再生、公共空間の最適化、および精緻な都市ガバナンスにおいて、大きな実用的価値を持つ。地域の空間的特性に基づいた差別化された計画戦略に定量的な根拠を提供することで、このフレームワークは、より精密で人間中心の、持続可能な都市開発を支援できる。総じて、本研究は、マルチソースの地理空間ビッグデータをMGWRモデルと統合することが、都市の活力の空間的な不均質性を明らかにするための有効なアプローチであることを示しており、根拠に基づいた計画とガバナンスを通じて都市の空間構造を最適化し、都市の活力を高めるための貴重な科学的根拠を提供するものである。
開示事項
利益相反:
著者らは、本記事の研究、執筆、または出版に関連して、いかなる利益相反もないことを宣言します。
謝辞
本研究は、山東省大学青年イノベーションチームプロジェクト(助成金番号 2022RW026)、中国国家自然科学基金(助成金番号 42377207)、山東省人文社会科学プロジェクト(助成金番号 2022-YYGL-31)、山東泰山学者若手専門家プログラム(助成金番号 tsqn202306240)、山東省学部教育改革一般プロジェクト(助成金番号 Z2021177)、山東省重点研究開発プログラム(助成金番号 2022RKY07006)、煙台市学校・土地統合開発基金(助成金番号 2021XDRHXMQT18)、湖沼科学・環境国家重点実験室オープン基金(助成金番号 2022SKL005)、中国科学院地球環境研究所黄土・第四紀地質国家重点実験室オープン基金(助成金番号 SKLLQG2024)、および山東省大学人材導入・育成青年イノベーションチームプロジェクト(助成金番号 SKLLQG2024)の支援を受けた。
材料
| 名前 | 会社 | カタログ番号 | コメント |
|---|---|---|---|
| ArcGIS | Esri | Version 10.4 (RRID: SCR_011081) | 空間分析および地図の可視化に使用される地理情報システムソフトウェア |
| Baidu Maps API | Baidu, Inc. | Version 3.0 | ヒートマップ、POI(Point of Interest)、およびストリートビュー画像データの取得に使用 |
| MGWR | Arizona State University | Version 2.2 | マルチスケール地理的加重回帰分析に使用されるソフトウェア |
| National Basic Geographic Information Center Land-use Dataset | National Basic Geographic Information Center | https://www.gscloud.cn/search | 土地利用データのソース |
| NPP-VIIRS Nighttime Light Dataset | Harvard Dataverse | DOI: 10.7910/DVN/YGIVCD | ヒートマップから導出された都市活力パターンの検証に使用 |
| OpenCV | OpenCV | Version 4.5.5 | パノラマ画像のステッチングおよび画像処理に使用 |
| OpenStreetMap | OpenStreetMap Foundation | https://www.openstreetmap.org | 建物フットプリントおよび道路ネットワークデータのソース |
| Python | Python Software Foundation | Version 3.8 (RRID: SCR_008394) | データの取得、前処理、および分析に使用 |
| SegNet | University of Cambridge | PyTorch implementation (Version 1.0) (RRID: SCR_017042) | 街路景観の特徴抽出に使用されるディープラーニング・セマンティックセグメンテーションネットワーク |
| Spatial Design Network Analysis (sDNA) | Cardiff University | Version 4.0 | 道路ネットワークのアクセシビリティ指標の算出に使用 |
参考文献
- Jin X, et al. Evaluating cities' vitality and identifying ghost cities in China with emerging geographical data. Cities. 2017;63:98-109.
- Montgomery J. Making a city: Urbanity, vitality and urban design. J Urban Des. 1998;3(1):93-116.
- Zhang W. Theoretical basis and methods of city health examination evaluation in China. Sci Geogr Sin. 2021;41(10):1687-1696.
- Jacobs J. The Death and Life of Great American Cities. Random House; New York; 1992.
- Maas PR. Towards a Theory of Urban Vitality. University of British Columbia; Vancouver; 1984.
- Sulis P, Manley E, Zhong C, Batty M. Using mobility data as proxy for measuring urban vitality. J Spat Inf Sci. 2018;16:137-162.
- Jia C, et al. Evaluation of urban vibrancy and its relationship with the economic landscape: A case study of Beijing. ISPRS Int J Geo-Inf. 2021;10(2):72.
- Kim YL. Seoul's Wi-Fi hotspots: Wi-Fi access points as an indicator of urban vitality. Comput Environ Urban Syst. 2018;72:13-24.
- Yue H, Zhu X. Exploring the relationship between urban vitality and street centrality based on social network review data in Wuhan, China. Sustainability. 2018;11(16):4356.
- Zhang L, Chiaradia A. Three-dimensional spatial network analysis and its application in a high-density city area, Central Hong Kong. Urban Plan Int. 2019;34(1):46-53.
- Feng D, Tu L, Sun Z. Research on population spatiotemporal aggregation characteristics of a small city: A case study of Shehong County based on Baidu Heat Maps. Sustainability. 2019;11(22):6276.
- Ye Y, Li D, Liu X. How block density and typology affect urban vitality: An exploratory analysis in Shenzhen, China. Urban Geogr. 2018;39(4):631-652.
- Liu M, Jiang Y, He J. Quantitative evaluation on street vitality: A case study of Zhoujiadu Community in Shanghai. Sustainability. 2021;13(6):3027.
- Wang B, et al. Elaborating spatiotemporal associations between the built environment and urban vibrancy: A case of Guangzhou City, China. Chin Geogr Sci. 2022;32:480-492.
- Hu C, et al. Research on the spatiotemporal pattern and influencing mechanism of coastal urban vitality: A case study of Bayuquan. Buildings. 2024;14(7):2173.
- Wang C, Wang B, Wang Q, Lei Y. Nonlinear associations between urban vitality and built environment factors and threshold effects: A case study of central Guangzhou City. Prog Geogr. 2023;42(1):79-88.
- Huang LS, Han Y, Ye Y. Coastal waterfront vibrancy: An exploration from the perspective of quantitative urban morphology. Buildings. 2022;12(10):1585.
- Yue W, Chen Y, Zhang Q, Liu Y. Spatially explicit assessment of urban vitality using multi-source data: A case of Shanghai, China. Sustainability. 2019;11(3):638.
- Pan J, Zhu X, Zhang X. Urban vitality measurement and influence mechanism detection in China. Int J Environ Res Public Health. 2022;20(1):46.
- Zeng Z, Li Y, Tang H. Multidimensional spatial driving factors of urban vitality evolution at the subdistrict scale of Changsha City, China, based on the time series of human activities. Buildings. 2023;13(10):2448.
- Xia X, Zhang Y, Zhang Y, Rao T. The spatial pattern and influence mechanism of urban vitality: A case study of Changsha, China. Front Environ Sci. 2022;10:942577.
- Ye Y, Zhuang Y, Zhang L, Nes A. Designing urban spatial vitality from a morphological perspective: A study based on quantified urban morphology and activities' testing. Urban Plan Int. 2016;31(1):26-33.
- Long Y, Ye Y. Human-scale urban form: Measurements, performances, and urban planning and design interventions. South Architecture. 2016;(5):41-47.
- Shen T, Li F, Chen Z. The evaluation of urban vitality and spatial correlation based on multi-source data: A case study of the main urban area of Changzhou. Resour Environ Yangtze Basin. 2022;31(5):1006-1015.
- Liu Y, Zhao P, Liang J. A study of urban vitality based on location-based service data: A case study of the area within the Sixth Ring Road of Beijing. Areal Res Dev. 2018;37(6):64-69.
- Zhang F, Liu Q, Zhou X. Vitality evaluation of public spaces in historical and cultural blocks based on multi-source data: A case study of Suzhou Changmen. Sustainability. 2022;14(21):14040.
- Gong Z, Ma Q, Kan C, Qi Q. Classifying street spaces with street view images for a spatial indicator of urban functions. Sustainability. 2019;11(22):6424.
- Ye Y, Zhang L, Yan W, Zeng W. Measuring street greening quality from a humanistic perspective: A large-scale analysis based on Baidu street view images and machine learning algorithms. Landscape Architecture. 2018;25(8):24-29.
- Penn A, Hillier B, Banister D, Xu J. Configurational modelling of urban movement networks. Environ Plann B Plan Des. 1998;25(1):59-84.
- Ye Y, et al. Measuring daily accessed street greenery: A human-scale approach for informing better urban planning practices. Landsc Urban Plan. 2019;191:103434.
- Moran PAP. Notes on continuous stochastic phenomena. Biometrika. 1950;37(1-2):17-23.
- Yang L, Jiao H. Spatiotemporal changes in ecosystem services value and its driving factors in the Karst region of China. Sustainability. 2022;14(11):6695.
- Ye Y, Zhuang Y. A hypothesis of urban morphogenesis and urban vitality in newly built-up areas: Analyses based on street accessibility, building density and functional mixture. Urban Plan Int. 2017;32(2):43-49.
- Cetin M, et al. Evaluation of thermal climatic region areas in terms of building density in urban management and planning for Burdur, Turkey. Air Qual Atmos Health. 2019;12(9):1103-1112.
- Fang C, He S, Wang L. Spatial characterization of urban vitality and the association with various street network metrics from the multi-scalar perspective. Front Public Health. 2021;9:677910.
- Xu Q, Zhou X, Zhou S. Identifying urban fringe boundaries and evaluating urban vitality using multi-source data: A case study of Hangzhou's central urban area. Urban Dev Stud. 2024;31(1):80-88.
- Hao X, Long Y, Shi M, Wang P. Street vibrancy of Beijing: Measurement, impact factors and design implication. Shanghai Urban Plan Rev. 2016;(3):9.
- Zeng C, Song Y, He Q, Shen F. Spatially explicit assessment on urban vitality: Case studies in Chicago and Wuhan. Sustain Cities Soc. 2018;40:296-306.
- Liu S, et al. Urban vitality assessment at the neighborhood scale with geo-data: A review toward implementation. J Geogr Sci. 2023;33(7):1482-1504.
- Tang L, Xu H, Ding Y. Comprehensive vitality evaluation of urban blocks based on multi-source geographic big data. J Geo-Inf Sci. 2022;24(8):1575-1588.
- Yang W, Ren Z, He J. Analysis of spatial disparity based on supply and demand service level of life service facilities: A case of Jianghan District in Wuhan City. Geomat Inf Sci Wuhan Univ. 2024;49(3):473-481.
- Chen Z, Dong B, Pei Q, Zhang Z. The impacts of urban vitality and urban density on innovation: Evidence from China's Greater Bay Area. Habitat Int. 2022;119:102490.
- Yang FF, et al. Understanding urban vitality from the economic and human activities perspective: A case study of Chongqing, China. Chin Geogr Sci. 2024;34(1):52-66.
- Sun X, Yuan Y, Wang J, Dong Q. Research on the influence factors and spatial characteristics of urban coastal space vitality via multi-scale geographically weighted regression: A case study of Tsingtao East Coast. J Qingdao Agric Univ (Soc Sci). 2024;36(1):50-58.
- De Vries S, et al. Local availability of green and blue space and prevalence of common mental disorders in the Netherlands. BJPsych Open. 2016;2(6):366-372.
- Chen Y, et al. Emerging social media data on measuring urban park use. Urban For Urban Green. 2018;31:130-141.
- Li Z, Zhao G. Revealing the spatiotemporal heterogeneity of the association between the built environment and urban vitality in Shenzhen. ISPRS Int J Geo-Inf. 2023;12(10):433.
- Wei W, Zhang Y, Hong M, Xia J. Influence of the built environment on outdoor space fitness vitality and its heterogeneity: A case study of the Wuhan urban area. Prog Geogr. 2024;43(1):93-109.
- Wang B, Lei Y, Wang C, Wang L. The spatiotemporal impacts of the built environment on urban vitality: A study based on big data. Sci Geogr Sin. 2022;42(2):274-283.
- Bianchini F. Night cultures, night economies. Plan Pract Res. 1995;10(2):121-126.
- Geurs KT, Krizek KJ, Reggiani A. Accessibility Analysis and Transport Planning. Edward Elgar Publishing; Cheltenham; 2012.
- Mahmood A, et al. A photovoice documentation of the role of neighborhood physical and social environments in older adults' physical activity in two metropolitan areas in North America. Soc Sci Med. 2012;74(8):1180-1192.
- Si R, Lin Y, Xiao Z, Ye Y. Spatiotemporal analysis of the relationship between the built environment and street vitality based on street-level imagery: A case study of Futian District, Shenzhen. Sci Geogr Sin. 2021;41(9):1536-1545.