バイオインフォマティクスと実験的解析を統合して解析した結果、LINC01871がサイクリン依存性キナーゼ4/6阻害剤に対する感受性の潜在的な予測因子であることが特定され、LINC01871の過剰発現が乳がんの増殖を抑制し、NF-κBシグナル伝達の減弱に関連していることが示されました。
この記事について
サマリー
要約
乳がんは女性において最も頻繁に診断される悪性腫瘍であり、サイクリン依存性キナーゼ4および6(CDK4/6)阻害剤への耐性が長期的な治療効果を制限しています。本研究は、CDK4/6阻害剤への予測感度に関連する長鎖非コードRNA(lncRNA)を同定し、乳がんにおけるそれらの生物学的機能を調査することを目的としました。The Cancer Genome Atlas(TCGA)のトランスクリプトームデータとGenomics of Drug Sensitivity in Cancer 2(GDSC2)データベースの薬剤感受性データを統合し、oncoPredictアルゴリズムを用いて薬剤感受性を予測しました。候補となるlncRNAは、差分的発現解析、加重遺伝子共発現ネットワーク解析、予後解析、および機械学習を通じて同定されました。その後、in vitroおよびin vivo実験を用いてLINC01871の生物学的機能を評価しました。リボシクリブおよびパルボシクリブへの予測感度に関連する62個のlncRNAが同定され、その中から6つのコアlncRNAが選出されました。LINC01871は、予測薬剤感受性に対して最も高い識別能を示しました。LINC01871の過剰発現は、乳がん細胞のリボシクリブおよびパルボシクリブに対する感受性の亢進、細胞増殖の抑制、アポトーシスの促進、および核内因子カッパB(NF-κB)シグナルの抑制に関連していました。シングルセル・トランスクリプトーム解析では、T細胞およびナチュラルキラー(NK)細胞においてLINC01871の高発現が認められ、トランスクリプトームに基づく免疫浸潤解析では、LINC01871の高発現が免疫浸潤の増加と関連していることが示されました。これらの知見は、LINC01871がCDK4/6阻害剤感受性の候補バイオマーカーであることを特定し、乳がんにおけるその腫瘍抑制効果を実証するものです。その予測価値および治療上の関連性を検証するためには、さらなる臨床的および機序的な研究が必要です。
概要
臨床管理の継続的な進歩にもかかわらず1,2、乳がんは依然として世界中の女性におけるがん死亡の主要な原因となっています。治療法は、内分泌療法や化学療法から、分子標的アプローチを取り入れる方向へと段階的に拡大してきました3。その中でも、リボシクリブ、パルボシクリブ、アベマシクリブなどのサイクリン依存性キナーゼ4および6(CDK4/6)阻害剤は、エストロゲン受容体および/またはプロゲステロン受容体陽性の乳がんにおいて、大きな臨床的利益をもたらしています4,5,6。しかしながら、長期的な治療に伴い獲得耐性が生じることがあり、それが治療効果の持続性を制限しています7。
CDK4/6阻害は、主にRb–E2F細胞周期調節軸を介して作用します。CDK4/6–サイクリンD活性の阻害は、レチノブラストーマ(Rb)タンパク質のリン酸化を減少させ、低リン酸化状態のRbがE2F依存性転写を抑制することを可能にし、その結果としてG1期停止を促進し、腫瘍細胞の増殖を制限します8。CDK4/6阻害剤耐性に寄与するいくつかのメカニズムが解明されていますが、それらだけでは治療反応性の違いを完全には説明できません。これらのメカニズムには、ホスファチジルイノシトール3-キナーゼ/プロテインキナーゼB/哺乳類ラパマイシン標的タンパク質(PI3K/AKT/mTOR)経路の異常活性化や、サイクリン–CDK複合体の発現増加が含まれます9,10。特筆すべきは、PI3K/AKT/mTOR経路の構成要素自体が、進行した疾患における治療標的となっている点です11。総じて、これらの観察結果は、CDK4/6阻害剤に対する感受性と耐性を決定するさらなる分子的な要因を特定する必要があることを示しています。予測バイオマーカーの臨床的妥当性は、HR陽性転移性乳がんに対する最新のバイオマーカー誘導戦略によって示されています。例えば、循環腫瘍DNA(ctDNA)の連続的な分析により、CDK4/6阻害剤ベースの治療中にESR1変異が出現することを検出できます。PADA-1およびSERENA-6試験では、このような分子的な検出によって、CDK4/6阻害を維持しつつ、内分泌療法の早期変更を決定できることが示されました12,13。しかし、ESR1変異は治療反応を決定する要因の一つに過ぎず、感受性や耐性のすべての事例を説明できるわけではありません。CDK4/6阻害剤ベースの治療中に進行したHR陽性/HER2陰性転移性乳がん患者には、現在、経口選択的エストロゲン受容体分解薬、PI3K/AKT経路阻害剤、抗体薬物複合体など、いくつかの後続の治療選択肢があるため、この限界は臨床的な重要性を増しています。したがって、CDK4/6阻害剤への感受性の差に関連する追加の候補バイオマーカーを特定することは、これらの治療から利益を得る可能性が高い患者と、より早期の治療適応が必要な患者を区別するのに役立つと考えられます。
長鎖非コードRNA(lncRNA)は、タンパク質への翻訳能を持たず、数多くの生物学的プロセスの調節に関与する転写産物である。いくつかのlncRNAは、がんの進行や治療反応への関与が示唆されている。口腔扁平上皮癌において、LOC100506114は転写因子RUNXとの相互作用と、それに続く下流遺伝子の発現調節を通じて、増殖と遊走を促進することが報告されている14。乳がんにおいては、HISLAが糖新生の亢進およびアポトーシス耐性の強化に関連していることが示されており15、LINC02568はESR1およびCA12の調節を通じて内分泌療法の耐性に寄与している16。がん生物学におけるlncRNAの関与は認められているものの、CDK4/6阻害剤耐性との関係については十分に特性解析されていない。本研究では、統合的なマルチオミクスおよび機械学習戦略を用いて、リボシクリブおよびパルボシクリブへの予測感受性と関連するlncRNAを特定し、その結果からLINC01871が候補として抽出された。次に、LINC01871とこれら両薬剤への感受性との関連を検討し、in vitroおよびin vivoの実験的アプローチを用いて、乳がん細胞の増殖に対するその影響を評価した。
プロトコル
All procedures involving animals were performed under institutional animal-welfare requirements and received approval from the Animal Ethical and Welfare Committee of Fujian Cancer Hospital & Fujian Medical University Cancer Hospital (Approval No. SQ2021-159-01).
Data acquisition
Bulk transcriptomic profiles were downloaded from TCGA in January 2025 and converted to transcripts per million (TPM) before downstream analysis. Single-cell RNA-sequencing data were obtained from the Gene Expression Omnibus (GEO), using dataset GSE161529.
Drug sensitivity estimation of ribociclib and palbociclib
GDSC2 data were used to train the drug-response prediction model, and TCGA-BRCA transcriptomic profiles were used as the test dataset. Clinical information required for the subgroup analysis was retrieved from the TCGA Pan-Cancer Atlas Clinical with Follow-up dataset. Four clinical variables were considered: ER status (breast_carcinoma_estrogen_receptor_status), PR status (breast_carcinoma_progesterone_receptor_status), HER2 status determined by IHC (lab_proc_her2_neu_immunohistochemistry_receptor_status), and HER2 status determined by FISH (lab_procedure_her2_neu_in_situ_hybrid_outcome_type). A tumor was classified as HR-positive if either ER or PR was annotated as “Positive.” A tumor was classified as HER2-negative when at least one of the HER2 IHC or FISH results was negative and neither test had a positive result. Cases for which HR or HER2 status could not be definitively determined were excluded. Using these criteria, 601 patients were identified as HR-positive/HER2-negative. Among them, 599 had corresponding records in both the Pan-Cancer clinical dataset and the TCGA-BRCA expression matrix and were included in the subgroup analysis. Ribociclib and palbociclib IC₅₀ values were estimated with the oncoPredict R package (version 1.2) using default parameters. Scatter plots generated with ggplot2 were used to display the distribution of predicted IC₅₀ values among patients. Patients within the highest 25% of predicted IC₅₀ values were designated as resistant, whereas those within the lowest 25% were designated as sensitive.
Identification of CDK4/6 inhibitor resistance–related genes
Differential expression between the predicted sensitive and resistant groups was assessed using the limma package, and the resulting gene-expression patterns were displayed as volcano plots with ggplot2. Weighted gene co-expression network analysis (WGCNA) was then conducted with the WGCNA package to identify expression modules associated with resistance to both CDK4/6 inhibitors. Genes shared across the four resulting datasets were identified and illustrated using the VennDiagram package. The intersecting genes were subsequently evaluated by Kaplan–Meier survival analysis and univariate Cox regression using the survival and survminer packages, with corresponding survival curves generated for visualization. Genes reaching statistical significance in both survival analyses were entered into LASSO regression with the glmnet package to select core prognostic factors. The ability of the selected genes to discriminate predicted drug resistance was then assessed by ROC analysis using pROC, with performance quantified by the area under the ROC curve. AUC values for the different drugs were compared graphically using bar plots generated with ggplot2.
Single-gene analysis of LINC01871
LINC01871 expression was first compared between tumor and normal tissues by differential expression analysis. Its prognostic association across multiple cancer types was subsequently examined by Kaplan–Meier survival analysis and univariate Cox regression using the survival and survminer R packages. Differences in LINC01871 expression among clinicopathological groups were assessed with the Wilcoxon rank-sum test and displayed as boxplots using ggpubr. For the single-cell RNA-sequencing analysis, data preprocessing and downstream analysis were carried out with Seurat. Inter-batch variation was corrected using Harmony with its default parameter settings. Following batch correction, the resulting cell clusters were represented in a UMAP embedding. Cell identities were then assigned automatically with SingleR using reference transcriptomic profiles.
Functional enrichment analysis
Genes showing differential expression between the high- and low-LINC01871 groups were determined with the limma package. In parallel, Pearson correlation analysis was used to identify mRNAs whose expression levels were correlated with LINC01871 expression. GO and KEGG enrichment analyses were subsequently conducted with clusterProfiler. The resulting enrichment profiles were presented as bar and bubble plots generated using ggplot2.
Immune infiltration analysis
Immune cell infiltration was initially characterized using CIBERSORT with the LM22 signature matrix, which was applied to estimate the relative distribution of 22 immune cell populations. Differences in these estimates between the high- and low-LINC01871 expression groups were visualized using ggpubr. Stromal, immune, and ESTIMATE scores were then calculated for individual samples with the estimate package and displayed as violin plots. In addition, single-sample gene set enrichment analysis (ssGSEA) was performed using the GSVA package to estimate the relative abundance of immune cell populations in each sample. Differences in the resulting immune infiltration estimates between the two LINC01871 expression groups were evaluated and visualized with ggpubr.
Cell culture
MDA-MB-231, MCF-10A, and HEK293T cell lines were used in this study. MDA-MB-231 and HEK293T cells were grown in DMEM containing 10% fetal bovine serum, whereas MCF-10A cells were maintained in medium specifically formulated for this cell line. Cultures were kept at 37°C under humidified conditions with 5% CO₂. To establish LINC01871-overexpressing cells, the LINC01871 overexpression construct and lentiviral packaging plasmids were co-transfected into HEK293T cells for lentiviral production. Virus-containing supernatant was subsequently harvested and used to transduce MDA-MB-231 cells. Transduced cells were selected with 1 μg/mL puromycin. Wild-type control and transduced cells were both subjected to puromycin treatment, and selection was terminated after 3–4 days once all wild-type control cells had died.
Reverse transcription quantitative polymerase chain reaction (RT-qPCR)
Cellular RNA was isolated using RNAiso Plus reagent, and RNA concentrations were adjusted to equivalent levels before reverse transcription. Complementary DNA (cDNA) was generated with a reverse transcription kit following the manufacturer’s protocol. RT-qPCR amplification began with denaturation at 95°C for 30 s and was followed by 40 cycles consisting of 95°C for 5 s, 60°C for 30 s, and 72°C for 30 s. Transcript abundance was determined by the 2−ΔΔCt method using GAPDH for normalization. Primer sequences used for the analysis are listed in Supplementary Table 1.
Cell proliferation and cytotoxicity assays
For assessment of drug cytotoxicity, 8,000 cells per well were plated in 96-well plates and allowed to grow for 24 h. The culture medium was subsequently exchanged for fresh medium containing the indicated drug concentrations, followed by a further 24 h of incubation. CCK-8 reagent was then applied, and the plates were maintained in the dark for 2 h before absorbance was recorded at 450 nm. These measurements were used to construct drug dose–response curves and determine IC₅₀ values. For proliferation measurements, cells were prepared at a density of 1,000 cells/mL, and 100 μL of the cell suspension was added to each well of a 96-well plate. CCK-8 measurements were performed at 24 h intervals. At each time point, the reagent was added and the plates were incubated in the dark for 2 h before absorbance was measured at 450 nm to assess cell proliferation.
Colony formation assay
For colony formation experiments, 1,000 cells were plated per well in 6-well plates, with three replicates included for each experimental group. Cells were maintained for 1–2 weeks to permit visible colony development. The medium was then discarded, and the cells were fixed in 4% paraformaldehyde, rinsed with PBS, and subsequently stained with 1% crystal violet.
5-Ethynyl-2′-deoxyuridine incorporation assay
Cells from each experimental group were plated in 12-well plates and maintained overnight. The following day, cells were exposed to the EdU working solution for 2 h. After fixation and permeabilization, EdU labeling was carried out, followed by nuclear counterstaining with Hoechst. Fluorescence microscopy was then used to acquire images for evaluation of EdU incorporation.
Western blot
Cells were lysed in RIPA buffer supplemented with protease and phosphatase inhibitors to obtain total protein. Protein concentrations were quantified by BCA assay. Following addition of loading buffer, the protein samples were denatured at 95°C and resolved by SDS–PAGE before transfer to PVDF membranes. The membranes were blocked at room temperature for 1 h and subsequently incubated with the designated primary antibodies at 4°C overnight (Supplementary Table 2). After three TBST washes, the corresponding secondary antibodies were applied for 45 min at room temperature. Protein signals were detected by enhanced chemiluminescence (ECL) and subsequently imaged. GAPDH or β-actin served as the loading control.
Flow cytometry analysis
For cell-cycle assessment, cells were collected by trypsinization, rinsed with PBS, and fixed overnight in 70% ethanol at 4°C. The fixed cells were washed again with PBS and incubated with a cell-cycle detection reagent before flow cytometric measurement. For apoptosis assessment, harvested cells were washed with PBS and suspended in binding buffer. The cell suspension was stained with Annexin V and propidium iodide (PI) for 10–15 min at room temperature under light-protected conditions. Flow cytometry was subsequently performed to quantify the apoptotic cell populations.
Xenograft mouse models
In vivo experiments were conducted using five-week-old NOD/ShiLtJGpt immunodeficient mice. Animals were maintained in a specific pathogen-free (SPF) facility on a 12 h light/dark schedule, with no more than four animals housed in each cage. Before tumor-cell implantation, mice were anesthetized by inhaled isoflurane. Following confirmation of adequate anesthesia, the animals were allocated to two groups and received abdominal fat-pad injections of either control or LINC01871-overexpressing MDA-MB-231 cells. Tumor growth was designated as the primary outcome. Tumor dimensions were recorded with calipers at intervals of 3–4 days. Tumor volume was determined as V = ( L x W2 ) / 2', where L denotes the longest tumor diameter and W the shortest, with volume expressed in mm3. The study was terminated before any tumor reached a maximum diameter of 1.5 cm or a volume of 2,000 mm3. At the experimental endpoint, mice were anesthetized with isoflurane, and cervical dislocation was performed only after deep anesthesia had been confirmed. Animals were euthanized before the scheduled endpoint if substantial signs of distress were observed, including lethargy, weight loss, hunched posture, or inability to eat or drink. At study completion, tumors were removed and subsequently weighed and imaged.
Statistical analysis
Data analyses were conducted using GraphPad Prism version 10.3.1 and R version 4.3.1. The statistical method applied to each comparison was selected according to the study design and distribution of the corresponding data. As appropriate, analyses included Student’s t-test, paired t-test, Wilcoxon signed-rank test, Mann–Whitney U test, one-way or two-way analysis of variance (ANOVA), Kaplan–Meier analysis with the log-rank test, univariate Cox proportional hazards regression, and Pearson or Spearman correlation analysis. Statistical significance was defined using a two-sided P value <0.05.
結果
LINC01871 Is Closely Associated with Sensitivity to Ribociclib and Palbociclib
Predicted IC50 values for ribociclib and palbociclib were estimated for patients in the TCGA-BRCA cohort using GDSC2 data and arranged in ascending order. Patients within the lowest quartile of predicted IC50 values were assigned to the sensitive group, whereas those within the highest quartile were assigned to the resistant group (Figure 1A,B). Comparison of these groups identified differentially expressed lncRNAs for each drug (Supplementary Figure 1A,B). WGCNA further identified lncRNA modules significantly associated with predicted sensitivity to ribociclib and palbociclib (Figure 1C,D; Supplementary Figure 1C,D). Integration of the four resulting gene sets yielded 62 shared lncRNAs (Figure 1E), of which 18 were significantly associated with prognosis in both univariate Cox regression and Kaplan–Meier survival analyses. LASSO regression was then applied to further refine this set, resulting in six prognostically relevant lncRNAs: ANKRD44-AS1, AC083837.1, AC242842.1, DBH-AS1, LINC00926, and LINC01871 (Figure 1F,G; Supplementary Figure 2A). Their ability to discriminate predicted drug resistance was subsequently compared by AUC analysis. Among the six candidates, LINC01871 yielded the highest average AUC across ribociclib and palbociclib (Figure 1H–J; Supplementary Figure 2B,C).
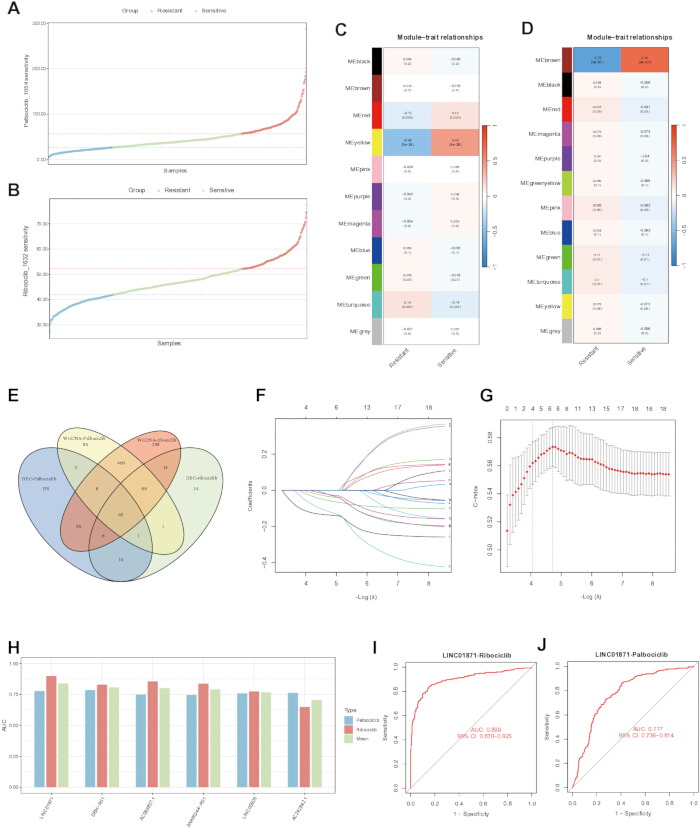
Figure 1. Identification of long non-coding RNAs associated with predicted sensitivity to ribociclib and palbociclib.
(A,B) Distribution of predicted half-maximal inhibitory concentration (IC50) values for palbociclib (A) and ribociclib (B) in the The Cancer Genome Atlas breast invasive carcinoma (TCGA-BRCA) cohort, estimated using the Genomics of Drug Sensitivity in Cancer 2 (GDSC2) dataset. (C,D) Weighted gene co-expression network analysis (WGCNA) showing module–trait associations for palbociclib (C) and ribociclib (D). (E) Venn diagram illustrating genes shared among the differentially expressed gene sets and WGCNA-derived gene sets associated with the two drugs. (F,G) Least absolute shrinkage and selection operator (LASSO) regression for selection of prognostically relevant long non-coding RNAs (lncRNAs). (H) Comparison of area under the receiver operating characteristic curve (AUC) values for the six lncRNAs selected by LASSO. (I,J) Receiver operating characteristic (ROC) curves assessing the ability of LINC01871 to discriminate predicted sensitivity to ribociclib (I) and palbociclib (J). Please click here to view a larger version of this figure.
Overexpression of LINC01871 Enhanced Drug Sensitivity in Breast Cancer Cells
Within the TCGA-BRCA cohort, higher LINC01871 expression was associated with lower predicted IC50 values for both ribociclib and palbociclib (Figure 2A,B). This relationship was further examined in the clinically relevant HR-positive/HER2-negative subgroup (n = 599). In this subgroup, predicted IC50 values for both agents were significantly lower among patients with high LINC01871 expression than among those with low expression. Furthermore, LINC01871 expression was inversely correlated with the predicted IC50 values of ribociclib and palbociclib (Supplementary Figure 3A,B). The computational association was subsequently examined experimentally. Cytotoxicity assays demonstrated greater sensitivity to both ribociclib and palbociclib in LINC01871-overexpressing breast cancer cells than in vector-control cells (Figure 2C,D). Flow cytometry showed a higher proportion of cells in G1 phase and a lower proportion in S phase following LINC01871 overexpression, consistent with enhanced G1-phase arrest (Figure 2E). In colony formation assays, increasing concentrations of either ribociclib or palbociclib progressively reduced colony formation (Figure 2F,G). At equivalent drug concentrations, colony-forming capacity was significantly lower in LINC01871-overexpressing cells than in vector-control cells. Western blot analysis additionally revealed lower levels of CDK4, CDK6, and cyclin D1, accompanied by reduced RB phosphorylation, in LINC01871-overexpressing cells (Figure 2H). These molecular changes were consistent with the greater G1-phase arrest observed following LINC01871 overexpression.
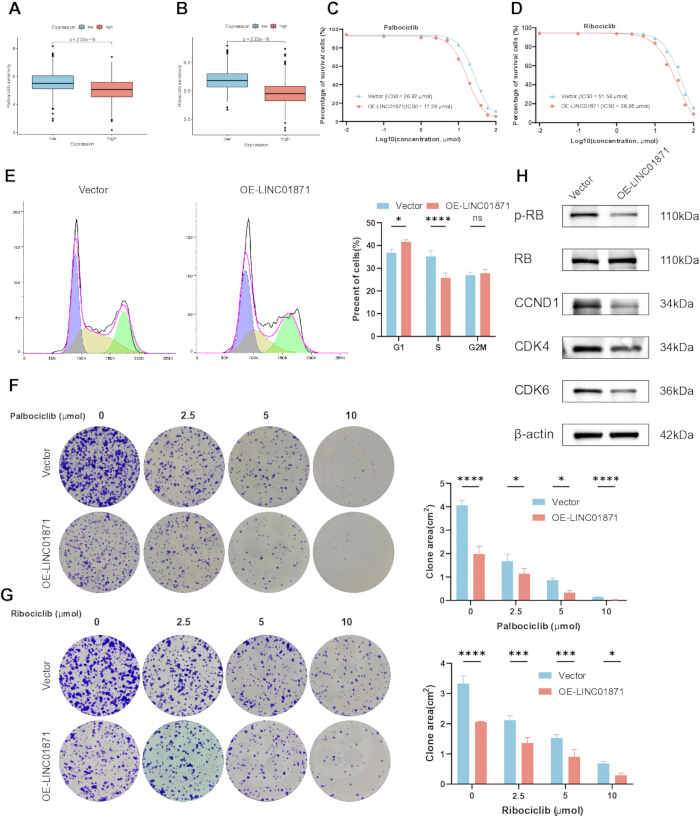
Figure 2. Association of LINC01871 overexpression with sensitivity to cyclin-dependent kinase 4/6 inhibitors in breast cancer cells. (A,B) Predicted sensitivity to palbociclib (A) and ribociclib (B) according to low or high LINC01871 expression. (C,D) Drug dose–response curves for palbociclib (C) and ribociclib (D) in vector-control and LINC01871-overexpressing cells, with the corresponding half-maximal inhibitory concentration (IC50) values indicated in each panel. (E) Flow cytometric assessment of cell-cycle distribution in vector-control and LINC01871-overexpressing cells. (F,G) Colony formation following treatment with increasing concentrations of palbociclib (F) and ribociclib (G). (H) Western blot assessment of cyclin-dependent kinase 4 (CDK4), cyclin-dependent kinase 6 (CDK6), cyclin D1 (CCND1), retinoblastoma protein (RB), and phosphorylated RB (p-RB), with β-actin serving as the loading control. OE-LINC01871, LINC01871 overexpression; ns, not significant. All experiments were independently conducted in triplicate. Data are presented as mean ± SD. IC50 values were determined by nonlinear regression. Cell-cycle distribution and colony formation data were analyzed using two-way ANOVA. *P < 0.05, **P < 0.01, ***P < 0.001, and ****P < 0.0001; ns, not significant. Please click here to view a larger version of this figure.
Patients with High LINC01871 Expression Tended to Have Favorable Clinical Outcomes
The prognostic association of LINC01871 was further examined in the TCGA-BRCA cohort. Kaplan–Meier analyses indicated that higher LINC01871 expression was generally associated with longer overall survival and progression-free interval (Figure 3A; Supplementary Figure 3C). Comparisons of both paired and unpaired samples also revealed significantly lower LINC01871 expression in tumor tissues than in normal tissues (Figure 3B,C). We next examined the relationship between LINC01871 expression and clinicopathological features. Lower LINC01871 expression tended to be associated with larger tumor size and was observed in patients recorded as deceased compared with those recorded as alive (Figure 3D,E). Among patients who received radiotherapy, subgroup analysis further showed significantly more favorable survival outcomes in those with high LINC01871 expression (Supplementary Figure 3D). A prognostic nomogram incorporating LINC01871 expression together with multiple clinical characteristics was subsequently developed (Supplementary Figure 3E). Calibration analysis showed close agreement between the survival probabilities estimated by the nomogram and the observed outcomes (Supplementary Figure 3F).
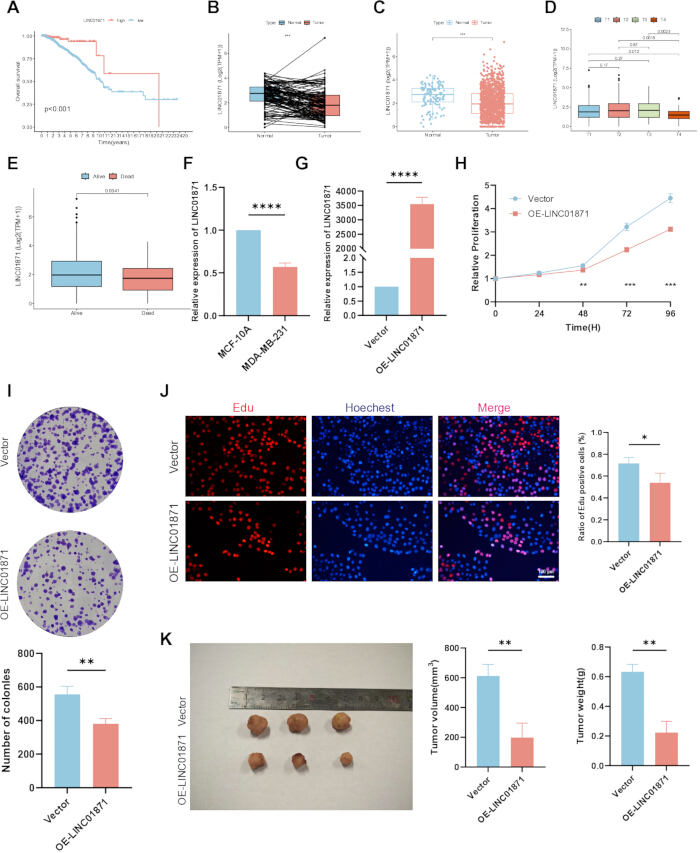
Figure 3. LINC01871 expression, prognostic associations, and suppression of breast cancer proliferation.
(A) Kaplan–Meier analysis of overall survival stratified by LINC01871 expression. (B,C) Paired (B) and unpaired (C) analyses comparing LINC01871 expression between normal and tumor tissues. (D,E) LINC01871 expression in relation to tumor T category (D) and survival status (E). (F) Comparison of relative LINC01871 expression between MCF-10A and MDA-MB-231 cells. (G) Reverse transcription quantitative polymerase chain reaction confirmation of LINC01871 overexpression in MDA-MB-231 cells. (H–J) Evaluation of cell proliferation by Cell Counting Kit-8 (CCK-8) assay (H), colony formation assay (I), and 5-ethynyl-2′-deoxyuridine (EdU) incorporation assay (J). The scale bar in panel J represents 100 μm. (K) Xenograft tumor appearance, volume, and weight in the vector-control and LINC01871-overexpression groups. TPM, transcripts per million; OE-LINC01871, LINC01871 overexpression. Overall survival was evaluated by Kaplan–Meier analysis with the log-rank test. Paired comparisons between tumor and normal tissues were assessed using the Wilcoxon signed-rank test. For the remaining two-group comparisons, an unpaired Student’s t-test or Mann–Whitney U test was selected after evaluating normality with the Shapiro–Wilk test. CCK-8 measurements were analyzed by two-way analysis of variance. In vitro experiments comprised three independent biological replicates, whereas xenograft experiments included three mice in each group. Data are presented as mean ± standard deviation. *P < 0.05, **P < 0.01, ***P < 0.001, and ****P < 0.0001; ns, not significant. Please click here to view a larger version of this figure.
Overexpression of LINC01871 Suppresses Tumor Cell Proliferation and Is Associated with Reduced NF-κB Signaling
The inhibitory effect of LINC01871 on tumor cell proliferation was further examined using in vitro and in vivo models. LINC01871 expression was significantly higher in the normal breast epithelial cell line than in the breast cancer cell line (Figure 3F). Successful establishment of the LINC01871-overexpression model was confirmed by RT-qPCR, which showed markedly elevated LINC01871 expression relative to the vector-control group (Figure 3G). CCK-8 assays subsequently revealed significantly reduced proliferative capacity in LINC01871-overexpressing cells (Figure 3H). Consistent with this finding, LINC01871 overexpression decreased colony-forming ability (Figure 3I) and reduced the proportion of EdU-positive cells (Figure 3J). In the xenograft model, tumors derived from LINC01871-overexpressing cells were significantly smaller than those derived from vector-control cells (Figure 3K).
To explore potential mechanisms underlying these effects, functional enrichment analyses were conducted using two gene sets: genes differentially expressed between the high- and low-LINC01871 expression groups and genes identified as co-expressed with LINC01871 by Pearson correlation analysis. GO analysis of these gene sets revealed associations with several immune-related functions, including T-cell receptor binding, major histocompatibility complex (MHC) protein complex binding, positive regulation of leukocyte activation, and immune receptor activity (Figure 4A,C). KEGG analysis similarly identified immune-associated pathways, including T-cell receptor signaling and the programmed death-ligand 1 (PD-L1) expression and programmed cell death protein 1 (PD-1) checkpoint pathway in cancer. Enrichment was also observed for the Janus kinase/signal transducer and activator of transcription (JAK-STAT) and NF-κB signaling pathways (Figure 4B,D). Because NF-κB signaling was identified in both enrichment analyses, its activity was further examined by western blotting. P65 phosphorylation was markedly lower in LINC01871-overexpressing cells than in the control group (Figure 4E), a finding consistent with reduced NF-κB pathway activation. The relationship between LINC01871 overexpression and apoptosis was also evaluated. Western blotting showed increased expression of the pro-apoptotic protein Bax and decreased expression of the anti-apoptotic protein Bcl-2 following LINC01871 overexpression (Figure 4F). Flow cytometry further revealed a significantly greater proportion of apoptotic cells in the LINC01871-overexpression group than in the vector-control group (Figure 4G).
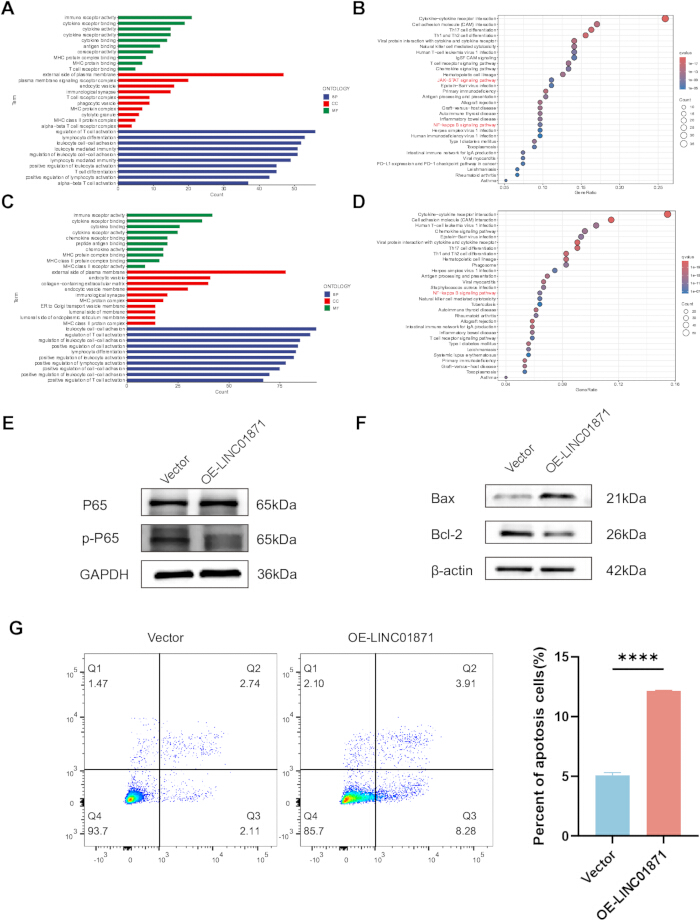
Figure 4. Association of LINC01871 with nuclear factor kappa B signaling and apoptosis.
(A,B) Gene Ontology (GO) (A) and Kyoto Encyclopedia of Genes and Genomes (KEGG) (B) enrichment analyses of genes showing differential expression between the high- and low-LINC01871 expression groups. (C,D) GO (C) and KEGG (D) enrichment analyses of genes co-expressed with LINC01871. (E) Western blot assessment of nuclear factor kappa B (NF-κB) pathway proteins P65 and phosphorylated P65 (p-P65), with glyceraldehyde-3-phosphate dehydrogenase (GAPDH) serving as the loading control. (F) Western blot assessment of the apoptosis-related proteins B-cell lymphoma 2 (Bcl-2) and Bcl-2-associated X protein (Bax), using β-actin as the loading control. (G) Flow cytometric assessment and quantification of apoptosis in vector-control and LINC01871-overexpressing cells. All in vitro experiments included three independent biological replicates. The western blot images shown are representative of three independent biological experiments. Data are presented as mean ± SD. Comparisons between vector-control and LINC01871-overexpressing cells were performed using an unpaired Student’s t-test or Mann–Whitney U test following assessment of normality with the Shapiro–Wilk test. *P < 0.05, **P < 0.01, ***P < 0.001, and ****P < 0.0001; ns, not significant. Please click here to view a larger version of this figure.
Pan-Cancer Analysis of LINC01871
Given the tumor-suppressive features associated with LINC01871 in breast cancer, we extended the analysis across multiple cancer types to characterize its expression and prognostic associations. Differential expression of LINC01871 was observed in several malignancies in addition to breast cancer (Figure 5A). In colon adenocarcinoma (COAD), kidney renal clear cell carcinoma (KIRC), kidney renal papillary cell carcinoma (KIRP), lung squamous cell carcinoma (LUSC), and thyroid carcinoma (THCA), significant differences between tumor and normal tissues were detected in both paired and unpaired comparisons (Figure 5B). Survival analyses further identified significant prognostic associations for LINC01871 in head and neck squamous cell carcinoma (HNSC), KIRC, brain lower grade glioma (LGG), rectum adenocarcinoma (READ), skin cutaneous melanoma (SKCM), uterine corpus endometrial carcinoma (UCEC), bladder urothelial carcinoma (BLCA), liver hepatocellular carcinoma (LIHC), and prostate adenocarcinoma (PRAD) (Figure 5C–E).
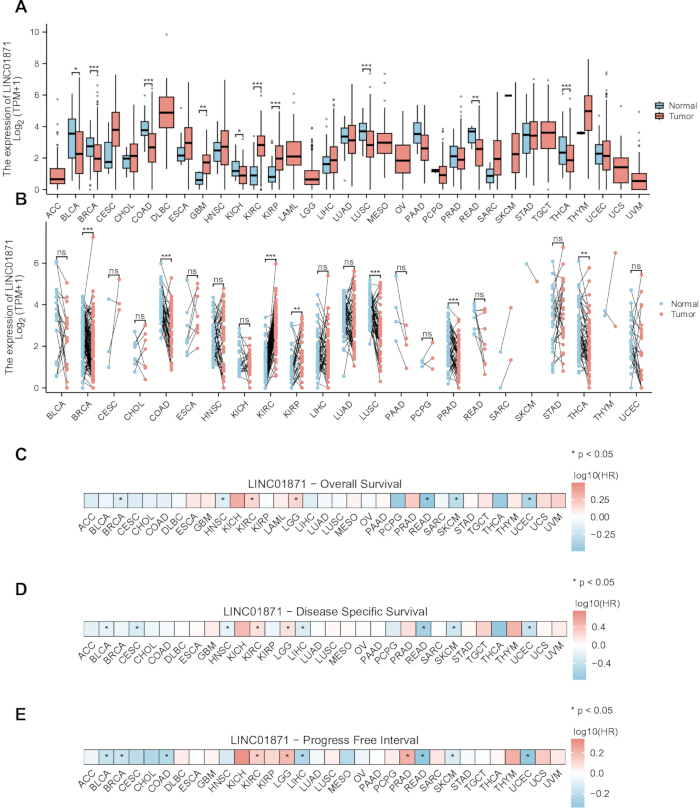
Figure 5. Pan-cancer expression and prognostic analyses of LINC01871.
(A,B) Comparison of LINC01871 expression between tumor and normal tissues across multiple cancer types using unpaired (A) and paired (B) analyses. (C–E) Prognostic associations of LINC01871 showing log-transformed hazard ratios for overall survival (C), disease-specific survival (D), and progression-free interval (E). HR, hazard ratio; TPM, transcripts per million; ns, not significant. Cancer-type abbreviations are based on The Cancer Genome Atlas nomenclature. Unpaired tumor–normal data were evaluated using the Mann–Whitney U test (A), while paired tumor–normal data were evaluated using the Wilcoxon signed-rank test (B). Associations with overall survival, disease-specific survival, and progression-free interval were examined by univariate Cox proportional hazards regression (C–E). *P < 0.05, **P < 0.01, ***P < 0.001, and ****P < 0.0001; ns, not significant. Please click here to view a larger version of this figure.
Correlation Between LINC01871 Expression and Immune Cell Infiltration
We next characterized the cellular distribution of LINC01871 using single-cell RNA-sequencing data from breast cancer samples (GSE161529). Following quality control, correction of batch effects, clustering, and cell-type annotation, the identified populations included epithelial cells, CD8⁺ T cells, T cells, macrophages, fibroblasts, natural killer (NK) cells, and B cells (Figure 6A). Among these populations, LINC01871 expression was most prominent in T cells and NK cells (Figure 6B,C). We therefore further examined the relationship between LINC01871 and the immune microenvironment using transcriptome-based infiltration estimates. CIBERSORT analysis indicated that the high-LINC01871 expression group had higher estimated proportions of several immune populations, including CD8⁺ T cells, NK cells, and M1 macrophages, together with lower estimated proportions of regulatory T cells (Tregs) and M2 macrophages (Figure 6D). Similarly, ESTIMATE-derived immune scores were higher in samples with high LINC01871 expression (Figure 6E). Analysis by ssGSEA using previously reported immune-cell marker genes produced broadly consistent patterns (Figure 6F). Extending this analysis across cancer types showed significant correlations between LINC01871 expression and the estimated abundance of multiple immune cell populations (Figure 6G).
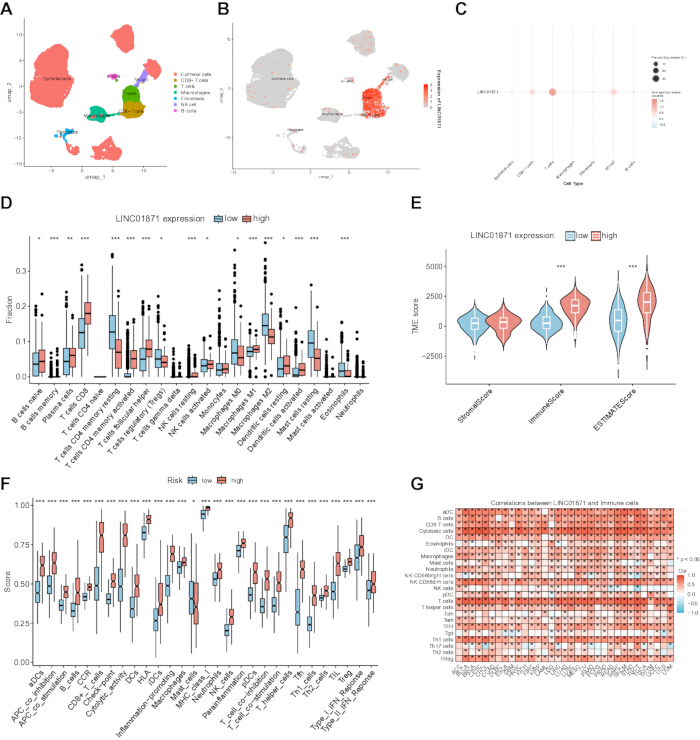
Figure 6. Single-cell expression and immune infiltration analyses of LINC01871.
(A) Uniform Manifold Approximation and Projection (UMAP) representation of annotated cell populations identified from single-cell RNA-sequencing data. (B) UMAP feature plot depicting the distribution of LINC01871 expression among the annotated cell populations. (C) Dot plot displaying the proportion of LINC01871-expressing cells and scaled average expression for each cell type. (D) Relative proportions of 22 immune cell populations in the low- and high-LINC01871 expression groups, estimated by Cell-type Identification by Estimating Relative Subsets of RNA Transcripts (CIBERSORT). (E) Stromal, immune, and tumor microenvironment scores derived using Estimation of STromal and Immune cells in MAlignant Tumour tissues using Expression data (ESTIMATE). (F) Immune-related scores obtained by single-sample gene set enrichment analysis (ssGSEA) in the low- and high-LINC01871 expression groups. (G) Pan-cancer associations between LINC01871 expression and immune cell infiltration estimated using ssGSEA. NK, natural killer; TME, tumor microenvironment. Cancer-type abbreviations are based on The Cancer Genome Atlas nomenclature. Differences between the low- and high-LINC01871 expression groups were evaluated using the Mann–Whitney U test (D–F). Pan-cancer associations between LINC01871 expression and immune cell infiltration were evaluated using Spearman correlation analysis (G). *P < 0.05, **P < 0.01, ***P < 0.001, and ****P < 0.0001; ns, not significant. Please click here to view a larger version of this figure.
Data Availability:
The datasets analyzed in this study are publicly available from The Cancer Genome Atlas (TCGA; https://portal.gdc.cancer.gov) and the Gene Expression Omnibus (GEO; https://www.ncbi.nlm.nih.gov/geo/). The datasets used include the TCGA-BRCA cohort and GSE161529 (https://www.ncbi.nlm.nih.gov/geo/query/acc.cgi?acc=GSE161529). Supplementary Figures 1–3 provide additional bioinformatic and prognostic analyses. Supplementary Table 1 lists the primer sequences used for reverse transcription quantitative polymerase chain reaction (RT-qPCR), and Supplementary Table 2 lists the primary and secondary antibodies used for western blot analysis. The R scripts used for the bioinformatic and statistical analyses are provided as Supplementary File 1.
Supplementary Figure 1. Identification of differentially expressed genes and weighted gene co-expression network modules associated with predicted CDK4/6 inhibitor sensitivity.
(A,B) Volcano plots showing differentially expressed genes between the predicted resistant and predicted sensitive groups for ribociclib (A) and palbociclib (B). (C,D) Cluster dendrograms generated by WGCNA showing gene clustering and module assignment for ribociclib (C) and palbociclib (D). Differentially expressed genes were defined as those with an absolute log2 fold change of ≥0.5 and an adjusted P value of <0.05. Please click here to download this file.
Supplementary Figure 2. Prognostic and predictive performance of five additional candidate lncRNAs.
(A) Kaplan–Meier survival analyses of five additional candidate lncRNAs identified by LASSO regression. (B,C) Receiver operating characteristic curve analyses showing the diagnostic performance of these five lncRNAs for predicting resistance to ribociclib (B) and palbociclib (C). Corresponding analyses of LINC01871 are presented in Figures 1 and 3. Please click here to download this file.
Supplementary Figure 3. Prognostic evaluation of LINC01871 in breast cancer.
(A) Predicted half-maximal inhibitory concentration (IC50) values for ribociclib and palbociclib in the high- and low-LINC01871 expression groups within the hormone receptor-positive/human epidermal growth factor receptor 2-negative (HR-positive/HER2-negative) subgroup. (B) Spearman correlation analyses between LINC01871 expression and predicted IC50 values for ribociclib and palbociclib in the HR-positive/HER2-negative subgroup. (C) Kaplan–Meier survival analysis of progression-free interval (PFI) according to LINC01871 expression. (D) Kaplan–Meier survival analysis of patients who received radiotherapy stratified by LINC01871 expression. (E) Nomogram integrating LINC01871 expression and clinicopathological characteristics for predicting overall survival in the overall TCGA-BRCA cohort. (F) Calibration curves evaluating the agreement between predicted and observed survival probabilities for the nomogram at 1, 3, and 5 years. Comparisons in panel A were analyzed using the Mann–Whitney U test, and correlations in panel B were assessed using Spearman correlation analysis. IC50, half-maximal inhibitory concentration; PFI, progression-free interval; HR, hormone receptor; HER2, human epidermal growth factor receptor 2. *P < 0.05, **P < 0.01, ***P < 0.001, and ****P < 0.0001; ns, not significant. Please click here to download this file.
Supplementary Table 1. Primer sequences used for reverse transcription quantitative polymerase chain reaction (RT-qPCR).
Forward and reverse primer sequences (5′→3′) used for RT-qPCR analysis of LINC01871 and the endogenous reference gene GAPDH. Please click here to download this file.
Supplementary Table 2. Primary and secondary antibodies used for western blot analysis.
Primary and secondary antibodies used for western blot analysis, including the target protein or antibody specificity, supplier, catalog number, host species, working dilution, and Research Resource Identifier (RRID). Please click here to download this file.
Supplementary File 1. R scripts used for bioinformatic and statistical analyses.
This supplementary file contains the R scripts used to generate the bioinformatic analyses and figures presented in this study, including transcriptomic analysis, differential expression analysis, weighted gene co-expression network analysis (WGCNA), least absolute shrinkage and selection operator (LASSO) regression, survival analysis, receiver operating characteristic (ROC) analysis, functional enrichment analysis, immune infiltration analysis, single-cell RNA sequencing analysis, and figure generation. Individual scripts correspond to the main and supplementary figures presented in the manuscript. Please click here to download this file.
ディスカッション
がん生物学への理解が深まったことで、新たな治療標的が同定され、分子標的療法ががん治療の重要な構成要素として確立されました17。しかし、治療耐性の出現が、依然としてその長期的な有効性を制限しています。本研究では、マルチオミクス解析と機械学習アプローチの統合により、リボシクリブおよびパルボシクリブへの予測感受性と関連する候補としてLINC01871を同定しました。実験的解析により、LINC01871の過剰発現がin vitroにおいて両剤への感受性を高め、細胞ベースモデルおよび異種移植モデルにおいて乳がん細胞の増殖を抑制することがさらに示されました。これらの効果はNF-κBパスウェイの活性低下を伴っており、LINC01871とこのシグナル伝達パスウェイとの間に潜在的な関係があることが示唆されました。これらの知見は、CDK4/6阻害剤ベースの治療における治療決定のためのバイオマーカー利用の増加に関連している可能性があります。しかし、LINC01871を支持するエビデンスは、確立されたバイオマーカー誘導アプローチで利用可能なものとは大きく異なります。例えば、ESR1変異の循環腫瘍DNAモニタリングは、内分泌療法の適応戦略として前向き評価が行われています。対照的に、LINC01871は依然として候補バイオマーカーであり、現時点では臨床的な意思決定に適しているとは考えられません。HR陽性/HER2陰性の転移性乳がんにおいて、CDK4/6阻害剤ベースの治療後に増悪した後の治療選択肢として、現在は経口選択的エストロゲン受容体分解薬、PI3K/AKTパスウェイ阻害剤、および抗体薬物複合体が含まれるため18,19、この区別は特に重要です。この進化し続ける治療環境において、CDK4/6阻害剤の感受性の違いを区別できるバイオマーカーは、治療の層別化を支援できる可能性があります。我々の知見はLINC01871とリボシクリブおよびパルボシクリブへの感受性との関連を支持していますが、現在のエビデンスは薬剤感受性の計算上の推定値とin vitro実験に基づいたものです。したがって、LINC01871が患者において予測価値を持つかどうかを判断するには、CDK4/6阻害剤への曝露と臨床結果が記録された前向きコホート研究が必要となるでしょう。
エストロゲン受容体および/またはプロゲステロン受容体陽性乳がんにおけるCDK4/6阻害剤の治療的有用性は、複数の臨床試験で実証されています4,5,6。トリプルネガティブ乳がんにおける潜在的な有用性についても研究が進められています20,21。例えば、Yangらは、CDK4/6とCDK7を同時に標的とすることで、トリプルネガティブ乳がん細胞の増殖が抑制されることを見出しました22。その他の研究では、CDK4/6阻害に対する反応性を修飾し得る分子的な変異が特定されています。GPX4の阻害は、エストロゲン受容体陽性およびトリプルネガティブ乳がんの両方においてパルボシクリブへの感受性を高めることが報告されており23、一方でC9orf142は、トリプルネガティブ乳がんにおけるCDK4/6阻害剤への耐性に関連しているとされています20。逆に、ACAA1の阻害は、乳がん細胞のCDK4/6阻害剤に対する感受性を増強することが報告されています24。CDK4/6阻害剤の反応性を決定する分子要因に関する既存の研究の多くはタンパク質コード遺伝子に焦点を当てており、lncRNAの寄与については十分に解明されていません。本研究では、LINC01871がCDK4/6阻害剤の反応性に関連する潜在的な非コードRNAであることを特定し、この領域の知見を拡張しました。細胞毒性試験およびコロニー形成試験に加え、フローサイトメトリーによる評価と細胞周期関連タンパク質の解析により、LINC01871の過剰発現がリボシクリブおよびパルボシクリブに対する感受性の増大と一貫して関連していることが示されました。独立した増殖試験および異種移植モデルにより、LINC01871の過剰発現と乳がんの増殖との間に抑制的な関連があることがさらに裏付けられました。
これらの観察結果の根底にある可能性のあるメカニズムを探索するため、LINC01871高発現群と低発現群の間で差次的に発現している遺伝子、およびLINC01871と共発現している遺伝子の機能プロファイルを解析した。GOおよびKEGG解析により、これら両方の遺伝子セットが免疫関連プロセスおよびNF-κBシグナリングに関連していることが明らかになった。NF-κBシグナリングは、サイクリンDの発現を増加させ、それによって細胞周期の進行を促進することが以前に報告されており25,26、この知見は細胞周期調節に関連している。さらにZhouらは、NF-κBがCDK6プロモーターと相互作用し、CDK6の転写を刺激し得ることを示した27。NF-κBとPI3K/AKT/mTOR経路とのクロストークについても報告されており28、後者の経路はCDK4/6阻害剤への耐性に関与している11。以上の観察結果から、LINC01871の文脈においてNF-κB活性を検討する根拠が得られた。濃縮解析の結果と一致して、LINC01871を過剰発現させた細胞では、P65のリン酸化レベルが低下していた。しかしながら、これらのデータは相関関係を示すものであり、直接的な制御メカニズムを立証するものではなく、LINC01871がどのようにNF-κBシグナリングに影響を与えるかは依然として解明されていない。
免疫微小環境もまた、CDK4/6阻害剤への反応性に寄与するもう一つの潜在的な要因と考えられます。例えば、γδ T細胞は、CX3CR1⁺マクロファージを介した作用により耐性を促進することが報告されています29。Luoらは、CDK4/6阻害剤に対して後日に耐性を獲得した患者の腫瘍において、CD8⁺ T細胞およびNK細胞の浸潤がより顕著であることを観察しました30。我々のシングルセル解析では、LINC01871の発現が上皮細胞よりもT細胞およびNK細胞においてより顕著であることが示されました。補完的なトランスクリプトーム解析では、LINC01871の高発現が、CD8⁺ T細胞、M1マクロファージ、およびNK細胞の推定浸潤量の増加と、M2マクロファージおよびTregsの推定浸潤量の減少と相関していました。CD8⁺ T細胞、M1マクロファージ、およびNK細胞は抗腫瘍免疫活性に関連している一方で、M2マクロファージは腫瘍促進機能に関連しています31,32,33,34。総合すると、これらの結果は、LINC01871の高発現がより免疫活性の高い腫瘍微小環境と関連している可能性を示唆しています。ただし、免疫細胞の推定値は直接測定されたものではなく、トランスクリプトームプロファイルから推測されたものであるため、この解釈は依然として予備的なものであり、LINC01871が免疫微小環境の形成に役割を果たすかどうかを確定させるには、機能的研究が必要となります。
これらの知見を解釈する際には、いくつかの制限事項を認める必要があります。第一に、LINC01871は統合的なマルチオミクス解析によって同定されましたが、そこでの薬物反応性は計算によって推論されたものであり、CDK4/6阻害剤を投与された患者から得られたものではありません。in vitroでの直接的な実験では、LINC01871の過剰発現後にパルボシクリブおよびリボシクリブに対する感受性が高まることが示されましたが、これらの結果は患者における予測価値を確立するものではありません。したがって、LINC01871を予測バイオマーカーとして評価するためには、CDK4/6阻害剤への曝露と臨床的な反応データが記録された独立したコホートが必要となります。第二に、探索的解析は、臨床的に不均一な乳がんサブタイプを含むTCGA-BRCAコホート全体で最初に行われました。LINC01871と予測薬物感受性との関連は、HR陽性/HER2陰性サブグループ内でも観察されましたが、実際に治療を受けたHR陽性/HER2陰性集団での確認が依然として必要です。第三に、本研究で使用したGDSC2データセットにアベマシクリブの対応する反応データが含まれていなかったため、薬物反応解析はパルボシクリブとリボシクリブに限定されました。したがって、観察された関連性がアベマシクリブまで及ぶかどうかは不明なままです。第四に、細胞ベースの実験およびゼノグラフト実験で腫瘍抑制効果が観察されたにもかかわらず、LINC01871とNF-κBシグナル伝達の分子的な関連は確立されていません。LINC01871の過剰発現に伴いP65のリン酸化が減少しましたが、この関連をもたらすメカニズムについてはさらなる調査が必要です。同様に、免疫関連の観察結果は主にトランスクリプトームベースの計算解析から得られたものであり、LINC01871が腫瘍免疫微小環境を直接制御しているという証拠ではなく、関連性として解釈されるべきです。最後に、CDK4/6阻害剤耐性は複数の生物学的プロセスに関与しており、LINC01871だけで治療反応の全複雑性を説明できる可能性は低いです。したがって、今後の研究では、サブタイプ特異的なコホートの組み込み、アベマシクリブの評価、免疫関連の関連性の実験的検証、LINC01871とNF-κBシグナル伝達の関係に関するメカニズム研究、およびLINC01871が予測バイオマーカーとして有用であるかを決定するための前向き臨床評価を行うべきです。
開示事項
利益相反:
著者らは、競合する利益がないことを宣言します。
謝辞
本研究は、福建省自然科学基金(助成金番号:2022J011056)の支援を受けて行われました。著者らは、本研究で使用した公開データセットを提供したThe Cancer Genome Atlas (TCGA)およびGene Expression Omnibus (GEO)に謝意を表します。
材料
| 名前 | 会社 | カタログ番号 | コメント |
|---|---|---|---|
| 25 G 注射針 | Beyotime | FS802-30pcs | 開口器および必要に応じた歯周靭帯の事前緩衝に使用する使い捨て注射針 |
| 4% パラホルムアルデヒド溶液 | Solarbio | P1110 | 試料固定に使用する 4% パラホルムアルデヒド溶液 |
| 75% エタノール | Ouse Medical Devices Store | N/A | 表面消毒に使用する 75% 医療用エタノール |
| C57BL/6 マウス | Charles River | 213 | 体重 22–29 g の 8 週齢 C57BL/6 オスマウス |
| カロプロフェン | Solarbio | C5350 | 5 mg/kg で皮下投与する術後鎮痛剤 |
| 脱脂綿 | Ouning Medical Devices | N/A | 口腔清掃および止血に使用する滅菌脱脂綿 |
| CTAn v1.18.4.0+ | SkyScan | N/A | μCT 画像解析に使用するソフトウェア |
| DataViewer v1.5.6.2 | SkyScan | N/A | 再構成された μCT 画像の閲覧および書き出しに使用するソフトウェア |
| フィンガースリーブ | LeSu Office | MEKU-1/2/3B | 抜歯時の親指保護に使用するフィンガースリーブ |
| フォームボード | Dongguan Lijianglong Industrial Co., Ltd. | N/A | 手術および固定プラットフォームとして使用するフォームボード |
| ゲルダイエット | ReadyDietech | J10001 | 使用する場合、術後 3 日間ケージ床に提供する術後用飼料 |
| GraphPad Prism v10.1.2 | GraphPad | RRID: SCR_002798 | 統計解析およびグラフ作成に使用するソフトウェア |
| ヘッドランプ | Bazhou Pengen Protective Equipment Factory | N/A | 術野の照明に使用するヘッドランプ |
| ヒートパッド | Shijiazhuang Jianuan Electrical Appliances Co., Ltd. | N/A | 術後回復のため、約 38 °C に予熱したヒートパッド |
| ヒドロキシアパタイトファントム | QRM | QRM-70127 | CT 減弱値を骨密度に変換するために使用する校正用ファントム |
| 拡大鏡 | Olympus Corporation | SZX10 | 有歯ピンセットの先端および抜歯窩を拡大して確認するための装置 |
| マスク | Senlun Medical Devices Specialty Store | N/A | サージカルマスク |
| マイクロコンピューター断層撮影装置 | Bruker SkyScan | SkyScan 1276 | 80 kV、500 μA、ボクセル解像度 10 μm で使用する μCT スキャナー |
| Mimics Research v21.0 | Materialise | RRID: SCR_015802 | 三次元再構成に使用するソフトウェア |
| ペントバルビタールナトリウム | Sigma-Aldrich | P3761 | 1% 麻酔溶液として使用するペントバルビタールナトリウム塩 |
| リン酸緩衝生理食塩水溶液 | Solarbio | P1010 | 0.01 M リン酸緩衝生理食塩水パウダー、pH 7.2–7.4 |
| ポビドンヨード消毒液 | Belkon Pharmacy Flagship Store | N/A | 腹部消毒に使用するポビドンヨード溶液 |
| ゴムバンド | Foshan Puli Rubber Products Factory | N/A | 開口器の組み立てに使用するゴムバンド |
| 生理食塩水溶液 | Thermo Fisher | BR0053G | 口腔清掃用溶液の調製に使用する生理食塩水タブレット |
| 標準飼料 | Jiangsu Xietong Pharmaceutical and Biotechnology Engineering Co., Ltd. | XTC01WC-001 | 通常飼育に使用し、術後の給餌には軟化させて使用する標準飼料 |
| 高圧蒸気滅菌器 | Institutional facility | N/A | 有歯ピンセットおよび生理食塩水溶液を滅菌するための装置 |
| 滅菌綿棒 | Kangbailai Medical Devices Store | N/A | 使い捨て滅菌綿棒 |
| 滅菌手袋 | Senlun Medical Devices Specialty Store | N/A | 滅菌ラテックス手袋 |
| 滅菌不織布 | Shandong Xinhua Infection Control Supplies Hangzhou Store | N/A | 手術面およびヒートパッドを覆うために使用する滅菌不織布 |
| 滅菌サージカルキャップ | Senlun Medical Devices Specialty Store | N/A | 滅菌サージカルキャップ |
| サージカルスクラブ | Senlun Medical Devices Specialty Store | N/A | 処置中に着用する清潔なサージカルスクラブ |
| テープ | Thermo Fisher | 15947 | マウスの肢を固定するために使用する粘着テープ |
| 有歯眼科用ピンセット | Beyotime | FS229 | 歯科用鉗子として使用する有歯眼科用鉗子 |
| 動物用眼軟膏 | Dechra Veterinary Products | 143-16 | 角膜の乾燥を防ぐため、麻酔後に塗布する眼軟膏 |
参考文献
- Bray F, et al. Global cancer statistics 2022: GLOBOCAN estimates of incidence and mortality worldwide for 36 cancers in 185 countries. CA Cancer J Clin. 2024;74(3):229-63.
- Xiong X, et al. Breast cancer: Pathogenesis and treatments. Signal Transduct Target Ther. 2025;10(1):49.
- Ye F, et al. Advancements in clinical aspects of targeted therapy and immunotherapy in breast cancer. Mol Cancer. 2023;22(1):105.
- Johnston SRD, et al. Abemaciclib plus endocrine therapy for hormone receptor-positive, HER2-negative, node-positive, high-risk early breast cancer (monarchE): Results from a preplanned interim analysis of a randomised, open-label, phase 3 trial. Lancet Oncol. 2023;24(1):77-90.
- Slamon D, et al. Ribociclib plus endocrine therapy in early breast cancer. N Engl J Med. 2024;390(12):1080-91.
- Finn RS, et al. The cyclin-dependent kinase 4/6 inhibitor palbociclib in combination with letrozole versus letrozole alone as first-line treatment of oestrogen receptor-positive, HER2-negative, advanced breast cancer (PALOMA-1/TRIO-18): A randomised phase 2 study. Lancet Oncol. 2015;16(1):25-35.
- Morrison L, Loibl S, Turner NC. The CDK4/6 inhibitor revolution-a game-changing era for breast cancer treatment. Nat Rev Clin Oncol. 2024;21(2):89-105.
- Guo Z, et al. Cyclin-dependent kinase 4 and 6 inhibitors in breast cancer treatment. Oncogene. 2025;44(17):1135-52.
- Vora SR, et al. CDK4/6 inhibitors sensitize PIK3CA-mutant breast cancer to PI3K inhibitors. Cancer Cell. 2014;26(1):136-49.
- Foffano L, et al. Cyclin-dependent kinase 4 and 6 inhibitors (CDK4/6i): Mechanisms of resistance and where to find them. Breast. 2025;79:103863.
- Hao C, et al. PI3K/AKT/mTOR inhibitors for hormone receptor-positive advanced breast cancer. Cancer Treat Rev. 2025;132:102861.
- Bidard FC, et al. Switch to fulvestrant and palbociclib versus no switch in advanced breast cancer with rising ESR1 mutation during aromatase inhibitor and palbociclib therapy (PADA-1): A randomised, open-label, multicentre, phase 3 trial. Lancet Oncol. 2022;23(11):1367-77.
- Bidard FC, et al. First-line camizestrant for emerging ESR1-mutated advanced breast cancer. N Engl J Med. 2025;393(6):569-80.
- Zhang D, et al. Cancer-associated fibroblasts promote tumor progression by lncRNA-mediated RUNX2/GDF10 signaling in oral squamous cell carcinoma. Mol Oncol. 2022;16(3):780-94.
- Chen F, et al. Extracellular vesicle-packaged HIF-1α-stabilizing lncRNA from tumour-associated macrophages regulates aerobic glycolysis of breast cancer cells. Nat Cell Biol. 2019;21(4):498-510.
- Chen X, et al. Estrogen-induced lncRNA LINC02568 promotes estrogen receptor-positive breast cancer development and drug resistance through both in trans and in cis mechanisms. Adv Sci (Weinh). 2023;10(25):e2206663.
- Huang R, Zhou PK. DNA damage repair: Historical perspectives, mechanistic pathways and clinical translation for targeted cancer therapy. Signal Transduct Target Ther. 2021;6(1):254.
- Güren AK, et al. Post-CDK4/6 inhibitor treatment landscape in metastatic hormone receptor-positive breast cancer: A narrative review. Expert Rev Anticancer Ther. 2026;26(4):425-35.
- Güren AK, et al. Efficacy and safety of sacituzumab govitecan in hormone receptor-positive metastatic breast cancer: A systematic review and meta-analysis. J Oncol Pharm Pract. 2026. doi:10.1177/10781552261462434.
- Liao L, et al. C9orf142 transcriptionally activates MTBP to drive progression and resistance to CDK4/6 inhibitors in triple-negative breast cancer. Clin Transl Med. 2023;13(11):e1480.
- Zhu X, et al. Efficacy and mechanism of the combination of PARP and CDK4/6 inhibitors in the treatment of triple-negative breast cancer. J Exp Clin Cancer Res. 2021;40(1):122.
- Yang Y, et al. Dual inhibition of CDK4/6 and CDK7 suppresses triple-negative breast cancer progression via epigenetic modulation of SREBP1-regulated cholesterol metabolism. Adv Sci (Weinh). 2025;12(5):e2413103.
- Herrera-Abreu MT, et al. Inhibition of GPX4 enhances CDK4/6 inhibitor and endocrine therapy activity in breast cancer. Nat Commun. 2024;15(1):9550.
- Peng WT, et al. Inhibition of ACAA1 restrains proliferation and potentiates the response to CDK4/6 inhibitors in triple-negative breast cancer. Cancer Res. 2023;83(10):1711-24.
- Joyce D, et al. NF-κB and cell-cycle regulation: The cyclin connection. Cytokine Growth Factor Rev. 2001;12(1):73-90.
- Iwanaga R, et al. Activation of the cyclin D2 and CDK6 genes through NF-κB is critical for cell-cycle progression induced by HTLV-I Tax. Oncogene. 2008;27(42):5635-42.
- Zhou B, et al. Bortezomib suppresses self-renewal and leukemogenesis of leukemia stem cells by NF-κB-dependent inhibition of CDK6 in MLL-rearranged myeloid leukemia. J Cell Mol Med. 2021;25(6):3124-35.
- Yu M, et al. Baicalein increases cisplatin sensitivity of A549 lung adenocarcinoma cells via the PI3K/AKT/NF-κB pathway. Biomed Pharmacother. 2017;90:677-85.
- Petroni G, et al. IL-17A-secreting γδ T cells promote resistance to CDK4/CDK6 inhibitors in HR-positive/HER2-negative breast cancer via CX3CR1-positive macrophages. Nat Cancer. 2025;6(10):1656-75.
- Luo L, et al. Single-cell RNA sequencing identifies molecular biomarkers predicting late progression to CDK4/6 inhibition in patients with HR-positive/HER2-negative metastatic breast cancer. Mol Cancer. 2025;24(1):48.
- Komuro H, et al. Single-cell sequencing of CD8-positive tumor-infiltrating lymphocytes revealed the nature of exhausted T cells recognizing neoantigens and cancer/testis antigens in non-small cell lung cancer. J Immunother Cancer. 2023;11(8):e007180.
- Rafei H, et al. CREM is a regulatory checkpoint of CAR and IL-15 signalling in NK cells. Nature. 2025;643(8073):1076-86.
- Van Elsas MJ, et al. Immunotherapy-activated T cells recruit and skew late-stage activated M1-like macrophages that are critical for therapeutic efficacy. Cancer Cell. 2024;42(6):1032-50.e1010.
- Yang J, et al. STK11 coordinates IL-4 signaling with metabolic reprogramming to control M2 macrophage polarization and antitumor immunity. Sci Adv. 2025;11(39):eadx5495.