この行動科学および心理学的アセスメントのプロトコルは、大学生におけるインターネット依存と感情調節の困難さを評価するため、オンライン質問票の実施、採点、データ品質のスクリーニング、および再現性のある分析を標準化したものです。
この記事について
サマリー
要約
インターネットの利用は大学生活に深く組み込まれていますが、問題のあるインターネット利用を、単なる利用時間だけで適切に評価することはできません。不適応的または強迫的なインターネット利用パターンは、感情調節の困難さと関連していることが示唆されていますが、質問票の順序、適格性基準、スクリーニングの閾値、スコアリング手順、および分析報告における不一致が、研究間での比較可能性を制限し続けています。本メソッド論文では、大学生のインターネット依存と感情調節の困難さを調査する行動科学および心理学的アセスメント研究のための、標準化された質問票プロトコルを提示します。このワークフローには、固定された質問票の順序、事前に規定された適格性基準、必須回答設定、パイロット試験に基づく回答完了時間の閾値、逐次的なデータ品質スクリーニング、Internet addiction testおよび16項目のdifficulties in emotion regulation scaleの標準化されたスコアリング、そして再現可能な記述的、相関的、および多変数回帰分析が含まれます。また、本プロトコルでは、生の回答データ、スクリーニングログ、README/コードブックファイル、および最終的な分析準備済みデータセットのアーカイブについても指定しています。器具の妥当性を検証したり有病率を確立したりするためではなく、本プロトコルの実行を実証するために、代表的な実施例を報告します。その実施において、520人の学生に依頼し、480件の質問票が回収されました。重複投稿、極端に速い回答、アテンションチェックの不合格、パターン的な回答、論理的な不整合、および主要データの欠損を逐次的に除外した結果、452件の有効な質問票が保持されました。事前に定義された分析デモンストレーションでは、Internet addiction testの合計スコアとdifficulties in emotion regulation scaleの合計スコアとの関連を検討しました。保持されたサンプルでは、Internet addiction testの合計スコアの平均は51.94、Difficulties in emotion regulation scaleの合計スコアの平均は35.95でした。感情調節の困難さは、インターネット依存の重症度グループにわたって増大しており、人口統計学的および行動的な共変量で調整した後も、その関連性は明確に認められました。本プロトコルは、大学 populationsにおける今後の横断的研究、反復測定研究、または縦断的研究において、繰り返し、監査し、適応させることが可能な透明性の高いワークフローを提供します。
概要
インターネットの利用は、学術的な作業、社会的コミュニケーション、娯楽、情報収集、そして感情的な対処など、大学生活における日常的な一部となっています。そのため、学生のインターネット上の行動は、単に画面への露出やオンライン時間として解釈されるべきではありません。以前の知見では、現在のモバイルプラットフォーム環境が高度に飽和する前から、若年層や大学生において問題のあるインターネット利用がすでに顕著であったことが示されています1。より最近の大学を対象とした研究では、問題のあるインターネット利用が、非公式な記述ではなく系統的な評価を必要とするほど一般的であることがさらに示されています2。
大学生は、学業上のプレッシャー、社会的な移行、自立した生活、そして自律性の向上がしばしば同じ発達段階で同時に起こるため、標準化された評価において特に重要な集団です。これらの要求は、しばしば制御が困難になる可能性のあるデジタルデバイスやプラットフォームを通じて管理されています。メタ分析によるレビューでは、学生の間での問題のあるインターネット利用が複数のメンタルヘルスのアウトカムに関連していることが示されており、それが単なる限定的なテクノロジー利用の問題ではなく、より広範な行動的および心理的な懸念であるという解釈を支持しています3。また、大学生における知覚されたストレスとインターネット依存のパターンの関連も報告されており、この分野で質問票ベースの研究を設計する際には、感情的および文脈的なプレッシャーを考慮すべきであることが示唆されています4。
本プロトコルでは、「インターネット依存症」という用語を、インターネット依存症テストによって測定される構成概念およびその確立されたスコアカテゴリーに特化して使用します。「問題のあるインターネット利用」というより広義の用語は、不適応的、過剰、または機能障害を伴うインターネット関連行動に関するより広範な文献について論じる際に使用します。「強迫的なインターネット利用」は、引用文献がコントロールの喪失、衝動、または否定的な結果にもかかわらず繰り返される利用を強調している場合にのみ使用します。したがって、これらの用語は関連していますが、完全に互換性があるものとしては扱いません。本プロトコルをインターネット依存症テストを用いて実施する場合、「インターネット依存症」をツール固有の用語として維持します。代替ツールや改訂ツールを使用する場合は、用語を選択した測定尺度の構成概念ラベルおよび診断上の前提に合わせて調整してください。
感情調節は、一部の学生が頻繁なインターネット利用から不適応的なインターネット利用へと移行する理由を理解するための、妥当な心理学的アプローチを提供します。1年間の前向き研究により、大学生におけるインターネット依存のその後の発症および寛解の両方に、感情調節の困難さが関連していることが示されました5。感情調節は単なる付随的な相関要因ではなく、学生が苦痛を回避、軽減、または管理するためにどのようにインターネットを利用するかに影響を与える可能性があるため、この知見はプロトコルの設計において重要です。同時に、社会的機能も引き続き重要です。大学生における問題のあるインターネット利用は、社会的スキルと関連しており、対人間および感情的要因をデジタル利用の変数とともに評価すべきであることが示唆されています6。COVID-19の期間中、中国の大学生において、問題のあるインターネット利用はより広範な心理的困難と併発しており、大学環境における構造化されたアセスメントの必要性がさらに裏付けられています7。
さらなる課題は、デジタル行動が不均一であることです。学生は学習、社会的交流、娯楽、健康情報の収集、あるいは一時的な感情的緩和のためにデジタルプラットフォームを利用する場合があり、高頻度の利用すべてが有害であるわけではありません。大学生によるメンタルヘルスに関連するデジタル利用に関する系統的レビューでは、デジタルエンゲージメントが複数の心理的目的を果たし得ることが示されました8。したがって、この分野では、通常の高頻度利用と、問題のある利用または調節不全な利用を区別する手順が必要です。大学生における問題のあるスマートフォン利用に関する最近の知見も同様に、リスクは単なる利用時間ではなく、行動パターン、機能、および文脈に依存することを示唆しています9。このため、本プロトコルでは、単一の曝露指標に頼るのではなく、インターネット利用時間、深夜利用、主なオンライン活動、および標準化された症状スコアを組み合わせて評価します。
測定方法も、不一致が生じるもう一つの大きな要因です。インターネット依存テストは、インターネット依存症状を評価するために最も広く用いられている尺度の一つですが、その次元性と解釈は設定によって異なります。系統的なサイコメトリックのエビデンスによれば、この尺度は幅広く利用されている一方で、因子構造やスコアリングの解釈に関する疑問が依然として提起されています10。同様の懸念が大学生のサンプルにおいても報告されており、この尺度が普及したとしても、測定される構成概念に関する不確実性が完全には解消されていないことが示されています11。スペインおよびペルーの大学生集団を対象とした妥当性検証研究においても、この尺度が適切に機能し得ることが示されていますが、そのサイコメトリックな挙動は、適用される対象集団の中で検討されるべきであるとしています12,13。
したがって、本プロトコルはワークフローに安定性を持たせつつ、器具の選択には適応性を持たせるように設計されています。ここでは、過去の使用実績、利用可能な閾値、および以前の大学生を対象とした研究との比較可能性から、インターネット依存症テストを採用しています。しかし、本プロトコルにおいて、インターネット依存症テストが永続的に推奨される器具である必要はありません。診断フレームワークが進化したり、特定の集団に対してより適切な新しい器具が登場したりした場合は、尺度固有のモジュール、スコア範囲、重症度の閾値、コードブックの項目、およびREADMEドキュメントを置き換えることで、同じワークフローを維持することが可能です。このような置き換えは、正式なデータ収集が開始される前に行い、アドホックな分析上の変更ではなく、プロトコルの修正として報告する必要があります。
本記事で取り組む手法上の問題は、インターネット依存と感情調節に関する研究が単に異なる結論に達しているということではありません。むしろ、多くの研究において、質問票の順序、適格性基準、調査プラットフォームの設定、重複回答の処理、アテンションチェックの手順、完了時間のしきい値、欠損データの処理ルール、スコアリングの検証、および分析準備済みファイルの報告方法が異なっています。これらの相違により、結果の比較や再現、および後のエビデンス統合への組み込みが困難になっています。本プロトコルは、実施順序、スクリーニングロジック、スコアリング構造、および分析経路を固定することで、透明性を持って繰り返し、監査し、修正できる方法を提示し、この課題に対応します。したがって、本研究の貢献はプロトコルに重点を置いており、新たな心理学的構成概念を提案したり、有病率調査を主な成果として提示したりするのではなく、大学生集団を対象とした観察的行動科学および心理アセスメント研究のための再現可能なワークフローを提供することにあります。
プロトコル
The study, entitled “A Standardized Questionnaire Protocol for Internet Addiction and Emotion Regulation Assessment in University Students,” was reviewed and approved by the Ethics and Academic Committee of Zhengzhou University of Economics and Business under Approval Number 20260113004 before participant recruitment began14. The study used a cross-sectional, anonymous online questionnaire design involving full-time university students aged 18–24 years and was conducted in accordance with institutional ethical requirements and the Declaration of Helsinki. Electronic informed consent was obtained before questionnaire access. Participants received an electronic information sheet describing the study purpose, procedures, voluntary nature of participation, and data-protection measures, and they were free to withdraw at any time without penalty. No directly identifiable personal information, including name, student identification number, exact address, telephone number, personal email address, or social-media account, was collected in the main survey file. Platform-generated identifiers were used only for duplicate-response screening and were removed before dataset analysis. All data were stored securely and analyzed in de-identified form. This questionnaire workflow was not prospectively registered before participant recruitment. However, all core protocol components, including the locked questionnaire version, README/codebook, screening log, scoring rules, analysis syntax, and analysis-ready workflow files, were archived and are provided as supplementary workflow materials to support reproducibility and auditability.
Platform-generated response identifiers and device- or account-limited technical identifiers were used only for duplicate-response screening and were removed from the final anonymized analytical dataset. The core variables and scoring rules are summarized in Table 1, and the complete variable dictionary is provided in Supplementary Table 1. The questionnaire files, codebook, screening log, output plan, and analysis-ready workflow materials are provided in Supplementary File 1.
| Domain | Variable | Coding/Scoring | Role in protocol |
| Eligibility | Age | Years; eligible range 18–24 | Eligibility variable and covariate |
| Demographics | Sex | 1 = male; 2 = female; 3 = prefer not to say | Descriptive variable and regression covariate |
| Demographics | Academic year | 1 = first year; 2 = second year; 3 = third year; 4 = fourth year or above; 5 = postgraduate | Descriptive variable |
| Demographics | Discipline category | 1 = humanities and social sciences; 2 = science and engineering; 3 = business and management; 4 = arts and design; 5 = other | Descriptive variable |
| Demographics | Residence type | 1 = on-campus dormitory; 2 = off-campus rental; 3 = family home; 4 = other | Descriptive variable |
| Demographics | Monthly living expenses | 1 = <1,000 CNY; 2 = 1,000–1,999 CNY; 3 = 2,000–2,999 CNY; 4 = ≥3,000 CNY | Descriptive variable |
| Internet-use behavior | Weekday internet use | 1 = <2 h; 2 = 2–3.9 h; 3 = 4–5.9 h; 4 = ≥6 h | Behavioral covariate |
| Internet-use behavior | Weekend internet use | 1 = <2 h; 2 = 2–3.9 h; 3 = 4–5.9 h; 4 = ≥6 h | Behavioral covariate |
| Internet-use behavior | Primary online activity | 1 = study; 2 = social media; 3 = gaming; 4 = entertainment/video; 5 = shopping; 6 = mixed use; 7 = other | Descriptive variable |
| Internet-use behavior | Primary access device | 1 = smartphone; 2 = tablet; 3 = laptop/desktop; 4 = mixed devices | Descriptive variable |
| Internet-use behavior | Late-night use after 23:00 | 1 = never; 2 = less than once per week; 3 = 1–2 nights/week; 4 = 3–5 nights/week; 5 = almost every night | Behavioral covariate and logical-consistency screening variable |
| Core scale | IAT total score | Sum of 20 items; each item scored 1–5; total range 20–100 | Primary independent variable |
| Core scale | IAT severity group | 20–39 = normal use; 40–69 = problematic use; 70–100 = severe problematic use | Grouping variable |
| Core scale | DERS-16 total score | Sum of 16 items after required reverse coding; total range 16–80 | Primary dependent variable |
| Core scale | DERS-16 subscales | Computed according to the locked DERS-16 scoring key | Descriptive emotion-regulation outcomes |
| Covariate | Sleep duration | 1 = <6 h; 2 = 6–6.9 h; 3 = 7–7.9 h; 4 = ≥8 h | Adjustment variable |
| Covariate | Weekly physical activity | 0 = none; 1 = 1–2 sessions; 2 = 3–4 sessions; 3 = ≥5 sessions | Adjustment variable |
| Covariate | Academic stress | 1 = low; 2 = moderate; 3 = high | Adjustment variable |
| Quality control | Attention check | 1 = pass; 0 = fail | Exclusion criterion |
| Quality control | Completion time | Completion duration in seconds | Timing-based screening variable |
| Quality control | Long-string response count | Maximum run length of identical responses across the 36 scored scale items | Patterned-response screening variable |
| Quality control | Within-person SD | Within-person standard deviation across the 36 scored scale items | Invariant-response screening variable |
| Quality control | Logical-consistency flag | 0 = no inconsistency; 1 = inconsistency detected | Logical-consistency screening variable |
Table 1: Core variables, coding structure, and scoring rules used in the standardized questionnaire protocol. This table summarizes the core eligibility, demographic, internet-use, scale, covariate, and quality-control variables used in the main workflow. It includes the coding values, score ranges, scoring rules, and roles of the main variables used for questionnaire administration, screening, scoring, and analysis. Abbreviations: IAT = internet addiction test; DERS-16 = 16-item difficulties in emotion regulation scale. Please click here to download this Table.
1. Set up the study population, questionnaire structure, and survey flow
- Define the target population and valid sample
- Recruit full-time undergraduate and postgraduate students aged 18–24 years who can complete the questionnaire independently on a mobile phone or computer. Record the questionnaire language version and use scale versions that have been validated or appropriately adapted for the target student population.
- Document any accessibility or language modification before data collection when international students, students with disabilities, or multilingual student groups are included.
- Restrict participation to one completed response per participant. Use the survey platform’s device restriction, account restriction, cookie restriction, or authenticated-link function when available.
NOTE: When the same participant account generates responses from multiple devices, identify and reconcile those records during duplicate screening using the account-limited identifier, timestamp, questionnaire status, and response-pattern similarity. - Set the minimum final valid sample at 450 questionnaires and continue recruitment until the cleaned dataset remains above this threshold after screening.
NOTE: When severe problematic internet use or another small subgroup is a primary analysis target, set a larger recruitment target before data collection begins. - Record the number invited, the number returned, the number excluded at each prespecified screening step, and the final number retained so that the participant flow can later be summarized in Figure 1.
- Construct the questionnaire in a fixed order
- Arrange the questionnaire in the following sequence: informed consent, demographic information, internet-use behavior, Internet Addiction Test, Difficulties in emotion regulation scale short form, sleep duration, weekly physical activity, and perceived academic stress. Keep this order unchanged for all participants. Do not randomize the order of the core scales.
- Record age, sex, academic year, discipline category, residence type, and monthly living expenses using closed-ended response categories. Mark all demographic items as mandatory.
NOTE: For sex, include male, female, and prefer not to say. Retain “prefer not to say” in descriptive analyses. In regression analyses, code sex using indicator variables with male as the reference category, including separate indicators for female and prefer not to say. Do not delete participants solely because they select “prefer not to say.” - Record weekday internet-use duration, weekend internet-use duration, primary online activity, primary access device, and late-night internet use after 23:00. Code late-night use as 1 = never, 2 = less than once per week, 3 = 1–2 nights per week, 4 = 3–5 nights per week, and 5 = almost every night.
- Record the academic period during which the questionnaire is administered. In the representative implementation, the survey was administered during a regular teaching semester, outside final examination weeks, specifically during semester weeks 6–7.
- Administer and score the core instruments
- Administer the 20-item Internet addiction test as a mandatory scale and score each item from 1 to 5. Sum all 20 items to obtain a total score ranging from 20 to 100, then classify 20–39 as normal use, 40–69 as problematic use, and 70–100 as severe problematic use15.
- Use “internet addiction” when reporting IAT-based scores and severity groups. Use “problematic internet use” only when referring to the broader literature or non-IAT constructs.
- Administer the 16-item Difficulties in emotion regulation scale short form immediately after the internet addiction test and score each item from 1 to 5. Reverse-code Items 1, 6, and 8 before summation, then calculate a total score ranging from 16 to 80, with higher scores indicating greater difficulty in emotion regulation16.
- Generate five subscale scores for nonacceptance, goals, impulse, strategies, and clarity after reverse coding has been verified.
- Recheck the coding direction of all reversed items before calculating the total and subscale scores. Use the same DERS-16 scoring key for every participant and document the scoring key in the README/codebook.
- When a revised or alternative internet-addiction instrument is used, replace the scale-specific module before data collection begins and update the item names, score range, severity thresholds, scoring syntax, README/codebook, questionnaire screenshots, and Table of Materials.
- Add covariates and one attention-check item
- Record sleep duration as <6 h, 6–6.9 h, 7–7.9 h, and ≥8 h. Record weekly physical activity frequency as 0, 1–2, 3–4, and ≥5 sessions. Record perceived academic stress as low, moderate, or high. Define one physical-activity session as ≥20 min of moderate or vigorous activity.
- Insert one directed-response attention-check item in the behavioral section and require the participant to select one specified response option. The attention-check item used in the representative implementation was: “To confirm that you are reading carefully, please select ‘3 = sometimes’ for this item”. Mark any questionnaire that fails this item for exclusion during cleaning17.
CRITICAL STEP: Do not change item wording, response anchors, scale order, exclusion thresholds, survey-platform settings, coding rules, or statistical-analysis rules after formal data collection begins.
NOTE: Summarize the core variables, coding values, score ranges, and scoring rules in Table 1. Provide the complete variable dictionary, file-status fields, screening flags, technical identifier fields, dataset-tracking variables, file names, and software versions in Supplementary Table 1 and the README/codebook.
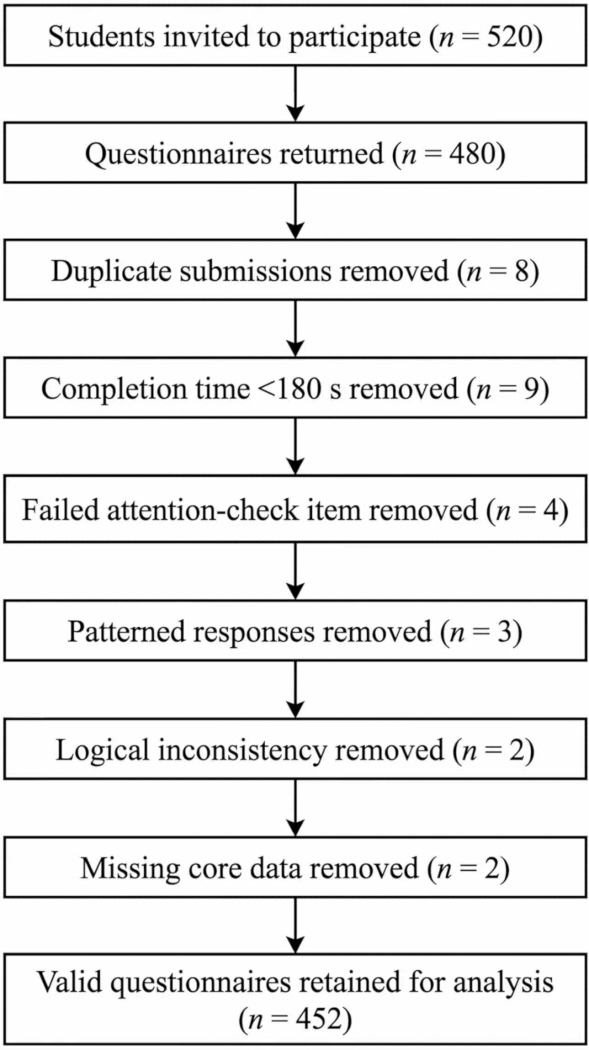
Figure 1: Questionnaire flow for recruitment, screening, exclusion, and final analytic retention. This flow diagram shows the progression from invited students to returned questionnaires, through sequential data-quality screening and exclusion by prespecified criteria, to final retention of valid questionnaires for analysis. The figure presents the number of invited students, returned questionnaires, excluded records at each screening step, and the final analytic sample. Please click here to view a larger version of this figure.
2. Pilot-test the questionnaire and lock the final field version
- Pilot-test the full questionnaire
- Administer the full questionnaire to 20–30 students who satisfy the formal inclusion criteria but are not retained in the final dataset.
- Record completion time and written feedback on clarity, response burden, technical access, item order, attention-check comprehension, and any ambiguity in demographic or behavioral response options.
- Record the pilot sample size, median completion time, interquartile range, minimum and maximum completion time, and all wording changes made after pilot testing.
- In the representative implementation, the pilot included 25 students, the median completion time was 540 s, and the expected completion time was set at 6–8 min.
- Revise ambiguous wording, duplicated meaning, unclear response options, or software-display problems identified during pilot testing, then freeze the final questionnaire version before formal release.
NOTE: If the study includes multilingual students, older adults, adolescents, or students with disabilities, conduct additional cognitive testing or subgroup pilot testing before formal release.
- Fix the operational settings and export rules
- Create a new survey project in the selected online survey platform. Enter the consent page as the first page and set the consent item as a required branching item.
- Configure the survey so that participants who do not provide consent exit the survey automatically without seeing the questionnaire body.
- Enter all demographic, internet-use, IAT, DERS-16, covariate, and attention-check items using the locked wording and response anchors. Set all core items as mandatory.
- Activate automatic recording of start time, end time, completion duration, response status, and platform-generated response identifier.
- Enable one-response-per-participant controls when available, including authenticated survey links, device restriction, cookie-based repeat prevention, account-based repeat prevention, or duplicate-response review settings. Record the enabled controls in the README/codebook.
- Disable collection of unnecessary direct identifiers. If the platform records IP address by default, disable IP storage or replace it with a non-identifying duplicate-screening field when permitted by institutional policy.
NOTE: When IP addresses or device metadata are temporarily retained for duplicate screening, store them only in the encrypted raw file, restrict access to the study analyst, and remove them before producing the final analytical dataset. - Specify whether pause-and-resume is permitted. In this protocol, a formal save-and-return function across different sessions is not enabled. Participants may pause only within the same open browser session, and the recorded completion time includes the full elapsed time.
- Export the raw return file in both spreadsheet and comma-separated-value formats at survey closure18. Also export a survey-to-document file or PDF/A copy containing the final questionnaire wording, item order, branching settings, mandatory-item settings, and coding structure. Save these files with version-controlled names.
- Calculate the pilot median completion time and set the minimum valid completion threshold at approximately one-third of that value. Fix the final lower threshold at 180 s and apply it uniformly during formal screening.
- Because this cutoff is derived from the pilot sample, re-establish the threshold when the protocol is implemented in a substantially different population, platform, language version, or institutional setting.
NOTE: Archive the final questionnaire screenshots, final questionnaire export, README/codebook, pilot log, attention-check wording, screening-log template, export settings, and statistical syntax as supplementary or audit files.
3. Release the questionnaire and preserve the raw dataset
- Recruit participants through fixed channels
- Distribute one standardized invitation through student communication groups, class channels, or institutional mailing lists during a fixed 14-day collection window.
- State the study purpose, expected completion time of 6–8 min, anonymous handling of data, voluntary participation, and the absence of academic penalty or reward for nonparticipation in both the invitation and the consent page.
- Display the consent page before any questionnaire item appears and require active agreement before entry. Do not permit access to the questionnaire body without an affirmative consent response.
- State on the consent page that participants may stop before final submission and that incomplete responses will not be used in the final analysis.
- Use the same locked questionnaire version across all recruitment channels. If several recruitment channels are used, record the channel only when it is prespecified as a study variable.
- Preserve the raw return file
- Retain all returned records, including incomplete and later-excluded submissions, in the raw export file. Export the full dataset immediately after survey closure and store it as raw_returns_YYYYMMDD.csv and raw_returns_YYYYMMDD.xlsx.
- Preserve the original submission time, completion duration, response status, platform-generated response identifier, and device-limited or account-limited technical identifier in the raw file. Do not overwrite these fields during later cleaning.
- Save one read-only raw-data copy before screening begins. Store the raw file, screening log, and final analytic dataset in separate folders. Restrict access to the raw file containing technical identifiers to authorized study personnel only.
CAUTION: Do not collect directly identifying information, such as full name, student identification number, exact dormitory address, personal telephone number, personal email address, or social media account, in the main survey file.
NOTE: Pause the workflow after raw export, save one read-only copy of the raw dataset, and restart cleaning only from that preserved copy.
4. Screen returned questionnaires and generate the final analytic dataset
- Apply the screening sequence in a fixed order
- Sort all returned records by device-limited identifier, account-limited identifier when available, timestamp, questionnaire status, and response similarity. Identify duplicate submissions first. Retain the earliest complete record when two or more submissions originate from the same participant within the same collection cycle.
- If multiple submissions are detected from the same authenticated account but different devices, treat them as duplicate submissions from the same participant. Retain the earliest complete record and exclude later complete records. If the earliest record is incomplete and a later record is complete, retain the earliest complete record.
- Remove records with completion time <180 s, review records completed in 180–240 s, and remove records that fail the directed-response attention-check item fourth. Document the number removed at each step in screening_log_v1.xlsx19.
- For records completed in 180–240 s, conduct manual review using the attention-check result, long-string responding flag, within-person standard deviation, and logical-consistency flag.
- Retain a borderline-speed record only when no additional data-quality flag is present. Record every borderline-speed decision in the screening log.
- Remove patterned, inconsistent, or incomplete records
- Remove all questionnaires showing long-string responding, defined as 18 or more consecutive identical responses across the 36 scored scale items, or a within-person standard deviation ≤0.25 across those items.
- Remove any questionnaire showing impossible behavioral combinations. Define “the highest response category on nearly all Internet addiction test items” as a score of 5 on at least 18 of the 20 IAT items.
NOTE: The logical-inconsistency rule is triggered when a respondent reports both weekday and weekend internet use in the lowest duration category (<2 h per day), late-night internet use coded as “almost every night,” and a score of 5 on at least 18 of the 20 IAT items. Apply this rule only after duplicate, completion-time, attention-check, and patterned-response screening have been completed. - Remove all questionnaires with missing values in any IAT item, any DERS-16 item, or any prespecified covariate.
NOTE: This complete-case rule is used because the online survey uses mandatory core items and because the representative regression model requires a fixed covariate set. When missing covariate data exceed 5%, use a prespecified alternative missing-data method, such as multiple imputation. - Assign one anonymous study ID to each retained record and save the remaining file as analytic_dataset_v1.csv and analytic_dataset_v1.xlsx.
- Remove platform-generated response identifiers, device-limited identifiers, account-limited identifiers, IP addresses if retained during screening, timestamps, and free-text review notes from the final analytic dataset. Keep only the anonymous study ID and analysis variables.
CRITICAL STEP: Apply the screening sequence in the same order to every record and do not re-enter previously excluded cases at later stages. Assign the first triggered exclusion criterion as the primary exclusion reason and record secondary flags only as screening-log notes.
NOTE: Summarize the final exclusion counts by reason in Table 2, and keep those counts identical to the participant flow reported later in Figure 1.
| Screening order | Screening item | Operational rule | Screening action | Documentation rule |
| Step 1 | Raw export preservation | Export all returned records immediately after survey closure and save them as raw_returns_YYYYMMDD.csv and raw_returns_YYYYMMDD.xlsx | Preserve one read-only copy before any cleaning begins | Archive in raw-data folder |
| Step 2 | Consent and access check | Identify records without active electronic informed consent before questionnaire access | Exclude records without consent from the analytic workflow | Log excluded or inaccessible records in screening_log_v1.xlsx when retained in the platform export |
| Step 3 | Duplicate screening | Identify records sharing the same device-limited identifier or account-limited identifier within the same collection cycle and matching on sex, age, academic year, and at least 80% identical questionnaire responses | Retain the earliest complete record and exclude all later duplicates | Log excluded count and affected raw_record_id values in screening_log_v1.xlsx; assign primary exclusion_reason = 1 |
| Step 4 | Multiple-device duplicate reconciliation | Identify multiple complete submissions from the same authenticated participant account across different devices | Treat these records as duplicate submissions; retain the earliest complete record | Log the account-limited identifier and retained raw_record_id in screening_log_v1.xlsx; assign later records primary exclusion_reason = 1 |
| Step 5 | Completion-time screening | Identify all questionnaires with completion time <180 s | Exclude all such records automatically | Log excluded count in screening_log_v1.xlsx; assign primary exclusion_reason = 2 |
| Step 6 | Borderline-speed review | Identify all questionnaires with completion time 180–240 s | Review each record manually using attention-check, long-string, within-person SD, and logic flags; retain only if no additional flag is present | Record each case as retained_after_manual_review = 1 or excluded_after_manual_review = 1 in screening_log_v1.xlsx |
| Step 7 | Attention-check screening | Identify all records failing the directed-response attention-check item | Exclude all failed records not already excluded at an earlier step | Log excluded count in screening_log_v1.xlsx; assign primary exclusion_reason = 3 |
| Step 8 | Patterned-response screening | Identify records with 18 or more consecutive identical responses across the 36 scored scale items, or within-person SD ≤0.25 across those items | Exclude all such records not already excluded at an earlier step | Log excluded count in screening_log_v1.xlsx; assign primary exclusion_reason = 4 |
| Step 9 | Logical-consistency screening | Identify records showing the prespecified impossible behavioral combination: weekday_internet_use and weekend_internet_use both coded as <2 h, late_night_use coded as almost every night, and a score of 5 on at least 18 of the 20 IAT items | Exclude all such records not already excluded at an earlier step | Log excluded count and review note in screening_log_v1.xlsx; assign primary exclusion_reason = 5 |
| Step 10 | Core-missingness screening | Identify records with any missing value in IAT_1–IAT_20, DERS_1–DERS_16, age, sex, weekday_internet_use, weekend_internet_use, sleep_duration, physical_activity, or academic_stress; “prefer not to say” for sex is treated as a valid response, not as missing | Exclude all such records not already excluded at an earlier step | Log excluded count in screening_log_v1.xlsx; assign primary exclusion_reason = 6 |
| Step 11 | Primary exclusion assignment | Identify records meeting more than one exclusion criterion | Assign the first triggered criterion in the prespecified screening sequence as the primary exclusion reason | Record secondary flags in review notes only; do not assign multiple primary reasons |
| Step 12 | Technical identifier removal | Identify platform-generated response identifiers, device-limited identifiers, account-limited identifiers, timestamps, and any temporarily retained technical metadata in the cleaned file | Remove these fields from the final analytic dataset after screening is complete | Document removal in screening_log_v1.xlsx |
| Step 13 | Final retention | Retain all records that pass all prior screening steps | Assign one anonymous study ID to each retained record | Save as analytic_dataset_v1.csv and analytic_dataset_v1.xlsx |
| Step 14 | Screening summary | Count the number removed at each step and the final number retained | Summarize the final counts for manuscript reporting | Keep the counts in Table 2 identical to Figure 1 |
| Step 15 | Audit trail preservation | Preserve the raw file, screening log, and final analytic dataset as separate files | Do not overwrite, merge, or manually edit archived source files | Store in raw-data, screening, and analytic folders separately |
Table 2: Prespecified screening sequence, exclusion thresholds, screening actions, and documentation rules for questionnaire cleaning. This table summarizes the fixed screening order used to clean returned questionnaires, including consent and access checks, duplicate screening, multiple-device reconciliation, completion-time screening, borderline-speed review, attention-check failure, patterned responding, logical inconsistency, core missingness, technical identifier removal, final retention, and audit-trail preservation. Abbreviations: IAT = internet addiction test; DERS-16 = 16-item difficulties in emotion regulation scale. Please click here to download this Table.
5. Score variables, verify reliability, and prepare the analysis-ready file
- Generate total scores, subscale scores, and derived categorical variables
- Sum the 20 IAT item scores to generate the total internet addiction score, then store both the continuous score and the three-level severity class in the analysis-ready file.
- Reverse-code DERS-16 Items 1, 6, and 8, calculate the total score and five subscale scores, and append all derived variables to the same participant-level dataset.
- Run a range check before score calculation. Confirm that all IAT and DERS-16 item values fall within 1–5, all reverse-coded values fall within 1–5, IAT total scores fall within 20–100, and DERS-16 total scores fall within 16–80. Record the range-check output in the scoring log.
- Recode covariates into fixed analytic categories
- Recode weekday and weekend internet-use duration as <2 h, 2–3.9 h, 4–5.9 h, and ≥6 h. Recode late-night internet use as never, <1 night/week, 1–2 nights/week, 3–5 nights/week, and almost every night.
- Recode sleep duration, physical activity frequency, and perceived academic stress using the prespecified category rules defined in Section 1.4 and store the recoded values under fixed variable names in the same dataset.
- Recode sex for regression using two indicator variables: female versus male and prefer not to say versus male. Report the coding in the table footnote and README/codebook.
- Verify scoring integrity and internal consistency
- Calculate Cronbach’s alpha for the IAT total score and the DERS-16 total score before inferential analysis. Recheck item coding, reverse coding, and impossible item ranges if either alpha is <0.7020. Report the Cronbach’s alpha values in the Representative Results section.
- Calculate item-total correlations or alpha-if-item-deleted values if either scale shows unexpectedly low internal consistency. Do not remove scale items from the primary analysis unless item removal was prespecified or the study is explicitly designed as a psychometric validation study.
- Save the final analysis-ready dataset together with a README file listing variable names, coding rules, exclusion thresholds, file names, software versions, questionnaire version, scoring syntax, regression model specification, and procedures required to regenerate the same dataset.
6. Analyze the data and preserve reproducible outputs
- Generate descriptive statistics and group comparisons
- Report continuous variables as mean ± standard deviation and categorical variables as frequency and percentage. Summarize demographic characteristics, internet-use behavior, and scale scores using the predefined output structure.
- Report the sample size used for every analysis. Use the retained analytic sample as the denominator unless a table clearly states otherwise.
- Compare DERS-16 total and subscale scores across the three IAT severity groups and use two-sided testing with α = 0.05 for the primary analyses. Report standardized effect sizes where appropriate.
NOTE: For group comparisons, report η2 or partial η2 for analysis of variance, or an equivalent nonparametric effect size if a nonparametric test is used. Interpret severe problematic-use subgroup comparisons cautiously when the subgroup is small. - Calculate the Pearson correlation between IAT total score and DERS-16 total score when both variables show acceptable distributional behavior; otherwise, use Spearman correlation as a sensitivity analysis. Report n, r or ρ, 95% confidence interval if generated by the statistical software, p value, and interpretation of magnitude.
- Fit the adjusted regression model and archive outputs
- Use the DERS-16 total score as the dependent variable and the IAT total score as the primary independent variable. Enter age, sex, weekday internet use, weekend internet use, sleep duration, physical activity, and perceived academic stress as covariates. This model is the predefined analytic demonstration of the standardized workflow.
- Before interpreting the adjusted regression model, evaluate regression assumptions and model stability. Inspect residual-versus-fitted plots for linearity and homoscedasticity, inspect a Q-Q plot or normality test for residual distribution, and calculate variance inflation factors to assess multicollinearity.
- Report these diagnostics in the Representative Results section or supplementary analysis output.
- If residual heteroscedasticity is detected, report heteroscedasticity-robust standard errors as a sensitivity analysis.
- If influential observations are present, report whether the primary coefficient for the IAT total score remains materially unchanged after influence diagnostics. Do not remove influential observations unless a prespecified data-quality rule is met.
- Report unstandardized coefficients, standard errors, standardized coefficients, p values, model R2, adjusted R2, model F statistic, and VIF range for the adjusted model. Include the sample size in the table title or table footnote.
- If interactions, subgroup effects, or mediation pathways are tested, specify those analyses before data collection or label them as exploratory. The core protocol does not require interaction testing unless subgroup differences are a predefined study aim.
- Save all statistical syntax, output tables, residual plots, VIF output, reliability output, and generated figures under version-controlled file names. Regenerate all reportable outputs directly from analytic_dataset_v1 rather than from manually edited files.
NOTE: Keep the protocol text focused on workflow replication. Present the detailed representative statistics, subgroup figures, regression diagnostics, multicollinearity assessment, and model outputs in the Representative Results section.
結果
研究フローおよび最終解析保持数
本結果は、インターネット依存テストやDERS-16の独立した検証ではなく、標準化された質問票ワークフローの実行を示すものである。14日間の調査期間中に、大学生520名に参加を依頼し、480件の質問票が回収された。スクリーニングはあらかじめ指定された順序で実施した。まず、重複提出分8件を除外し、次に完了時間が180 s未満の質問票9件、指示回答型の注意チェック項目で不合格となった質問票4件、パターン回答が見られた質問票3件、論理的な矛盾があった質問票2件、および主要データが欠落していた質問票2件を除外した。全スクリーニング工程の完了後、最終的な解析データセットとして452件の有効な質問票が保持された。最終的な保持率は、回収された質問票の中では94.2%、依頼した学生の中では86.9%であった。招待から最終的な解析保持までの質問票フローを図1に示す。
被験者の特性
最終的な解析サンプルには452人の学生が含まれ、平均年齢は20.41 ± 1.58歳であった。回答者の大部分は女性であり、女性学生279人、男性学生167人、「回答を控える」を選択した学生6人であった。参加者はすべての学年および複数の学部から抽出されており、2年生と3年生が最大の割合を占めていた。回答者の多くは学内の寮に居住しており、月々の生活費は1,000–1,999および2,000–2,999のカテゴリーに集中していた。また、抽出されたサンプルは日常的にインターネットに相当時間さらされていることが示された。平日の利用時間は主に2–3.9 hおよび4–5.9 hのカテゴリーに集中していたが、週末の利用時間は増加し、452人中322人の学生が1日あたり少なくとも4 h利用していると回答した。アクセス方法としてはスマートフォンが支配的であった。最も頻繁に報告された主要なオンライン活動は、ソーシャルメディア、エンターテインメント/動画、および学習関連の利用であった。23:00以降の深夜利用は一般的であり、452人中228人の学生が週に少なくとも3回は深夜利用をしていると回答した。睡眠時間は6~7.9 hの間に集中し、身体活動は週1–2回のカテゴリーに最も多く該当し、学業ストレスは「中程度」という回答が最頻値であった。抽出されたサンプルの人口統計学的および行動学的プロファイルは Table 3に示されている。
| 特性 | カテゴリー | n | % |
| 性別 | 男性 | 167 | 36.9 |
| 女性 | 279 | 61.7 | |
| 回答を控える | 6 | 1.3 | |
| 学年 | 1年 | 88 | 19.5 |
| 2年 | 124 | 27.4 | |
| 3年 | 131 | 29 | |
| 4年以上 | 79 | 17.5 | |
| 大学院生 | 30 | 6.6 | |
| 学部カテゴリー | 人文・社会科学 | 118 | 26.1 |
| 理工学 | 96 | 21.2 | |
| ビジネス・経営学 | 104 | 23 | |
| 芸術・デザイン | 82 | 18.1 | |
| その他 | 52 | 11.5 | |
| 居住形態 | 学内寮 | 301 | 66.6 |
| 学外賃貸 | 79 | 17.5 | |
| 実家 | 58 | 12.8 | |
| その他 | 14 | 3.1 | |
| 月間生活費, CNY | <1,000 | 61 | 13.5 |
| 1,000–1,999 | 176 | 38.9 | |
| 2,000–2,999 | 149 | 33 | |
| ≥3,000 | 66 | 14.6 | |
| 平日インターネット利用時間 | <2 h | 52 | 11.5 |
| 2–3.9 h | 157 | 34.7 | |
| 4–5.9 h | 166 | 36.7 | |
| ≥6 h | 77 | 17 | |
| <2 h | 29 | 6.4 | |
| 2–3.9 h | 101 | 22.3 | |
| 4–5.9 h | 178 | 39.4 | |
| ≥6 h | 144 | 31.9 | |
| 主なオンライン活動 | 学習 | 74 | 16.4 |
| ソーシャルメディア | 126 | 27.9 | |
| ゲーム | 61 | 13.5 | |
| エンターテインメント/動画 | 102 | 22.6 | |
| ショッピング | 28 | 6.2 | |
| 複合利用 | 47 | 10.4 | |
| その他 | 14 | 3.1 | |
| 主なアクセスデバイス | スマートフォン | 323 | 71.5 |
| タブレット | 18 | 4 | |
| ノートパソコン/デスクトップ | 67 | 14.8 | |
| 複数のデバイスを併用 | 44 | 9.7 | |
| 23:00以降の深夜利用 | 全くない | 48 | 10.6 |
| 週に1回未満 | 57 | 12.6 | |
| 週に1–2回 | 119 | 26.3 | |
| 週に3–5回 | 141 | 31.2 | |
| ほぼ毎晩 | 87 | 19.2 | |
| 睡眠時間 | <6 h | 83 | 18.4 |
| 6–6.9 h | 146 | 32.3 | |
| 7–7.9 h | 157 | 34.7 | |
| ≥8 h | 66 | 14.6 | |
| 週あたりの身体活動 | なし | 91 | 20.1 |
| 1–2回 | 176 | 38.9 | |
| 3–4回 | 128 | 28.3 | |
| ≥5回 | 57 | 12.6 | |
| 学業ストレス | 低い | 73 | 16.2 |
| 中程度 | 241 | 53.3 | |
| 高い | 138 | 30.5 | |
| 年齢, years | 平均 ± 標準偏差 | 20.41 ± 1.58 | — |
表3:保持されたサンプルのベースラインにおける人口統計学的および行動的特性この表は、事前定義されたスクリーニング後に最終的に保持されたサンプルの人口統計学的プロファイルおよびインターネット利用特性を示している。変数には、性別、学年、学問分野カテゴリー、居住形態、月間生活費、平日および週末のインターネット利用、主なオンライン活動、主なアクセスデバイス、23:00以降の深夜利用、睡眠時間、週ごとの身体活動、学業ストレス、および年齢が含まれる。略語:CNY = 中国元、SD = 標準偏差。こちらのリンクから本表をダウンロードしてください。
インターネット依存症の重症度、感情調節のアウトカム、および信頼性
最終的な解析サンプル(n = 452)において、インターネット依存テストの合計スコアの平均値は51.94 ± 16.58であった。あらかじめ設定した重症度の閾値に基づいたところ、回答者の200名が正常利用群、239名が問題利用群、13名が深刻な問題利用群に分類され、問題利用群が最大のサブグループとなった。解析サンプルのDERS-16合計スコアの平均値は35.95 ± 8.89であった。インターネット依存テストの内部一貫性は良好であり、クロンバックのα係数は0.91であった。また、DERS-16においても内部一貫性は良好であり、クロンバックのα係数は0.88であった。IATの重症度による3つの群でDERS-16の合計スコアを検討したところ、正常利用群の平均値が最も低く、問題利用群の平均値が高く、深刻な問題利用群の平均値が最も高かった。解析サンプル(n = 452)におけるDERS-16合計スコアの群間比較は、統計的に有意であった(F = 72.80, p < 0.001; η2 = 0.245)。同様の傾向はDERS-16のサブスケールの要約でも認められた。深刻な問題利用サブグループは少人数(n = 13)であったため、サブグループの値は詳細な推論の根拠とするのではなく、全体の分布パターンの一部として提示している。インターネット依存の重症度と感情調節の結果を表4にまとめる。
| 測定 | 通常の使用 | 問題のある使用 | 重度の問題のある使用 | 合計 |
| n = 200 | n = 239 | n = 13 | n = 452 | |
| IAT総合スコア | 34.20 ± 3.90 | 65.33 ± 6.90 | 78.70 ± 6.20 | 51.94 ± 16.58 |
| DERS-16合計スコア | 31.20 ± 7.10 | 39.24 ± 8.30 | 48.50 ± 9.60 | 35.95 ± 8.89 |
| DERS-16の非受容 | 5.90 ± 1.90 | 7.29 ± 2.10 | 8.90 ± 2.40 | 6.72 ± 2.16 |
| DERS-16の目的 | 6.20 ± 1.80 | 7.82 ± 2.00 | 9.10 ± 2.30 | 7.14 ± 2.09 |
| DERS-16 インパルス | 5.80 ± 1.70 | 7.72 ± 2.10 | 9.40 ± 2.50 | 6.92 ± 2.19 |
| DERS-16戦略 | 9.60 ± 2.90 | 12.29 ± 3.30 | 15.10 ± 3.80 | 11.18 ± 3.44 |
| DERS-16の明瞭性 | 3.70 ± 1.30 | 4.18 ± 1.40 | 5.00 ± 1.60 | 3.99 ± 1.41 |
| IATクロンバックのアルファ係数 | — | — | — | 0.91 |
| DERS-16のクロンバックのアルファ係数 | — | — | — | 0.88 |
| DERS-16 全体群の比較 | — | — | — | F = 72.80; p < 0.001; η² = 0.245 |
| IAT合計点とDERS-16合計点のピアソン相関 | — | — | — | n = 452; r = 0.524; 95%信頼区間 (CI): 0.45–0.59; p < 0.001 |
表4:最終解析サンプルにおけるインターネット依存の重症度グループ、感情調節のアウトカム、信頼性および相関。この表は、通常利用群、問題利用群、および重度問題利用群におけるIAT合計スコア、DERS-16合計スコア、およびDERS-16サブスケールの値を報告している。また、サンプル全体の平均値、IATおよびDERS-16のクロンバックのα値、DERS-16合計スコアのグループ間比較、およびIAT合計スコアとDERS-16合計スコアのピアソン相関を報告している。略語:IAT = インターネット依存テスト、DERS-16 = 感情調節困難尺度16項目版、CI = 信頼区間、SD = 標準偏差。こちらをクリックしてこの表をダウンロードしてください。
インターネット依存と感情調節の関連性
保持された解析サンプル(n = 452)において、IAT合計スコアとDERS-16合計スコアとの間で、事前に定義された連続値スコアの関連性を評価した。IAT合計スコアとDERS-16合計スコアのピアソン相関は正で、大きさは中程度であった(r = 0.524, 95% CI: 0.45–0.59, p < 0.001)。したがって、IAT合計スコアが高い学生ほど、感情調節における全体的な困難感が高い傾向にあった。この結果は重症度グループの分布と一致しており、表4に示されるように、IATのカテゴリー分類のみに依存するものではなかった。
多変量回帰分析
調整済み回帰モデルには、保持された解析サンプル(n = 452)が含まれた。DERS-16の合計スコアを従属変数とし、IATの合計スコアを主要な独立変数として投入した。また、同モデルの共変量として、年齢、性別、平日のインターネット利用時間、週末のインターネット利用時間、睡眠時間、週当たりの身体活動量、および学業ストレスを組み込んだ。性別は事前に指定された指標変数コーディングを用いて投入し、男性をリファレンスカテゴリーとし、女性および回答拒否に個別の指標を割り当てた。調整後、IAT合計スコアはDERS-16合計スコアと正の相関を維持した(B = 0.21, SE = 0.02, β = 0.39, p < 0.001)。共変量の中では、学業ストレスがDERS-16合計スコアと正の相関を示したが(B = 2.36, β = 0.23, p < 0.001)、睡眠時間(B = -1.12, β = -0.13, p < 0.001)および週当たりの身体活動量(B = -0.84, β = -0.10, p = 0.003)はDERS-16合計スコアと負の相関を示した。平日のインターネット利用時間は、調整後も小さい正の係数を維持したが(B = 0.71, β = 0.09, p = 0.015)、週末のインターネット利用時間は調整済みモデルにおいて統計的な頑健性を維持しなかった(B = 0.49, β = 0.07, p = 0.071)。同じ仕様において、年齢および両方の性別指標は有意な独立予測因子ではなかった。本モデルはDERS-16合計スコアの分散の39.8%を説明し、自由度調整済みR2は0.386であり、モデル全体として統計的に有意であった(F(9, 442) = 32.47, p < 0.001)。分散拡大係数(VIF)は1.03から1.42の範囲であり、多重共線性は見られなかった。残差対適合値の確認による残差診断では、線形性または等分散性の重大な逸脱は認められなかった。残差のQ-Qプロットでは、近似的な正規分布からの実質的な乖離は見られなかった。Breusch-Pagan検定は統計的に有意ではなかった( p = 0.214)。最大クック距離は0.18であり、クック距離が0.50を超える観測値はなかった。調整済み回帰モデルは表5に示されている。
| 予測因子 | B | SE | β | t | p | 分散拡大係数 |
| 定数 | 18.42 | 2.11 | — | 8.73 | <0.001 | — |
| IAT合計スコア | 0.21 | 0.02 | 0.39 | 9.84 | <0.001 | 1.42 |
| 年齢 | 0.18 | 0.11 | 0.03 | 1.64 | 0.102 | 1.08 |
| 性別、雌と雄(または女性と男性) | 0.62 | 0.54 | 0.04 | 1.15 | 0.252 | 1.05 |
| 性別:回答を希望しない vs. 男性 | 0.28 | 1.89 | 0.01 | 0.15 | 0.882 | 1.03 |
| 平日のインターネット利用 | 0.71 | 0.29 | 0.09 | 2.45 | 0.015 | 1.36 |
| 週末のインターネット利用 | 0.49 | 0.27 | 0.07 | 1.81 | 0.071 | 1.31 |
| 睡眠時間 | -1.12 | 0.31 | -0.13 | -3.61 | <0.001 | 1.18 |
| 週間身体活動量 | -0.84 | 0.28 | -0.1 | -3 | 0.003 | 1.12 |
| 学業ストレス | 2.36 | 0.39 | 0.23 | 6.05 | <0.001 | 1.27 |
表5:最終解析サンプルにおけるIAT合計スコアおよび共変量によるDERS-16合計スコアの多変量線形回帰。この表は、DERS-16合計スコアを従属変数、IAT合計スコアを主要な独立変数とした調整回帰モデルを示しています。共変量として、年齢、性別、平日のインターネット利用時間、休日のインターネット利用時間、睡眠時間、週あたりの身体活動量、および学業ストレスを含めています。また、標準化係数、分散拡大係数(VIF)、およびモデル診断についても報告しています。略語:IAT = インターネット依存テスト、DERS-16 = 感情調節困難尺度16項目版、VIF = 分散拡大係数。こちらのリンクから本表をダウンロードしてください。
付録表1:標準化されたアンケートワークフローで使用される完全な変数辞書、ファイルの有無、コーディング構造、およびデータ管理フィールド。この付録表では、倫理および同意に関する変数、調査設定変数、人口統計学的変数、インターネット利用変数、品質管理フラグ、尺度項目、算出スコア、共変数、技術的識別子フィールド、データセット追跡変数、ファイルステータス情報、およびコーディングルールを含む、プロトコルの完全な変数辞書を提供します。略語:IAT = インターネット依存テスト、DERS-16 = 感情調節困難尺度16項目版。こちらをクリックしてファイルをダウンロードしてください。
補足ファイル 1:補足アンケートワークフロー資料この補足ファイルには、標準化されたアンケート実施、スクリーニング、スコアリング、および分析ワークフローを再現するために使用した、アンケートファイル、コードブック、スクリーニングログ、アウトプットプラン、および分析準備済みワークフロー資料が含まれています。こちらをクリックしてファイルをダウンロードしてください。
ディスカッション
本論文の主な貢献は、インターネット依存と感情調節困難の間に観察された代表的な関連性ではなく、標準化された質問票のワークフローにある。この実装により、電子同意、人口統計学的項目、インターネット利用行動、IATスコアリング、DERS-16スコアリング、共変量の収集、逐次的なデータ品質スクリーニング、および再現可能な回帰分析という固定されたシーケンスが、大学生のサンプルにおいて実行可能であることが示された。問題のあるインターネット利用は、文献において感情調節不全としばしば関連付けられているが、実施およびクリーニングの手順が不一致であると、研究間での結果の比較が困難になることがあるため21、このような手続き上の重点化は重要である。したがって、本ワークフローは、解釈を開始する前に測定順序、除外ルール、スコアリングステップ、および分析出力を明示したことで、比較可能性をサポートするものである。
再現性を確保するために、特に重要な手順がいくつかあります。第一に、アンケートへのアクセス前に電子同意を完了させる必要があり、重複スクリーニングに使用した技術的識別子は、最終的な匿名化済み分析データセットから分離しなければなりません。第二に、重複スクリーニングは、回答時間のスクリーニング、アテンションチェックの確認、パターン回答のスクリーニング、論理的一貫性の確認、および欠損値チェックよりも前に行う必要があります。なぜなら、この順序を変更すると、最終的に保持されるサンプルが変わる可能性があるためです。第三に、逆転項目のコーディングや重症度分類を含む、IATおよびDERS-16のスコアリング手順は、データ収集前に確定させておく必要があります。これらの手順は、オンライン調査研究における回避可能なばらつきを低減させるものであり、インターネット依存に関する知見が、測定手順の違いだけでなく、ストレス、セルフコントロール、不安などの影響を受ける可能性があるという広範な懸念とも一致しています22。
本プロトコルの実施にあたっては、いくつかのトラブルシューティングの確認事項が必要となります。調査プラットフォームで重複投稿を制限できない場合は、アカウント制限識別子、デバイス制限識別子、タイムスタンプ、アンケートの状態、および回答パターンの類似性を組み合わせて重複スクリーニングを行う必要があります。多くのレコードが回答速度の境界域にある場合は、完了時間のみで判断せず、アテンションチェックの結果、長い文字列の回答数、個人内標準偏差、および論理的一貫性フラグを併せて検討すべきです。クロンバックのα係数が予想外に低い場合は、項目レベルの決定を下す前に、項目のコーディング、逆転コーディング、およびスコア範囲を確認する必要があります。オンラインおよびスマートフォンに関連する行動は睡眠や感情調節プロセスと関連しているため、不注意なスクリーニングや誤ったコーディングは推論を歪ませる潜在的な要因となり得ます。したがって、これらの手順は特に重要です23。
代表的な実施例で使用された除外閾値は、本ワークフロー内では標準的なものとして扱うべきですが、今後のすべての集団に対して普遍的に固定されるべきではありません。完了時間の180 sという下限閾値はパイロットテストから導出されたものであり、高齢者、青少年、多言語回答者、アクセシビリティ対応の質問票、または表示形式が異なるプラットフォームに本プロトコルを適用する場合は、再校正を行う必要があります。論理的不整合ルールおよびパターン回答基準についても、尺度の長さ、項目の順序、または回答のアンカーが異なる場合には調整が必要となる可能性があります。同様に、代表的な実施例における重度の問題のある使用を示す小規模なサブグループの存在は、サブグループ比較を目的とした研究では、データ収集前にリクルート目標数を増やすか、層化サンプリングを用いるべきであることを示唆しています。身体活動を含む行動およびライフスタイルの変数は、学生グループによって注意、反芻、および自己調節との相互作用の仕方が異なる可能性があるため、このような柔軟性が重要となります24。
本プロトコルを適用する際には、いくつかの制限事項を考慮する必要があります。このワークフローでは自己報告式の調査ツールを使用しているため、想起エラー、社会的望ましさバイアス、および共通メソッド分散が、曝露量とアウトカム指標の両方に影響を与える可能性があります。これらのリスクは、中立的な表現の使用、固定された質問順序、アテンションチェック、事前に規定された共変量、および欠測値や除外例の透明性のある報告によって軽減できますが、完全に排除することはできません。今後の研究では、構成概念妥当性を高めるために、スマートフォンのスクリーンタイムログ、アプリ利用記録、またはプラットフォームベースの利用概要などの客観的なデジタル行動指標を組み込むことが考えられます。ただし、これらの追加項目には、個別の同意書、プライバシー保護策、データ最小化手順、およびリンクルールが必要です。したがって、これらはアンケートワークフローへの非公式な追加ではなく、計画されたプロトコルの拡張として追加されるべきです25。
本プロトコルは適応可能ですが、あらゆる状況に機械的に適用すべきではありません。大学以外の集団を対象とする場合は、適格基準、リクルート経路、学業ストレス項目、およびインターネット利用カテゴリーの改訂が必要になる場合があります。国際的な多施設共同研究では、データの統合前に、翻訳、文化的適応、プラットフォームの同等性、タイムゾーンの処理、データ保護規則、および施設レベルのモニタリングを文書化する必要があります。IATをより新しい尺度や集団特有の尺度に置き換える場合でもワークフローは維持できますが、データ収集前に、スコア範囲、重症度しきい値、コードブック、構文、材料表、および補足変数辞書を更新する必要があります。オンライン上の時間だけでは、問題のある利用や強迫的な利用と同じ概念を捉えられない可能性があるため、インターネット利用時間と調節不全な利用を区別することが重要です26。
最後に、本代表的な実施例は横断的な研究であり、時間的な方向性の根拠として解釈されるべきではありません。IAT合計スコアとDERS-16合計スコアの間に観察された関連性は、分析経路がどのように機能するかを示すものであり、感情調節の困難さが問題のあるインターネット利用を引き起こすのか、あるいは問題のあるインターネット利用が時間の経過とともに感情調節を悪化させるのかを示すものではありません。他の大学環境においても同様の横断的なパターンが報告されていますが、方向性と変化を検証するには、縦断的研究または反復測定による適用が必要です27。本プロトコルの価値は、そのような将来の研究に向けた安定したベースラインのワークフローを提供することにあります。同意取得、質問票の実施、スクリーニング、スコアリング、信頼性の確認、モデル診断、ファイルのアーカイブ、および補足文書を標準化することで、本プロトコルはより再現性の高い横断的研究を支援し、時間的な問題が主要な目的となった場合には、縦断的な設計や介入設計へ拡張することが可能です28。コードブック、スクリーニングログ、出力計画、および分析準備済みのワークフロー資料を含めていることは、FAIRを志向した研究ソフトウェアおよびワークフロー文書化の原則29、ならびに透明性と再現性のある報告に関するより広範なオープンサイエンスの推奨事項30とも一致しています。
開示事項
著者は開示すべき事項を何も持っていません。
謝辞
本研究は、2025年河南省軟科学プロジェクト「河南省における私立高等教育の高品質な発展に対する学齢人口変化の影響および最適化パスに関する研究」(プロジェクト番号:252400410490)、および鄭州経済ビジネス大学の2025年博士研究基金プロジェクト「大学生のネットワーククラスター行動の形成メカニズムおよび世論誘導メカニズムに関する研究」の支援を受けて行われました。著者は、制度的支援を提供した鄭州経済ビジネス大学に感謝いたします。
材料
| 名前 | 会社 | カタログ番号 | コメント |
|---|---|---|---|
| 解析済みデータセット | 研究固有の内部文書 | analytic_dataset_v1.csv および analytic_dataset_v1.xlsx | すべての報告対象となる記述統計、信頼性、相関、および回帰分析に使用された最終的な匿名化データセット |
| 解析構文 | 研究固有の内部文書 | analysis_syntax_v1.R または同等のスクリプトファイル | スコアリングの検証、信頼性チェック、記述統計、相関分析、回帰モデリング、VIF(分散拡大係数)の算出、および診断出力の再現に使用されます。 |
| 注意確認項目の文言 | 研究固有の内部文書 | 注意確認_v1.txt | アンケート実施時に使用された、指示応答型アテンションチェック項目の固定文言 |
| DERS-16質問票 | 元の尺度ソース、または認可済み/適合済みの質問票バージョン | 感情調節困難尺度短縮版(16項目) | 感情調節の困難さを評価するために使用される。スコアリングは、コードブックに記載されている固定されたDERS-16スコアリングキーに従う。 |
| 電子情報シートおよび同意書ページ | 研究固有の内部文書 | 同意書_v1.pdf またはプラットフォーム同意ページ | アンケートへのアクセス前に、研究情報の提供および電子インフォームド・コンセントの取得に使用されます。 |
| ファイル命名規則シート | 研究固有の内部文書 | ファイル命名規則_v1.xlsx | 生データ、クリーニング済みデータ、解析用データ、スクリーニングログ、コードブック、および出力ファイルの名称を標準化するために使用される |
| 最終アンケートのスクリーンショット | 研究固有の内部文書 | アンケート_スクリーンショット_v1.pdf | 固定されたアンケート表示、項目の順序、回答アンカー、および必須項目の設定を記録するために使用される |
| 統合開発環境 | 仮定する | RStudio Desktop | スクリプト、ログ、および再現可能な解析ワークフローの管理に使用されます。 |
| インターネット依存症テスト質問票 | オリジナルの尺度ソース、または認可済み/適応版の質問票バージョン | 20項目インターネット依存度テスト | インターネット依存症状を評価し、通常利用、問題のある利用、および深刻な問題のある利用に分類するために使用されます。 |
| オンライン調査プラットフォーム | Qualtrics | XMプラットフォーム;機関またはライセンスアカウント | アンケートの作成、必須項目の設定、同意に基づくアクセス管理、有効時の重複回答の制限、および回答データの書き出しに使用されます。 |
| オプションのメニュー駆動型統計パッケージ | IBM | SPSS Statistics | 記述統計、信頼性チェック、または回帰分析のためにGUIベースの解析ワークフローが必要な場合に使用します。 |
| README/コードブックファイル | 研究固有の内部文書 | README_v1.txt または コードブック_v1.xlsx | 変数名、コーディング規則、スコア範囲、逆転項目処理の規則、除外しきい値、ファイル名、およびソフトウェアのバージョンを記録するために使用される |
| 読み取り専用アーカイブコピー | ポータブルドキュメント形式 | PDF/Aまたは機関承認済みのアーカイブ用PDF | 固定された調査票、同意書ページ、およびプロトコル支援文書を保存するために使用される |
| スクリーニング記録ワークブック | 研究固有の内部文書 | スクリーニングログ_v1.xlsx | 重複スクリーニング、完了時間のスクリーニング、アテンションチェックの不合格、パターン応答、論理的な不整合、欠損値、手動レビューによる判定、および最終的な保持件数を記録するために使用される |
| 表計算ソフト | Microsoft | Microsoft Excel ワークブック形式 (.xlsx) | スクリーニングログ、変数定義書、手動レビュー記録、および補足ワークブックの作成に使用 |
| 統計計算環境 | R Foundation / CRAN | R 4.5.3 | スコアリングの検証、記述統計、信頼性確認、相関分析、回帰分析、VIFの算出、および診断出力に使用される |
| 補足ファイル 1 | 研究固有の補足ファイル | 補足ファイル 1.xlsx | 質問票のワークフロー資料、コードブック、スクリーニングログ、アウトプットプラン、および解析準備済みワークフロー資料を含む |
| 付録表 S1 | 研究固有の補足表 | 付録表 S1 | 完全な変数辞書、ファイルの存在、コーディング構造、技術的識別子フィールド、スクリーニング変数、およびデータセット追跡フィールドを提供します。 |
| アンケート書き出し文書 | Qualtrics | アンケートからWordへのエクスポートまたはPDFエクスポート | 最終的な質問票の文言、項目の順序、分岐設定、必須回答項目の設定、および回答コードをアーカイブするために使用される |
| アンケート書き出し形式 | Qualtrics | CSVエクスポート | 生データの保存および解析用データのエクスポートに使用 |
参考文献
- Moreno MA, et al. Problematic internet use among US youth: a systematic review. Arch Pediatr Adolesc Med. 2011;165:797-805.
- Ramón-Arbués E, et al. Prevalence and factors associated with problematic internet use in a population of Spanish university students. Int J Environ Res Public Health. 2021;18:7620.
- Cai Z, et al. Associations between problematic internet use and mental health outcomes of students: a meta-analytic review. Adolesc Res Rev. 2023;8:45-62.
- Gong Z, Wang L, Wang H. Perceived stress and internet addiction among Chinese college students: mediating effect of procrastination and moderating effect of flow. Front Psychol. 2021;12:632461.
- Tsai JK, et al. Relationship between difficulty in emotion regulation and internet addiction in college students: a one-year prospective study. Int J Environ Res Public Health. 2020;17:4766.
- Romero-López M, Pichardo C, De Hoces I, García-Berbén T. Problematic internet use among university students and its relationship with social skills. Brain Sci. 2021;11:1301.
- Xie X, et al. Problematic internet use was associated with psychological problems among university students during COVID-19 outbreak in China. Front Public Health. 2021;9:675380.
- Montagni I, et al. Mental health-related digital use by university students: a systematic review. Telemed J E Health. 2020;26:131-146.
- Candussi CJ, Kabir R, Sivasubramanian M. Problematic smartphone usage, prevalence and patterns among university students: a systematic review. J Affect Disord Rep. 2023;14:100643.
- Moon SJ, Hwang JS, Kim JY, Shin AL, Bae SM, Kim JW. Psychometric properties of the Internet Addiction Test: a systematic review and meta-analysis. Cyberpsychol Behav Soc Netw. 2018;21:473-484.
- Jelenchick LA, Becker T, Moreno MA. Assessing the psychometric properties of the Internet addiction test in US college students. Psychiatry Res. 2012;196:296-301.
- Tafur-Mendoza AA, Acosta-Prado JC, Zárate-Torres RA, Ramírez-Ospina DE. Assessing the psychometric properties of the Internet addiction test in Peruvian university students. Int J Environ Res Public Health. 2020;17:5782.
- Fernández-Villa T, Molina AJ, García-Martín M, Llorca J, Delgado-Rodríguez M, Martín V. Validation and psychometric analysis of the Internet addiction test in Spanish among college students. BMC Public Health. 2015;15:953.
- World Medical Association. World Medical Association Declaration of Helsinki: ethical principles for medical research involving human subjects. JAMA. 2013;310:2191-2194.
- Wei Z, Hassan NC, Hassan SA, Ismail N, Gu X, Dong J. Psychometric validation of Young’s Internet addiction test among Chinese undergraduate students. PLoS One. 2025;20:e0320641.
- Bjureberg J, et al. Development and validation of a brief version of the Difficulties in emotion regulation scale : the DERS-16. J Psychopathol Behav Assess. 2016;38:284-296.
- Muszyński M. Attention checks and how to use them: review and practical recommendations. ASK: Research and Methods. 2023;32:3-38.
- Broman KW, Woo KH. Data organization in spreadsheets. Am Stat. 2018;72:2-10.
- Leiner DJ. Too fast, too straight, too weird: non-reactive indicators for meaningless data in internet surveys. Surv Res Methods. 2019;13:229-248.
- Taber KS. The use of Cronbach’s alpha when developing and reporting research instruments in science education. Res Sci Educ. 2018;48:1273-1296.
- Gioia F, Rega V, Boursier V. Problematic Internet use and emotional dysregulation among young people: a literature review. Clin Neuropsychiatry. 2021;18:41-54.
- Chen M, Zhang X. Factors influencing internet addiction among university students: the mediating roles of self-control and anxiety. Acta Psychol (Amst). 2024;250:104535.
- Akbari M, Seydavi M, Sheikhi S, Spada MM. Problematic smartphone use and sleep disturbance: the roles of metacognitions, desire thinking, and emotion regulation. Front Psychiatry. 2023;14:1137533.
- Wang S, Cheng Y, Yang Y, Lu B. The impact of physical activity on internet addiction among college students: the chain mediation role of rumination and mindfulness. BMC Public Health. 2025;25:3643.
- Struminskaya B, Sakshaug JW. Ethical considerations for augmenting surveys with auxiliary data sources. Public Opin Q. 2023;87:619-633.
- Yin J, et al. Associations between both smartphone addiction and objectively measured smartphone use and sleep quality and duration among university students: a cross-sectional study. JMIR Ment Health. 2025;12:e77796.
- Hainagiu SM, Neagu SN. Caught in the Web—emotional regulation difficulties and internet addiction among Romanian medical and technical university students: a pilot cross-sectional study. Healthcare (Basel). 2025;13:2528.
- Guo C, Chen M, Ji X, Li J, Ma Y, Zang S. Association between internet addiction and sleep quality in medical students: a longitudinal study. Front Psychol. 2025;16:1517590.
- Barker M, Chue Hong NP, Katz DS, Lamprecht AL, Martinez-Ortiz C, Psomopoulos F, et al. Introducing the FAIR Principles for research software. Sci Data. 2022;9:622.
- Nosek BA, Alter G, Banks GC, Borsboom D, Bowman SD, Breckler SJ, et al. Promoting an open research culture. Science. 2015;348:1422-1425.