本研究では、3つのトレーニング条件下で、空間的存在感、チームの連携、学習への没入感、認知負荷、安全性、および短期的学習成果を比較することにより、広空間に配置された共同コラボレーティブ仮想現実(VR)トレーニングプロトコルの評価を行います。
この記事について
サマリー
要約
大空間での共在型コラボレーティブ仮想現実(VR)は、参加者が共有された没入空間内で移動し、コミュニケーションを取り、行動を調整できるトレーニング環境を提供します。しかし、この構成がデスクトップベースのコラボレーションや分散型のルームスケールVRを超えて、空間的なプレゼンス、チームのコーディネーション、および学習へのエンゲージメントを向上させるかどうかについての証拠は依然として限られています。本研究では、126人の参加者を42の3人1組のチームに割り当てた、単一センターでの3群間実験プロトコルを評価しました。各チームは、デスクトップ共同シミュレーション、ルームスケール分散型コラボレーティブVR、または大空間共在型コラボレーティブVRのいずれかにランダムに割り当てられました。すべてのチームが、8分間のオリエンテーション、20分間の共同緊急物流および空間ナビゲーションタスク、トレーニング直後の評価、および2週間後の保持テストを完了しました。主要評価項目は、空間的プレゼンス、自己評価によるチームコーディネーション、観察者評価によるチームコーディネーション、および学習へのエンゲージメントとしました。副次評価項目には、知識スコア、認知負荷、シミュレーターによる不快感、およびタスクプロセス指標が含まれました。大空間共在型コラボレーティブVR群は、比較群よりも高い空間的プレゼンス、チームコーディネーション、および学習へのエンゲージメントを示しました。知識の習得度は大空間条件で有利でしたが、調整後のトレーニング後知識および2週間後の保持知識については、条件間で有意な差は見られませんでした。認知負荷は有意に増加せず、シミュレーターによる不快感は平均して軽微なままでした。これらの結果は、大空間共在型コラボレーティブVRが、単なる短期的な知識習得よりも、空間的な方向感覚、役割に基づいたコーディネーション、および能動的なチームエンゲージメントを必要とするトレーニングタスクに最も有用である可能性を示唆しています。
概要
没入型仮想現実は、視覚的な注意と身体の動きを状況に応じた実践に結びつけることで、通常では危険であるか、あるいは到達不可能な環境におけるシミュレーションベースのトレーニングを促進します1。近年の研究は、単なる新規性の実証からエビデンスに基づく実装へと移行していますが2、どのようなハードウェアおよび空間構成が協調学習行動を最も効果的にサポートするかという重要な課題が残っています。空間的なプレゼンスは注意や身体化に影響を与えますが3,4、主観的な没入感だけでは、複雑なチームベースのオペレーションには不十分な場合があります。生産的なコラボレーションには、共通の目標、タスクの相互依存性、および相互のリアルタイムモニタリングが必要です5。
近年の研究により、チームワークを支援する上での共同設置型バーチャルリアリティ(VR)と身体化されたコラボレーションに関する理解が進んでいます。しかし、異なる空間構造がもたらす教育的効果については、実証的なエビデンスが依然として不十分です6。本研究の主な貢献は、機能的に異なる3つのコラボレーション環境、すなわちデスクトップ共同シミュレーション、ルームスケール分散型VR、および広域空間共同設置型コラボレーションVRを体系的に評価したことです。これらの条件は、チームベースのシミュレーションにおける異なる構成を表しており、コラボレーション訓練環境における視覚的没入感と共有された物理的移動の比較を可能にします。これら3つの構成の物理的レイアウトは、図1に示されています。
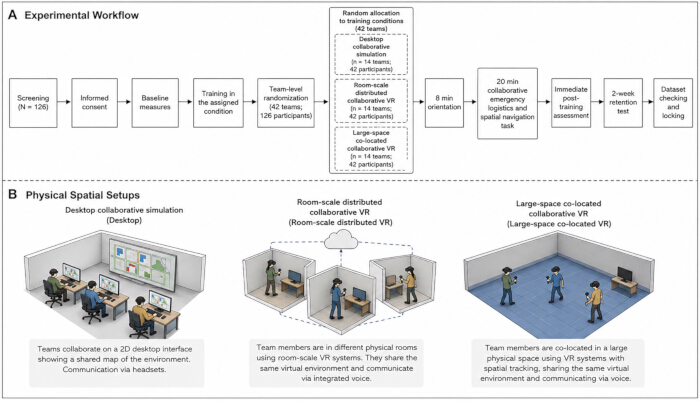
図1: 3つの協調トレーニング条件における実験ワークフローおよび物理的な空間配置。 (A) 参加者のスクリーニングとチーム単位のランダム割り付け(N = 126名、42チーム)から2週間後の保持テストに至るまでの実験ワークフローの概要。(B) 3つのトレーニング環境の概略図。左:デスクトップ協調シミュレーション。チームメンバーは個別のワークステーションを使用してナビゲートし、没入型の視覚的体験なしに割り当てられたオーディオチャンネルを通じて通信する。中央:ルームスケール分散型協調バーチャルリアリティ。参加者は個別の 3 m × 3 m の物理的トラッキングエリア内に留まりながら、視覚的没入感とリアルタイムのチーム通信を体験する。右:大空間共在型協調バーチャルリアリティ。チームメンバーは障害物のない 8 m × 8 m の空間を共有し、同期した物理的な移動、身体的な空間参照、およびリアルタイムの共同ナビゲーションが可能となる。こちらのリンクをクリックして、この図の拡大版を表示してください。
トレーニングプロトコルでは、共同での緊急物流および空間ナビゲーションシナリオを用いました。個別の手順トレーニングとは異なり、このシナリオでは、物理的な方向感覚の共有、リアルタイムの言語的調整、および身体化された空間的アクションが必要となります。これらの特性により、広大な空間に共在するコラボレーティブ仮想現実(VR)のアフォーダンスを評価するための構造的な設定が提供されます。図 2に、仮想現実条件およびデスクトップ条件で使用されたインターフェースとインタラクションモードを示します。身体化学習理論によれば、空間的な操作がタスクの要求事項と一致している場合、エージェンシーをサポートできることが示されており7、一方で認知負荷理論によれば、効果的なグループワークは、不必要な調整上の負担を導入することなく、認知的な要求を分散させることに依存しています8。
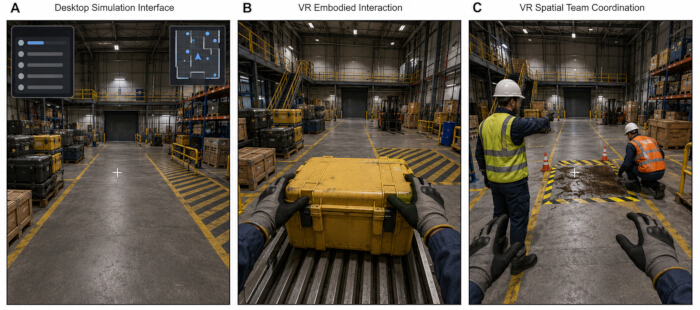
図 2: トレーニング条件におけるインターフェースの比較とタスク実行パラダイム。 共同緊急物流および空間ナビゲーションのシナリオはすべてのグループで標準化されており、相互作用のモダリティが主な相違点となっている。(A) デスクトップ共同シミュレーションインターフェース(一人称視点)。参加者はキーボードとマウスの入力を用いて工業環境をナビゲートし、空間的な方向確認のために中央の十字線およびミニマップやタスクリストを含む二次元グラフィカルユーザーインターフェース要素を利用する。(B) 没入型バーチャルリアリティ身体化相互作用。没入型条件では、参加者はマウスのクリックではなく、トラッキングされた手のジェスチャーによる直接的な物理操作を通じて、資源の収集や取り扱いを含むタスクを実行する。(C) 大空間共在型共同バーチャルリアリティ条件における空間的なチームコーディネーション。チームメンバーは、アバターのリアルタイムな視認性、空間的な指差しジェスチャー、および危険区域周辺での物理的な方向の共有を通じて、ナビゲーター、リソースマネージャー、セーフティチェッカーなどの役割に応じたアクションを調整する。こちらのリンクをクリックして、この図の拡大版を表示してください。
したがって、3つのトレーニング構成が、空間的プレゼンス、チームコーディネーション、および学習エンゲージメントに及ぼす影響を評価しました。没入型環境は強い主観的な関与を生じさせる可能性があるため9、即時的なエンゲージメントと定着した学習を区別するために、これらの結果をトレーニング後の知識習得および短期保持とともに検討しました。また、移動や没入的な曝露は身体的な負荷を伴うため、実装上の結果としてシミュレーターによる不快感をモニタリングしました10。
プロトコル
This study involving human participants was conducted in accordance with the Declaration of Helsinki and institutional requirements for behavioral and educational research. The study protocol was approved by the Human Research Ethics Committee of Shenyang City University (Approval No. SU1992837; Approval Date: January 18, 2025). All participants provided written informed consent before enrollment. Participants were informed that the study involved immersive virtual reality exposure, team-based task performance, questionnaire completion, behavioral observation, and short-term follow-up testing. Participation was voluntary, and withdrawal was permitted at any time without academic, employment, or institutional penalty. All study records were de-identified before analysis. Each participant was assigned a numerical participant code, and each team was assigned a separate team code. No names, student numbers, phone numbers, facial images, or directly identifiable audio recordings were included in the analytical dataset. Equipment categories, software versions, and associated replication resources are listed in the Table of Materials.
1. Study design and setting
This completed study used a single-center, three-arm, parallel-group experimental design to examine whether large-space co-located collaborative virtual reality was associated with stronger spatial presence, team coordination, and learning engagement during immersive training. The three training conditions were desktop collaborative simulation, room-scale distributed collaborative virtual reality, and large-space co-located collaborative virtual reality.
The conditions were designed as functional comparators rather than as a full factorial decomposition of immersion, collaboration, and walking space. The desktop condition represented collaboration without exposure to an immersive head-mounted display. The room-scale distributed collaborative virtual reality condition represented immersive team collaboration in separate small tracking areas. The large-space co-located collaborative virtual reality condition combined an immersive visual experience, shared physical movement, and real-time embodied team interaction within a single tracked training space. Group differences were therefore interpreted as differences among the complete training configurations rather than as effects attributable to any single component. This structure was selected because research on immersive learning treats spatial presence, agency, and engagement as mechanisms by which virtual environments may influence learning behavior11.
The study was conducted in the Immersive Learning and Human-Computer Interaction Laboratory at the participating institution from March 3, 2025–July 18, 2025. Recruitment and baseline testing were conducted from March 3–April 25, 2025. Intervention sessions were conducted from March 10–May 30, 2025. The 2-week retention assessments were completed between March 24–June 16, 2025. Data checking, observer scoring, and dataset locking were completed by July 18, 2025.
All sessions were conducted in the same laboratory complex to control lighting, temperature, internet connectivity, task instructions, and researcher supervision. The large-space co-located collaborative virtual reality condition used an unobstructed tracking area of 8 m × 8 m. The room-scale distributed collaborative virtual reality condition used three separated 3 m × 3 m marked areas. The desktop collaborative simulation condition used individual computer workstations separated by acoustic partitions so that participants could communicate only through the assigned communication channel.
Participants were assigned to three-person teams before randomization. The team was used as the training unit because the task required distributed role execution, verbal coordination, shared situational awareness, and joint problem-solving. Randomization was conducted at the team level to avoid contamination between participants within the same session. The overall study workflow and physical configuration of the three conditions are shown in Figure 1.
2. Participants and eligibility screening
Participants were recruited from undergraduate and postgraduate programs at the participating institution. Recruitment notices described the study as an immersive training study involving virtual reality, team coordination, and learning assessment. The notices did not state the expected superiority of any training condition. Interested participants completed an online screening form before laboratory scheduling.
Participants were eligible if they were 18–35 years old, had normal or corrected-to-normal vision, could understand the training language, had no prior participation in the same virtual training scenario, and could stand and move safely for at least 30 min. Participants were excluded if they reported severe motion sickness, uncontrolled epilepsy, recent musculoskeletal injury affecting walking or balance, uncorrected visual impairment, severe vertigo, severe uncorrected hearing impairment, current acute illness, or any medical condition that made immersive virtual reality exposure unsafe. Participants were also excluded if they had extensive prior experience with the exact training scenario or had previously participated in pilot testing of the same system.
Eligibility was verified in two steps. A research assistant first reviewed the online screening form. The session researcher then confirmed eligibility verbally on the day of testing before consent. Participants reporting mild prior motion discomfort were not automatically excluded but were monitored more closely and reminded that participation could be stopped immediately if discomfort occurred. The complete screening form, eligibility items, baseline questionnaire, response formats, and coding rules are provided in Supplementary File 1.
An a priori power calculation was conducted using G-Power software to determine the required sample size for the experimental design. Assuming a medium expected effect size of f = 0.25 based on previous immersive collaborative learning literature, an alpha level of 0.05, and statistical power of 0.80 for a three-group analysis, a minimum of 111 participants was required. To accommodate the three-person team structure and maintain balanced group allocation across conditions, the final sample was expanded to 126 participants comprising 42 independent teams. Because the intervention was delivered at the team level, team identifiers were retained for clustering adjustment, observer-rated coordination scoring, and sensitivity checks.
3. Randomization, allocation concealment, and blinding
After all members of a three-person team had completed eligibility confirmation, the team was randomly assigned to one of the three training conditions using a computer-generated block-randomization list with a fixed block size of six teams. The allocation sequence was generated before data collection using a randomization package in the statistical computing environment, with a reproducible seed of 20250301.
Allocation concealment was maintained using sequentially numbered, opaque, tamper-evident envelopes prepared by a researcher independent of participant recruitment and intervention delivery. The randomization file was stored in a password-protected spreadsheet and was not accessible to the outcome assessors.
Allocation was revealed only after completion of the baseline questionnaire and pre-training knowledge test. The session researcher opened the next sealed allocation envelope immediately before equipment setup. Blinding of participants to the physical training format was not possible because the three conditions were visibly different. Participants were not informed which condition was expected to perform better.
Two observers rated team coordination from standardized screen recordings. The observers were blinded to the study hypotheses, training condition labels, and questionnaire results and were not involved in training delivery. Video files were renamed using neutral team codes before scoring. Condition-identifying interface labels were cropped or masked where possible before observer scoring.
4. Training scenario and task structure
The training scenario was designed as a collaborative emergency logistics and spatial navigation task in a simulated industrial training environment. Each three-person team was required to locate virtual resources, interpret spatial cues, communicate route information, coordinate role-specific actions, and complete a sequence of mission steps within a fixed time window.
Each participant held one of three roles: navigator, resource manager, or safety checker. The navigator interpreted the route direction and destination sequence. The resource manager identified and collected task-relevant virtual items. The safety checker monitored hazards, confirmed procedural order, and prompted the team before final submission.
The scenario contained four zones: orientation zone, resource zone, hazard zone, and completion zone. Each team completed eight required subtasks: identifying the target location, selecting three correct resources from six possible resources, avoiding two incorrect route branches, responding to three hazard prompts, transferring information between team members, and submitting the final task sequence. The maximum task time was 20 min. Teams that did not complete all required subtasks within 20 min were stopped at the time limit, and the number of completed subtasks was recorded.
Before the main task, all participants completed a standardized 8 min orientation. The first 3 min introduced the study rules and safety procedures. The next 3 min introduced the interface controls. The final 2 min allowed participants to practice movement, selection, and communication in a neutral practice environment that did not contain objects, routes, hazards, or answers used in the main scenario. No performance data from the practice environment were analyzed.
The same learning content, task sequence, target answers, route structure, hazard prompts, and scoring criteria were used across all three conditions. The conditions differed in interaction modality, degree of immersion, physical movement, and spatial configuration. The immersive environments were developed using a commercial real-time three-dimensional development platform. Multiplayer networking and spatial state synchronization were implemented using a dedicated multiplayer synchronization framework operating over a local gigabit Ethernet architecture. Participants assigned to the immersive virtual reality conditions used high-resolution head-mounted displays with integrated headphones and microphones. Spatial tracking used an infrared laser-based tracking system with four base stations. Avatar implementation used inverse kinematics algorithms to map real-time head and hand controller telemetry to articulated worker avatars.
5. Pre-study procedure checking and measurement refinement
Before formal data collection, all questionnaire items, knowledge test items, observer-rating rules, and task procedures were reviewed by two researchers with experience in immersive learning and one researcher with experience in educational measurement. The review focused on item clarity, role-task alignment, scoring consistency, safety wording, and construct alignment.
A pilot procedure check was conducted from February 17–February 21, 2025, with six participants who met the same eligibility criteria as the formal sample. The pilot examined task timing, headset comfort, movement safety, instruction clarity, questionnaire completion time, data export accuracy, and observer-rating feasibility. Pilot data were used only to refine wording, setup timing, safety instructions, and log-export procedures. These participants were not included in the final sample, and their data were not included in formal analysis.
6. Desktop collaborative simulation condition
In the desktop collaborative simulation condition, each participant used an individual workstation connected to a 24-inch 1080p monitor. Input devices consisted of a computer mouse and keyboard, and audio communication was provided through a USB headset and microphone. Participants were seated at separate workstations and were instructed not to communicate outside the system.
The desktop simulation used the same virtual environment, task objects, route sequence, hazard prompts, and scoring logic as the virtual reality conditions. The camera view was first-person. As illustrated in Figure 2A, participants in the desktop group navigated using keyboard inputs and interacted with virtual resources using mouse clicks through a fixed two-dimensional monitor field of view. Field of view, movement speed, interaction distance, and audio settings were fixed before data collection and were not changed between sessions. One researcher monitored technical stability during each session but did not provide task advice after the main scenario began.
7. Room-scale distributed collaborative virtual reality condition
In the room-scale distributed collaborative virtual reality condition, the three participants entered the same virtual scenario from separate 3 m × 3 m marked tracking areas. Each participant used a head-mounted display and handheld controllers. Team members communicated through the assigned voice channel and completed the same role-based team task but could not physically co-navigate in a shared large tracking space.
Before the main task, headset fit, interpupillary distance, the boundary system, and controller straps were adjusted. Participants were instructed to stop immediately if dizziness, nausea, eye strain, headache, loss of balance, or anxiety occurred. A researcher remained within 2 m of each active tracking area throughout the session and monitored safety without providing task guidance.
If a participant crossed the marked boundary, the session was paused, and the participant was repositioned. If moderate discomfort occurred, defined as a self-rated discomfort score of 5 or higher on any 0–10 discomfort item, the session was paused and the participant was seated for recovery. If any discomfort item reached 7 or higher, the session was stopped.
8. Large-space co-located collaborative virtual reality condition
In the large-space co-located collaborative virtual reality condition, each three-person team entered the same 8 m × 8 m tracked training area. Each participant wore a head-mounted display, held two controllers, and was represented by a role-specific avatar visible to the other team members. Team members communicated verbally in real time while physically moving through the shared training space. The system synchronized participant location, hand movement, object selection, and task-state changes. As shown in Figure 2B and Figure 2C, participants in the immersive conditions executed tasks using three-dimensional spatial hand gestures with tracked controllers and physical head rotation for a 360° field of view.
The large-space condition used the same task content and 20 min time limit as the other conditions. Physical movement was calibrated so that the virtual route remained within the marked safety area. A safety boundary appeared in the headset when participants approached the edge of the tracking zone. Before the main task, floor clearance, cable-free movement, headset fit, tracking stability, audio input, and controller response were checked. Participants were instructed to use natural physical walking rather than artificial locomotion techniques to navigate the virtual environment. Physical contact between team members was prohibited. If two participants approached within 0.5 m of each other, a neutral safety reminder was provided without task information.
Each large-space session was supervised by two researchers. One researcher monitored the system dashboard and recording status. The second researcher stood outside the active tracking area and monitored participant safety. The task was paused if tracking was lost for more than 10 s, if a participant reported discomfort, or if a participant crossed the safety boundary. If the interruption lasted less than 2 min and the participant wished to continue, the task resumed from the last saved state. If the interruption exceeded 2 min, the session was recorded as incomplete and retained in the intention-to-treat dataset.
9. Outcome measures and assessment timing
Assessments were completed at baseline, immediately after training, and 2 weeks after training. Baseline measures included demographics, prior virtual reality and team-training experience, gaming familiarity, and a 30-point knowledge pretest. Immediate post-training measures included spatial presence, self-rated and observer-rated team coordination, learning engagement, cognitive load, simulator discomfort, post-training knowledge, and task-performance indicators. The 2-week follow-up used the same 30-point knowledge test with reordered items and minor wording variation. The assessment schedule is shown in Table 1.
Table 1: Summary of primary and secondary measures. This table summarizes the variables, measurement scales, assessment timing, and data sources for the primary outcomes, secondary learning outcomes, and safety and process measures evaluated throughout the experimental protocol. Please click here to download this Table.
Spatial presence was measured immediately after training using an 8-item, 7-point scale adapted from established presence dimensions12. Scores were averaged when at least 80% of items were completed; otherwise, the score was coded as missing. Full items and scoring rules are provided in Supplementary File 1.
Self-rated team coordination was measured using a customized six-item, 7-point scale covering communication clarity, role awareness, mutual monitoring, assistance timing, shared task comprehension, and error recovery. Pilot testing with 20 participants assessed item clarity and structure, and exploratory factor analysis identified a single dominant factor. Internal consistency in the main sample was Cronbach’s α = 0.88. Participant scores were calculated as the mean of completed items, and team-level scores as the mean of the three participant scores. Full items and scoring criteria are provided in Supplementary File 1.
Observer-rated team coordination was assessed using a customized rubric covering communication timing, role execution, mutual support, spatial coordination, and error recovery. Each domain was scored from 0–20, yielding a total score from 0–100. The rubric underwent expert review, and two observers completed 10 h of training before formal scoring. Inter-rater reliability was evaluated using a two-way random-effects intraclass correlation coefficient (ICC) for absolute agreement, with ICC ≥ 0.75 required before final scoring. Total-score differences greater than 12 points were resolved by consensus; otherwise, the mean of the two scores was used. The complete rubric and reconciliation procedure are provided in Supplementary File 1.
Learning engagement was measured immediately after training using a 12-item, 7-point short-form scale13. Scores were averaged across completed items, with higher values indicating stronger engagement. Internal consistency was assessed using Cronbach’s alpha. Cognitive load was assessed using five 1–7 ratings of mental demand, physical demand, time pressure, effort, and frustration14. Full items and scoring rules are provided in Supplementary File 1.
Knowledge acquisition was assessed using a 30-point test comprising 20 single-best-answer items and five short scenario judgment items. The same blueprint was used for pretest, post-test, and 2-week retention testing, with reordered items and equivalent wording changes. A gain of at least 3 points from pretest to post-test was defined as a practically meaningful descriptive improvement. The test blueprint, scoring rules, and judgment rubric are provided in Supplementary File 1.
Simulator discomfort was assessed before exposure, after orientation, and after the main task using five 0–10 symptom ratings. The mean of the five items formed the discomfort index. Sessions were stopped if any item reached 7 or higher. Post-task indices above 6 required at least 15 min of monitoring, and indices of 5 or higher required 24 h follow-up. Full safety-scoring rules are provided in Supplementary File 1.
Task-performance indicators included completion status, completion time, correct resources selected, hazard prompts correctly handled, route errors, and safety interruptions. Incomplete teams were assigned 1,200 s for completion time. Outcome definitions, timing, score ranges, data sources, and analysis levels are summarized in Table 1 and detailed in Supplementary File 1.
10. Data collection procedure
Each session followed the same sequence. Participants arrived 15 min before the scheduled training time. Identity was confirmed using the appointment list, eligibility was checked again, the consent form was explained, and procedural questions were answered. Participants then signed the consent form and received participant codes. The expected superiority of any condition was not discussed.
Participants completed the baseline questionnaire and pre-training knowledge test on a laboratory tablet. The baseline phase lasted approximately 12 min. After baseline completion, team allocation was revealed, and the assigned training setup was prepared. Equipment preparation lasted approximately 5 min for the desktop condition, 8 min for the room-scale distributed collaborative virtual reality condition, and 10 min for the large-space co-located collaborative virtual reality condition. Equipment preparation was not counted as training exposure.
All participants then completed the standardized 8 min orientation. The main task started immediately after orientation and lasted up to 20 min. No teaching, hints, or corrective feedback were provided during the main task. Technical assistance was limited to restoring system function, adjusting headset fit, repositioning participants within the safety boundary, or repeating previously stated safety instructions. After the task, participants removed the equipment and completed the post-training questionnaire and post-training knowledge test at individual stations. The post-training assessment lasted approximately 15 min.
The 2-week retention test was administered online 14 days after the training session, with an acceptable completion window from day 13–day 16. Participants received one reminder 24 h before the due time and one reminder on day 15 if the test had not been completed. Responses submitted after day 16 were retained in the raw dataset but excluded from the primary retention analysis. The actual number of days between training and follow-up was recorded for sensitivity analysis.
11. Data quality control
Electronic questionnaires included range checks for key outcomes, while demographic items could be skipped. Submission times were recorded, and questionnaires completed in less than one-third of the median completion time were flagged for review. System logs were exported after each session and matched against session records within 48 h; discrepancies were resolved using timestamped recordings.
Observer-rated coordination scores were entered independently by two observers. Total-score differences greater than 12 points were flagged for consensus review, and final scores were locked before group-level analysis. Multi-item scale scores were calculated when at least 80% of items were completed; otherwise, scores were coded as missing. Unanswered single-best-answer knowledge items were scored as 0. Short scenario judgment items were scored independently by two raters, with disagreements greater than 1 point reviewed by a third rater.
The final dataset was locked after verification of eligibility records, participant and team codes, questionnaire ranges, knowledge scores, observer ratings, system logs, retention-test validity, data merges, and missingness. Detailed rules for scoring, cleaning, and dataset locking are provided in Supplementary File 1.
12. Safety monitoring and stopping criteria
Safety monitoring was conducted throughout all training sessions. Before exposure, participants were reminded that discomfort could occur during virtual reality training and that withdrawal was allowed at any time. During the task, posture, balance, movement speed, and verbal signs of discomfort were monitored. The task was stopped immediately if a participant reported severe dizziness, nausea, visual discomfort, headache, anxiety, loss of balance, or a wish to stop.
Predefined stopping criteria were applied consistently. The session was stopped if any discomfort item reached 7 or higher on the 0–10 scale, if a participant crossed the safety boundary twice in one session, if tracking loss lasted more than 2 min, if equipment malfunction prevented normal interaction, or if continued participation was judged to create a safety risk. Stopped sessions were documented using a session interruption form. Participants were seated after stopping and monitored until symptoms returned to a mild level, defined as all discomfort items below 3. No participant was allowed to leave the laboratory while reporting moderate or severe discomfort.
13. Data management and confidentiality
All data were stored in a de-identified project folder on an encrypted institutional drive. The linkage file connecting participant identities to participant codes was stored separately and was accessible only to the principal investigator. Questionnaire data, task logs, observer ratings, and knowledge test scores were merged using participant and team codes only, and the analytical dataset contained no personal identifiers.
Data were organized at participant and team levels. Participant-level files contained identifiers, condition assignment, demographic variables, questionnaire outcomes, knowledge outcomes, and task-related variables. Team-level files contained team identifiers, condition assignment, observer-rated coordination, task completion, completion time, resource selection, hazard handling, route errors, and safety interruptions. Raw observer scores were retained separately before averaging or consensus resolution. Variable definitions, coding ranges, and dataset structure are provided in Supplementary File 1.
14. Statistical analysis
Primary outcomes were spatial presence, self-rated team coordination, observer-rated team coordination, and learning engagement. Secondary outcomes included post-training knowledge, 2-week retention, cognitive load, simulator discomfort, task completion, completion time, and task-process indicators. Training conditions comprised desktop collaborative simulation, room-scale distributed collaborative virtual reality, and large-space co-located collaborative virtual reality.
Participant- and team-level variables were summarized using appropriate descriptive statistics. Baseline characteristics included age, gender, prior virtual reality experience, gaming familiarity, prior team-based training experience, and pre-training knowledge. Because randomization occurred at the team level, intraclass correlation coefficients were calculated to assess within-team dependence. Participant-level primary outcomes were analyzed using linear mixed-effects models with training condition as a fixed effect and team identifier as a random intercept. Models used restricted maximum likelihood estimation and included available data under the missing-at-random assumption. No imputation was applied to primary questionnaire outcomes. Estimated marginal means were compared using Tukey-adjusted pairwise contrasts. Observer-rated coordination was analyzed at the team level.
The Benjamini-Hochberg false discovery rate procedure was applied across the four primary outcomes as a sensitivity analysis. All randomized teams and participants were analyzed according to original allocation. Multi-item scale scores were calculated when at least 80% of items were completed; otherwise, scores were coded as missing. Residual normality was assessed using Q-Q plots and Shapiro-Wilk tests, and homogeneity of variance was assessed using Levene’s test. Strongly non-normal distributions were examined using the Kruskal-Wallis test as a sensitivity analysis.
Effect sizes were reported with p values. Analysis of variance results included eta squared and partial eta squared; pairwise comparisons included Cohen’s d with 95% confidence intervals; and mixed-effects models reported estimated mean differences with 95% confidence intervals. Statistical significance was defined as two-sided p < 0.05. Associations among spatial presence, team coordination, learning engagement, and knowledge outcomes were examined using Pearson or Spearman correlations, as appropriate. Statistical syntax for descriptive analyses, mixed-effects models, team-level coordination analysis, multiple-outcome adjustment, assumption checks, knowledge analyses, and correlation analyses is provided in Supplementary File 1.
結果
Participant flow and analysis populations
A total of 126 participants were enrolled and assigned to 42 three-person teams. Fourteen teams were allocated to each training condition, resulting in 42 participants in the desktop collaborative simulation group, 42 in the room-scale distributed collaborative virtual reality group, and 42 in the large-space co-located collaborative virtual reality group. All teams completed the assigned training session and were retained in the intention-to-treat dataset.
Missingness was low and was not concentrated in any condition. Spatial presence scores were available for 124 participants, including 41 in the desktop group, 42 in the room-scale group, and 41 in the large-space group. Self-rated team coordination scores were available for 123 participants, with 41 participants in each group. Learning engagement scores were available for 122 participants, including 40 in the desktop group, 41 in the room-scale group, and 41 in the large-space group. Simulator discomfort scores were available for 124 participants, including 42 in the desktop group, 41 in the room-scale group, and 41 in the large-space group. Valid 2-week retention knowledge scores were available for 122 participants, including 40 in the desktop group, 41 in the room-scale group, and 41 in the large-space group. Observer-rated team coordination was available for all 42 teams. Participant flow, allocation, immediate assessment, and follow-up completion are summarized in Figure 3.
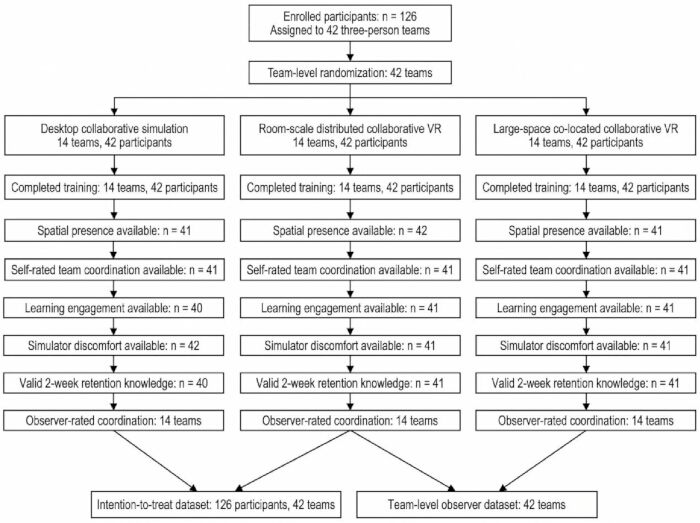
Figure 3: Participant flow and analysis populations. The flow diagram shows enrollment, allocation of 126 participants into 42 three-person teams, training completion, immediate assessment, observer-rated coordination scoring, and valid 2-week follow-up data across the three training conditions. Please click here to view a larger version of this figure.
Baseline characteristics
Baseline demographic and training-related characteristics were broadly comparable across the three conditions. The final sample consisted of young adult undergraduate and postgraduate participants. The three groups were similar in age, prior virtual reality exposure, familiarity with gaming or simulation, prior team-based training experience, and prior emergency logistics, navigation, or industrial safety training.
Pre-training knowledge scores were also comparable across groups. Mean pre-training knowledge scores were 16.17 ± 3.09 in the desktop collaborative simulation group, 16.10 ± 3.61 in the room-scale distributed collaborative virtual reality group, and 15.55 ± 3.23 in the large-space co-located collaborative virtual reality group. The unadjusted between-group comparison was not statistically significant, F(2, 123) = 0.44, p = 0.647, η2 = 0.007.
Baseline characteristics and pre-training measures are shown in Table 2. Before inferential hypothesis testing, diagnostic evaluations indicated that the primary continuous variables met the assumptions of residual normality and homogeneity of variance. Internal consistency was high across the psychometric instruments, with Cronbach’s alpha coefficients of 0.86 for spatial presence, 0.88 for self-rated team coordination, and 0.91 for learning engagement. All statistically significant group differences across the primary outcomes remained significant after Benjamini-Hochberg false discovery rate adjustment.
Table 2: Baseline characteristics and pre-training measures. This table reports participant demographics, prior virtual reality and training experience, gaming or simulation familiarity, prior related training history, and pre-training knowledge scores across the three experimental conditions. Please click here to download this Table.
Spatial presence
Spatial presence was analyzed using a linear mixed-effects model with training condition as a fixed effect and team code as a random intercept. Mixed-effects model tests used Satterthwaite-adjusted degrees of freedom. The model showed a significant effect of training condition on spatial presence, F(2, 39) = 23.91, p < 0.001. Estimated marginal means were 4.13 for the desktop collaborative simulation group, 5.00 for the room-scale distributed collaborative virtual reality group, and 5.42 for the large-space co-located collaborative virtual reality group.
Tukey-adjusted pairwise comparisons showed that spatial presence was higher in the large-space group than in the desktop group, estimated mean difference = 1.29, 95% CI: 0.86 – 1.72, p < 0.001. Spatial presence was also higher in the large-space group than in the room-scale group, estimated mean difference = 0.42, 95% CI: 0.04 – 0.80, p = 0.027. The room-scale group scored higher than the desktop group, estimated mean difference = 0.87, 95% CI: 0.45 – 1.29, p < 0.001.
For descriptive comparison, the unadjusted mean ± standard deviation (SD) scores were 4.13 ± 0.91 in the desktop group, 5.00 ± 0.79 in the room-scale group, and 5.42 ± 0.80 in the large-space group. The unadjusted analysis of variance (ANOVA) showed the same pattern, F(2, 121) = 25.68, p < 0.001, η2 = 0.298. Primary outcome distributions are shown in Figure 4, and the corresponding mixed-effects and descriptive statistics are summarized in Table 3.
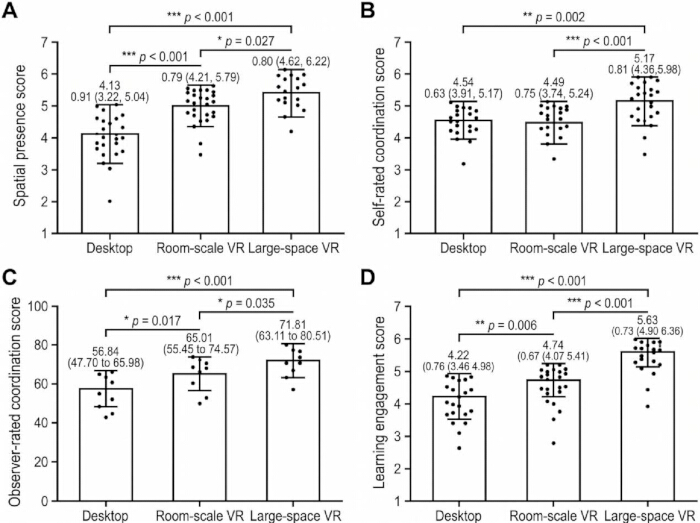
Figure 4: Primary outcomes across training conditions. (A) Spatial presence. (B) Self-rated team coordination. (C) Observer-rated team coordination. (D) Learning engagement. Spatial presence, self-rated team coordination, and learning engagement were participant-level outcomes; observer-rated team coordination was analyzed at the team level. Error bars indicate standard deviation. Please click here to view a larger version of this figure.
Table 3: Primary outcomes. This table summarizes spatial presence, self-rated team coordination, observer-rated team coordination, and learning engagement across the three training conditions. Corresponding inferential statistical models and false discovery rate sensitivity checks are also presented. Please click here to download this Table.
Team coordination
Self-rated team coordination was analyzed at the participant level using a linear mixed-effects model with training condition as a fixed effect and team code as a random intercept. The model showed a significant effect of training condition, F(2, 39) = 9.96, p < 0.001. Estimated marginal means were 4.54 in the desktop group, 4.49 in the room-scale group, and 5.17 in the large-space group.
Tukey-adjusted comparisons showed that self-rated team coordination was higher in the large-space group than in the desktop group, estimated mean difference = 0.63, 95% CI: 0.25 – 1.01, p = 0.002. The large-space group also scored higher than the room-scale group, estimated mean difference = 0.68, 95% CI: 0.29 – 1.07, p < 0.001. The desktop and room-scale groups did not differ significantly, estimated mean difference = 0.05, 95% CI: −0.33 – 0.43, p = 0.942. For descriptive comparison, the unadjusted mean ± SD scores were 4.54 ± 0.63 in the desktop group, 4.49 ± 0.75 in the room-scale group, and 5.17 ± 0.81 in the large-space group. The unadjusted ANOVA produced the same directional pattern, F(2, 120) = 10.84, p < 0.001, η2 = 0.153.
Observer-rated team coordination was analyzed at the team level, as prespecified. Inter-rater reliability exceeded the predefined threshold, with a two-way random-effects intraclass correlation coefficient of ICC = 0.84. Three team recordings had observer total-score differences greater than 12 points and were resolved through consensus review. Observer-rated coordination differed significantly across conditions, F(2, 39) = 10.92, p < 0.001, η2 = 0.359. Mean team-level scores were 56.84 ± 9.14 in the desktop group, 65.01 ± 9.56 in the room-scale group, and 71.81 ± 8.70 in the large-space group. Tukey-adjusted comparisons showed higher observer-rated coordination in the large-space group than in the desktop group, mean difference = 14.97, 95% CI: 7.33 – 22.61, p < 0.001. The large-space group also scored higher than the room-scale group, mean difference = 6.80, 95% CI: 0.42 – 13.18, p = 0.035. The room-scale group scored higher than the desktop group, mean difference = 8.17, 95% CI: 1.31 – 15.03, p = 0.017. Self-rated and observer-rated coordination showed the same group ordering, with the large-space group having the highest coordination scores on both measures.
Learning engagement
Learning engagement was analyzed using a linear mixed-effects model with training condition as a fixed effect and team code as a random intercept. The model showed a significant effect of training condition, F(2, 39) = 37.46, p < 0.001. Estimated marginal means were 4.22 in the desktop group, 4.74 in the room-scale group, and 5.63 in the large-space group. Tukey-adjusted pairwise comparisons showed that engagement was higher in the large-space group than in the desktop group, estimated mean difference = 1.41, 95% CI: 1.03 – 1.79, p < 0.001. Engagement was also higher in the large-space group than in the room-scale group, estimated mean difference = 0.89, 95% CI: 0.53 – 1.25, p < 0.001. The room-scale group scored higher than the desktop group, estimated mean difference = 0.52, 95% CI: 0.15 – 0.89, p = 0.006.
For descriptive comparison, the unadjusted mean ± SD scores were 4.22 ± 0.76 in the desktop group, 4.74 ± 0.67 in the room-scale group, and 5.63 ± 0.73 in the large-space group. The unadjusted ANOVA showed the same pattern, F(2, 119) = 40.00, p < 0.001, η2 = 0.402.
False discovery rate sensitivity checks for primary outcomes
The Benjamini-Hochberg false discovery rate procedure was applied across the four prespecified primary outcomes: spatial presence, self-rated team coordination, observer-rated team coordination, and learning engagement. All four primary outcomes remained statistically significant after adjustment. The false discovery rate sensitivity check produced the same primary outcome pattern as the main analyses.
Knowledge outcomes and retention
Immediate post-training knowledge was analyzed using a mixed-effects model with training condition as a fixed effect, pre-training knowledge as a covariate, and team code as a random intercept. The adjusted model showed a non-significant group effect for post-training knowledge, F(2, 39) = 2.14, p = 0.131. Estimated marginal means were 20.12 for the desktop group, 20.96 for the room-scale group, and 21.85 for the large-space group. For descriptive comparison, mean post-training knowledge scores were 20.09 ± 4.04 in the desktop group, 21.00 ± 4.57 in the room-scale group, and 21.84 ± 3.95 in the large-space group. The unadjusted between-group comparison was not statistically significant, F(2, 123) = 1.83, p = 0.165, η2 = 0.029.
Knowledge gain from baseline to immediate post-training assessment was evaluated as a secondary exploratory inferential outcome. Mean gains were 3.93 ± 2.88 points in the desktop group, 4.91 ± 2.12 points in the room-scale group, and 6.30 ± 2.75 points in the large-space group. The unadjusted group effect was significant, F(2, 123) = 8.77, p < 0.001, η2 = 0.125. Tukey-adjusted comparisons showed greater knowledge gain in the large-space group than in the desktop group, mean difference = 2.37, 95% CI: 0.96 – 3.78, p < 0.001. The large-space group also showed greater gain than the room-scale group, mean difference = 1.39, 95% CI: 0.14 – 2.64, p = 0.026. The room-scale and desktop groups did not differ significantly, mean difference = 0.98, 95% CI: −0.31 – 2.27, p = 0.171.
At the 2-week follow-up, retention knowledge was analyzed among participants with valid retention responses within the predefined day 13–day 16 window. The adjusted mixed-effects model, controlling for pre-training knowledge and including team code as a random intercept, showed a non-significant group effect, F(2, 39) = 1.68, p = 0.199. Mean retention scores were 18.70 ± 4.55 in the desktop group, 19.62 ± 4.37 in the room-scale group, and 20.42 ± 4.38 in the large-space group. The unadjusted group comparison was also not statistically significant, F(2, 119) = 1.53, p = 0.220, η2 = 0.025. Secondary learning outcomes are summarized in Table 4.
Table 4: Secondary learning outcomes across training conditions. This table reports pre-training knowledge, immediate post-training knowledge, knowledge gain, and 2-week knowledge retention across the three training conditions. Adjusted mixed-effects models are presented for the secondary learning outcomes. Please click here to download this Table.
Cognitive load and simulator discomfort
Cognitive load was analyzed as a secondary outcome. Mean cognitive load was 4.22 ± 0.69 in the desktop group, 4.49 ± 0.62 in the room-scale group, and 4.13 ± 0.82 in the large-space group. The unadjusted group effect was F(2, 123) = 2.92, p = 0.058, η2 = 0.045. This result did not reach the predefined significance threshold.
Simulator discomfort differed across conditions. Mean post-task discomfort index was 1.37 ± 0.71 in the desktop group, 2.18 ± 0.79 in the room-scale group, and 2.42 ± 0.58 in the large-space group. The unadjusted group effect was significant, F(2, 121) = 25.72, p < 0.001, η2 = 0.298. Discomfort scores were higher in the two virtual reality groups than in the desktop group, while average values remained in the mild range. No participant met the predefined stopping criterion of any discomfort item ≥7. Seven participants had a post-task discomfort index ≥5 and received 24 h symptom-resolution contact. Among these participants, four had a post-task discomfort index >6 and were also monitored in the laboratory for at least 15 min before leaving. All seven participants reported symptom resolution without medical referral. No session was terminated because of simulator discomfort, and no adverse event requiring clinical care was recorded. Cognitive load and simulator discomfort are shown in Figure 5.
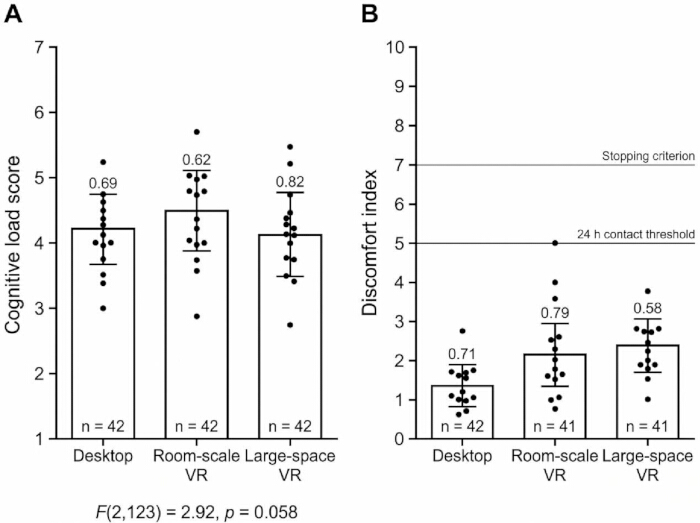
Figure 5: Cognitive load and simulator discomfort across training conditions. (A) Cognitive load, scored from 1 – 7, with higher scores indicating greater perceived workload. (B) Post-task simulator discomfort, scored from 0 – 10 and based on nausea, dizziness, eye strain, headache, and balance discomfort. Error bars indicate standard deviation. Please click here to view a larger version of this figure.
Task process indicators
Task-process indicators were used to describe team performance during the 20 min collaborative training task. Task completion was 71.4% in the desktop group, 78.6% in the room-scale group, and 85.7% in the large-space group. Mean completion time was 1,041.6 ± 162.4 s in the desktop group, 984.3 ± 151.8 s in the room-scale group, and 931.7 ± 139.6 s in the large-space group. Because incomplete teams were assigned a time limit of 1,200 s, completion time was interpreted descriptively.
The mean number of correct resources selected was 2.21 ± 0.70 in the desktop group, 2.43 ± 0.65 in the room-scale group, and 2.64 ± 0.50 in the large-space group. Mean correctly handled hazard prompts were 1.93 ± 0.83, 2.21 ± 0.70, and 2.50 ± 0.65, respectively. Mean route errors were 2.07 ± 1.14 in the desktop group, 1.50 ± 0.94 in the room-scale group, and 1.00 ± 0.78 in the large-space group. Safety interruptions were infrequent across all conditions, with means of 0.21 ± 0.43, 0.29 ± 0.47, and 0.36 ± 0.50, respectively. Task completion status, completion time, correct resource selection, hazard prompts handled correctly, route errors, and safety interruptions are summarized in Table 5.
Table 5: Task process indicators and safety events. This table summarizes objective task-performance measures, including completion rates, route navigation errors, and hazard handling. Simulator discomfort monitoring and recorded adverse clinical events are also reported. Please click here to download this Table.
Associations among presence, coordination, engagement, and learning
Participant-level psychometric responses were aggregated into team-level cluster means before integration with observer-rated coordination measures. Team-level correlation analysis showed positive associations between spatial presence and learning engagement (r = 0.57), self-rated team coordination (r = 0.26), and observer-rated coordination (r = 0.32).
The correlation pattern indicated moderate overlap among presence, coordination, and engagement, while correlations with knowledge gain were smaller. The correlation pattern indicated overlap among presence, coordination, and engagement, while associations with knowledge gain were smaller. These analyses were exploratory and do not establish causal pathways among the measured outcomes. The correlation matrix is shown in Figure 6.
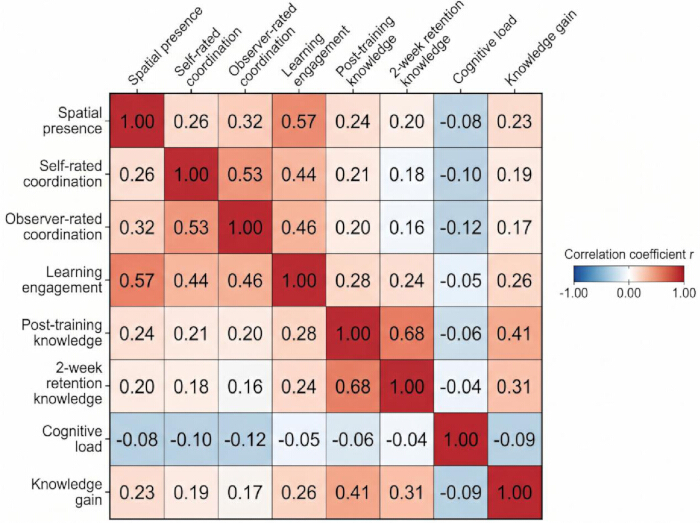
Figure 6: Correlation matrix for presence, coordination, engagement, and learning outcomes. The heatmap shows Pearson correlation coefficients among spatial presence, self-rated team coordination, observer-rated team coordination, learning engagement, post-training knowledge, 2-week retention knowledge, cognitive load, and knowledge gain. Please click here to view a larger version of this figure.
The large-space co-located collaborative virtual reality group had higher spatial presence, self-rated team coordination, observer-rated team coordination, and learning engagement than the comparison groups. These primary outcome findings remained significant after accounting for team clustering and after false discovery rate adjustment. For secondary outcomes, knowledge gain favored the large-space group, whereas adjusted post-training knowledge and 2-week retention knowledge did not differ significantly across conditions. Cognitive load did not differ significantly across groups, and simulator discomfort remained mild on average despite higher scores in the virtual reality conditions.
DATA AVAILABILITY:
The de-identified analytical dataset, data dictionary, scoring rubrics, and statistical syntax used to support reproducibility are publicly available in the Zenodo repository - https://zenodo.org/records/21991446. Additional reporting checklists, instrument blueprints, scoring rules, and dataset documentation are provided in Supplementary File 1.
Supplementary File 1: Reproducibility Materials for the Large-Space Collaborative Virtual Reality Training Study. This file contains the participant questionnaire, knowledge test blueprint, observer-rated coordination rubric, data dictionary, scoring and cleaning rules, statistical syntax outline, de-identified analytical dataset structure, and reporting checklist. Please click here to download this file.
ディスカッション
本研究では、広空間での共在型コラボレーティブ仮想現実(VR)構成が、デスクトップでのコラボレーションおよびルームスケールの分散型コラボレーティブVRとは異なるトレーニング体験をもたらすかどうかを検討しました。最も強く、一貫した結果が観察されたのは、空間的プレゼンス、チームのコーディネーション、および学習エンゲージメントの3点でした。これらの成果はそれぞれ異なる性質を持ちます。空間的プレゼンスは、参加者が自身をトレーニング空間内に位置していると感じた程度を反映し、コーディネーションは情報の交換、役割の遂行、およびエラーからの回復を反映し、エンゲージメントはタスクに対する認知的および行動的な関与を反映しています。チームのクラスタリングと偽発見率の補正を行った後、広空間条件ではこれら3つのドメインすべてにおいてより高いスコアが記録されました。このパターンは、コラボレーティブVRが単なるディスプレイ技術としてだけでなく、共有された行動、コミュニケーション、および環境構造が共同して学習行動を形成する「タスク生態系」として機能するという、より広範な視点と一致しています15。
空間的プレゼンスに関する知見が重要である理由は、3つのトレーニング条件によって、動作の構成と共在感(co-presence)が異なっていたためである。デスクトップ条件では、没入的な身体的配置なしにコラボレーションが行われた。ルームスケール分散条件では、没入的な視覚体験とリアルタイムのチームコミュニケーションが提供されたが、参加者はそれぞれ個別の小さなトラッキングエリアに留まった。大空間条件では、共有された物理的な共同ナビゲーションが追加され、参加者が同一のトラッキング環境内で移動、方向付け、および行動することが可能となった。したがって、観察された空間的プレゼンスの向上は、単に歩行スペースのみに起因するのではなく、身体的動作、共有された空間参照、およびリアルタイムのチーム視認性を組み合わせたトレーニング構成全体によるものであると考えられる。この解釈は、感覚運動的随伴性、空間的な更新、および環境の一貫性が、媒介された環境内に位置しているという感覚をサポートする場合に、没入型システムがプレゼンスを強化できることを示したプレゼンス研究16と一致している。協調性の結果においても同様のパターンが見られた。大空間群は、自己評価および観察者評価の両方でより高い協調性を示した。自己評価による協調性は、楽しさや斬新さの影響を受けている可能性があるが、観察者評価による協調性は、視認可能なコミュニケーションのタイミング、役割の遂行、相互サポート、空間的な協調、およびエラー回復に基づいていた。したがって、共有された空間情報は、チームのアクションを構成するための共通の参照領域を提供した可能性がある。このパターンは、コラボレーションがコミュニケーションチャネル、共有表現、タスクの相互依存性、およびチームの進捗モニタリングに依存することを示すコンピュータ支援協調学習の研究17と整合している。
大空間群においても学習へのエンゲージメントが増加したが、この知見については学習効果との関連において慎重な解釈が必要である。直後の知識習得量が高い一方で、調整後のトレーニング後および保持期間の結果に有意差がなかったことは、体験的なエンゲージメントの強化が、必ずしも一貫した知識の保持強化につながるわけではないことを示している。したがって、単回の曝露は大いなる没入感や行動上の関与をもたらす可能性があるが、必ずしも知識習得における持続的な差を生むとは限らない。大空間の協調環境における利点は、持続的な認知的保持よりも、空間的な協調や能動的な状況への関与において最も顕著であった。エンゲージメントは学習のための条件であり、保持を保証するものではない。没入型学習の研究においても同様に、プレゼンスや関与は注意やタスクへの参加をサポートする可能性があるが、持続的な学習は指導設計、フィードバック、事前知識、および反復練習の機会にも依存することが示されている18。大空間群では、その条件下で必要とされる身体的移動やリアルタイムのチーム協調があったにもかかわらず、認知的負荷に有意な増加は見られなかった。ルームスケールの分散条件下で平均認知的負荷が最も高かったが、群間差はあらかじめ定義された有意水準には達しなかった。分散型の協調作業では、参加者が個別の小空間で行動しながら音声で協調する必要があり、大空間条件下で利用可能な共有の物理的参照点がないままに、協調への要求が維持された可能性がある。認知的負荷理論においても同様に、協調学習は、タスク構造が不必要なコミュニケーションの負担を加えることなく認知的作業を分散させたときに最も効果的であることが示されている19。
シミュレーターによる不快感は、デスクトップ条件よりも2つの仮想現実条件下で高かったが、平均スコアは軽度にとどまった。不快感の項目のいずれかが7に達するという中止基準を満たした参加者はなく、臨床的なケアを必要とする有害事象も発生しなかった。広域空間での共 locate(同一場所)型コラボレーティブ仮想現実は、ヘッドマウントディスプレイへの曝露、身体的動作、およびチームメンバーとの近接性が組み合わさっているため、安全上の考慮が必要となる。実施した安全策によって不快感が完全に排除されたわけではないが、本サンプルにおいては症状を管理可能な範囲内に維持することができた。より広範な施設への導入には、標準化されたトラブルシューティング手順が必要である。眼精疲労を軽減するためには、ヘッドセットのフィット感と瞳孔間距離のキャリブレーションが重要である。空間トラッキングの喪失やネットワーク遅延の増加が発生した場合は、直ちにシミュレーションを一時停止させる必要があり、オーディオチャンネルの不具合が発生した場合は、局所的なハードウェアのリセット手順が必要となる。また、同一場所での移動に伴う安全性に関しては、衝突リスクを軽減するために、歩行のみを許可する指示と物理的な境界制約が必要である。これらの手順は、サイバー酔いや不快感を、仮想現実トレーニングにおける偶発的な副作用としてではなく、設計およびモニタリング上の考慮事項として扱うべきであるという見解と一致している20。
本研究は、単純なバーチャルリアリティ(VR)と非バーチャルリアリティの対比にとどまらず比較を広げたため、手法的な価値も有している。デスクトップによる共同作業、分散型没入共同作業、および共在型広域空間共同作業が、それぞれ異なる構成として評価された。この設計により、単なる視覚的な没入感や口頭による調整だけではなく、空間を共有する没入型共同作業に伴う変化を検討することが可能となった。観察された差は、プレゼンス(存在感)、コーディネーション、およびエンゲージメントにおいて最も顕著であり、知識の定着に関してはより小さかった。このパターンは、より大規模または没入感の高いシステムがすべての学習成果を向上させるという一般的な結論を支持するものではない。したがって、広域空間共在型コラボレーティブVRは、単純な事実の想起よりも、空間的な方向感覚、役割分担、リアルタイムの相互モニタリング、および協調的な動作を必要とするトレーニングにおいて最も適用性が高いと考えられる21。
いくつかの制限事項を考慮する必要があります。本研究は単一の機関において、若年成人の学部生および大学院生を対象に実施されたため、より経験豊富な研修医、専門の救急チーム、およびテクノロジーへの習熟度が低い学習者への一般化には限界があります。タスクには構造化された救急物流と空間ナビゲーションが含まれており、空間的依存度の低い領域では異なるパターンが現れる可能性があります。パフォーマンスの評価は、主観的なアンケート、人間による観察者の評価、および基本的なシステムログに基づいています。コミュニケーション頻度、累積発話時間、動作の同期、および標的への視線挙動を含む詳細な行動テレメトリーは記録されておらず、チームの相互作用の詳細なメカニズムや協調効率の定量化には限界があります。今後の研究では、連続的な心拍変動や皮膚電気活動などの生理学的指標を、包括的な空間テレメトリーとともに組み込むべきです。また、対人協調に関連する効果と、身体的移動の増加に関連する効果を区別するために、独立した非協調的な身体運動対照群が必要となります。参加者コホートは実現可能性に基づき単一の学術機関から抽出されており、心理測定尺度および観察ルーブリックはこの没入型パラダイムのために開発または適応させたものです。内部信頼性と構成概念妥当性は評価されましたが、自己報告式尺度には新規性効果の影響が残っています。また、参加者レベルのアンケートデータとチームレベルの観察者スコアを統合したことで構造的な複雑さが生じました。分析レベルを合わせるためにクラスター平均集計と混合効果モデルを用いましたが、今後の研究では、同一の操作上の分析単位において並列的なマルチモーダルデータの収集を優先させるべきです。2週間のフォローアップ期間では、効果がより長期的に持続するか、あるいは現実世界のパフォーマンスに転移するかどうかは立証されていません。さらに、3つのトレーニング構成は包括的な環境比較であり、完全要因設計の構成要素ではありませんでした。したがって、視覚的没入感、身体的移動、身体意識、および共有された物理的共在が混同されたままであり、観察された差異を単一の構成要素に帰属させることはできませんでした。今後の研究では、要因操作を通じてこれらの要因を分離し、繰り返しのトレーニング曝露と実務転移タスクを組み込むことで、協調性の向上が臨床または産業現場で持続するかを判断する必要があります22。
開示事項
著者に利益相反はありません。
著者貢献:
Fu Boは、研究の概念化、実験プロトコルの策定、データ収集の管理、および原稿の初稿執筆を担当した。Meng Naは、仮想現実シミュレーションプラットフォームの技術的な実装を監督し、統計プログラミングに寄与し、重要な知的内容について原稿の共同修正を行った。両著者が投稿用の最終版を承認した。
謝辞
著者は、本研究を支援した沈陽市大学のインテリジェンス・エンジニアリング学部に感謝いたします。また、広域共在型コラボレーティブ仮想現実実験の実施に必要な設備および空間施設を提供してくださったVirtual-Real Interaction and Digital Twin Technology Innovation重点研究室 に深く感謝いたします。さらに、没入型トレーニングセッションにボランティアとして参加したすべての学部生および大学院生に心より感謝申し上げます。彼らの積極的な関与と協力は、本研究を成功させるために不可欠でした。本研究は、遼寧省応用基礎研究プログラム2025(助成金番号:2025JH2/101330049)、遼寧省自然科学基金2024(助成金番号:2024-MS-255)、遼寧省教育局大学基礎研究基金2025(助成金番号:LJ212513220006)、および遼寧省教育局大学基礎研究基金2024(助成金番号:LJ212413220001)の支援を受けて行われました。
材料
| 名前 | 会社 | カタログ番号 | コメント |
|---|---|---|---|
| 24時間症状消失確認連絡フォーム | 研究開発されたフォローアップフォーム | バージョン1.0 | タスク後不快感指標がある参加者の症状消失を記録するために使用される ≥5 |
| 吸音パーティションパネル | 汎用研究室家具サプライヤー | 標準的なポータブル吸音パーティション、約160cm–高さ 180 cm | デスクトップ参加者を分離し、チャンネル外でのコミュニケーションを防止するために使用されます。 |
| ノンアルコール除菌ワイプ | 汎用的な研究室衛生用品サプライヤー | 機器対応除菌ワイプ | ヘッドマウントディスプレイ、コントローラー、マイクロフォン、キーボード、マウス、およびセッション間の共有表面の清掃に使用します。 |
| 分析データセット | 研究生成ファイル | 分析データセット.csv | 参加者1名につき1行で構成される、匿名化済みの参加者レベルデータセット |
| ベースライン質問票 | 本研究で開発した質問票 | バージョン1.0、2025年2月確定 | 人口統計学的情報、バーチャルリアリティの利用経験、ゲームへの習熟度、およびチームトレーニングの経験を収集するために使用した |
| 境界標示テープ | 汎用的なラボ用安全用品サプライヤー | 滑り止め床面標示テープ | 3mをマークするために使用します。 × 3mのルームスケール領域および8mの × 8mの大空間トレーニングエリア |
| 認知負荷尺度 | 研究用に調整されたワークロード評価フォーム | 5項目版 | トレーニング直後に使用し、精神的負荷、身体的負荷、時間的圧力、努力感、および不満度に関する項目で構成されています。 |
| コンピューターマウス | 汎用コンピュータ機器サプライヤー | 標準的な有線または無線マウス | デスクトップ共同シミュレーション条件下でのインタラクションに使用 |
| データクリーニングログ | 研究生成ファイル | データクリーニングログ.xlsx | スコア修正、欠損値チェック、観察者間スコアの整合、およびデータセット確定の決定を記録する |
| データディクショナリ | 研究生成ファイル | バージョン 1.0 | 変数名、ラベル、コーディングルール、スコア範囲、欠損値ルール、および解析レベルを定義する |
| デスクトップモニター | 汎用コンピュータ機器サプライヤー | 24インチモニター、最小1,920ピクセル × 1,080解像度 | デスクトップ共同シミュレーション条件下で使用 |
| デスクトップワークステーション | 汎用コンピュータ機器サプライヤー | 最小構成:Intel i5 または同等以上のプロセッサ、16 GB RAM、専用グラフィックスカード、Windows 10 以降 | デスクトップシミュレーション、ローカルモニタリング、アンケート実施、およびデータ処理に使用されます。 |
| 使い捨てヘッドセット用フェイスカバー | 汎用衛生用品サプライヤー | 標準的な使い捨てヘッドマウントディスプレイ用フェイスカバー | バーチャルリアリティセッション中の参加者の衛生管理に使用される |
| 緊急停止チェックリスト | 研究開発の安全性評価フォーム | バージョン 1.0 | 中止基準、不快感などの有害事象、安全上の理由による中断、および症状消失後のフォローアップの記録に使用される |
| 暗号化された機関内ストレージ | 参加機関 | アクセス制御付き暗号化プロジェクトフォルダ | 匿名化されたデータセット、スコアリングファイル、録音データ、および構文ファイルの保存に使用される |
| 観察者評価による協調性ルーブリック | 本研究で作成した評価ルーブリック | 5ドメイン、100点満点版 | 2名の盲検観察者が、コミュニケーションのタイミング、役割の遂行、相互支援、空間的協調、およびエラー回復を評価するために使用した |
| オブザーバー・スコア・データセット | 研究生成ファイル | 観察者スコア.csv | 平均化またはコンセンサスレビュー前のドメインレベルの観察者スコアを含む |
| オンラインアンケートプラットフォーム | 機関またはライセンス提供の調査システム | 2025年のデータ収集期間中に有効であったバージョン | スクリーニング、ベースライン質問票、トレーニング後質問票、および2週間後の保持テストに使用 |
| ペア比較パッケージ | Rパッケージ | R 4.3.2に対応した最新バージョンのemmeans | 推定周辺平均およびTukey法で調整したペアワイズ比較に使用されます。 |
| 参加同意書 | 研究承認済み文書 | 倫理委員会承認済みバージョン | ベースライン評価およびランダム化の前に使用 |
| 参加者アンケート | 本研究で作成した質問票 | バージョン1.0 | スクリーニング項目、ベースライン項目、空間的プレゼンス、自己評価によるチームコーディネーション、学習へのエンゲージメント、認知負荷、および不快感尺度を含む |
| ポータブルチェア | 汎用研究室用家具サプライヤー | 標準的な実験用チェア | 同意説明、アンケート記入、回復、およびタスク後のモニタリング中の参加者の着席に使用される |
| R統計ソフトウェア | R Foundation for Statistical Computing | R バージョン 4.3.2 | データのクリーニング、信頼性分析、混合効果モデル、相関分析、および図の作成に使用 |
| 信頼性分析パッケージ | Rパッケージ | R 4.3.2に対応した最新バージョンのpsychパッケージ | クロンバックの係数を算出するために使用される’Cronbachのα係数およびクラス内相関係数 |
| ルームスケールのトラッキングエリア | 共同研究機関ラボラトリー | 3 mの間隔をあけた3つの × 3m間隔の標記スペース | ルームスケール分散型協調仮想現実条件に使用 |
| 安全性モニタリングフォーム | 研究開発されたフォーム | バージョン1.0 | 不快感スコア、境界線の越境、トラッキングの中断、および回復状態の記録に使用される |
| 画面録画ソフトウェア | 汎用的な商用またはオープンソースの画面録画ソフトウェア | 2025年のデータ収集期間中に有効であったバージョン | 観察者による評価に基づいた協調性の標準化録画の作成に使用される |
| セッションチェックリスト | 研究開発チェックリスト | バージョン1.0 | 出席の記録、適格性の確認、機器のセットアップ、安全点検、タスクの完了、および中断の記録に使用される |
| シミュレーター不快感スケール | 本研究で開発した症状チェックリスト | 5項目、0–10バージョン | 曝露前、オリエンテーション後、およびトレーニング直後に使用 |
| 空間的プレゼンス尺度 | 研究に適応させた質問票 | 8項目版 | トレーニング直後に使用。応答範囲 1–7 |
| SPSS統計ソフト | IBM Corp. | IBM SPSS Statistics バージョン 29.0 | 記述統計、ANOVA(分散分析)、WelchのANOVA、カイ二乗検定、および前提条件の確認に使用される |
| 統計解析構文ファイル | 研究生成ファイル | R構文ファイル、バージョン1.0 | データのクリーニング、混合効果モデル、分散分析(ANOVA)、相関分析、および出力の生成を再現するために使用される |
| システムログ・エクスポートモジュール | 本研究で開発したエクスポート機能 | バージョン1.0、正式なデータ収集前に確定済み | エクスポートされたタスク開始時間、タスク終了時間、完了ステータス、オブジェクト選択、ハザードへの反応、ルートエラー、および中断 |
| チームレベルのデータセット | 研究生成ファイル | チームレベルデータセット.csv | チームレベルでの観察者による調整スコアおよびタスクプロセス指標を含む |
| バーチャルリアリティ・トラッキングシステム | 商用バーチャルリアリティハードウェアサプライヤー | 対応するヘッドセットおよびコントローラーで使用可能 | 被験者の位置および手の動きの追跡に使用されます。 |
| 仮想トレーニング環境 | カスタムメイドのトレーニングソフトウェア | バージョン1.0、正式なデータ収集前にロック済み | 共同緊急物流および空間ナビゲーションシナリオの提供 |
| 音声通信モジュール | 内蔵または統合通信モジュール | 正式なデータ収集前のバージョン固定 | 指定されたチーム音声通信チャネルに使用されます |
参考文献
- Dede C. Immersive interfaces for engagement and learning. Science. 2009;323(5910):66-69.
- Radianti J, Majchrzak TA, Fromm J, Wohlgenannt I. A systematic review of immersive virtual reality applications for higher education: Design elements, lessons learned, and research agenda. Comput Educ. 2020;147:103778. https://doi.org/10.1016/j.compedu.2019.103778
- Cummings JJ, Bailenson JN. How immersive is enough A meta-analysis of the effect of immersive technology on user presence. Media Psychol. 2016;19(2):272-309.
- Makransky G, Petersen GB. The Cognitive Affective Model of Immersive Learning (CAMIL): A theoretical research-based model of learning in immersive virtual reality. Educ Psychol Rev. 2021;33(4):937-958.
- Dillenbourg P. What do you mean by collaborative learning In: Dillenbourg P, editor. Collaborative-learning: Cognitive and computational approaches. Oxford: Elsevier; 1999. p. 1-19.
- van der Meer N, van der Werf V, Brinkman WP, Specht M. Virtual reality and collaborative learning: A systematic literature review. Front Virtual Real. 2023;4:1159905. https://doi.org/10.3389/frvir.2023.1159905
- Johnson-Glenberg MC. Immersive VR and education: Embodied design principles that include gesture and hand controls. Front Robot AI. 2018;5:81. https://doi.org/10.3389/frobt.2018.00081
- Kirschner F, Paas F, Kirschner PA. A cognitive load approach to collaborative learning: United brains for complex tasks. Educ Psychol Rev. 2009;21(1):31-42.
- Fredricks JA, Blumenfeld PC, Paris AH. School engagement: Potential of the concept, state of the evidence. Rev Educ Res. 2004;74(1):59-109.
- Kourtesis P, Linnell J, Amir R, Argelaguet F, MacPherson SE. Cybersickness in virtual reality: The role of individual differences, cognitive functions, and virtual reality locomotion. Virtual Worlds. 2024;3(1):62-93.
- Dalgarno B, Lee MJW. What are the learning affordances of 3-D virtual environments Br J Educ Technol. 2010;41(1):10-32.
- Schubert T, Friedmann F, Regenbrecht H. The experience of presence: Factor analytic insights. Presence Teleoper Virtual Environ. 2001;10(3):266-281.
- O’Brien HL, Cairns P, Hall M. A practical approach to measuring user engagement with the refined User Engagement Scale (UES) and new User Engagement Scale Short Form (UES-SF). Int J Hum-Comput Stud. 2018;112:28-39.
- Hart SG, Staveland LE. Development of NASA-TLX (Task Load Index): Results of empirical and theoretical research. In: Hancock PA, Meshkati N, editors. Human mental workload. Amsterdam: North-Holland; 1988. p. 139-183.
- De Back TT, Tinga AM, Nguyen P, Louwerse MM. Learning in immersed collaborative virtual environments: Design and implementation. Interact Learn Environ. 2023;31(8):5364-5382.
- Slater M, Sanchez-Vives MV. Enhancing our lives with immersive virtual reality. Front Robot AI. 2016;3:74. https://doi.org/10.3389/frobt.2016.00074
- Roschelle J, Teasley SD. The construction of shared knowledge in collaborative problem solving. In: O’Malley C, editor. Computer supported collaborative learning. Berlin: Springer; 1995. p. 69-97.
- Merchant Z, Goetz ET, Cifuentes L, Keeney-Kennicutt W, Davis TJ. Effectiveness of virtual reality-based instruction on students' learning outcomes in K-12 and higher education: A meta-analysis. Comput Educ. 2014;70:29-40.
- Sweller J. Cognitive load during problem solving: Effects on learning. Cogn Sci. 1988;12(2):257-285.
- Stanney KM, Kennedy RS, Drexler JM, editors. Cybersickness is not simulator sickness. Proceedings of the Human Factors and Ergonomics Society Annual Meeting; 1997.
- Lindgren R, Johnson-Glenberg M. Emboldened by embodiment: Six precepts for research on embodied learning and mixed reality. Educ Res. 2013;42(8):445-452.
- Howard MC. A meta-analysis and systematic literature review of virtual reality rehabilitation programs. Comput Hum Behav. 2017;70:317-327.