This protocol outlines a controlled behavioral experiment combining continuous eye tracking with a simulated transactional interface to investigate how manipulated social presence and product visual salience are associated with consumer attention, post-exposure psychological states, and immediate simulated purchase decisions.
方法論記事
Behavioral Experiment Protocol for Examining Social Presence, Visual Attention, and Impulse Buying in Live-Streaming E-Commerce
この記事について
サマリー
要約
Live-streaming e-commerce combines product demonstration with real-time social interaction, yet survey-based research cannot capture the moment-to-moment attention associated with simulated purchase decisions. This protocol describes a controlled 2 × 2 between-subjects experiment manipulating social presence and product visual salience. Two hundred forty participants (60 per condition) viewed one 90 s stimulus while gaze was recorded at 120 Hz across product, streamer, chat, and price areas of interest. Participants then completed measures of perceived social presence, flow, positive emotion, urge to buy impulsively, and purchase intention, followed by a simulated purchase-choice task. High social presence was associated with greater attention to streamer and chat regions, higher flow, positive emotion, and urge scores, and shorter decision times. High product salience was associated with longer product and price fixation, earlier first fixation on the product, and higher purchase intention. In the simulated task, 181 participants (75.4%) selected “purchase now,” with condition rates ranging from 68.3% to 83.3%. Modeled indirect associations suggested that psychological states contributed more strongly to simulated purchase choice than experimental condition or gaze duration alone; these same-time mediation measures do not establish temporal causality. The protocol integrates controlled stimulus manipulation, eye tracking, psychometrics, and simulated decision outcomes while requiring cautious interpretation of raw fixation duration when the AOI area or exposure differs across conditions.
概要
Live-streaming e-commerce integrates product demonstration, real-time communication, and immediate transaction capabilities into a single, highly immersive interface. Unlike static online retail, it places consumers in a visually dense and socially active environment where purchase decisions often crystallize within seconds. While research on impulse buying in this context has expanded rapidly, empirical designs remain somewhat fragmented1. Review-based evidence indicates a heavy reliance on cross-sectional surveys and structural equation modeling2. These approaches are effective for retrospective theory testing but struggle to capture the dynamic, in-the-moment interplay of consumer attention and purchase-related choice during a viewing episode.
The rationale behind developing the current protocol stems from this methodological limitation. Live-streaming commerce is not merely a context for belief formation; it is a high-stimulus environment. To map this decision process, the stimulus-organism-response (S-O-R) framework serves as a solid foundation, conceptualizing platform cues as external stimuli, psychological states as organismic mechanisms, and impulse purchase as the behavioral outcome3. However, relying solely on self-reported evaluations obscures the real-time cognitive processing triggered by these cues.
Two distinctive features drive the live-streaming experience: social presence and visual product salience. Social presence—comprising streamer interactions, live chat, and audience feedback—has been associated with trust, flow states, emotional engagement, and impulse-related responses4. Concurrently, visual presentation techniques, such as product close-ups and dynamic price tags, compete for viewer attention and may be associated with a transition from exposure to purchase desire5. Yet, visual exposure does not automatically guarantee immediate action. A product can be noticed without triggering the momentary motivational state defined as the urge to buy impulsively6. Distinguishing between a stated intention to buy and the self-reported momentary urge to purchase is crucial, as the latter may help distinguish cognitive appraisal from immediate simulated choice.
Eye-tracking technology offers a direct methodological advantage over traditional survey-based techniques by objectively quantifying visual attention during continuous stimulus exposure. Recent applications of eye-tracking in e-commerce reveal how social cues capture or distract consumer focus across different interface regions7. Studies tracking visual fixations on streamer attractiveness and product types further demonstrate the utility of gaze metrics in predicting consumer responses8,9. Despite these advances, existing experimental protocols rarely integrate social presence manipulation, product salience, continuous gaze tracking, and discrete behavioral purchase tasks into a unified, reproducible design. Prior investigations suggest that social cues (e.g., viewing frequency, anticipated emotion, streamer trust) primarily intensify emotional engagement and the urge to buy10,11, whereas product-centric cues operate through an evaluative, attention-driven route12. Examining these divergent pathways simultaneously requires a highly controlled behavioral setup.
The overall goal of this protocol is to introduce a comprehensive, behaviorally grounded methodology for evaluating live-streaming consumer decisions. This approach moves beyond intention-only measurement by combining a 2 × 2 between-subjects stimulus manipulation (social presence × product visual salience) with real-time eye-tracking and a simulated behavioral purchase task. By tracking visual fixations across predefined areas of interest (product, streamer, chat, price) and linking these metrics to post-exposure psychological states and simulated behavioral outcomes (purchase choice, basket value, decision time), the protocol provides a robust analytical pipeline13.
Ultimately, this method is highly appropriate for researchers in consumer behavior, human-computer interaction, and digital marketing who require a reproducible framework to study visually complex digital environments. By objectively observing exactly where consumers look, how they feel, and what they choose immediately after exposure, this protocol bridges the methodological gap between visual stimuli and a simulated purchase choice.
プロトコル
All methods described here were approved by the institutional human research ethics committee of Guangzhou College of Technology and Business, and written informed consent was obtained from all participants before participation.
1. Participant recruitment and eligibility screening
- Recruit 240 general consumers through social media. Include individuals aged 18–35 years who have normal or corrected-to-normal vision and have viewed live-streaming shopping content at least once during the previous 6 months.
- Record the recruitment channel, participant status, and compensation provided to each participant.
NOTE: The age range of 18–35 years defines the prespecified young-adult population; the lower bound also ensures eligibility for independent adult consent.
- Record the recruitment channel, participant status, and compensation provided to each participant.
- Exclude individuals who report uncorrected visual impairment, color-vision problems that affect screen viewing, recent eye surgery, or neurological disorders that affect gaze control.
- Exclude individuals who are currently taking medication that substantially affects alertness or who have previously viewed any of the four study stimuli.
- Enroll 240 participants, with 60 participants assigned to each of the four experimental conditions, to maintain a 1:1:1:1 allocation ratio.
NOTE: With a total sample size of 240, α = 0.05, and 236 residual degrees of freedom, a 2 × 2 fixed-effects ANOVA has 80% power to detect a 1-df main effect or interaction of Cohen’s f = 0.182 (η2p ≈ 0.032). - Provide the ethics-approved participant information before administering the baseline questionnaire or initiating any eye-tracking procedure.
- Allow the participant to ask questions about the study.
- Obtain and document written informed consent in accordance with the approved institutional procedure.
- Assign a unique study identifier to each consented participant.
- Do not enroll individuals who decline to provide informed consent.
- Generate a computer-based blocked randomization list using a fixed block size of eight.
- Maintain a 1:1:1:1 allocation ratio across the four experimental conditions.
- Assign each consented participant to one experimental condition according to the randomization list.
- Store the allocation sequence in a password-protected spreadsheet and conceal it until eligibility and informed consent have been confirmed and the participant has arrived for the laboratory session (Table 1).
- Instruct participants to complete a baseline questionnaire recording age, gender, monthly income band, live-shopping frequency (coded 0 to 4), and trait impulsivity on a seven-point scale.
2. Live-streaming stimulus preparation
- Produce four distinct 90 s live-streaming e-commerce videos based on a 2 × 2 factorial design manipulating social presence (low versus high) and product visual salience (low versus high)14 (Figure 1).
- Standardize the product category, product price, promotional claim, streamer identity, background setting, camera angle, and verbal product information across all four videos.
- Manipulate social presence using the following condition-specific procedures.
- For the high-social-presence condition, instruct the streamer to address viewers directly at least six times and respond to four simulated viewer comments.
- Display eight simulated real-time chat messages and three audience-response cues (e.g., viewer likes) in the high-social-presence condition.
- For the low-social-presence condition, instruct the streamer to present the product information in a one-way explanatory style without directly addressing viewers or responding to simulated chat messages.
- Manipulate product visual salience using the following condition-specific procedures.
- In the high-product-salience condition, set the product AOI to occupy 30%–35% of the visible interface.
- Display the price label for at least 45 s and present at least four close-up views of the product in the high-product-salience condition.
- In the low-product-salience condition, restrict the product AOI to 15%–20% of the visible interface.
- Display the price label for approximately 20 s and limit the product close-up to one brief segment in the low-product-salience condition (Table 2).
NOTE: No independent stimulus-pretest dataset is available in the archived study materials. Therefore, the sample size, measures, and results of any independent pretest cannot be verified or reported for the present study. In particular, no independently verified pretest data are available for stimulus attractiveness, realism, or credibility.
- Use perceived social presence measured in the main sample as the manipulation check for the social-presence manipulation.
- Use product fixation duration and time to first product fixation measured in the main sample as operational checks of the product-salience manipulation (Table 3).
- For future replication, recruit an independent pilot sample before conducting the main experiment.
- Obtain seven-point ratings of perceived social presence, product visual prominence, attractiveness, realism, and credibility for each stimulus.
- Analyze each pilot outcome using a 2 × 2 factorial model.
- Archive the exact stimuli, questionnaire items, descriptive statistics, inferential results, and analysis output.
3. Experimental setup and eye-tracker calibration
- Conduct each session individually in a quiet behavioral testing room.
- Keep indoor illumination and monitor settings constant across sessions, and eliminate direct sunlight and visible background movement.
- Record the room illuminance, monitor brightness, and audio level before beginning data collection.
- Mount the screen-based eye tracker centrally below a 24-in, 16:9 monitor.
- Seat the participant 60–65 cm from the display.
- Align the center of the screen with the participant’s natural line of sight and adjust the chair to ensure that all interface regions are visible without large head movements.
- Use the monitor’s native resolution with fixed refresh-rate and display-scaling settings.
- Record the resolution, refresh rate, and display-scaling settings in the session specification.
- Record binocular eye-movement data using a screen-based eye tracker at a sampling rate of 120 Hz with compatible eye-tracking experiment software.
- Present the assigned 90 s video in full-screen mode from the same eye-tracking software project.
- Disable notifications, screen savers, automatic updates, and other screen overlays before stimulus presentation.
- Use the same computer, display, audio output, and software build for all sessions.
- Perform a nine-point calibration for each participant before stimulus exposure.
- Accept the calibration only if both eyes are detected, and the mean calibration error is ≤0.5° of visual angle.
- Perform a brief validation or gaze replay to verify alignment between the recorded gaze and known screen targets.
- Save the calibration result using the participant’s study identifier.
NOTE: The available study record identifies the eye-tracker model, 120-Hz setting, and 24-in 16:9 monitor class, but it does not retain the exact eye-tracking software build, monitor model, display resolution and refresh rate, operating system, or computer model. If the initial calibration fails, reposition the participant and repeat the calibration once. If the repeated calibration fails, allow the participant to complete the questionnaire and simulated purchase task, but exclude the participant from the eye-tracking analysis set.
4. Experimental procedure and simulated purchase task
- Instruct the participant to watch the live-streaming video naturally, as if deciding whether to buy the displayed product. Prevent the participant from pausing, replaying, or skipping the 90 s stimulus.
- Record gaze data continuously throughout the video exposure.
- Immediately following the video, administer the post-exposure questionnaire assessing perceived social presence, flow experience, positive emotion, urge to buy impulsively, and purchase intention. Present all items using the same seven-point Likert-type response scale and score each construct as the mean of its corresponding items (Table 4 and Supplementary Table 1).
- Present the questionnaire items in the order specified in Supplementary Table 115,16,17,18,19,20 and record one response for each item. Do not reverse-code any items.
- Present the simulated purchase-decision screen immediately after completion of the questionnaire.
- Display standardized task instructions stating that the decision is hypothetical and involves no real payment, product delivery, or personal financial consequence. Use the identical instruction text and interface layout for all four experimental conditions (Supplementary Figure 1).
- Present two response options labeled “purchase now” and “do not purchase” on the purchase-decision screen and instruct the participant to select one option. Keep the position, size, wording, and visual formatting of both response options identical across experimental conditions.
- For participants who select “purchase now,” present the willingness-to-pay entry interface and instruct them to indicate the amount they would be willing to pay within the displayed price range. Record the entered amount in RMB.
NOTE: Treat the amount entered by participants who select “purchase now” as stated willingness-to-pay. For the whole-sample basket-value analysis, use the stated willingness-to-pay for simulated buyers and 0 RMB for nonbuyers. Restrict the buyer-only basket-value analysis to participants who select “purchase now.” These measures represent simulated outcomes rather than actual expenditure.- Display the same price range and use the same response-entry format for all participants.
- For the whole-sample basket-value analysis, assign a value of 0 RMB to participants who select “do not purchase.”
- Automatically record decision time, in seconds, from the onset of the purchase-decision screen to the participant’s click on either “purchase now” or “do not purchase.”
- Classify decision times <3 s or >120 s as invalid.
- Conclude the session by debriefing the participant about the experimental manipulation and the purpose of the simulated purchase task.
5. Eye-tracking data processing and AOI mapping
- Define four AOIs using a uniform coordinate system across all videos before extracting gaze data.
- Define the product AOI as the product image and demonstration region.
- Define the streamer AOI as the streamer’s face and upper body.
- Define the chat AOI as the region containing viewer comments and prompts.
- Define the price AOI as the region containing price and discount labels.
- Apply rectangular static AOIs to interface regions that remain fixed throughout the stimulus.
- Create dynamic AOIs for moving product or streamer regions.
- Place keyframes at the appearance and disappearance of each dynamic AOI and whenever its position, size, or direction changes.
- Interpolate AOI boundaries between adjacent keyframes using the eye-tracking software.
- Inspect each interpolated segment and adjust the AOI boundaries to follow the visible object closely.
- Avoid contact or overlap between AOIs whenever possible.
- Resolve occlusions and unavoidable overlaps according to a prespecified AOI-priority rule.
- Have a second trained coder audit a random subset of the frame-level AOI mappings and document all corrections.
- Identify fixations using a velocity-based fixation filter21. Set the velocity threshold at 30°/s and the minimum fixation duration at 60 ms.
- Linearly interpolate gaps <75 ms when the gaze positions immediately before and after the gap fall within the same AOI.
- Discard gaze samples recorded outside the monitor area or during blinks.
- Extract total fixation duration, in milliseconds, for the product, streamer, chat, and price AOIs.
- Extract the time to first product fixation, in seconds.
- Record the visible duration and frame-level area, in pixels, of each dynamic AOI when supported by the software.
NOTE: Total fixation duration is an unnormalized measure of visual allocation. When AOI area or exposure duration differs between conditions, differences in fixation duration should not be interpreted solely as differences in attentional preference.
6. Data quality screening and statistical analysis
- Calculate the tracking ratio as the proportion of valid gaze samples across the entire 90 s stimulus period. Include eye-tracking data in the final gaze-analysis set only if the tracking ratio is at least 0.80 and the recording file is complete.
- Screen extreme gaze values before hypothesis testing.
- Compare AOI fixation durations above the 99th percentile or below the 1st percentile with the corresponding session logs.
- Retain these observations only when the session log indicates no recording error or protocol noncompliance.
- Exclude participants from the full behavioral analysis set if they exhibit straight-line responding across all post-exposure questionnaire items or fail to complete the behavioral outcome task.
- Calculate Cronbach’s alpha for each multi-item construct using statistical analysis software.
- Calculate composite reliability, average variance extracted (AVE), and heterotrait-monotrait (HTMT) ratios in R using a confirmatory measurement-model workflow.
- Document the R package and version, estimator, item coding, missing-data rule, and exact function calls when these details are available from the original analysis record.
- Calculate each valid scale score as the mean of its corresponding items.
- Use a two-sided α level of 0.05 for all hypothesis tests.
- Report exact p-values, 95% confidence intervals, and partial eta squared for factorial effects.
- Compare continuous baseline variables using one-way ANOVA and categorical baseline variables using chi-square tests.
- Fit two-way ANOVA models using statistical analysis software, with social presence, product visual salience, and their interaction specified as fixed factors.
- Inspect model residuals and variance assumptions.
- Document any sensitivity analyses performed in response to assumption violations.
- Analyze simulated purchase choice using hierarchical binary logistic regression in statistical analysis software.
- Enter social presence, product visual salience, and their interaction in Model 1.
- Add product, streamer, chat, and price AOI fixation durations in Model 2.
- Add flow experience, positive emotion, and urge to buy impulsively in Model 3.
- Add age, gender, monthly income band, live-shopping frequency, and trait impulsivity in Model 4.
- Use low social presence and low product visual salience as the experimental reference condition and specify the reference category for each categorical covariate.
- Report odds ratios with 95% confidence intervals.
- Estimate the prespecified indirect associations in R using 5,000 nonparametric bootstrap resamples.
- Include the covariate set specified for the fully adjusted model.
- Set and record a random seed before running the bootstrap analysis.
- Document the R package and version, mediator and outcome equations, bootstrap confidence-interval method, effect scale for the binary outcome, random seed, and missing-data handling procedure when these details are available from the original analysis record.
NOTE: The archived study materials do not include the original R scripts or complete software output for the reliability/validity or bootstrap analyses. Although these analyses were conducted in R, the specific R package names and versions, function calls, and other software-level settings cannot be reliably recovered from the available summary tables. For the bootstrap analysis, the original random seed and confidence-interval algorithm are likewise unavailable. These details should therefore not be inferred retrospectively and should be preserved prospectively when reproducing the protocol.
結果
Participant characteristics and data retention
A total of 240 young adult participants were randomized equally into four experimental conditions (n = 60 per condition). All 240 participants completed the 90 s live-streaming stimulus exposure, the post-exposure questionnaire, and the simulated purchase task without withdrawal or recording failure. Consequently, the full behavioral analysis set comprised 240 participants. Furthermore, all participants met the predefined eye-tracking quality criteria, maintaining an overall tracking ratio of approximately 0.91 (range: 0.80–0.99) with successful calibrations (Figure 2). Decision times ranged from 16.0 to 71.8 s, remaining well within the predefined validity thresholds of 3 to 120 s. Thus, the eye-tracking analysis set was identical to the full behavioral analysis set.
The experimental groups were balanced by design. Gender distribution, monthly income band, live-shopping frequency, trait impulsivity, and tracking ratio demonstrated no significant between-group differences (Table 5). Although age exhibited a minor but statistically significant difference—the low-social-presence and low-product-salience group was slightly older than the high-social-presence group—the primary randomized group comparisons remained robust. Age was integrated as a covariate in adjusted models, and the direction and interpretation of the principal findings remained unchanged.
Manipulation checks and visual attention allocation
The social presence manipulation successfully altered participant perceptions. Participants in the high-social-presence conditions reported significantly higher perceived social presence (M = 4.47) compared to those in the low-social-presence conditions (M = 3.60), yielding a significant main effect (F(1, 236) = 75.78, p < 0.001, η2p = 0.243). Product visual salience exerted no significant effect on perceived social presence.
Similarly, the product salience manipulation was effective. The high-product-salience conditions elicited longer product area of interest (AOI) fixation durations (M = 15,092 ms) than the low-product-salience conditions (M = 12,942 ms; F(1, 236) = 40.80, p < 0.001, η2p = 0.147). Time to first product fixation was also markedly shorter under high product salience (M = 4.91 s) versus low product salience (M = 6.44 s; F(1, 236) = 56.02, p < 0.001, η2p = 0.192).
Visual attention metrics mapped directly onto the specific manipulations (Table 3). Product visual salience primarily drove attention toward the product and price regions. Conversely, social presence predominantly captured attention toward the streamer and chat regions (Figure 3). Specifically, social presence significantly increased streamer AOI fixation duration (F(1, 236) = 36.01, p < 0.001, η2p = 0.132) and chat AOI fixation duration (F(1, 236) = 50.26, p < 0.001, η2p = 0.176). Interaction effects between the two experimental factors across all AOI outcomes were not statistically significant, indicating additive attentional dynamics.
Psychometric validation and psychological mechanisms
All multi-item psychological constructs demonstrated acceptable reported reliability and validity parameters (Table 6). Cronbach’s alpha values ranged from 0.699 to 0.839, composite reliability ranged from 0.835 to 0.894, and average variance extracted (AVE) ranged from 0.608 to 0.688. The maximum reported heterotrait-monotrait (HTMT) ratio was 0.446, below the prespecified 0.85 threshold. Purchase intention had a marginal Cronbach’s alpha of 0.699 but acceptable reported composite reliability (0.835) and AVE (0.627).
Examining the organismic mechanism variables, social presence significantly elevated flow experience (F(1, 236) = 19.06, p < 0.001, η2p = 0.075), positive emotion (F(1, 236) = 7.88, p = 0.005, η2p = 0.032), and the urge to buy impulsively (F(1, 236) = 7.40, p = 0.007, η2p = 0.030). In contrast, purchase intention was more responsive to product visual salience (F(1, 236) = 6.21, p = 0.013, η2p = 0.026) than to social presence (Figure 4).
Behavioral decision outcomes and mediation pathways
Across the sample, 181 participants (75.4%) selected “purchase now” in the simulated task. The simulated purchase-choice rate was 83.3% in the high-social-presence, high-product-salience condition and 68.3% in the low-social-presence, low-product-salience condition (Figure 5).
Hierarchical logistic regression indicated that the experimental factors and AOI fixation durations alone had limited ability to account for simulated purchase choice (Table 7). Model fit improved after the post-exposure psychological states were added. In the fully adjusted model (Model 4), higher urge to buy impulsively (odds ratio [OR] = 2.36, 95% confidence interval [CI] = 1.44–3.87, p < 0.001) and higher flow experience (OR = 1.91, 95% CI = 1.19–3.07, p = 0.008) were associated with greater odds of selecting “purchase now.”
Bootstrap models indicated nonzero indirect associations for several prespecified paths (Table 8; Figure 6). Social presence showed a modeled serial indirect association with simulated purchase choice involving flow experience and urge to buy impulsively (indirect effect = 0.013, 95% CI = 0.004–0.027), with a smaller modeled path involving positive emotion and urge. Product visual salience showed a modeled indirect association with stated purchase intention via product fixation duration (indirect effect = 0.116, 95% CI = 0.024–0.232). Figure 6 provides a visual summary of these modeled associations within the broader experimental framework, distinguishing comparatively stronger supported associations from weaker or non-significant ones without implying temporal ordering or causality. Because flow, positive emotion, and urge were measured concurrently after exposure, these indirect associations should not be interpreted as evidence of temporal ordering or causal mediation.
Among secondary simulated outcomes, whole-sample basket value was highest (101.10 RMB) in the high-social-presence, high-product-salience condition. Product visual salience showed a small main effect on stated whole-sample basket value (F(1, 236) = 4.08, p = 0.044, η2p = 0.017). In the buyer-only analysis, this difference was not statistically significant (p = 0.107), suggesting that the whole-sample pattern reflected purchase-choice frequency more than stated spending intensity among simulated buyers. High-social-presence conditions also had shorter decision times (F(1, 236) = 7.40, p = 0.007, η2p = 0.030). The overall pattern was consistent with visual cues being related to visual allocation and social cues being related to post-exposure psychological states; it does not demonstrate a causal chain to real-world purchasing (Tables 5–8).
The data supporting the findings of this study are available in the Zenodo repository at https://zenodo.org/records/20339401.
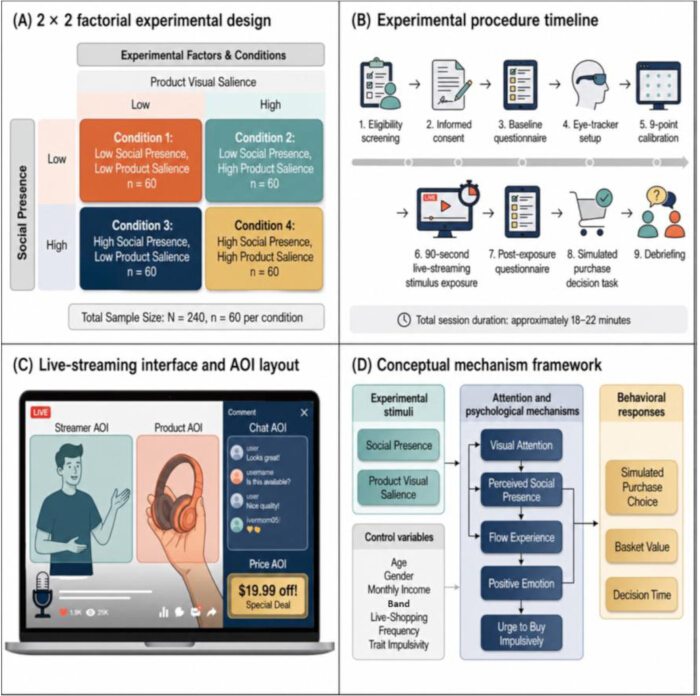
Figure 1: Experimental design, procedure, AOI layout, and conceptual framework. (A) The study used a 2 × 2 between-subjects behavioral experiment with two manipulated factors: social presence, low versus high, and product visual salience, low versus high. A total of 240 participants were allocated equally across four conditions, with 60 participants in each condition. (B) Each participant completed a single laboratory session consisting of eligibility screening, informed consent, baseline questionnaire, eye-tracker setup, nine-point calibration, 90 s live-streaming stimulus exposure, post-exposure questionnaire, simulated purchase decision task, and debriefing. The full session lasted approximately 18–22 min. (C) Four predefined areas of interest were used for eye-tracking analysis: product AOI, streamer AOI, chat AOI, and price AOI. Fixation duration and time to first product fixation were extracted from the 90 s stimulus period. (D) The conceptual framework links live-streaming stimuli to visual attention and post-exposure psychological variables, including perceived social presence, flow experience, positive emotion, and urge to buy impulsively, which are modeled in relation to simulated purchase choice, stated basket value, and decision time. Age, gender, monthly income band, live-shopping frequency, and trait impulsivity were included as covariates. Abbreviation: AOI, area of interest. Please click here to view a larger version of this figure.
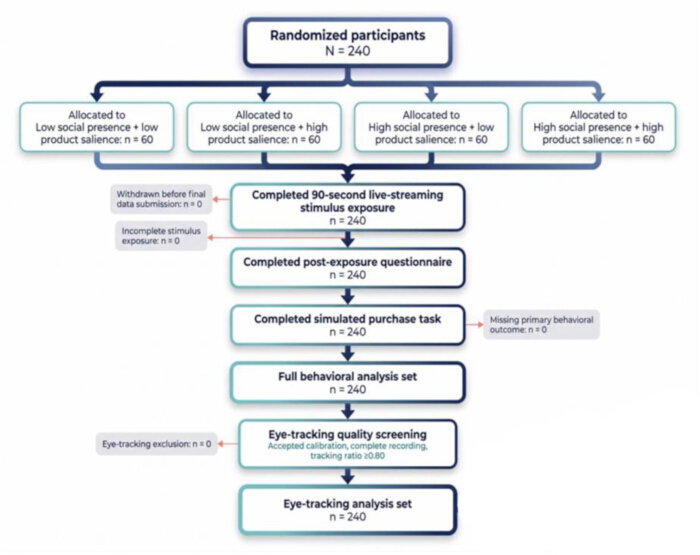
Figure 2: Participant flow and data-retention structure. A total of 240 participants were randomized equally into four experimental conditions, with 60 participants in each condition. All participants completed the 90 s live-streaming stimulus exposure, post-exposure questionnaire, and simulated purchase task. No participant withdrew before final data submission, and no participant was excluded because of incomplete behavioral data. All eye-tracking recordings met the predefined quality criteria, including accepted calibration, a complete 90 s recording, and a tracking ratio ≥0.80. Therefore, both the full behavioral analysis set and the eye-tracking analysis set included 240 participants. Please click here to view a larger version of this figure.
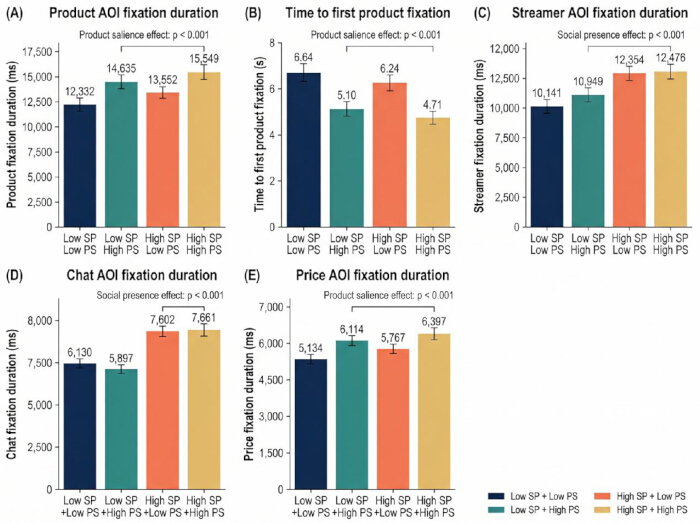
Figure 3: Visual attention outcomes across predefined AOIs. (A) Product AOI fixation duration was higher in the high-product-salience conditions, with the highest mean value observed in the high-social-presence and high-product-salience condition. (B) Time to first product fixation was shorter in the high-product-salience conditions, indicating earlier attentional orienting to the product region. (C) Streamer AOI fixation duration was higher in the high-social-presence conditions. (D) Chat AOI fixation duration also increased under high social presence. (E) Price AOI fixation duration was higher under high product salience and showed a smaller increase under high social presence. Error bars represent the standard error of the mean (SEM). Abbreviation: AOI = area of interest. Please click here to view a larger version of this figure.
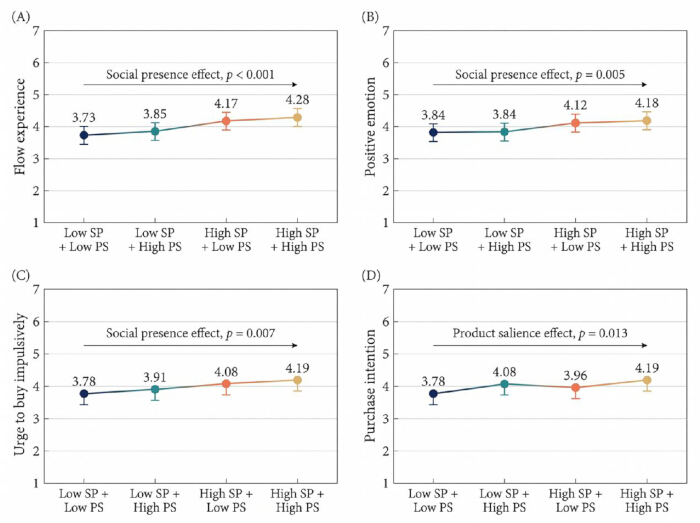
Figure 4: Post-exposure psychological outcomes by experimental condition. (A) Flow experience was higher under high social presence than under low social presence. (B) Positive emotion showed a similar but weaker increase under high social presence. (C) The urge to buy impulsively was higher in the high-social-presence conditions. (D) Purchase intention was higher in the high-product-salience conditions. Error bars represent the standard error of the mean (SEM). Abbreviations: SP = social presence; PS = product salience. Please click here to view a larger version of this figure.
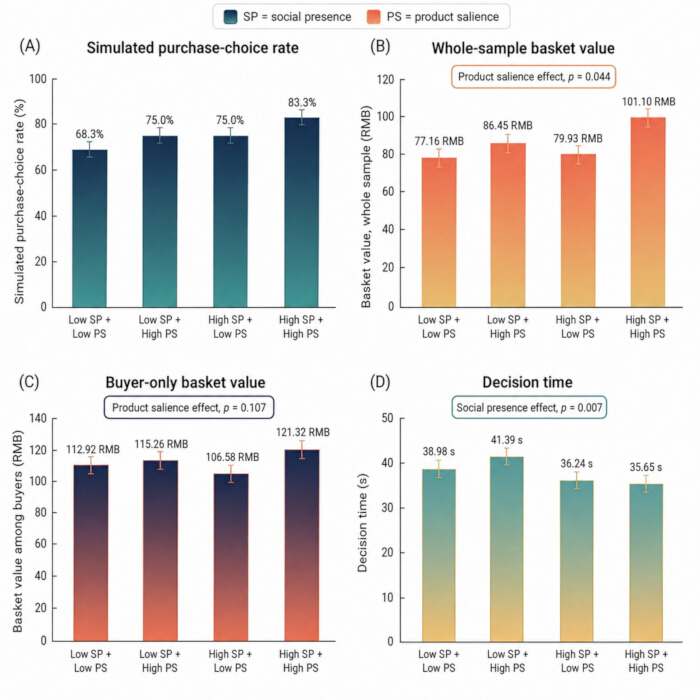
Figure 5: Behavioral outcomes by experimental condition. (A) The simulated purchase-choice rate was highest in the high-social-presence and high-product-salience condition and lowest in the low-social-presence and low-product-salience condition. (B) Whole-sample basket value was highest in the high-social-presence and high-product-salience condition. (C) Buyer-only basket value showed a weaker between-condition difference, indicating that the whole-sample basket-value pattern was mainly driven by purchase likelihood rather than spending intensity among buyers. (D) Decision time was shorter in the high-social-presence conditions. Error bars represent the standard error of the mean (SEM) for continuous outcomes. Abbreviations: SP = social presence; PS = product salience; RMB = Chinese yuan. Please click here to view a larger version of this figure.
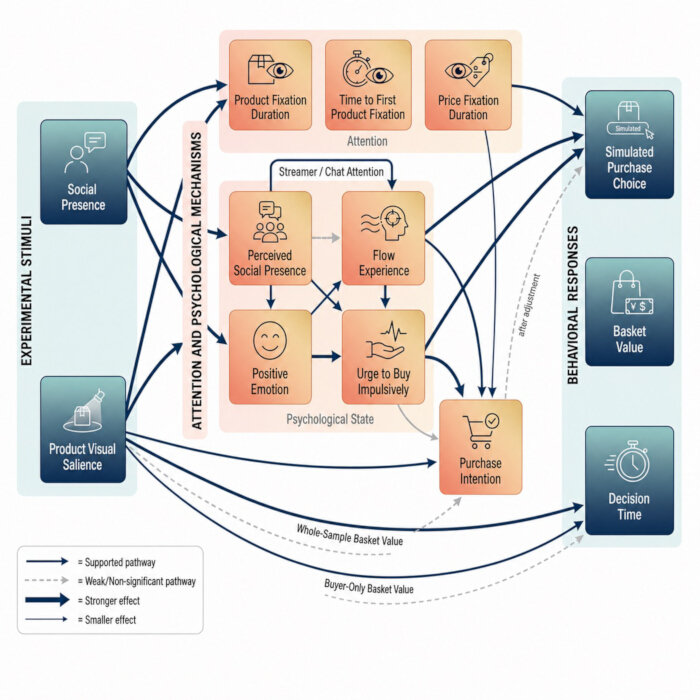
Figure 6: Summary of modeled associations linking experimental stimuli, attentional and psychological variables, and behavioral responses. Solid arrows indicate statistically supported modeled associations, whereas dashed arrows indicate weaker or non-significant associations. Thicker arrows denote comparatively stronger effects, and thinner arrows denote smaller effects. The diagram summarizes the associations reported in the statistical models and is not intended to imply temporal ordering or causal relationships. In particular, flow experience, positive emotion, and urge to buy impulsively were measured concurrently after stimulus exposure; therefore, pathways involving these variables should be interpreted as modeled indirect associations rather than evidence of temporal or causal mediation. Please click here to view a larger version of this figure.
| Item | Operational Specification |
| Study design | 2 × 2 between-subjects behavioral experiment |
| Manipulated factor 1 | Social presence: low vs high |
| Manipulated factor 2 | Product visual salience: low vs high |
| Number of experimental conditions | Four |
| Planned total sample size | 240 participants |
| Sample-size rationale | Balanced 1:1:1:1 allocation. For a 1-df factorial main effect or interaction with α = 0.05, total N = 240, and residual df = 236, a sensitivity calculation gives 80% power at Cohen’s f = 0.182 (partial η² ≈ 0.032). This is a sensitivity justification, not a claim of a documented a priori calculation. |
| Allocation ratio | 1:1:1:1 |
| Participants per condition | 60 participants per condition |
| Randomization method | Computer-generated blocked randomization |
| Block size | 8 |
| Allocation within each block | Each block contained two allocations to each of the four conditions |
| Allocation concealment | Allocation sequence stored in a password-protected spreadsheet and revealed only after eligibility and informed consent were documented and the participant arrived for the laboratory session |
| Participant blinding | Participants were not informed whether they received high or low social presence or high or low product visual salience |
| Stimulus exposure | Each participant viewed only one assigned 90-second video |
| Condition 1 | Low social presence + low product salience; n = 60 |
| Condition 2 | Low social presence + high product salience; n = 60 |
| Condition 3 | High social presence + low product salience; n = 60 |
| Condition 4 | High social presence + high product salience; n = 60 |
Table 1: Randomization and allocation structure. The four groups were balanced by design. Randomization was completed before data collection and was not modified after recruitment began.
| Experimental condition | Social presence level | Product visual salience level | Streamer interaction cues | Chat and audience cues | Product display and price visibility | Standardized elements |
| Condition 1: Low social presence + Low product salience | Low | Low | The streamer delivered the product information in a one-way explanatory style. No direct viewer address was used. No simulated response to audience comments was included. | No live chat messages, audience likes, viewer questions, or purchase notifications were displayed. | The product AOI occupied approximately 15–20% of the visible interface during product-demonstration segments. The price label remained visible for approximately 20 seconds. The product was shown in one brief close-up segment. | Same product category, same price, same promotional claim, same streamer, same script length, same 90-second duration, same background, same camera angle, and same purchase-task interface. |
| Condition 2: Low social presence + High product salience | Low | High | The streamer delivered the product information in a one-way explanatory style. No direct viewer address was used. No simulated response to audience comments was included. | No live chat messages, audience likes, viewer questions, or purchase notifications were displayed. | The product AOI occupied approximately 30–35% of the visible interface during product-demonstration segments. The price label remained visible for at least 45 seconds. The product was shown in at least four close-up segments. | Same product category, same price, same promotional claim, same streamer, same script length, same 90-second duration, same background, same camera angle, and same purchase-task interface. |
| Condition 3: High social presence + Low product salience | High | Low | The streamer directly addressed viewers at least six times and responded to four simulated viewer comments. The verbal product information remained identical to the low-social-presence condition. | Eight real-time chat messages were displayed. Three audience-response cues were included, including viewer likes, question prompts, and simulated purchase notifications. | The product AOI occupied approximately 15–20% of the visible interface during product-demonstration segments. The price label remained visible for approximately 20 seconds. The product was shown in one brief close-up segment. | Same product category, same price, same promotional claim, same streamer, same script length, same 90-second duration, same background, same camera angle, and same purchase-task interface. |
| Condition 4: High social presence + High product salience | High | High | The streamer directly addressed viewers at least six times and responded to four simulated viewer comments. The verbal product information remained identical to the low-social-presence condition. | Eight real-time chat messages were displayed. Three audience-response cues were included, including viewer likes, question prompts, and simulated purchase notifications. | The product AOI occupied approximately 30–35% of the visible interface during product-demonstration segments. The price label remained visible for at least 45 seconds. The product was shown in at least four close-up segments. | Same product category, same price, same promotional claim, same streamer, same script length, same 90-second duration, same background, same camera angle, and same purchase-task interface. |
Table 2: Operational specification of the four live-streaming stimulus conditions. Product AOI refers to the screen region containing the displayed product and product-demonstration area. The four stimuli were designed to differ only in social-presence cues and product visual-salience cues. Product-related verbal information, price level, product category, streamer identity, video length, and purchase-task settings were held constant across conditions. Abbreviation: AOI = area of interest.
| Outcome | Low SP + Low PS (n = 60) | Low SP + High PS (n = 60) | High SP + Low PS (n = 60) | High SP + High PS (n = 60) | Main effect of SP | Main effect of PS | Interaction |
| Perceived social presence, mean ± SD | 3.67 ± 0.80 | 3.53 ± 0.74 | 4.47 ± 0.71 | 4.47 ± 0.84 | F = 75.78, p < 0.001, η²p = 0.243 | F = 0.46, p = 0.498, η²p = 0.002 | F = 0.54, p = 0.463, η²p = 0.002 |
| Product fixation duration, ms, mean ± SD | 12,332 ± 2,643 | 14,635 ± 2,626 | 13,552 ± 2,337 | 15,549 ± 2,825 | F = 10.04, p = 0.002, η²p = 0.041 | F = 40.80, p < 0.001, η²p = 0.147 | F = 0.21, p = 0.650, η²p = 0.001 |
| Time to first product fixation, s, mean ± SD | 6.64 ± 1.68 | 5.10 ± 1.54 | 6.24 ± 1.48 | 4.71 ± 1.66 | F = 3.64, p = 0.058, η²p = 0.015 | F = 56.02, p < 0.001, η²p = 0.192 | F = 0.001, p = 0.980, η²p < 0.001 |
| Streamer fixation duration, ms, mean ± SD | 10,141 ± 2,366 | 10,949 ± 2,556 | 12,354 ± 2,388 | 12,476 ± 2,351 | F = 36.01, p < 0.001, η²p = 0.132 | F = 2.23, p = 0.137, η²p = 0.009 | F = 1.21, p = 0.273, η²p = 0.005 |
| Chat fixation duration, ms, mean ± SD | 6,130 ± 1,878 | 5,897 ± 1,740 | 7,602 ± 1,654 | 7,661 ± 1,790 | F = 50.26, p < 0.001, η²p = 0.176 | F = 0.14, p = 0.704, η²p = 0.001 | F = 0.41, p = 0.522, η²p = 0.002 |
| Price fixation duration, ms, mean ± SD | 5,134 ± 1,249 | 6,114 ± 1,575 | 5,767 ± 1,335 | 6,397 ± 1,516 | F = 6.19, p = 0.014, η²p = 0.026 | F = 19.15, p < 0.001, η²p = 0.075 | F = 0.90, p = 0.343, η²p = 0.004 |
Table 3: Manipulation checks and AOI-level eye-tracking outcomes. Perceived social presence served as the social-presence manipulation check. Product fixation duration and time to first product fixation served as product-salience manipulation checks. Fixation durations are raw totals. Because product AOI area and visible duration differed by salience condition, between-condition differences combine visual allocation with exposure opportunity and are not exposure-normalized. Abbreviations: SP = social presence; PS = product salience; AOI = area of interest; η2p = partial eta squared.
| Variable Name | Construct Type | Description | Measurement Timing | Measurement Method | Calculation/Indicator | Role/Classification |
| Perceived social presence | Psychological construct | The participant’s perceived interpersonal connection, responsiveness, and social availability in the live-streaming environment | Immediately after video exposure | 4 items, 7-point Likert scale | Mean of SP1–SP4; higher scores indicate greater perceived social presence | Manipulation check and psychological mechanism |
| Flow experience | Psychological construct | The participant’s absorption, concentration, and immersive involvement while viewing the live stream | Immediately after video exposure | 4 items, 7-point Likert scale | Mean of FL1–FL4; higher scores indicate stronger flow experience | Mediator |
| Positive emotion | Psychological construct | The participant’s positive affective response after viewing the live stream | Immediately after video exposure | 3 items, 7-point Likert scale | Mean of PE1–PE3; higher scores indicate stronger positive emotion | Mediator |
| Urge to buy impulsively | Psychological construct | The immediate desire to buy the displayed product after watching the live stream | Immediately after video exposure | 4 items, 7-point Likert scale | Mean of UBI1–UBI4; higher scores indicate stronger impulse-buying urge | Proximal mediator |
| Purchase intention | Self-reported outcome | The participant’s stated likelihood, willingness, and intention to buy the product if available | Immediately after video exposure | 3 items, 7-point Likert scale | Mean of PI1–PI3; higher scores indicate stronger purchase intention | Secondary self-reported outcome |
| Product fixation duration | Eye-tracking variable | Raw total fixation duration within the product AOI during the 90-second stimulus | During video exposure | Eye-tracking recording | Milliseconds; summed valid fixations within product AOI; not normalized for AOI area or visible duration | Visual-allocation measure |
| Streamer fixation duration | Eye-tracking variable | Raw total fixation duration within the streamer AOI during the 90-second stimulus | During video exposure | Eye-tracking recording | Milliseconds; summed valid fixations within streamer AOI | Visual-allocation measure |
| Chat fixation duration | Eye-tracking variable | Raw total fixation duration within the chat AOI during the 90-second stimulus | During video exposure | Eye-tracking recording | Milliseconds; summed valid fixations within chat AOI | Visual-allocation measure |
| Price fixation duration | Eye-tracking variable | Raw total fixation duration within the price AOI during the 90-second stimulus | During video exposure | Eye-tracking recording | Milliseconds; summed valid fixations within price AOI | Visual-allocation measure |
| Time to first product fixation | Eye-tracking variable | Time from stimulus onset to the first valid fixation within the product AOI | During video exposure | Eye-tracking recording | Seconds; shorter values indicate earlier visual orienting to the product | Visual-orienting indicator |
| Tracking ratio | Eye-tracking quality variable | Proportion of valid gaze samples during the full 90-second stimulus | During video exposure | Eye-tracking recording | Valid gaze samples divided by total expected samples | Eye-tracking inclusion criterion |
| Valid eye data | Eye-tracking quality variable | Whether gaze data met the predefined quality threshold | After eye-tracking processing | Binary | 1 = tracking ratio ≥ 0.80 and complete recording; 0 = below threshold or incomplete recording | Defines gaze-analysis set |
| Simulated purchase choice | Behavioral task outcome | Whether the participant selected “purchase now” in the simulated task; no payment or product delivery occurred | Immediately after questionnaire | Binary simulated decision | 1 = purchase now; 0 = do not purchase | Primary simulated outcome |
| Simulated basket value / stated willingness-to-pay | Behavioral task outcome | Amount the participant stated they would be willing to pay after selecting “purchase now”; not actual expenditure | Immediately after questionnaire | Stated RMB amount | Stated RMB value; nonbuyers coded as 0 for whole-sample descriptive analysis | Secondary simulated outcome |
| Decision time | Behavioral task outcome | Time taken to make the simulated purchase choice | During purchase-decision task | System-recorded time | Seconds from decision-screen onset to final click | Secondary simulated outcome |
| Age | Demographic covariate | Participant age in years | Baseline questionnaire | Numeric | Years | Covariate and baseline-balance variable |
| Gender | Demographic covariate | Self-reported gender | Baseline questionnaire | Categorical | Female / male / other or prefer not to say | Covariate and baseline-balance variable |
| Monthly income band | Demographic covariate | Self-reported monthly disposable income category | Baseline questionnaire | Categorical | <3000, 3000–5999, 6000–9999, ≥10000 RMB | Covariate and baseline-balance variable |
| Live-shopping frequency | Behavioral covariate | Frequency of watching or participating in live-streaming shopping | Baseline questionnaire | Ordinal scale | 0 = rare or none; 1 = occasional; 2 = monthly; 3 = weekly; 4 = very frequent | Covariate |
| Trait impulsivity | Individual-difference covariate | Baseline tendency toward impulsive responses | Baseline questionnaire | 7-point scale | Higher scores indicate stronger trait impulsivity | Covariate |
Table 4: Operational definitions, measurement timing, scoring, and analysis roles of study variables. All Likert-type post-exposure constructs were scored as item means rather than summed scores to retain the original 1–7 response metric. Reverse-coded items were not used. Abbreviations: AOI = area of interest; RMB = Chinese yuan.
| Variable | Low SP + Low PS (n = 60) | Low SP + High PS (n = 60) | High SP + Low PS (n = 60) | High SP + High PS (n = 60) | Test Statistic | p Value |
| Age, years, mean ± SD | 25.92 ± 3.29 | 24.36 ± 3.91 | 23.04 ± 3.81 | 23.75 ± 4.39 | F = 6.02 | 0.001 |
| Gender, female, n (%) | 32 (53.3) | 31 (51.7) | 34 (56.7) | 26 (43.3) | χ² = 2.32 | 0.509 |
| Gender, male, n (%) | 28 (46.7) | 29 (48.3) | 26 (43.3) | 34 (56.7) | — | — |
| Monthly income <3000 RMB, n (%) | 20 (33.3) | 23 (38.3) | 23 (38.3) | 18 (30.0) | χ² = 8.22 | 0.512 |
| Monthly income 3000–5999 RMB, n (%) | 26 (43.3) | 21 (35.0) | 23 (38.3) | 29 (48.3) | — | — |
| Monthly income 6000–9999 RMB, n (%) | 11 (18.3) | 8 (13.3) | 12 (20.0) | 9 (15.0) | — | — |
| Monthly income ≥10000 RMB, n (%) | 3 (5.0) | 8 (13.3) | 2 (3.3) | 4 (6.7) | — | — |
| Live-shopping frequency, mean ± SD | 1.92 ± 1.27 | 1.92 ± 1.09 | 1.87 ± 1.29 | 1.72 ± 1.03 | F = 0.39 | 0.761 |
| Trait impulsivity, mean ± SD | 3.52 ± 0.78 | 3.45 ± 0.70 | 3.40 ± 0.70 | 3.59 ± 0.75 | F = 0.79 | 0.501 |
| Tracking ratio, mean ± SD | 0.908 ± 0.046 | 0.913 ± 0.037 | 0.914 ± 0.041 | 0.909 ± 0.036 | F = 0.32 | 0.812 |
Table 5: Baseline characteristics and randomization balance. Continuous variables were compared using one-way ANOVA. Categorical variables were compared using chi-square tests. Age differed significantly across conditions and was therefore retained in adjusted robustness models. Other baseline variables did not differ significantly across groups. Abbreviations: SP = social presence; PS = product salience; RMB = Chinese yuan.
| Construct | Items | Cronbach’s α | Composite reliability | AVE | Standardized loading range | Maximum HTMT with other constructs | Interpretation |
| Perceived social presence | 4 | 0.839 | 0.894 | 0.677 | 0.810–0.850 | 0.446 | Acceptable reliability and validity |
| Flow experience | 4 | 0.783 | 0.861 | 0.608 | 0.749–0.813 | 0.446 | Acceptable reliability and validity |
| Positive emotion | 3 | 0.77 | 0.869 | 0.688 | 0.814–0.852 | 0.34 | Acceptable reliability and validity |
| Urge to buy impulsively | 4 | 0.802 | 0.872 | 0.63 | 0.780–0.817 | 0.414 | Acceptable reliability and validity |
| Purchase intention | 3 | 0.699 | 0.835 | 0.627 | 0.765–0.812 | 0.363 | Marginal alpha but acceptable CR and AVE |
Table 6: Reliability, convergent validity, and discriminant validity of post-exposure constructs. Cronbach’s alpha and composite reliability values of 0.70 or higher were interpreted as acceptable. AVE values of 0.50 or higher supported convergent validity. HTMT values below 0.85 supported discriminant validity. Purchase intention had a Cronbach’s alpha marginally below 0.70, but it was retained because composite reliability, AVE, and item loading values were acceptable. Abbreviations: AVE = average variance extracted; HTMT = heterotrait-monotrait ratio.
| Predictor | Model 1 OR | p value | Model 2 OR | p value | Model 3 OR | p value | Model 4 OR | p value |
| (95% CI) | (95% CI) | (95% CI) | (95% CI) | |||||
| Social presence condition | 1.39 (0.63–3.09) | 0.419 | 1.22 (0.50–3.01) | 0.662 | 0.90 (0.34–2.41) | 0.834 | 0.85 (0.30–2.43) | 0.762 |
| Product salience condition | 1.39 (0.63–3.09) | 0.419 | 1.37 (0.58–3.27) | 0.473 | 1.76 (0.69–4.50) | 0.241 | 1.60 (0.60–4.29) | 0.35 |
| Social presence × product salience | 1.20 (0.36–3.98) | 0.767 | 1.18 (0.35–3.96) | 0.784 | 1.29 (0.36–4.68) | 0.697 | 1.43 (0.37–5.57) | 0.609 |
| Product fixation duration | — | — | 1.00 (1.00–1.00) | 0.925 | 1.00 (1.00–1.00) | 0.334 | 1.00 (1.00–1.00) | 0.343 |
| Streamer fixation duration | — | — | 1.00 (1.00–1.00) | 0.963 | 1.00 (1.00–1.00) | 0.815 | 1.00 (1.00–1.00) | 0.583 |
| Chat fixation duration | — | — | 1.00 (1.00–1.00) | 0.405 | 1.00 (1.00–1.00) | 0.716 | 1.00 (1.00–1.00) | 0.722 |
| Price fixation duration | — | — | 1.00 (1.00–1.00) | 0.894 | 1.00 (1.00–1.00) | 0.547 | 1.00 (1.00–1.00) | 0.641 |
| Flow experience | — | — | — | — | 1.93 (1.21–3.06) | 0.005 | 1.91 (1.19–3.07) | 0.008 |
| Positive emotion | — | — | — | — | 1.13 (0.77–1.67) | 0.524 | 1.17 (0.78–1.76) | 0.443 |
| Urge to buy impulsively | — | — | — | — | 2.05 (1.30–3.24) | 0.002 | 2.36 (1.44–3.87) | <0.001 |
| Age | — | — | — | — | — | — | 0.99 (0.90–1.08) | 0.779 |
| Male gender | — | — | — | — | — | — | 1.06 (0.55–2.06) | 0.852 |
| Live-shopping frequency | — | — | — | — | — | — | 0.78 (0.59–1.05) | 0.1 |
| Trait impulsivity | — | — | — | — | — | — | 0.86 (0.53–1.39) | 0.539 |
| Model log likelihood | −131.97 | −131.60 | −117.85 | −114.58 | ||||
| AIC | 271.95 | 279.19 | 257.7 | 265.17 | ||||
| Pseudo R² | 0.014 | 0.017 | 0.12 | 0.144 |
Table 7: Hierarchical logistic regression for simulated purchase choice. Model 1 included social presence, product salience, and their interaction. Model 2 added AOI fixation durations. Model 3 added flow experience, positive emotion, and the urge to buy impulsively. Model 4 further adjusted for age, gender, monthly income band, live-shopping frequency, and trait impulsivity. The monthly income band was included in Model 4, but is not displayed in the table to keep the table readable. AOI fixation durations were entered in milliseconds, so odds ratios round to 1.00 at two decimal places. Abbreviations: OR = odds ratio; CI = confidence interval; AIC = Akaike information criterion.
| Modeled Indirect Pathway | Estimated Indirect Effect | 95% Bootstrap CI | Associational Interpretation |
| Social presence → flow experience → urge to buy impulsively → simulated purchase choice | 0.013 | 0.004 to 0.027 | Reported 95% CI excluded 0; nonzero modeled association |
| Social presence → positive emotion → urge to buy impulsively → simulated purchase choice | 0.008 | 0.002 to 0.018 | Reported 95% CI excluded 0; smaller modeled association |
| Social presence → flow experience → simulated purchase choice | 0.037 | 0.007 to 0.074 | Reported 95% CI excluded 0; nonzero modeled association |
| Social presence → positive emotion → simulated purchase choice | 0.007 | −0.012 to 0.029 | Reported 95% CI included 0 |
| Product salience → product fixation duration → purchase intention | 0.116 | 0.024 to 0.232 | Reported 95% CI excluded 0; nonzero modeled association |
Table 8: Bootstrap analysis of modeled indirect associations. Indirect effects were estimated using 5,000 bootstrap resamples and were described as nonzero when the reported 95% bootstrap CI excluded zero. Effects involving simulated purchase choice are presented on the probability scale. Flow, positive emotion, and urge were measured concurrently after exposure; therefore, the serial paths are associational and do not establish temporal order or causal mediation. Abbreviation: CI = confidence interval.
Supplementary Figure 1: Simulated purchase-task interface and standardized participant instructions. (A) Task-instruction screen presented after completion of the live-streaming stimulus, informing participants that the task was hypothetical and involved no real payment, product delivery, or personal financial consequence. (B) Product-detail page used in the simulated shopping interface, showing the product image, product information, displayed price, and purchase option. (C) Purchase-decision screen, on which participants selected either “Purchase Now” or “Do Not Purchase.” (D) Willingness-to-pay entry screen, presented only to participants who selected “Purchase Now,” on which participants entered the amount they were willing to pay within the displayed price range. The same purchase-task structure, instruction format, and response procedure were applied across experimental conditions.Please click here to download this file.
Supplementary Table 1: Questionnaire items, response options, and scoring procedures used in the study. All post-exposure constructs were assessed immediately after the 90 s live-streaming stimulus. Construct scores were calculated as the arithmetic mean of the corresponding item responses, thereby retaining the original 1–7 response metric. No items were reverse-coded. Abbreviation: PSP = perceived social presence; FLOW = flow experience; PE = positive emotion; UBI = urge to buy impulsively; PI = purchase intention. Please click here to download this file.
ディスカッション
This protocol evaluated how social presence and product visual salience were associated with visual allocation, post-exposure psychological states, and simulated purchase choices in live-streaming e-commerce. Its main methodological contribution is the separation of momentary gaze measures from later self-reports and task responses. Prior impulse-buying research has relied heavily on cross-sectional questionnaires, which cannot show what participants viewed during the decision episode22,23. Combining a controlled 2 × 2 manipulation, continuous eye tracking, and a simulated transactional interface therefore links stimulus exposure with a subsequent choice under standardized laboratory conditions without equating that choice with a real-money purchase.
Several steps are critical for the successful implementation of this protocol. First, the four live-streaming stimuli should be standardized carefully so that product category, price, promotional information, streamer identity, background, camera angle, and verbal content remain constant except for the prespecified social-presence and product-salience manipulations. Second, eye-tracker calibration should be verified before stimulus presentation, with participant position and viewing distance adjusted when calibration quality is inadequate; if the initial calibration fails, reposition the participant and repeat calibration once. When gaze quality remains poor despite recalibration, retain the participant for the questionnaire and simulated purchase task, but exclude the eye-tracking record according to the predefined quality criteria, rather than attempting repeated recalibrations that may alter the standardized session procedure. Third, dynamic AOIs require particular attention because product and streamer locations may change during the stimulus. Keyframes should be placed whenever an AOI appears, disappears, or changes position or size, and interpolated segments should be inspected manually to minimize mapping errors. For frames containing occlusion or unavoidable AOI overlap, apply the same prespecified AOI-priority rule throughout the dataset and document any manual corrections. A second-coder audit of a subset of mappings can help identify systematic boundary errors before final gaze metrics are extracted. Maintaining consistent display settings, room illumination, stimulus presentation, and purchase-task formatting across sessions is also important for reducing avoidable procedural variability.
The results were consistent with a social-presence pattern involving greater attention to the streamer and chat AOIs and higher post-exposure flow, positive emotion, and urge scores. These variables were measured after exposure at the same stage, so their modeled indirect associations should not be interpreted as evidence of a temporal causal chain. The pattern is compatible with prior work relating social presence to reduced psychological distance and greater engagement24,25. High-social-presence conditions also showed shorter decision times, but this group difference does not establish that social presence bypassed deliberation.
Product visual salience was associated with earlier orienting and longer total fixation on the product and price AOIs. This pattern is consistent with evidence that interface visual design can guide gaze26. However, because the high-salience videos intentionally displayed a larger product AOI for longer, the total fixation duration combines viewer allocation with opportunity for exposure. The present data do not include a validated area-by-time normalized measure, so the gaze results should not be interpreted as pure attentional preference. In the reported models, product visibility was associated more clearly with stated purchase intention than with simulated purchase choice. The concurrent mediator measurements and observational model paths limit causal interpretation, and purchase intention should not be equated with actual spending27,28. For interface research, the protocol can be used to compare controlled combinations of visual and social cues. Larger product displays and longer price visibility may improve detection, while social features may coincide with greater engagement; however, the present simulated outcomes do not support prescriptive claims about sales optimization. Researchers should avoid overloading the interface and should prespecify how competing AOIs and overlapping cues will be handled29. The protocol can be adapted to other products or live-streaming interfaces, but any modification should preserve the factorial structure, keep nonmanipulated stimulus features constant across conditions, and apply identical eye-tracking, questionnaire, and purchase-task procedures across experimental groups.
This protocol has several limitations. The 90 s stimuli isolate specific cues but cannot reproduce the duration and unpredictability of real-life streaming sessions. The purchase task involved no payment, product delivery, or personal financial risk; it therefore measures simulated choice and stated willingness-to-pay, not actual purchasing. Future work should compare the simulated task with incentive-compatible or real-money decisions. The AOI manipulation also changed the product area and visible duration. Accordingly, raw fixation duration is partly exposure-dependent, and future studies should record frame-level AOI area and visibility and report exposure-normalized sensitivity analyses. Finally, the concurrent post-exposure measurement of flow, positive emotion, and urge prevents temporal ordering of the modeled indirect paths. Additional work could combine temporally separated measurements with pupillometry, electrodermal activity, or facial-expression measures to distinguish attention from affective valence30.
In conclusion, the protocol provides a structured way to combine stimulus control, eye tracking, psychometric measures, and a simulated decision task in live-streaming e-commerce research. The reported pattern was consistent with product salience being related primarily to visual allocation and purchase intention, whereas social-presence conditions were related to flow, urge, and simulated choice. These findings are associational within the specified models and should be interpreted in light of differential AOI exposure, concurrent mediator measurement, and the absence of real financial consequences.
開示事項
The authors have no conflicts of interest to disclose. During revision, the authors used OpenAI Codex, a large-language-model–based tool, for English-language editing, document organization, and preparation of tracked revision notes. The authors reviewed all AI-assisted revisions and remain responsible for the manuscript’s content. The tool was not used to generate or modify figure files or to replace the study’s reported empirical results.
謝辞
The authors thank the participants who volunteered for this behavioral experiment and the laboratory staff at Guangzhou College of Technology and Business for their technical assistance with the eye-tracking setup. This research was funded by the 2024 General Program of the Guangdong Philosophy and Social Sciences Planning Project, titled “Research on the Optimization of Rural Educational Resource Allocation in Guangdong through Educational Digitalization” (Grant No. GD24CJY44).
材料
| 名前 | 会社 | カタログ番号 | コメント |
|---|---|---|---|
| 24-inch 16:9 monitor | Dell Technologies | Not applicable | Full-screen presentation of the live-streaming e-commerce stimuli |
| IBM SPSS Statistics | IBM Corp. | Version 29.0, https://www.ibm.com/products/spss-statistics | Statistical analysis software; Descriptive statistics, baseline comparisons, two-way ANOVA, and hierarchical binary logistic regression |
| Live-streaming e-commerce stimuli | in house | Not applicable | Four 90-s videos; 2 × 2 factorial design; Manipulation of social presence (low/high) and product visual salience (low/high) |
| R | R Foundation for Statistical Computing | Version 4.4.1, https://www.r-project.org/ | Statistical computing environment; Reliability/validity analyses and bootstrap analysis of modeled indirect associations |
| Simulated purchase-decision interface | in house | Not applicable | Recording simulated purchase choice, stated willingness-to-pay / basket value, and decision time |
| Tobii Pro Fusion | Tobii | https://www.tobii.com/products/eye-trackers/screen-based/tobii-pro-fusion | Screen-based eye tracker, 120-Hz configuration; Binocular screen-based eye-movement recording during the 90-s live-streaming stimulus |
| Tobii Pro Lab | Tobii | https://www.tobii.com/products/software/behavior-research-software/tobii-pro-lab | Eye-tracker calibration, stimulus presentation, AOI definition, gaze recording, and fixation-data extraction |
参考文献
- Li Y, García-de-Frutos N, Ortega-Egea JM. Impulse buying in live streaming e-commerce: A systematic literature review and future research agenda. Comput Hum Behav Rep. 2025;19:100676.
- Luo X, Lim WM, Cheah JH, Lim XJ, Dwivedi YK. Live streaming commerce: A review and research agenda. J Comput Inf Syst. 2025;65(3):376–399.
- Lee CH, Chen CW. Impulse buying behaviors in live streaming commerce based on the stimulus-organism-response framework. Information. 2021;12(6):241.
- Ming J, Zeng J, Bilal M, Akram U, Fan M. How social presence influences impulse buying behavior in live streaming commerce? The role of S-O-R theory. Int J Web Inf Syst. 2021;17(4):300–320.
- Zhang X, Cheng X, Huang X. “Oh, my God, buy it!” Investigating impulse buying behavior in live streaming commerce. Int J Hum Comput Interact. 2023;39(12):2436–2449.
- Feng Z, Al Mamun A, Masukujjaman M, Wu M, Yang Q. Impulse buying behavior during livestreaming: Moderating effects of scarcity persuasion and price perception. Heliyon. 2024;10(7):e28347.
- Fei M, Tan H, Peng X, Wang Q, Wang L. Promoting or attenuating? An eye-tracking study on the role of social cues in e-commerce livestreaming. Decis Support Syst. 2021;142:113466.
- Ji M, Liu Y, Chen X. An eye-tracking study on the role of attractiveness on consumers’ purchase intentions in e-commerce live streaming. Electron Commer Res. 2025;25(3):1485–1520.
- Shi R, Wang M, Qiao T, Shang J. The effects of live streamer’s facial attractiveness and product type on consumer purchase intention: An exploratory study with eye tracking technology. Behav Sci. 2024;14(5):375.
- Qu Y, Khan J, Su Y, Tong J, Zhao S. Impulse buying tendency in live-stream commerce: The role of viewing frequency and anticipated emotions influencing scarcity-induced purchase decision. J Retail Consum Serv. 2023;75:103534.
- Li X, Huang D, Dong G, Wang B. Why consumers have impulsive purchase behavior in live streaming: The role of the streamer. BMC Psychol. 2024;12:129.
- Luo X, Cheah JH, Hollebeek L, Lim XJ. Boosting customers’ impulsive buying tendency in live-streaming commerce: The role of customer engagement and deal proneness. J Retail Consum Serv. 2024;77:103644.
- Lee ZWY, Liu WZH, Chan TKH, Wei GGZ. Impulse buying in live streaming commerce: A literature review and research agenda. Inf Manage. 2025;62(8):104220.
- Mehrabian A, Russell JA. An approach to environmental psychology. MIT Press; Cambridge, MA; 1974.
- Gefen D, Straub DW. Consumer trust in B2C e-Commerce and the importance of social presence: experiments in e-products and e-services. Omega. 2004;32(6):407–424.
- Gunawardena CN, Zittle FJ. Social presence as a predictor of satisfaction within a computer-mediated conferencing environment. Am J Distance Educ. 1997;11(3):8–26.
- Koufaris M. Applying the technology acceptance model and flow theory to online consumer behavior. Inf Syst Res. 2002;13(2):205–223.
- Bagozzi RP, Gopinath M, Nyer PU. The role of emotions in marketing. J Acad Mark Sci. 1999;27(2):184–206.
- Beatty SE, Ferrell ME. Impulse buying: modeling its precursors. J Retail. 1998;74(2):169–191.
- Spears N, Singh SN. Measuring attitude toward the brand and purchase intentions. J Curr Issues Res Advert. 2004;26(2):53–66.
- Tobii Pro. Tobii Pro Lab Gaze Filter. 2023. Available from: https://connect.tobii.com/s/article/Gaze-Filter-functions-and-effects
- Wang Y, et al. How live streaming changes shopping decisions in e-commerce: A study of live streaming commerce. Comput Support Coop Work. 2022;31(4):701–729.
- Liu X, Zhang L, Chen Q. The effects of tourism e-commerce live streaming features on consumer purchase intention: The mediating roles of flow experience and trust. Front Psychol. 2022;13:995129.
- Wongkitrungrueng A, Assarut N. The role of live streaming in building consumer trust and engagement with social commerce sellers. J Bus Res. 2020;117:543–556.
- Hu M, Chaudhry SS. Enhancing consumer engagement in e-commerce live streaming via relational bonds. Internet Res. 2020;30(3):1019–1041.
- Tang X, Li X, Hao Z. The impact of live background visual complexity on consumer purchase intention: an eye-tracking study. Asia Pac J Mark Logist. 2024;36(10):2539–2557.
- Ma Y. To shop or not: Understanding Chinese consumers’ live-stream shopping intentions from the perspectives of uses and gratifications, perceived network size, perceptions of digital celebrities, and shopping orientations. Telemat Inform. 2021;59:101562.
- Xu X, Wu JH, Li Q. What drives consumer shopping behavior in live streaming commerce? J Electron Commer Res. 2020;21(3):144–167.
- Kang K, Lu J, Guo L, Li W. The dynamic effect of interactivity on customer engagement behavior through tie strength: Evidence from live streaming commerce platforms. Int J Inf Manage. 2021;56:102251.
- Sun Y, Shao X, Li X, Guo Y, Nie K. How live streaming influences purchase intentions in social commerce: An IT affordance perspective. Electron Commer Res Appl. 2019;37:100886.