インピーダンスベースのリアルタイムセルアナリシス(RTCA)アプローチにより、ウイルス誘発性の細胞病変効果をラベルフリーでリアルタイムに定量することが可能となり、統合されたソフトウェア駆動のアッセイワークフローを通じて、抗ウイルス化合物やモノクローナル抗体を迅速に評価する手法が提供されます。
この記事について
サマリー
要約
インピーダンスベースの技術は、従来のエンドポイント測定や視覚的に主観的なアッセイの限界を克服し、細胞培養モノレイヤーにおける細胞変性効果(CPE)を定量化するための堅牢かつ客観的な手段を提供します。細胞溶解性ウイルスは通常、感染した培養細胞に顕著な形態変化と細胞死を誘発するため、細胞の接着、形態、および生存率の変化を反映するインピーダンス測定は、ウイルス感染とその進行の感度が高くダイナミックな指標となります。その結果、インピーダンスベースの読み取り値は、抗ウイルス介入による保護効果を評価するための強力かつ効率的なアプローチを提供します。本研究では、高度なインピーダンス測定システムを利用してウイルス誘発性CPEを継続的にモニタリングする、リアルタイムでラベルフリーなスクリーニングプラットフォームを提示します。このアプローチにより、追加のラベル付けや染色ステップを行うことなく、低分子化合物およびモノクローナル抗体の両方に対する抗ウイルス効果を迅速かつ定量的に評価することが可能になります。本プロトコルでは、細胞播種およびウイルス感染から、データ収集および解析に至るまで、アッセイの完全なワークフローを詳細に説明します。さらに、ウイルス学への応用に特化したシステム統合ソフトウェアがデータ処理と解釈を効率化し、モノクローナル抗体の中和能および抗ウイルス化合物の活性の決定を容易にします。
概要
ウイルスのアウトブレイクという脅威に直面した際、ウイルスの伝播を制限し、感染した患者を治療するための主要な戦略となるのが、ワクチンと抗ウイルス治療薬である1。ワクチンは、免疫系に病原体を認識させることで感染を予防し、先制的かつ長期的な保護を提供する。抗ウイルス治療薬は、薬剤のモダリティや設計に応じてさまざまな用途がある。ワクチンと同様に、モノクローナル抗体は先制的な持続的保護(数週間から数ヶ月間)を提供することができ、曝露後の制御手段としても利用可能である。モノクローナル抗体と抗ウイルス低分子治療薬は、いずれもウイルス成分を直接的に標的とするか抑制することで、確定した感染症を治療し、疾患の重症度を軽減させる反応的な短期的介入として用いられる。
生物学的システムにおいて抗ウイルス活性を機能的に評価するための従来のアプローチは、ウイルス減少中和試験(VRNT)であり、プラーク減少中和試験(PRNT)におけるプラーク形成の減少や、フォーカス ~経由で 焦点減少中和試験(FRNT)における免疫染色、または細胞生存率ベースのアッセイを用いた細胞変性効果(CPE)です。PRNTは、広範囲のウイルス感染に対する抗ウイルス薬の抑制活性を決定するための、表現型解析におけるゴールドスタンダードな手法であると考えられています。2しかし、PRNTは時間と労力を要し、特に長期間のインキュベーション中にプラークの過剰増殖や融合が起こると、結果の判定に主観が入る可能性があります。FRNTを用いれば、ウイルス特異的抗原またはレポーター遺伝子の発現の検出に基づくため、アッセイ読み取りの客観性を向上させることができます。ただし、この手法は高品質な抗体や検出酵素の入手可能性および性能によって制限される場合があります。細胞生存率の評価、すなわちCPE(細胞変性効果)の特定の側面を測定するために、いくつかの試薬やアッセイプロトコルが確立され、広く利用されています。生細胞内のミトコンドリア脱水素酵素によるモノテトラゾリウム塩MTT比色試薬(3-(4,5-dimethylthiazol-2-yl)-2,5-diphenyl-2H-tetrazolium bromide)の酵素的還元により、有色のフォルマザン生成物が生じ、定量可能な比色信号が得られます。細胞生存率アッセイ試薬(細胞を溶解して細胞内ATPを遊離させ、それがルシフェラーゼ触媒反応を駆動して基質のルシフェリンをオキシルシフェリンに変換させる)は、均一系発光アッセイです。このような細胞生存率アッセイは、抗ウイルス剤のスクリーニングにおけるCPEの減少を定量化するために利用できます。3しかし、これらの手法は複数回の洗浄および染色工程を必要とし、PRNTやFRNTアッセイと同様にエンドポイントアッセイである。その結果、ウイルス感染に対して遅延的な効果を及ぼす部分的に有効な抗ウイルス剤は、抗ウイルスアッセイを不適切な時点(サブオプティマルな時点)で終了させた場合に、見落とされる可能性がある。したがって、ウイルス感染に対する細胞応答をリアルタイムでモニタリングできる、自動化された中・高スループットアッセイへの強いニーズがある。
リアルタイムセルアナリシス(RTCA)システムは、ラベルフリーで非侵襲的なインピーダンスベースの読み取りを通じて、許容性細胞モデルにおけるCPEの進行および抗ウイルス応答の連続的なモニタリングを可能にします。ウイルス誘発性のCPEには、細胞死だけでなく、細胞形態や接着性の変化も含まれ、これらはすべて電気インピーダンスの変化によって感度良く検出できます4,5。これらのインピーダンス測定は、専用の96ウェル細胞培養プレートに組み込まれた金マイクロ電極センサーを用いて行われ、ラベルやレポーター遺伝子の発現を必要とせずに、動的な細胞応答を定量的に評価することが可能です。RTCA技術は、複数の科のウイルスに感染した様々な細胞モデルにおけるCPE検出や、抗体の中和活性の評価において広く報告されています6–10。
ここでは、このリアルタイムかつラベルフリーのインピーダンスベースの in vitro 抗ウイルスアッセイを定義した。このアプローチは、アデノウイルス5感染HEK293A細胞を用いた抗ウイルス化合物のスクリーニング、およびVero CCL-81細胞におけるラッサ糖タンパク質を発現する複製能を有する組換え水疱性口炎ウイルス(rVSV-LASV(Lin IV))を用いた中和抗体の評価に関する先行研究に基づいている。11これらの実験はすべて、最大6つまでの同時実行をサポートするRTCA MPシステムを用いて行われました。× 96ウェルプレートを用いて同時に実施できます。本研究の目的は、インピーダンスに基づく抗ウイルススクリーニングの基盤を確立することでした。本プロトコルを用いて最適なアッセイ条件を定義すれば、この手法を幅広いウイルス・細胞モデルに容易に拡張することが可能です。
プロトコル
The reagents and the equipment used are listed in the Table of Materials.
1. Permissive cell culturing and passaging
NOTE: In this protocol, Vero CCL-81 cells are used for antibody neutralization, whereas HEK293A cells are used for antiviral compound screening. To reduce variation across experiments, it is highly recommended to make a cell bank of permissive cells at the same passage for the assay.
- Prewarm the cell growth medium—Dulbecco’s Modified Eagle Medium (DMEM) supplemented with 10% fetal bovine serum (FBS) and 1% penicillin–streptomycin—in a 37°C water bath before use.
- Thaw a vial of cryopreserved permissive cells in a 37°C water bath until only a small piece of ice crystal remains; do not submerge the cap in the water bath.
- Place the vial containing revived cells into the biosafety cabinet (BSC) after wiping the exterior with 70% ethanol.
- Gently transfer the cells to a new 50 mL conical tube and dropwise add 9 mL of warm growth medium to the cells. Mix gently.
- Spin down the cell suspension at 200 × g for 5 min at room temperature (RT).
- Transfer the resuspended cells in 5 mL of prewarmed growth medium to a new T-25 flask.
- Grow cells to 80%–90% confluency in a 37°C incubator with 5% CO2 before the next cell subculture.
- Passage the cells.
- Aspirate the medium and gently wash the cell monolayer twice with 3 mL of 1× calcium- and magnesium-free Phosphate-Buffered Saline (PBS) to remove residual growth medium.
- Add 2 mL of 0.25% trypsin-EDTA to the flask to cover the cells.
- After 2–5 min of incubation at 37°C, neutralize the trypsin by adding a 5-fold volume of prewarmed growth medium.
- Resuspend cells by gently pipetting the cell suspension up and down against the side of the flask.
- Seed the cells at the desired cell seeding density or split ratio with fresh medium.
NOTE: The desired cell seeding density is determined empirically by cell growth rate, passage frequency, and target confluency at the time of passaging. For example, seeding Vero CCL-81 cells at a minimum of 0.4 × 10⁴ cells/cm2 allows cells to be passaged every 3 days before they reach 90% confluency.
2. Antiviral agent screening
NOTE: Figure 1 illustrates the workflow of the impedance-based antiviral screening assay. Briefly, permissive cells are seeded into microelectrode-integrated 96-well microplates, and cell performance is monitored for approximately 24 h before the assay. For antibody neutralization tests, viruses at a fixed multiplicity of infection (MOI) are mixed with antibodies and preincubated for 1 h before being added to the cells. In contrast, for antiviral compound screening, viruses at a fixed MOI and compounds are added to the cells simultaneously. Virus-induced CPE is continuously monitored using impedance-based readouts, and data analysis can be performed either during the assay or after its completion.
- Day 0: Measure plate background and seed permissive cells
- To start an experiment, open the instrument software (RTCA Pro) and select the desired cradle for the assay. Next, choose the Virology module before initiating the experiment.
- Enter any relevant notes in the Exp Notes tab (e.g., Experiment Name, Device SN, Device Type, or other pertinent details). These fields are optional and may be left blank if not applicable.
- Navigate to the Layout tab and define the wells used in the experiment. If certain wells will not be used, select the unused wells, right-click within the plate layout interface, and select Turn Off Well(s) from the dropdown menu to exclude them from the assay.
- Measurement of the microelectrode-integrated 96-well microplate background
- Dispense 50 µL of assay medium to each well of the plate using a multichannel pipette in reverse pipetting mode to minimize bubble formation.
NOTE: The assay medium selection should be optimized before screening to minimize interference with assay sensitivity and to ensure accurate assessment of treatment efficacy. For example, antibody neutralization assays were performed in DMEM containing 2% FBS and 1% penicillin–streptomycin, whereas antiviral compound screening assays used cell growth medium, DMEM containing 10% FBS and 1% penicillin–streptomycin. - Place the plate into the instrument cradle located inside a 37 °C incubator with 5% CO2. Ensure that the plate is oriented correctly with well A1 positioned as indicated. Next, check the Message tab for any error notifications.
NOTE: Each time the plate is placed into the cradle, verify that the message ‘‘Plate scanned. Connections okay’’ is displayed. If an error occurs, remove the plate and reseat it in the cradle. - Navigate to the Schedule tab; Step 1 appears by default, as it is a required step for plate background measurement. Click on the Start button to initiate recording from the wells. The step automatically concludes after a single background impedance measurement has been recorded.
NOTE: This background step must be performed before each experiment. All wells used in the experiment should contain assay medium only (i.e., before cell seeding).
- Dispense 50 µL of assay medium to each well of the plate using a multichannel pipette in reverse pipetting mode to minimize bubble formation.
- Permissive cell seeding to the microelectrode-integrated 96-well plate
- Trypsinize the permissive cells in the T25 flask following the steps described in the permissive cell passaging section.
- Count the cells resuspended in the assay medium and perform the following calculations:
- Calculate the total number of viable cells in the suspension using the viable cell density: Total viable cells = viable cell density × suspension volume
- Adjust the cell suspension to a final density (e.g., 0.30–0.35 × 10⁶ cells/mL for Vero CCL-81, equivalent to approximately 15,000–18,000 cells per 50 µL, or 0.12 × 10⁶ cells/mL for HEK293A, equivalent to 6,000 cells per 50 µL).
NOTE: These seeding densities were previously determined to be optimal for each virus–cell model. Proper cell seeding density is essential, as using too many or too few cells could affect assay sensitivity.
- Remove the microplate containing 50 µL of assay medium from the instrument and transfer it to the BSC for cell seeding.
- Dispense 50 µL of the cell suspension to each well of the plate using a multichannel pipette in reverse pipetting mode to minimize bubble formation, bringing the final volume of each well to 100 µL.
- After cell addition, leave the plate in the BSC at RT for 30 min to allow even distribution of cells on the bottom of each well.
- Return the plate to the instrument cradle located inside a 37 °C incubator with 5% CO2.
NOTE: If multiple plates are used, label each plate clearly and ensure that it is returned to the same cradle used during the background measurement. - Navigate to the Layout tab and open the Cell subtab. Select the appropriate wells, enter the permissive cell Name and Number, and click on Apply to save the information. Cell information may also be entered into or updated at any point during the experiment.
- Add Step 2 on the Schedule tab using the default recording settings (100 sweeps and a 15‑min interval), then click on Start to initiate continuous overnight monitoring of cell attachment and proliferation.
NOTE: This step serves as a cell quality control (QC) measure before virus inoculation. As the Cell Index (CI) reflects cell attachment and proliferation, CI values obtained during the 18–24‑h post‑seeding period are used as a key QC metric. Reproducible cell behavior across experiments is essential for optimal assay reproducibility. Notably, both CI amplitude and kinetic profiles are cell‑type specific. For example, after overnight culture, healthy Vero CCL-81 cells seeded at 18,000 cells/well typically exhibit a Cell Index of 6–8, whereas healthy HEK293A cells seeded at 6,000 cells/well generally exhibit a Cell Index of 0.8–1.2.
- Day 1: Impedance-based antiviral agent screening
NOTE: Before conducting the screening assay, the virus should be appropriately titrated to determine the optimal working dilution. This step establishes a virus concentration that supports robust, reproducible assay performance while meeting user-defined requirements, such as the desired assay duration. For example, in the antibody neutralization protocol11, a multiplicity of infection (MOI) of 0.01 was chosen for the neutralization assay, as it produced complete (100%) CPE within 40 h post-inoculation. In the impedance-based assay, complete CPE is indicated by a reduction of the Cell Index or Normalized Cell Index to zero. During antiviral compound screening, an MOI of 1 was used, and 100% CPE was observed within 70 h post-inoculation. The viral titration protocol followed established procedures described in a prior report12. If infectious viruses are used in the assay, ensure all applicable safety precautions are followed. Refer to the safety guidance for infectious virus handling section.- Prepare the virus at the predetermined concentration and prepare serial dilutions of the antibody or antiviral compound in assay medium.
- For monoclonal antibody neutralization assays, mix 60 µL of virus at 4× the final assay concentration with 60 µL of antibody at 4× the final assay concentration and incubate at 37 °C for 1 h before addition to the permissive cells. Following mixing, the virus and antibody are present at 2× their final assay concentrations. In contrast, no virus–compound preincubation is required for antiviral compound screening assays.
- Navigate to the Layout tab and select the Treatment subtab to enter treatment information on antiviral agents in the appropriate wells.
- Select the wells for the same treatment, then enter the Name of the agents and enter the starting Dilution or Concentration. For example, if the starting concentration is 10 µg/mL, enter 10 and select µg/mL as the “Unit”. Enter 3 as the Dilution Factor and specify the Direction of dilution (e.g., Top to Bottom).
NOTE: After clicking on Apply, the antiviral agent concentrations or dilutions will be automatically calculated and saved based on the plate layout input and displayed in the corresponding wells. The calculated values are also saved for subsequent data analysis. Entering virus information (e.g., Name and Dilution) is optional, as the assay uses a single fixed MOI for all virus-treated wells. - Assign virus-only-treated wells as positive controls by selecting the appropriate wells and choosing Positive ctrl under Well Type.
- Assign uninfected wells as negative controls by following the step described above and checking Negative ctrl under Well Type.
NOTE: Correct assignment of virus-only and uninfected wells as Positive ctrl and Negative ctrl, respectively, using the Well Type setting is critical, as the CI values from these wells are used in all neutralization-related calculations (e.g., %Neutralization). For CPE-related calculations (e.g., %CPE), explicitly designated negative-control wells are required. For antibody neutralization assays, inclusion of both positive and negative control antibodies on the same plate is strongly recommended to ensure accurate data interpretation. However, these control antibodies should be designated as Samples under Well Type. - When the assay is ready for antiviral agent addition, press the Abort Current Step button to skip the remaining sweeps in Step 2 and proceed to the next step.
- Click on the Unlock Plate button, then remove the plate from the cradle and place it in the BSC.
- Gently dispense 100 µL of the virus–antibody mixture or virus–antiviral compound mixture into each well using a multichannel pipette, resulting in a final well volume of 200 µL. The inoculum contains virus and antibody or antiviral compound at 2× their final assay concentrations, which are diluted to the final working concentrations upon addition to the cells.
- After returning the plate to the cradle, navigate to the Schedule tab and add Step 3. Specify the number of Sweeps and the Interval between sweeps. Ensure that the total sweep duration (number of sweeps × interval) exceeds the expected treatment duration. Click on Start to resume data acquisition and continue the assay.
NOTE: Designating a separate step (e.g., Step 3) following antiviral agent addition facilitates easy identification of the post-treatment monitoring period. Always program each step (except Step 1) to run longer than the expected assay duration. If the programmed run time is reached, the instrument will stop acquiring measurements, resulting in missing data points.
- Day 1 and beyond: Data analysis
- To review the real-time recording and/or analysis of cellular responses during data acquisition, navigate to the Data Analysis tab, select a specific time point or time interval, and then select and add the wells to be included in the analysis for display on the plot chart.
- Select parameters from the Y-axis dropdown menu. When Normalized Cell Index (NCI) is selected, specify the Normalization Time, the time point immediately before treatment, from the time dropdown list. %CPE or %Neutralization can also be displayed by selecting the corresponding option from the Y-axis dropdown menu.
NOTE: The instrument uses a unitless parameter, Cell Index (CI), to represent impedance. The Normalized Cell Index (NCI) is recommended for evaluating treatment differences while minimizing the impact of inherent well‑to‑well variation. - Navigate to the Parameter section on the Data Analysis tab to calculate and generate different types of figures, such as a bar graph and 4-parameter logistic (4PL, variable slope) regression dose–response curves at a specific time point (e.g., at the midpoint or endpoint of the assay). Alternatively, the IC₅₀ derived from the area under the curve (AUC) of the Cell Index or Normalized Cell Index after treatment provides a measure of the overall dose–response of antiviral agents throughout the treatment period.
- At the end of the test, click on Pause, then press the Unlock Plate button. Remove the plate from the cradle and electronically Release it via the Plate menu.
3. Safety guidance for infectious virus handling
- Wear proper PPE through double gloving, a face shield, and a lab coat. This is strongly recommended for handling viruses.
- Handle the virus-containing materials and add to plates exclusively inside an operating BSC.
- Transport the virus vials and any plates containing viruses to and from the BSC inside a sealed biosafety carrier.
- Before and after handling virus-containing materials in the BSC, thoroughly spray all interior surfaces with a disinfectant and allow a 5 min contact time to ensure complete viral inactivation. Wipe the surfaces clean and then disinfect them with 70% ethanol to remove any residual disinfectant.
- Upon completion of the impedance-based antiviral screening assay, remove all plates from the instrument and transport them with a sealed biosafety carrier directly into a clean BSC.
- Prepare a fresh 20% bleach solution and add to every well on the assay plates. Allow the bleach to sit for 10 min before aspirating from all wells and disposing of the plates.
- Decontaminate all assay plates, serological pipettes, pipette tips, tubes, and other disposable plastics that may have come into contact with the virus with bleach, and dispose of them in designated biohazard waste bags.
- Spray non-disposable plastics, such as tube racks and pipettes with a disinfectant and wipe them.
結果
ラベルフリーのリアルタイム・インピーダンス読み出しにより、ウイルス誘発性のCPEおよび抗ウイルス保護が明らかになる
Figure 2Aに示すように、HEK293A宿主細胞を、1ウェルあたり6,000 cellsの密度でマイクロ電極統合96ウェルプレートに播種した13。24時間のインキュベーション後、抗ウイルス化合物の有無とともに、MOI 1でアデノウイルス5型を添加した。ウイルス感染および抗ウイルス治療に対する細胞応答を、リアルタイムのラベルフリー・インピーダンス測定を用いて継続的にモニタリングした。ウイルスが存在しない場合、細胞は80時間のモニタリング期間を通じて継続的に増殖し、インピーダンスの着実な増加に続いてプラトーに達したことで、コンフルエントに達したことが示された。アデノウイルス感染では、当初は約20時間まで細胞増殖が認められたが、その後顕著なCPEが観察され、感染後約65時間までにインピーダンス信号がベースラインまで急速に低下した。スタブジン(50 µM)またはリバビリン(20 µM)による処理は、ウイルス誘発性CPEへの影響が最小限であり、インピーダンス波形はウイルスのみに感染させた細胞と酷似していた。ガンシクロビル(50 µM)は、正規化細胞指数(Normalized Cell Index)の部分的な回復によって証明されるように、緩やかな抗ウイルス活性を示した。対照的に、シドフォビル(50 µM)およびブリンシドフォビル(1 µM)はCPEを著しく減弱させ、未感染の陰性対照細胞で観察されたものと同等のインピーダンスプロファイルを示した。特筆すべき点として、予備研究において、テストした濃度ではいずれの化合物も、溶媒処理した対照群と比較して細胞指数に有意な影響を及ぼさなかった(データは示していない)。
インピーダンスベースの抗体中和試験において、Vero CCL-81細胞をマイクロ電極統合96ウェルプレートに1ウェルあたり18,000細胞の密度で播種し、感染させるまで24時間培養した。試験当日、モノクローナル抗体をrVSV–LASVとMOI 0.01で1時間プリインキュベートした後、細胞に添加した。テストしたモノクローナル抗体(mAb)の間で、異なる中和プロファイルが観察された。分かりやすくするため、図2Bに、強力な、部分的な、または中和活性を示さない抗体の代表的な結果を示す。非中和抗体は完全なCPEを誘導し、インピーダンストレースはウイルス単独コントロールのものと重なった。中等度の中和活性を持つ抗体は、ウイルス誘導性の細胞毒性を部分的に軽減し、その結果、CPEは減少したが検出可能なレベルで認められた。対照的に、完全中和抗体はCPEを完全に抑制し、非感染細胞コントロールと同等のインピーダンス信号を維持した。以上のインピーダンスプロファイルにより、非中和、部分中和、および完全中和モノクローナル抗体を明確に区別することが可能となった。
抗ウイルス活性の定量化および特性解析
インピーダンスベースのRTCAアッセイを用いて薬剤およびmAbsのライブラリーから「ヒット」を同定できることが実証されたため、次にリード化合物および抗体の有効性を特性解析した。抗ウイルス薬であるbrincidofovirの濃度を15.6 nMから1,000 nMまで段階的に上げると、インピーダンス信号が段階的に上昇し、薬剤濃度が高いほど、細胞の状態が非感染コントロールに近づいた(Figure 3A)。さらに、brincidofovir単独での処理では、テストした最高濃度(1100 nM)においてのみNCIのわずかな上昇が見られた。しかし、1100 nM未満の濃度では、用量依存的ではないものの、NCIは緩やかに低下した。この結果は、Cell Indexの回復が、細胞増殖や接着の直接的な促進ではなく、薬剤の抗ウイルス活性のみに起因することを示している(Figure 3B)。正規化Cell Index(NCI)の曲線下面積(AUC)をbrincidofovir濃度の関数としてプロットすると、用量反応曲線が得られ、非常に良好な適合度(R2 = 0.99)を示し、IC50は265 nMであった(Figure 3C)。抗体中和アッセイでは、アッセイ終了時(処理後約50時間)に、システムソフトウェアが各mAb濃度における中和率を自動的に算出し、その後IC50値を導出した。Figure 3Dに示すように、ネガティブコントロール抗体であるrANDV-5とは対照的に、他の3つのmAb(r37.2D、r25.1C、r12.1F)は高い抗ウイルス能を示し、IC₅₀値はそれぞれ4,315 ng/mL、83 ng/mL、232 ng/mLであった14,15。
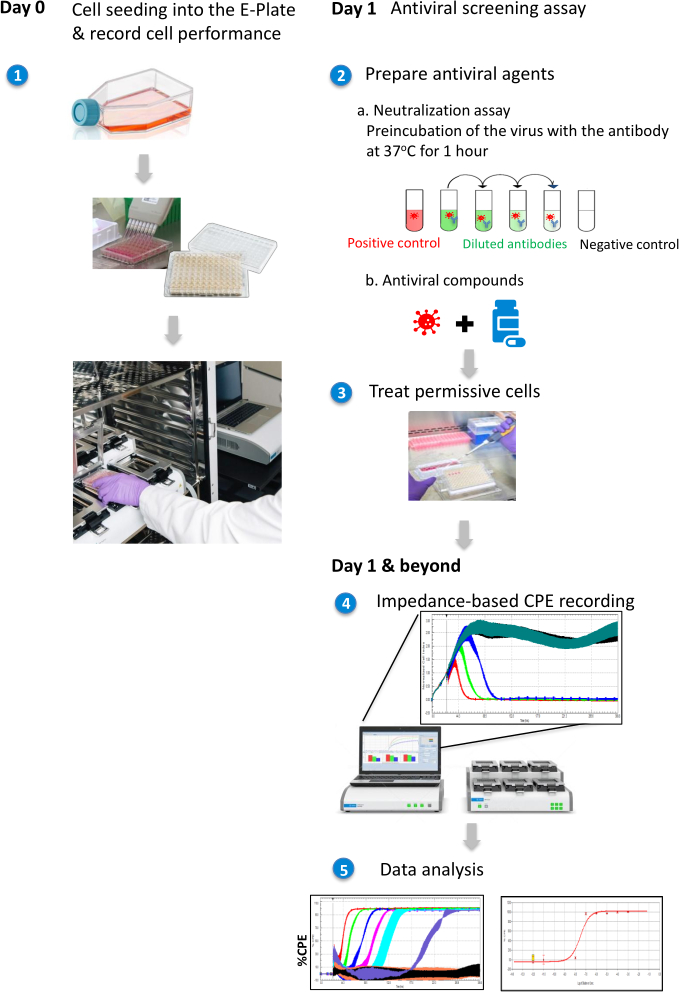
図1インピーダンスベースの抗ウイルススクリーニングアッセイのワークフローを示す概略図。 0日目 ステップ 1:許容細胞をマイクロプレートに播種し、装置のクレードル内にて細胞増殖をモニタリングした。 37 °C 5% $\text{CO}_2$ インキュベーター2 約24時間。1日目 ステップ2:ウイルスを一定のMOIで調製し、抗ウイルス剤を段階希釈した。抗体中和試験では、ウイルスを抗体と共に次のようにプレインキュベートした。 37 °C 混合物を細胞に添加する1時間前まで静置した。ステップ3:ウイルスと抗ウイルス剤の混合物を細胞に添加した。1日目以降、ステップ4:インピーダンス測定を用いて、ウイルス誘発性の細胞変性効果(CPE)を数日間にわたり継続的にモニタリングした。ステップ5:データをリアルタイムまたはアッセイ完了後に解析した。 こちらの図の拡大版を表示するには、ここをクリックしてください。
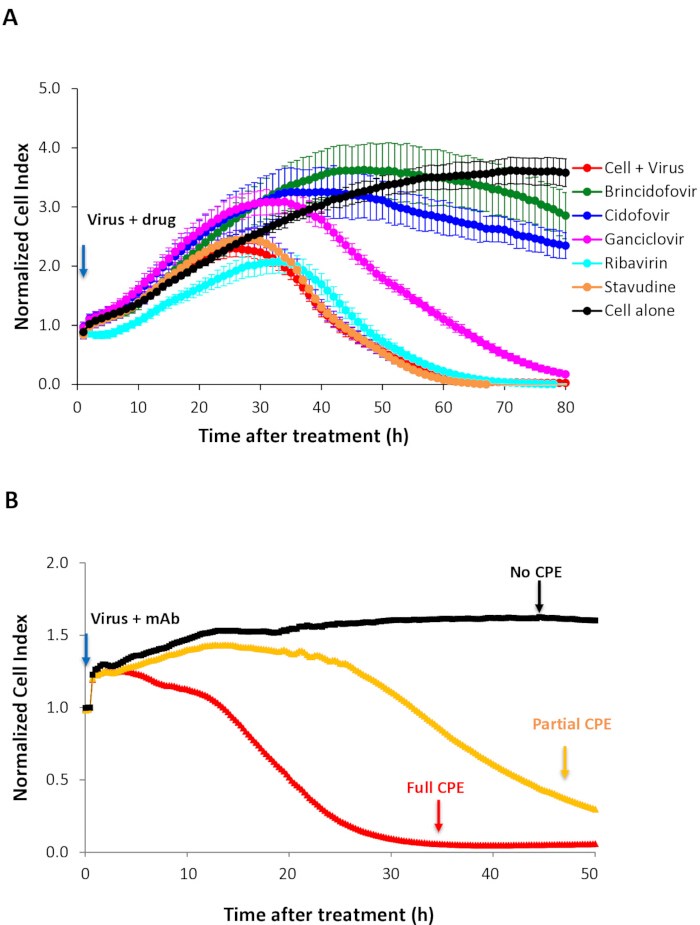
図 2: インピーダンスベースのCell Index測定を用いた抗ウイルス活性のリアルタイムモニタリング。 (A) インピーダンス解析による抗ウイルス薬スクリーニング。リバビリン (20 µM) およびブリンシドフォビル (1 µM) を除き、すべての化合物は 50 µM でテストした。アデノウイルス5型を MOI 1 で存在させた。データは3つの繰り返しウェルの平均値 ± SD で示している。この図は Zhang et al.13 を改変したものである。 (B) インピーダンスベースのモノクローナル抗体中和試験。中和能を示さない(完全なCPE、赤)、部分的な中和を示す(部分的なCPE、オレンジ)、または強力な中和を示す(CPEが検出されない、黒)モノクローナル抗体の代表的な Cell Index プロファイルを示す。 この図の拡大版を表示するには、ここをクリックしてください。
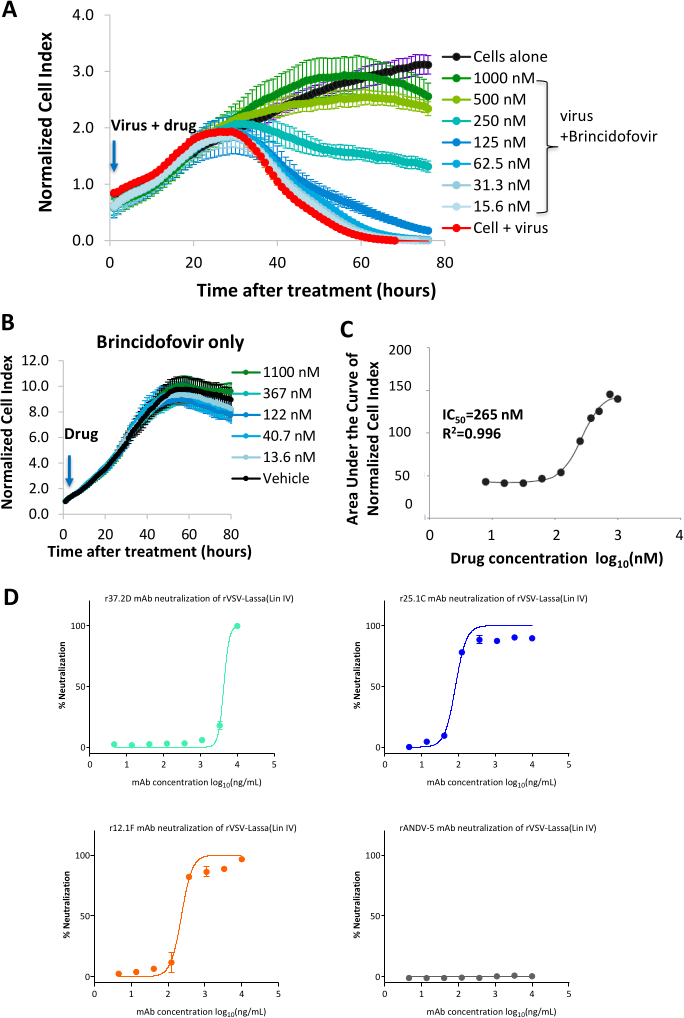
図 3: インピーダンスを用いた抗ウイルス活性の定量化。 (A) MOI 1 でのアデノウイルス5型感染に、濃度を増加させたbrincidofovirを併用投与した後のリアルタイム正規化細胞指標(Normalized Cell Index)の動的変化。 (B) brincidofovir単独を濃度を増加させて投与した後のリアルタイム正規化細胞指標の動的変化。 (C) 投与量反応曲線を得るため、インピーダンストレース下の面積をbrincidofovirの関数としてプロットした。 (A) および (C) は Zhang et al.13 より改変。 (D) モノクローナル抗体 r37.2D、r25.1C、r12.1F、および陰性対照として含めた rANDV-5 の代表的な rVSV–LASV Lineage IV (Josiah) 中和曲線。モノクローナル抗体 37.2D、25.1C、12.1F、および ANDV-5 は、既存の文献に基づき組換え的に作製した(結果セクションを参照)。示されているデータは2回の独立した実験からの代表的な曲線であり、3つの複製ウェルの平均値 ± SD として報告している。 こちらをクリックして、この図の拡大版を表示してください。
ディスカッション
すべての細胞ベースのアッセイと同様に、RTCA抗ウイルススクリーニングアッセイは、個々のウイルス-細胞系に合わせて最適化する必要があります。このアッセイはインピーダンスの変化を通じてウイルス誘発性のCPE(細胞変性効果)を検出するため、ウイルスの複製と測定可能なCPEをサポートする許容性細胞モデルに依存します。インピーダンスで検出可能なCPEを生成しないウイルスはこの手法に適していない可能性があり、そのような場合は、ウイルス特異的抗体が利用可能であればFRNTなどの代替法を用いることができます。もう一つの重要な考慮事項は、Cell Indexの変化がウイルス誘発性の細胞溶解のみによって引き起こされるわけではない点です。細胞の形態、接着、増殖、および付着の変化もインピーダンス信号に影響を与え、抗ウイルス活性の評価を混乱させる可能性があります。したがって、抗ウイルス剤がCell Indexに及ぼす影響は、予備研究または適切な薬剤単独コントロールを通じて評価されるべきです。本研究では、1プレートあたりに評価する薬剤数を最大化するため、ウイルス感染がない状態での各候補薬剤のベースライン効果を確立するために、スクリーニングアッセイの前に抗ウイルス剤単独コントロールをテストしました。アッセイの性能は、細胞播種密度、ウイルス接種タイミング、および培地条件などの要因によっても影響を受け、これらは細胞増殖、ウイルス複製、CPEの発現、およびアッセイの再現性に影響を及ぼす可能性があります7,10,16。したがって、堅牢で信頼性の高いRTCAベースの抗ウイルススクリーニングには、系統的な最適化が不可欠です。
最適なアッセイ条件を確立した後、インピーダンスに基づいたリアルタイム抗ウイルスアッセイを正常に実施するには、一貫した細胞播種、健全な細胞、および安定したアッセイ条件が必要です。ウェル間のばらつきが大きい原因の多くは、細胞分布の不均一やピペッティングの不正確さにあります。したがって、播種前に細胞懸濁液を十分に混合し、播種後はプレートをRTで30分間静置して、細胞を均一に沈降させ、エッジエフェクトを軽減させる必要があります。1つの処理につき最低3つのレプリケートを推奨します。また、陰性対照(非感染)および陽性対照(ウイルスのみ)のレプリケートを追加することを強く推奨します。これらの値は、すべての処理条件における%CPEおよび%Neutralization算出の基準点となるためです。ウイルス誘導性のCPEが弱いか、あるいは不均一な場合は、ウイルスストックの品質と許容細胞株の健全性を確認してください。ウイルスの感染性を維持するため、実験ごとに使い切り分量のウイルス分注液を調製し、凍結融解サイクルの繰り返しを避けてください。最後に、実験のばらつきを最小限に抑え、アッセイの再現性を向上させるため、継代数が一貫した許容細胞を含むセルバンクの使用を強く推奨します。感染直前(通常は播種後約24時間)に測定されたCell Indexが、許容細胞株に対して設定されたベンチマークを下回った場合は、細胞の健康状態や増殖が最適ではないことを示しているため、実験を中止する必要があります。このような場合は、凍結保存細胞の新しいバイアルを融解し、抗ウイルススクリーニングアッセイを再実施してください。
本研究で示したスクリーニングデータのように、十分に制御され最適化された条件下で抗ウイルススクリーニングアッセイを実施すれば、インピーダンスベースのアッセイによって抗ウイルス剤によるCPEのリアルタイムな減少を正確に定量化することが可能です。労力を要するエンドポイント測定に依存する従来のアプローチとは対照的に、連続的かつ非侵襲的なインピーダンス読み取りにより、ウイルス誘発性の細胞損傷の全スペクトルおよび抗ウイルス反応のキネティックプロファイルを縦断的にモニタリングできます。このリアルタイム測定能により、従来のエンドポイントアッセイでは見落とされる可能性のある、早期作用のみならず遅延性の抗ウイルス効果を検出するための最適な時間的ウィンドウの特定が容易になります。
さらに、本稿で述べるRTCAプロトコルは、従来の手法と比較して、抗ウイルススクリーニングのためのより迅速かつ大幅に簡略化されたワークフローを提供します。このアッセイでは、最初の細胞播種ステップの後、抗ウイルス剤の有無に合わせてウイルスを添加するだけで済みます。追加の操作やアッセイ後の処理は不要です。また、システム独自のVirologyソフトウェアモジュールにより、実験設定とデータ解析がさらに効率化されており、%CPE、%neutralization、およびユーザーが定義した中和レベルを達成する抗ウイルス剤の最大希釈倍率または最低濃度など、VRNTで一般的に使用されるパラメータの自動計算が可能です。これらの利点により、従来の手法では通常不可能な、より多くのアッセイ条件(薬剤比較、希釈範囲の拡大など)の迅速かつ並列的なスクリーニングが可能になります。
ここで説明するアッセイは、上述の適切なアッセイ条件下で96ウェルプレート形式で開発されましたが、384ウェルプレート形式にも適応させることが可能です。このよりハイスループットなインピーダンスベースのアッセイをサポートするために、自動インピーダンスベースRTCAシステムを採用することができ、これにより最大4枚の384ウェルプレートを同時に処理することが可能になります。
抗ウイルス剤スクリーニング以外にも、このRTCA法は併用療法研究、血清学、およびウイルスの免疫逃避の調査に適用可能です。治療用抗体や免疫血清がウイルス誘発性のCPEを抑制する能力を測定することで、本アッセイは、感染またはワクチン接種後の中和活性および防御免疫応答を、ラベルフリーかつリアルタイムで評価することを可能にします。さらに、ウイルス変異株間で中和プロファイルを比較することで、免疫逃避に関連する感受性の変化を明らかにできます。ゲノムシーケンシングと組み合わせることで、この手法は抗体耐性変異株の同定を促進し、次世代ワクチン、抗体治療薬、および抗ウイルス戦略の開発を支援することが期待されます。
開示事項
J.E.C.はModerna社およびMerck社のコンサルタントを務めており、IDBiologics社の創設者であり、UpToDate社からロイヤリティを受け取っています。J.E.C.の研究室は、本研究の実施期間中、IDBiologics社から本研究とは無関係の受託研究契約を受けていました。
謝辞
本研究は、米国国立衛生研究所(NIH)の国立アレルギー感染症研究所(NIAID)による助成金U19 AI181979およびU19AI181930の一部による支援を受けて行われました。
材料
| 名前 | 会社 | カタログ番号 | コメント |
|---|---|---|---|
| Adenovirus-GFP | Vector Biolabs | 1060 | |
| Brincidofovir (CMX001) | AdooQ | A13326 | |
| CaviCide | Metrex | 13-5024 | 消毒剤 |
| Cidofovir | Selleck | S1516 | |
| Dulbecco's Modified Eagle's Medium (DMEM) | ATCC | 30-2002 | |
| E-Plate 96 | Agilent | 5232368001 | マイクロ電極統合型96ウェルプレート |
| ウシ胎児血清 | Avantor | 97068-085 | |
| Ganciclovir Sodium | Selleck | S5065 | |
| HEK293A細胞 | Thermo Fisher Scientific | R70507 | |
| Multichannel Viaflo | INTEGRA | VIAFLO 96 | |
| ペニシリン-ストレプトマイシン溶液 | Gibco | 10378016 | |
| リン酸緩衝生理食塩水 (1x) | HyClone | SH30256.01 | |
| リコンビナントmAbs | Crowe Lab | N/A | |
| リバビリン | Selleck | S2504 | |
| rVSV-LASV (Lin IV) | Crowe Lab | N/A | |
| スタブジン | Selleck | S1398 | |
| 0.25% Trypsin 0.53 mM EDTA (1x ) | ATCC | 30-2101 | |
| 12チャンネル試薬リザーバー | VistaLab Technologies | 3054-1011 | |
| Vero CCL-81 | ATCC | CCL-81 | |
| Virology Module | Agilent | S2807-90089 | |
| xCELLigence RTCA MP system | Agilent | 380601040 |
参考文献
- Pardi N, Weissman D. Development of vaccines and antivirals for combating viral pandemics. Nat Biomed Eng. 2020;4(12):1128-1133.
- Rocha VPC, Quadros HC, Fernandes AMS, Gonçalves LP, Badaró R, Soares MBP, et al. An overview of the conventional and novel methods employed for SARS-CoV-2 neutralizing antibody measurement. Viruses. 2023;15(7). doi:10.3390/v15071552.
- Chen CZ, Shinn P, Itkin Z, Eastman RT, Bostwick R, Rasmussen L, et al. Drug repurposing screen for compounds inhibiting the cytopathic effect of SARS-CoV-2. Front Pharmacol. 2021;11:592737.
- Giaever I, Keese CR. A morphological biosensor for mammalian cells. Nature. 1993;366(6455):591-592.
- Giaever I, Keese CR. Micromotion of mammalian cells measured electrically. Proc Natl Acad Sci U S A. 1991;88(17):7896-7900.
- Suryadevara N, Shrihari S, Gilchuk P, VanBlargan LA, Binshtein E, Zost SJ, et al. Neutralizing and protective human monoclonal antibodies recognizing the N-terminal domain of the SARS-CoV-2 spike protein. Cell. 2021;184(9):2316-2331.e15.
- Charretier C, Saulnier A, Benair L, Armanet C, Bassard I, Daulon S, et al. Robust real-time cell analysis method for determining viral infectious titers during development of a viral vaccine production process. J Virol Methods. 2018;252:57-64.
- Ebersohn K, Coetzee P, Venter EH. An improved method for determining virucidal efficacy of a chemical disinfectant using an electrical impedance assay. J Virol Methods. 2014;199:25-28.
- Marlina S, Shu MH, Abubakar S, Zandi K. Development of a real-time cell analysing (RTCA) method as a fast and accurate screen for the selection of chikungunya virus replication inhibitors. Parasit Vectors. 2015;8:240.
- Teng Z, Kuang X, Wang J, Zhang X. Real-time cell analysis—a new method for dynamic, quantitative measurement of infectious viruses and antiserum neutralizing activity. J Virol Methods. 2013;193(2):364-370.
- Suryadevara N, Gilchuk P, Zost SJ, Mittal N, Zhao LL, Crowe JE Jr, et al. Real-time cell analysis: a high-throughput approach for testing SARS-CoV-2 antibody neutralization and escape. STAR Protoc. 2022;3(2):101387.
- Zhang J, Abassi YA, Li N, Wang X, Zhang X. A streamlined, label-free real-time 50% tissue culture infectious dose (TCID50) assay using impedance for automated viral titer quantification. J Vis Exp. 2026;(227). doi:10.3791/73686.
- Zhang J, Giang C, Li N, Abassi YA, Lamarche BJ. Screening and characterizing antiviral drugs in real time using xCELLigence RTCA eSight's combination of impedance and imaging. Agilent Technologies; 2022.
- Engdahl TB, Kuzmina NA, Ronk AJ, Mire CE, Hyde MA, Kose N, et al. Broad and potently neutralizing monoclonal antibodies isolated from human survivors of New World hantavirus infection. Cell Rep. 2021;35(5):109086.
- Robinson JE, Hastie KM, Cross RW, Yenni RE, Elliott DH, Rouelle JA, et al. Most neutralizing human monoclonal antibodies target novel epitopes requiring both Lassa virus glycoprotein subunits. Nat Commun. 2016;7:11544.
- Piret J, Goyette N, Boivin G. Novel method based on real-time cell analysis for drug susceptibility testing of herpes simplex virus and human cytomegalovirus. J Clin Microbiol. 2016;54(8):2120-2127.
再版と許可
この記事は公開されました
動画は近日公開