This multimodal artificial intelligence approach integrates chest computed tomography and echocardiography to assist in diagnosing pulmonary arterial hypertension. In this 100-patient retrospective cohort, the integrated model achieved higher diagnostic accuracy than either imaging modality alone, with RHC as the reference standard.
研究記事
Multimodal Artificial Intelligence Model Integrating Chest CT and Cardiac Ultrasound for the Auxiliary Diagnosis of Pulmonary Arterial Hypertension
この記事について
サマリー
要約
Pulmonary arterial hypertension (PAH) is a progressive vascular disorder characterized by elevated pulmonary vascular resistance and right ventricular dysfunction. Conventional imaging modalities, chest computed tomography (CT) and cardiac ultrasound (echocardiography), provide complementary structural and functional information but exhibit incomplete sensitivity and specificity when used alone. This study aimed to evaluate a multimodal artificial intelligence (AI) model integrating chest CT and cardiac ultrasound for auxiliary PAH diagnosis, benchmarked against right heart catheterization (RHC) as the reference standard. A retrospective observational study was conducted on 100 patients (mean age 52.6 ± 15.2 years; 56% female) with suspected PAH between January 2020 and December 2024. Each underwent high-resolution chest CT, transthoracic echocardiography, and RHC within a 2-week interval. Imaging-derived structural and functional features were integrated within an attention-based multimodal AI framework. Diagnostic metrics were calculated for chest CT, cardiac ultrasound, and multimodal AI against the archived RHC clinical classification. The multimodal AI system achieved sensitivity of 92.2%, specificity of 88.9%, accuracy of 91.0%, and AUC of 0.930, compared with CT (sensitivity 84.4%, specificity 80.6%, accuracy 83.0%, AUC 0.860) and echocardiography (sensitivity 79.7%, specificity 77.8%, accuracy 79.0%, AUC 0.840). McNemar tests of paired binary classifications favored AI over CT (p = 0.0078) and echocardiography (p = 0.00049). Exploratory subgroup analyses were performed for borderline pulmonary artery diameter and connective tissue disease. The multimodal approach showed improved overall discrimination in this internal retrospective evaluation and should be considered an auxiliary, noninvasive tool that requires external prospective validation.
概要
Pulmonary arterial hypertension (PAH) is a multifactorial pulmonary vascular disorder marked by progressive pulmonary vascular remodeling and resultant right heart dysfunction1. Imaging modalities provide an indispensable window into the structural and functional abnormalities that characterize PAH, facilitating early detection, ongoing monitoring, and prognostication of disease progression. Chest computed tomography (CT) provides detailed anatomical visualization of the pulmonary vasculature, enabling assessment of pulmonary artery diameter, vascular remodeling, and secondary indicators such as right ventricular enlargement2. High-resolution CT further allows detection of parenchymal lung alterations, vascular pruning, and thromboembolic lesions that may contribute to or mimic PAH. Advances in quantitative CT, including radiomic analysis, are increasingly utilized to characterize vascular remodeling patterns and predict disease severity. Echocardiography remains the cornerstone noninvasive functional imaging tool. It provides key parameters such as tricuspid regurgitation velocity, right ventricular systolic pressure, right atrial enlargement, and ventricular strain metrics, which play vital roles in risk stratification and longitudinal surveillance3. Despite its utility, echocardiography alone cannot confirm PAH, underscoring the necessity for RHC and complementary imaging strategies. The integration of CT and echocardiography can combine structural and hemodynamic information4. Emerging AI models leverage complementary imaging datasets to detect subtle pathological patterns and refine diagnostic assessments5.
The pathogenesis of PAH is complex, involving endothelial dysfunction, chronic inflammation, oxidative stress, and genetic or epigenetic alterations that lead to pulmonary vascular remodeling, increased pulmonary resistance, right ventricular hypertrophy, and eventual heart failure. Recent investigations have highlighted metabolic dysregulation and inflammatory signaling pathways as novel therapeutic targets6. AI-enhanced imaging applications, including CT-based quantitative analysis and machine learning applied to echocardiography, are increasingly being investigated for pulmonary hypertension phenotyping and prediction7. Multimodal AI approaches can integrate complementary imaging and clinical data, although their clinical value depends on transparent methodology and appropriate validation8.
Both chest CT and echocardiography alone exhibit valuable but incomplete diagnostic sensitivity/specificity compared with the invasive reference standard. Table 1 summarizes reported diagnostic performance for pulmonary arterial assessment. In a study comparing chest CT and Doppler echocardiography with RHC in patients with scleroderma, diagnostic performance varied by modality and threshold4.
| S.No. | Modality | Main Diagnostic Targets | Reported Sensitivity (%) | Reported Specificity (%) | AUC | Reference |
| 1 | Chest CT | Pulmonary artery size and thoracic morphology | 75–100 | 100 | 1 | 4 |
| 2 | Cardiac ultrasound | Pulmonary pressure and right-heart function | 72.7–100 | 63.6–100 | 0.841 | 4 |
| 3 | Right heart catheterization | Hemodynamic reference standard | Reference standard | Reference standard | — | 1 |
Table 1: Diagnostic modalities and reported performance in the literature. Summary of commonly used diagnostic modalities for pulmonary arterial hypertension (PAH), including chest computed tomography (CT), echocardiography, and right heart catheterization (RHC), together with representative diagnostic performance and relevant findings reported in the literature.
Chest CT can identify enlargement of the main pulmonary artery and associated parenchymal and right-heart changes; a main pulmonary artery diameter around 29 mm has been used as an imaging sign of pulmonary hypertension, although it is not diagnostic in isolation9. Doppler echocardiography estimates pulmonary pressures and evaluates right-heart changes with high sensitivity but variable specificity; RHC remains necessary for definitive hemodynamic diagnosis1,3,10. Using complementary imaging information may mitigate some limitations of isolated modality assessment11,12.
Integration of multiple diagnostic modalities by AI leverages their complementary strengths. For example, CT provides high-resolution anatomic detail, while echocardiography delivers real-time hemodynamic and functional data. Fusion can be implemented at early, intermediate, or late stages, depending on whether raw inputs, learned features, or model outputs are combined13. Table 2 summarizes the main approaches for multimodal fusion in cardiovascular disease (CVD) diagnosis. Early fusion involves merging raw imaging data with clinical metrics, offering a simple framework that captures low-level relationships but may overlook higher-level interactions. Intermediate fusion combines features extracted from each modality using neural networks, allowing for more flexible and nuanced integration, though it requires careful module design. Late fusion integrates the outputs of independent models at the decision stage, providing robustness and modality independence, but it may fail to capture cross-modal interactions effectively13.
| S.No. | Fusion approach | General description | Main advantage | Main limitation |
| 1 | Early fusion | Combines low-level/raw or engineered inputs before modeling | Direct cross-modal integration | Sensitive to scale and alignment |
| 2 | Intermediate fusion | Combines modality-specific learned/engineered feature representations | Can model cross-modal interactions | Requires a prespecified fusion architecture |
| 3 | Late fusion | Combines outputs from separately trained modality models | Modality independence | May capture fewer cross-modal interactions |
Table 2: General multimodal fusion approaches. Overview of early-, intermediate-, and late-fusion strategies used for multimodal data integration, highlighting the type of information combined and the principal advantages and limitations of each approach.
Given the incomplete sensitivity and specificity of chest CT and echocardiography alone, there is a need for improved noninvasive diagnostic support. Multimodal AI models may bridge this gap through feature-level data integration and machine-learning approaches. The present study aims to evaluate a multimodal AI model that integrates chest CT and cardiac ultrasound in a clinical cohort of 100 cases and to compare its diagnostic performance with unimodal approaches using RHC as the reference standard (Figure 1)14,15,16.
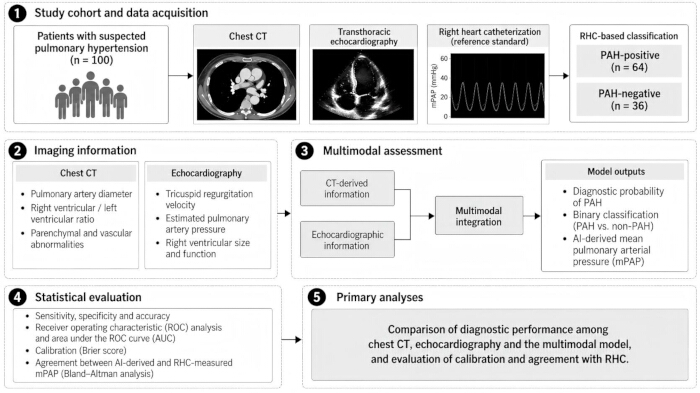
Figure 1: Workflow of the multimodal artificial intelligence framework for pulmonary arterial hypertension assessment. Patients with suspected pulmonary hypertension underwent chest computed tomography (CT), transthoracic echocardiography, and right heart catheterization (RHC). RHC-based clinical classification served as the reference standard, with 64 patients classified as PAH-positive and 36 as PAH-negative. Structural information derived from CT and functional and hemodynamic information derived from echocardiography were integrated using a multimodal feature-fusion strategy. The model generated a patient-level PAH probability score and binary PAH classification. A separate continuous AI-derived mean pulmonary arterial pressure (mPAP) estimate was evaluated as a secondary output and was not used for binary classification. Please click here to view a larger version of this figure.
However, evidence on integrating CT-derived structural and echocardiographic functional features into a multimodal AI framework, evaluated against RHC, in the same patient cohort remains limited. The present study, therefore, evaluated whether multimodal integration could improve PAH discrimination compared with either imaging modality alone.
プロトコル
This study was approved by the Ethics Committee of the PLA Rocket Force Characteristic Medical Center (Approval No. KY2025068). The requirement for individual informed consent was waived because of the retrospective study design.
Study type and setting
This retrospective observational cohort study was conducted at a tertiary care center specializing in pulmonary vascular diseases. Clinical and imaging records obtained between January 2020 and December 2024 were retrospectively reviewed. The examinations had been performed as part of routine clinical care in accordance with standardized institutional protocols.
Study population
The study included 100 consecutive adult patient records with suspected pulmonary arterial hypertension (PAH), identified from the institutional database based on documented symptoms or screening findings. Demographic and clinical characteristics, including age, sex, and comorbidities, were recorded at baseline. Each included patient had undergone chest computed tomography (CT), transthoracic echocardiography, and right heart catheterization (RHC) within a 2-week interval.
Inclusion criteria
Eligible records were obtained from adults aged ≥18 years with suspected or confirmed World Health Organization (WHO) Group 1 PAH who had undergone both chest CT and transthoracic echocardiography. Records were required to contain paired CT, echocardiographic, and RHC information necessary for the planned analyses.
Exclusion criteria
Exclusion criteria included age <18 years, current pregnancy or lactation, severe renal insufficiency defined as an estimated glomerular filtration rate (eGFR) <60 mL/min/1.73 m2, uncontrolled hypertension, or inability to undergo the required imaging examinations. Patients with significant parenchymal lung disease or left-sided heart failure causing non-Group 1 pulmonary hypertension were excluded. Patients with connective tissue disease-associated PAH remained eligible when clinically classified as WHO Group 1 PAH; 14 such patients were included in the final cohort.
Standard of reference
RHC served as the reference standard for PAH classification. All patients underwent RHC, with hemodynamic assessment including mean pulmonary arterial pressure (mPAP), pulmonary capillary wedge pressure (PCWP), and pulmonary vascular resistance (PVR). Based on the clinical RHC classification recorded in the study dataset, 64 patients were classified as PAH-positive and 36 as PAH-negative. The recorded RHC-based classification was consistently used as the reference outcome for all subsequent diagnostic performance analyses.
Imaging protocol and data extraction
All patients underwent chest CT and transthoracic echocardiography as part of the diagnostic evaluation. Chest CT was performed using standardized volumetric acquisition at end-inspiration with a multidetector scanner. CT assessment included main pulmonary artery diameter, right ventricular-to-left ventricular (RV/LV) ratio, ventricular geometry, pulmonary parenchymal abnormalities, pulmonary vascular changes, and fibrosis-related changes.
Transthoracic echocardiographic assessment included Doppler-based evaluation of right-heart morphology and function, right ventricular systolic pressure, right atrial and right ventricular size, tricuspid regurgitation jet velocity (TRJV), and estimated pulmonary artery systolic pressure. CT and echocardiographic examinations were performed within 2 weeks of RHC to minimize potential variation related to changes in hemodynamic status over time.
Imaging measurements were extracted from archived clinical imaging records and reports using the study variables available for analysis. Reader-level identifiers and documentation of reader blinding to RHC findings were not consistently retained in the retrospective archive; therefore, the number of independent readers and reader-specific blinding status could not be reliably reconstructed. Repeated independent measurements were likewise unavailable, precluding formal assessment of interobserver reproducibility.
Feature extraction and AI model evaluation
Available CT and echocardiographic variables were organized into patient-level feature representations encompassing morphologic, hemodynamic, and functional parameters. Features included CT-derived vessel diameters, ventricular geometry, and parenchymal findings, together with ultrasound-derived pressure and chamber measurements. Because the present study was reconstructed from archived patient-level analytical outputs, the historical preprocessing pipeline used during original model development could not be fully recovered. Specifically, verifiable records of normalization or scaling procedures, missing-value and outlier handling, treatment of correlated variables, feature-selection rules, and any dimensionality-reduction steps were not retained. These preprocessing details were therefore not retrospectively reconstructed and are acknowledged as a limitation affecting reproducibility.
A deep learning-based multimodal framework was used to integrate structural features derived from chest CT with functional and hemodynamic features from echocardiography. Modality-specific features were represented separately and subsequently integrated at the feature level using an attention-based fusion strategy to capture complementary cross-modal information. The resulting integrated representation was used to generate a continuous patient-level probability of PAH, which was subsequently converted into a binary diagnostic prediction. For comparative evaluation, modality-specific probability scores and predictions derived from CT and echocardiography were also analyzed alongside the multimodal output.
Model performance was evaluated using the available predefined patient-level outputs from the complete cohort of 100 patients with paired CT, echocardiographic, and RHC data. The analysis, therefore, represented an internal evaluation of the multimodal framework rather than an independent external validation. Detailed implementation-level parameters from the original model-development process were not recoverable from the retained materials. In particular, the number of transformer layers, attention heads, embedding dimensions, optimizer, learning rate, batch size, number of training epochs, stopping criteria, and regularization strategy could not be verified and were not retrospectively reconstructed. Their absence limits the exact computational reproducibility of the reported model and is explicitly acknowledged as a study limitation. RHC-based clinical classification served as the reference standard for model-performance evaluation.
Diagnostic evaluation
Diagnostic performance was evaluated separately for chest CT, echocardiography, and the integrated multimodal AI model. Sensitivity, specificity, positive predictive value, negative predictive value, accuracy, and area under the receiver operating characteristic curve (AUC) were calculated for each approach. RHC-based clinical classification served as the reference standard for all diagnostic comparisons. Of the 100 patients included in the analysis, 64 were classified as PAH-positive and 36 as PAH-negative by the RHC-based reference classification.
In parallel with the primary classification output, a separate continuous regression-type output provided an AI-derived estimate of mPAP. The AI-derived mPAP estimate was analyzed as a secondary outcome and was not used to determine the binary PAH classification. Agreement between the AI-derived continuous mPAP estimate and RHC-measured mPAP was evaluated independently from the primary classification analysis using Bland-Altman analysis.
Statistical analysis
Paired categorical outcomes were compared using McNemar's test. McNemar's test was used only to compare paired binary classification outcomes and was not used to test differences between AUC values. AUC values were reported descriptively from the continuous model scores.
Continuous variables were summarized as mean ± standard deviation (SD). Model calibration, confusion-matrix components, and receiver operating characteristic statistics were evaluated. Calibration was assessed using the Brier score and a calibration plot. For the calibration plot, the 100 final patient-level multimodal AI probability scores were sorted and divided into five equal-frequency groups (20 patients per group); the mean predicted probability and observed PAH proportion were calculated for each group. Exact 95% confidence intervals for sensitivity and specificity were calculated using the Clopper-Pearson method. A p-value <0.05 was considered statistically significant.
For the secondary continuous output, agreement between AI-derived mPAP and RHC-measured mPAP was evaluated using Bland-Altman analysis. The mean difference (bias) and 95% limits of agreement, calculated as the mean difference ± 1.96 SD of the paired differences, were determined. This agreement analysis was conducted separately from the evaluation of the primary PAH classification performance.
Exploratory subgroup analyses were performed for patients with borderline pulmonary artery diameter (27–29 mm) and patients with connective tissue disease-associated PAH. The overall study protocol and analytical workflow are summarized in Table 3.
| S.No. | Step | Protocol | Key outcome |
| 1 | Patient recruitment | 100 retrospective suspected-PAH cases; individual consent waived by ethics committee | 64 RHC-positive; 36 RHC-negative |
| 2 | Data acquisition | CT + echocardiography + RHC within 2 weeks | Paired patient-level dataset |
| 3 | Feature variables | Clinical, CT, echocardiographic, modality scores/predictions, AI mPAP output | Verifiable archived variables |
| 4 | Model outputs | CT_score/pred, Echo_score/pred, AI_score/pred | Model evaluated using available predefined patient-level outputs |
| 5 | Evaluation dataset | Complete 100-patient cohort | Internal proof-of-concept evaluation |
| 6 | Diagnostic benchmarking | CT, echocardiography, multimodal AI vs archived RHC_PAH | Sensitivity, specificity, accuracy, ROC AUC |
| 7 | Secondary analyses | Brier calibration; Bland–Altman for separate AI mPAP output; exploratory subgroups | Based on the final study dataset |
Table 3: Study protocol and analytical workflow. Summary of the study workflow, including patient selection, imaging and clinical data acquisition, feature extraction, multimodal artificial intelligence (AI) model evaluation, diagnostic assessment, and statistical analysis.
結果
Patient characteristics
The cohort included 100 patients with a mean age of 52.6 ± 15.2 years, comprising 56% females and 44% males. Common comorbidities included systemic hypertension (32%), connective tissue disorders (14%), and chronic obstructive pulmonary disease (COPD) (10%). All patients had chest CT, cardiac ultrasound, and RHC data within the prescribed 2-week interval. RHC classified 64 patients as PAH-positive and 36 as PAH-negative.
Diagnostic performance of AI models
To assess diagnostic performance, CT-only, echocardiography-only, and multimodal AI scores were evaluated using receiver operating characteristic (ROC) analysis (Figure 2). The multimodal AI model achieved an AUC of 0.930, compared with 0.860 for CT and 0.840 for echocardiography. Sensitivity was 92.2% (59/64; exact 95% CI, 82.7–97.4%) and specificity was 88.9% (32/36; 95% CI, 73.9–96.9%) for multimodal AI; corresponding values were 84.4% (54/64; 95% CI, 73.1–92.2%) and 80.6% (29/36; 95% CI, 64.0–91.8%) for CT, and 79.7% (51/64; 95% CI, 67.8–88.7%) and 77.8% (28/36; 95% CI, 60.8–89.9%) for echocardiography. Positive predictive value (PPV) and negative predictive value (NPV) were 93.7% and 86.5% for multimodal AI, 88.5% and 74.4% for CT, and 86.4% and 68.3% for echocardiography, respectively. The confusion-matrix components (TP/FP/TN/FN) were 59/4/32/5 for multimodal AI, 54/7/29/10 for CT, and 51/8/28/13 for echocardiography. Overall accuracies were 91.0%, 83.0%, and 79.0%, respectively. Paired binary classification performance favored AI over CT (McNemar p = 0.0078) and AI over echocardiography (p = 0.00049). The fusion model integrated structural biomarkers and functional parameters to provide a combined diagnostic representation. The comparative diagnostic performance metrics are summarized in Table 4.
| Model | Sensitivity (%) | Specificity (%) | PPV (%) | NPV (%) | Accuracy (%) | AUC | Confusion matrix (TP/FP/TN/FN) | 95% CI for sensitivity and specificity |
| Chest CT | 84.4 (54/64) | 80.6 (29/36) | 88.5 | 74.4 | 83 | 0.86 | 54/7/29/10 | Sensitivity: 73.1–92.2%; Specificity: 64.0–91.8% |
| Echocardiography | 79.7 (51/64) | 77.8 (28/36) | 86.4 | 68.3 | 79 | 0.84 | 51/8/28/13 | Sensitivity: 67.8–88.7%; Specificity: 60.8–89.9% |
| Multimodal AI | 92.2 (59/64) | 88.9 (32/36) | 93.7 | 86.5 | 91 | 0.93 | 59/4/32/5 | Sensitivity: 82.7–97.4%; Specificity: 73.9–96.9% |
Table 4: Diagnostic performance of chest CT, echocardiography, and multimodal AI. Comparison of sensitivity with exact 95% confidence intervals, specificity with exact 95% confidence intervals, positive predictive value (PPV), negative predictive value (NPV), diagnostic accuracy, area under the receiver operating characteristic curve (AUC), and confusion-matrix components for chest CT, echocardiography, and the multimodal AI model, using RHC-based clinical classification as the reference standard.
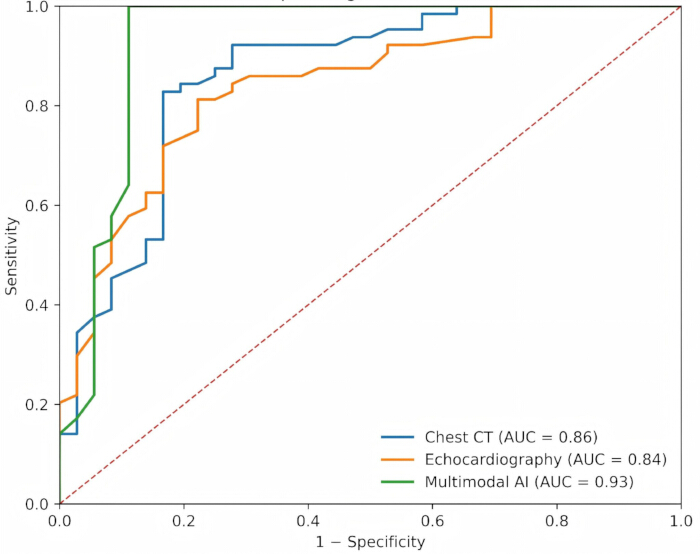
Figure 2: Receiver operating characteristic curves for chest CT, echocardiography, and multimodal AI in PAH classification. Receiver operating characteristic (ROC) curves comparing chest computed tomography (CT), echocardiography, and the integrated multimodal artificial intelligence (AI) model for PAH classification. RHC-based clinical classification was used as the reference standard. The areas under the ROC curve (AUCs) were 0.860 for chest CT, 0.840 for echocardiography, and 0.930 for multimodal AI. The dashed diagonal line represents chance-level discrimination. Please click here to view a larger version of this figure.
Model calibration and validation
Calibration analysis compared predicted multimodal AI probabilities with RHC-confirmed classifications (Figure 3). Using five equal-frequency groups of 20 patients each, the calibration plot showed reasonable overall calibration with some deviation in intermediate probability groups; the Brier score calculated from the final 100 patient-level probabilities was 0.071. Because the archived data did not contain a verifiable identifier for the previously described 20-patient test subset, the analysis is presented as an internal evaluation of the complete 100-patient dataset rather than as independent external validation.
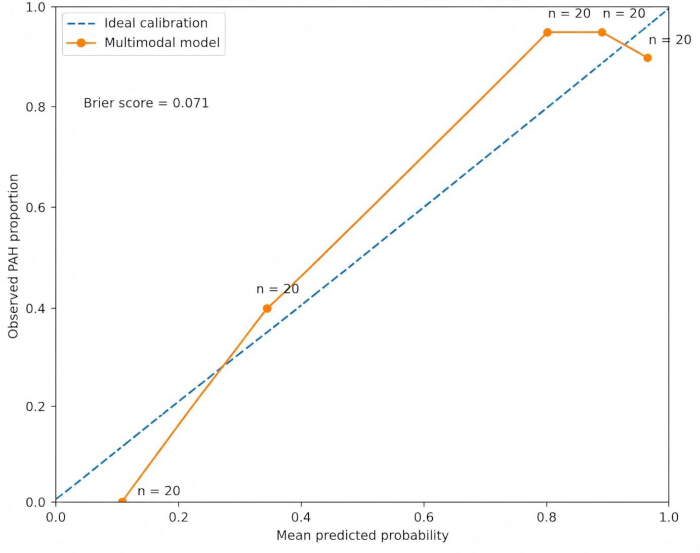
Figure 3: Calibration plot of the multimodal AI model for PAH classification. The 100 final patient-level multimodal AI probability scores were sorted and divided into five equal-frequency groups (20 patients per group). For each group, the mean predicted probability of PAH was plotted against the observed PAH proportion according to RHC-based clinical classification. The diagonal line represents ideal calibration. The multimodal AI model achieved a Brier score of 0.071. Numbers adjacent to points indicate the number of patients included in each probability group. Please click here to view a larger version of this figure.
Agreement analysis with reference standard (RHC)
As a secondary analysis, agreement between the separate continuous regression-type AI-derived mPAP output and invasive RHC-measured mPAP was assessed using Bland–Altman analysis (Figure 4). The mean bias was 0.80 mmHg, with 95% limits of agreement from –4.60 to +6.21 mmHg. This continuous mPAP output was not used to determine the primary binary PAH classification, and the agreement analysis does not imply interchangeability with RHC.
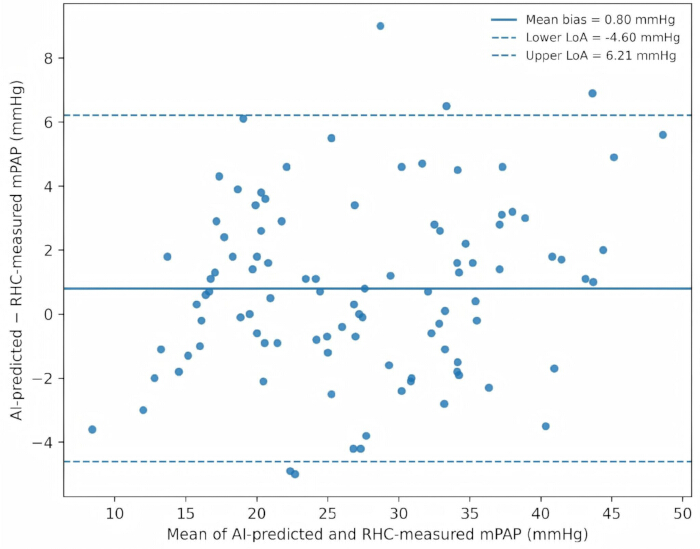
Figure 4: Bland–Altman analysis of AI-derived and RHC-measured mean pulmonary arterial pressure. The mean difference between AI-derived and RHC-measured mPAP was 0.80 mmHg, with 95% limits of agreement from −4.60 to +6.21 mmHg. The solid line indicates the mean difference, and dashed lines indicate the lower and upper limits of agreement. AI-derived mPAP was analyzed as a separate continuous secondary output and was not used to determine binary PAH classification. Please click here to view a larger version of this figure.
Subgroup analysis
For borderline pulmonary artery diameters (27–29 mm), 15 patients were identified. The multimodal AI and CT classifications were each correct in 15/15 cases (100%), whereas echocardiography was correct in 14/15 cases (93.3%). This small subgroup analysis was exploratory. A quantitative subgroup based on suboptimal ultrasound windows could not be verified from the patient-level variables; therefore, no numerical claim is made for this subgroup. Among the 14 patients with connective tissue disease, multimodal AI correctly classified 11/14 (78.6%), compared with 10/14 (71.4%) for CT and 10/14 (71.4%) for echocardiography. This analysis was exploratory because of the small subgroup size.
Comparative analysis
A comparison of imaging modalities illustrates the incremental diagnostic value observed with multimodal integration in this cohort. Chest CT provided anatomical information, whereas echocardiography contributed functional and hemodynamic assessment. Their integration via the AI output improved overall diagnostic performance relative to either unimodal approach, while RHC remained the reference standard. Comparative performance metrics and key characteristics are shown in Table 5.
| S.No. | Modality | Sensitivity | Specificity | Accuracy | AUC | Interpretation |
| 1 | Chest CT | 84.40% | 80.60% | 83.00% | 0.86 | Structural imaging output |
| 2 | Echocardiography | 79.70% | 77.80% | 79.00% | 0.84 | Functional/hemodynamic imaging output |
| 3 | Multimodal AI (CT + Echo) | 92.20% | 88.90% | 91.00% | 0.93 | Highest internal performance; auxiliary tool, not RHC replacement |
Table 5: Comparative diagnostic performance of imaging modalities and multimodal AI. Side-by-side comparison of chest CT, echocardiography, and multimodal AI with respect to their diagnostic performance and complementary structural and functional contributions to PAH assessment.
This comparative evaluation supports further investigation of AI-driven multimodal integration as an auxiliary noninvasive diagnostic approach. Prospective and external validation are required before the model can be considered for clinical decision-making or any reduction in RHC use.
Data Availability:
The original data supporting the findings of this study are provided as a Supplementary File 1 accompanying the manuscript. The dataset has been de-identified to protect patient privacy.
Supplementary File 1: De-identified patient-level analytical dataset. De-identified patient-level data for the 100 participants included in the retrospective study, comprising demographic and clinical variables, CT- and echocardiography-derived measurements, RHC-based reference classification and hemodynamic parameters, modality-specific and multimodal AI probability scores and classifications, and the AI-derived mPAP values used for the Bland–Altman agreement analysis. Please click here to download this file.
ディスカッション
The present study demonstrates that integrating chest CT and cardiac ultrasound (echocardiography) via a multimodal AI output can enhance noninvasive PAH classification in this retrospective cohort. The multimodal AI system achieved an AUC of 0.930, sensitivity of 92.2%, and specificity of 88.9%, compared with lower performance for CT or echocardiography alone. These findings support the complementary value of structural and hemodynamic imaging biomarkers, while RHC remains the reference standard.
Interpretation of principal findings
The multimodal AI model’s performance underscores the complementary nature of integrating anatomical and functional data. CT captures morphologic indicators such as pulmonary arterial enlargement and right ventricular changes, while echocardiography reflects dynamic hemodynamic parameters such as tricuspid regurgitation velocity and right ventricular systolic pressure. The integrated model combined these cross-domain variables, thereby improving overall discrimination. Exploratory subgroup analyses included patients with borderline CT findings (27–29 mm pulmonary artery diameter) and those with connective tissue disease; because these subgroups were small, their results should not be overinterpreted.
The Bland–Altman analysis should be interpreted separately from the primary diagnostic classification results. The primary model output was the probability-based classification of PAH, whereas AI-derived mPAP represented a separate continuous regression-type output used for secondary agreement analysis. The mean bias between AI-derived and RHC-measured mPAP was 0.80 mmHg, with 95% limits of agreement from -4.60 to +6.21 mmHg. Although the average difference was small, this finding does not establish interchangeability with invasive hemodynamic measurement; RHC remains the reference standard for hemodynamic assessment of PAH17,18.
Comparison with previous studies
Previous research has examined AI applications for pulmonary hypertension using echocardiography, CT, and other chest imaging, clinical variables, and multimodal data19,20,21,22,23. These approaches are promising, but their performance and clinical applicability depend on study design, transparent reporting, and independent validation24,25.
Our results add to this literature by evaluating integrated CT and echocardiographic information in a paired RHC-referenced cohort. The observed improvement over either unimodal approach supports further study of multimodal fusion in cardiopulmonary diagnostics8,13,22,26. Table 6 summarizes representative research models and related evidence. Similar work across cardiovascular imaging also supports the potential value of combining complementary imaging and clinical data23,24.
| S.No. | Study/Source | Relevance to revised manuscript | Reference |
| 1 | 2022 ESC/ERS pulmonary hypertension guideline | PAH terminology and RHC reference framework | 1 |
| 2 | Kooranifar et al., 2021 | CT and Doppler echocardiography compared with RHC | 4 |
| 3 | Kramer et al., 2025 | Artificial intelligence in pulmonary hypertension | 5 |
| 4 | Milosevic et al., 2024 | Multimodal AI in cardiovascular imaging | 8 |
| 5 | Collins et al., 2024 (TRIPOD+AI) | Transparent reporting and validation of AI prediction models | 19 |
Table 6: Selected sources and their relevance to the study. Summary of key references supporting the clinical diagnosis of PAH, imaging-based assessment, multimodal AI integration, model evaluation, and methodological considerations relevant to the present study.
Clinical and translational implications
The findings have potential clinical implications. The multimodal AI model may ultimately serve as an auxiliary screening or triage tool in suspected PAH cases, but the present retrospective study does not establish that it can safely reduce RHC use. Any such application requires prospective validation in an appropriate clinical pathway. The separate AI-derived mPAP output may also warrant further study for longitudinal assessment, but it should not be considered a substitute for invasive hemodynamic measurement.
The multimodal framework encompassed clinically relevant structural and functional variables, such as pulmonary artery diameter, right ventricular area, and tricuspid regurgitation velocity. However, because fold-level attention maps and repeated-run feature-importance outputs were not retained, the present study does not make a quantitative claim regarding stable feature ranking.
Strengths and limitations
The major strengths of this study include its retrospective paired-data design and use of CT, echocardiography, and an invasive reference standard within a short interval. However, the sample size (n = 100), single-center design, and small exploratory subgroups limit generalizability. No external validation cohort was available in the retained materials. In addition, exact historical architectural settings, hyperparameters, preprocessing constants, and training logs were not fully recoverable; therefore, these details were not reconstructed retrospectively. Future work should include transparent model documentation, multicenter external validation, and prospective evaluation before clinical deployment19,25. In addition, reader-level information, blinding status, and repeated independent imaging measurements were not consistently available in the retrospective records; consequently, interobserver reproducibility could not be formally assessed. Prospective validation should incorporate predefined measurement protocols, independent blinded image interpretation, and formal reproducibility analyses.
Future directions
Expanding the dataset to multicenter longitudinal cohorts will enable external validation and facilitate the development of AI-based prognostic models that predict disease progression or treatment response. Incorporating additional modalities, such as cardiac MRI or omics data, may further refine diagnostic precision and mechanistic understanding. Moreover, embedding validated multimodal AI tools into clinical workflow platforms such as picture archiving and communication systems or echocardiography reporting systems could help bridge the gap between research and bedside practice5,27,28.
開示事項
The authors have no conflicts of interest to declare. AI-assisted language editing was used. AI tools were not used to generate or alter patient-level study observations. The authors reviewed and take responsibility for the final scientific content.
Author contributions
Zhen Sun and Fuzhou Liu participated in the collection, assessment, and interpretation of the data and made significant contributions to data interpretation and manuscript preparation. Zhen Sun, Fuzhou Liu provided substantial intellectual input during the drafting and revision of the manuscript.
材料
| 名前 | 会社 | カタログ番号 | コメント |
|---|---|---|---|
| AI Modeling Framework/Deep Learning Platform | TensorFlow 2.15.0 | Used for development of transformer-based fusion architecture, early/intermediate feature fusion, ensemble and self-attention mechanism models, and explainable AI components for PAH diagnosis | |
| Computer Workstation | Dell Technologies | Precision 7875 | Used for imaging data preprocessing, feature extraction, AI model training/validation, data calculation and visualization |
| CT Contrast Agent | GE Healthcare | Omnipaque 350 (100 mL) | Used for contrast-enhanced chest CT to improve visualization of the pulmonary vasculature |
| Multi-detector CT Scanner | Siemens Healthineers | SOMATOM Force | Used for standardized volumetric chest CT acquisition at end-inspiration, to measure main pulmonary artery diameter, right/left ventricular ratio, parenchymal and vascular changes |
| Right Heart Catheterization (RHC) System | Edwards Lifesciences | Swan-Ganz SGPT755P | Invasive gold standard device for definitive PAH diagnosis, used to measure mean pulmonary artery pressure (mPAP), pulmonary capillary wedge pressure (PCWP), and pulmonary vascular resistance (PVR) |
| Statistical Analysis Software | IBM | SPSS Statistics 31.0 | Used for statistical analysis including ROC curve, AUC calculation, McNemar’s test, Bland–Altman analysis, and Clopper–Pearson confidence interval calculation |
| Transthoracic Echocardiography & Doppler Ultrasound System | Mindray | Resona I9 | Used for Doppler-based evaluation of right ventricular systolic pressure, right atrium and ventricle size, tricuspid regurgitation jet velocity (TRJV), and functional measurements |
参考文献
- Humbert, M. et al. 2022 ESC/ERS Guidelines for the diagnosis and treatment of pulmonary hypertension. Eur Heart J. 2022;43(38):3618-3731. doi:10.1093/eurheartj/ehac237.
- Remy-Jardin, M. et al. Imaging of pulmonary hypertension in adults: a position paper from the Fleischner Society. Radiology. 2021;298(3):531-549. doi:10.1148/radiol.2020203108.
- Expert Panel on Cardiac Imaging. ACR Appropriateness Criteria® Suspected Pulmonary Hypertension: 2022 Update. J Am Coll Radiol. 2022;19(11S):S488-S499. doi:10.1016/j.jacr.2022.09.018.
- Kooranifar S, Naghshin R, Sezavar SH, Hajsadeghi S, Talebzadeh SM. Diagnostic value of chest spiral CT scan and Doppler echocardiography compared to right heart catheterization to predict pulmonary arterial hypertension in patients with scleroderma. Acta Biomed. 2021;92(1):e2021074. doi:10.23750/abm.v92i1.9216.
- Kramer T, Kramer M, Hagist C, Spinler S. Artificial intelligence in pulmonary hypertension: a systematic review. Eur J Med Res. 2025;30(1):1225. doi:10.1186/s40001-025-03557-5.
- Gomes, M. T. et al. Signal transduction during metabolic and inflammatory reprogramming in pulmonary vascular remodeling. Int J Mol Sci. 2022;23(5):2410. doi:10.3390/ijms23052410.
- Ahmed, F. et al. Comparative accuracy of artificial intelligence versus manual interpretation in detecting pulmonary hypertension across chest imaging modalities: a diagnostic test accuracy meta-analysis. Front Artif Intell. 2026;8:1709489. doi:10.3389/frai.2025.1709489.
- Milosevic M, Jin Q, Singh A, Amal S. Applications of AI in multi-modal imaging for cardiovascular disease. Front Radiol. 2024;3:1294068. doi:10.3389/fradi.2023.1294068.
- Shen, Y. et al. CT-base pulmonary artery measurement in the detection of pulmonary hypertension: a meta-analysis and systematic review. Medicine (Baltimore). 2014;93(27):e256. doi:10.1097/MD.0000000000000256.
- Denton, C. P. et al. Comparison of Doppler echocardiography and right heart catheterization to assess pulmonary hypertension in systemic sclerosis. Br J Rheumatol. 1997;36(2):239-243. doi:10.1093/rheumatology/36.2.239.
- Li L, Ding W, Huang L, Zhuang X, Grau V. Multi-modality cardiac image computing: a survey. Med Image Anal. 2023;88:102869. doi:10.1016/j.media.2023.102869.
- Devaraj, A. et al. Detection of pulmonary hypertension with multidetector CT and echocardiography alone and in combination. Radiology. 2010;254(2):609-616. doi:10.1148/radiol.09090548.
- van Assen, M. et al. Fusion modeling: combining clinical and imaging data to advance cardiac care. Circ Cardiovasc Imaging. 2023;16(12):e014533. doi:10.1161/CIRCIMAGING.122.014533.
- Ruopp NF, Cockrill BA. Diagnosis and treatment of pulmonary arterial hypertension: a review. JAMA. 2022;327(14):1379-1391. doi:10.1001/jama.2022.4402.
- Karthikeyan N, Swift AJ. Artificial intelligence in the diagnosis of pulmonary hypertension. In: Boucly A, Kovacs G, Condliffe R, eds. Pulmonary Hypertension. Sheffield: European Respiratory Society; 2025:19-33. doi:10.1183/2312508X.10019124.
- Wehbe, R. M. et al. Deep learning for cardiovascular imaging: a review. JAMA Cardiol. 2023;8(11):1089-1098. doi:10.1001/jamacardio.2023.3142.
- Kovacs, G. et al. Definition, classification and diagnosis of pulmonary hypertension. Eur Respir J. 2024;64(4):2401324. doi:10.1183/13993003.01324-2024.
- Simonneau, G. et al. Haemodynamic definitions and updated clinical classification of pulmonary hypertension. Eur Respir J. 2019;53(1):1801913. doi:10.1183/13993003.01913-2018.
- Sharkey MJ, Checkley EW, Swift AJ. Applications of artificial intelligence in computed tomography imaging for phenotyping pulmonary hypertension. Curr Opin Pulm Med. 2024;30(5):464-472. doi:10.1097/MCP.0000000000001103.
- Diller, G. P. et al. A framework of deep learning networks provides expert-level accuracy for the detection and prognostication of pulmonary arterial hypertension. Eur Heart J Cardiovasc Imaging. 2022;23(11):1447-1456. doi:10.1093/ehjci/jeac147.
- Shams, S. M. et al. A clinical support tool using artificial intelligence to diagnose pulmonary hypertension. Eur Respir J. 2026;68(2):2600125. doi:10.1183/13993003.00125-2026.
- Dey, D. et al. Proceedings of the NHLBI Workshop on Artificial Intelligence in Cardiovascular Imaging: translation to patient care. JACC Cardiovasc Imaging. 2023;16(9):1209-1223. doi:10.1016/j.jcmg.2023.05.012.
- Naing, P. et al. Artificial intelligence enhanced contemporary pulmonary hypertension care. Am Heart J Plus. 2025;60:100673. doi:10.1016/j.ahjo.2025.100673.
- Collins, G. S. et al. TRIPOD+AI statement: updated guidance for reporting clinical prediction models that use regression or machine learning methods. BMJ. 2024;385:e078378. doi:10.1136/bmj-2023-078378.
- Moons, K. G. M. et al. PROBAST+AI: an updated quality, risk of bias, and applicability assessment tool for prediction models using regression or artificial intelligence methods. BMJ. 2025;388:e082505. doi:10.1136/bmj-2024-082505.
- Muscogiuri, G. et al. Application of AI in cardiovascular multimodality imaging. Heliyon. 2022;8(10):e10872. doi:10.1016/j.heliyon.2022.e10872.
- Hardacre, C. J. et al. Diagnostic test accuracy of artificial intelligence analysis of cross-sectional imaging in pulmonary hypertension: a systematic literature review. Br J Radiol. 2021;94(1128):20210332. doi:10.1259/bjr.20210332.
- Attaripour Esfahani, S. et al. A comprehensive review of artificial intelligence applications in pulmonary hypertension. Medicina (Kaunas). 2025;61(1):85. doi:10.3390/medicina61010085.