提案された低圧受電自動検収プラットフォームは、モノのインターネット(IoT)、視覚的ワークフローオーケストレーション、エッジおよびクラウドコンピューティング、特徴量エンジニアリング、および機械学習を統合し、低圧(LV)システムの受電試験を自動化します。このプラットフォームにより、インテリジェントな故障検知、リアルタイムの意思決定、自動検収、高精度、低運用レイテンシ、およびスケーラブルな展開が可能になります。
このコンテンツを表示するには、JoVEへの購読が必要です。 または、無料トライアルをお申し込みください。
研究記事
視覚的なワークフロー・オーケストレーションと機械学習バリデーションを備えた、プロセス駆動型の低電圧受入自動化プラットフォーム
この記事について
サマリー
要約
低圧(LV)ネットワークの急速な拡大と、分散型エネルギーリソースとの統合には、インテリジェントで自動化された管理ソリューションが必要です。クラウド・エッジ協調型モノのインターネット(IoT)プラットフォームは、リアルタイムのモニタリング、制御、およびデータ収集をサポートします。しかし、既存のプラットフォームには一般的に、ワークフローの自動化、視覚的なプロセスオーケストレーション、ユーザーガイド付きの意思決定支援、および包括的な検証機能が不足しています。その結果、自動化されたLVネットワークの受入試験に対するプロセス駆動型のソリューションが提供されていません。本研究では、視覚化されたプロセスキャンバスに基づく低圧受入自動化プラットフォームの設計と評価を提示します。提案するプラットフォームは、受入ワークフローを視覚的に作成、管理、および実行するプロセス駆動型アーキテクチャを採用しています。視覚的プロセスキャンバスは、リアルタイムのワークフロー実行、検証、および意思決定を可能にすることで、従来の静的なモニタリングを動的なワークフロー自動化へと変換します。このフレームワークには、電気負荷挙動の現実的なモデリングをサポートするために、Open LV Network & Smart Meterデータセットが組み込まれています。ワークフローには、IoTベースのデータ収集、データの前処理、特徴量エンジニアリング、視覚的プロセスキャンバスを用いたワークフローオーケストレーション、機械学習ベースの検証、およびリアルタイムダッシュボードによる可視化が含まれます。提案したフレームワークは、故障検出率98.4%、受信機動作特性曲線下面積(ROC-AUC)0.968、運用上の意思決定レイテンシ31 msを達成し、従来のクラウド中心およびIoTベースのベースラインアプローチを約30%~40%上回りました。
概要
インダストリー4.0(I4.0)1は、いくつかの新興技術によって実現されており、その中でも産業用モノのインターネット(IIoT)は最も重要な技術の一つです。IIoTとは、産業環境におけるモノのインターネット(IoT)技術の適用を指し、相互接続されたデバイスや機械が主にマシン間通信(M2M)を通じて通信します。産業システムにおける故障は重大な操業損失を招く可能性があるため、IIoTアプリケーションには、従来のIoTシステムよりも大幅に大量のデータを生成しつつ、極めて信頼性の高い通信が求められます2。また、一部の研究では、IIoTをインダストリー4.0と密接に関連した概念として捉えています3。IoT技術は、シームレスなデータ交換を伴うより柔軟なシステムを可能にすることで、従来の階層型アーキテクチャを変革しています4。近年の多くの研究において、既存のIIoTアーキテクチャのレビューが行われ、新たなフレームワーク設計が提案されてきました5,6,7,8,9。こうした進展がある一方で、2つの大きな制限が残っています。第一に、従来のアーキテクチャの欠点を克服するために新しいフレームワークが頻繁に提案されており、その結果、代替モデルの数が増加し、アーキテクチャの多様性と実装の複雑さが増しています。第二に、提案されている多くのアーキテクチャは抽象化レベルが高いため、産業環境への実用的な導入が制限されています10。
文献では、いくつかのIIoTアーキテクチャが報告されている。OPC(Open Platform Communications)標準に基づいたIIoTアーキテクチャが、OPC通信を管理するためのPythonミドルウェアとともに提示されている11。また、7層のIIoTアーキテクチャが提案されているが、実装の詳細および検証実験は提供されていない12。5GとIIoT技術を統合したフレームワークが代表的なユースケースとともに記述されているが、実験的な検証は限定的であった13。インダストリー4.0のための感情設計フレームワークが導入され、その潜在的な影響が議論されたが、実験的な検証は行われていない14。多層IIoTプラットフォームが、通信上の考慮事項に重点を置いて、実際のテストベッドで評価されている15。同様に、室内空気質モニタリングのためのモジュール式IoTフレームワークが提示され、子供のいる84世帯から収集したデータを用いてその性能が評価されている16。
モノのインターネット(IoT)は急速に進化する技術であり、電力セクターへの応用の可能性を大きく秘めています17,18。電力システムのノードにIoT技術を統合することで、スマートグリッド内の電力フローを継続的にリアルタイムで監視し、それを基にした自律的な意思決定を行うことが可能となり、より知的で効率的な発電、送電、配電、運用、および利用が実現します。その結果、これらのインテリジェントなノードによって、電力ネットワーク全体の運用パフォーマンスが向上します19。スマートグリッドの実装において、通信技術は不可欠な要素です。なぜなら、センサーによる測定値と制御信号という2つの主要なカテゴリーの情報を確実に伝送する必要があるからです。また、スマートグリッドのアプリケーションでは、信頼性の高い動作を保証するために、低通信遅延に加えて、適切なサービス品質(QoS)と十分なデータセキュリティが求められます20。
スマートグリッドアプリケーションに適切な通信技術を選択するには、通信間隔、データ伝送速度、および通信コストを考慮する必要があります21。IoT通信ネットワークは通常、ソフトウェア層、セキュリティ層、サービス層、システム層、および接続層で構成されています。接続層における通信プロトコルは、一般的に3つのカテゴリーに分類されます。長距離プロトコルにはLong Range (LoRa) およびNarrowband-IoT (NB-IoT) があり、中距離プロトコルにはWi-Fi、4G/LTE、および5Gが含まれ、短距離プロトコルにはBluetoothおよびZigBeeが含まれます。電力市場の自由化が進むにつれ、気象条件、設備故障、規制変更、およびその他の運用要因が電力サービスのコストに与える影響を評価する上で、負荷予測がより重要になっています。その結果、正確な住宅負荷予測は、スマートグリッド、マイクログリッド、およびスマートビルの運用と監視において不可欠となっています22。
低電圧(LV)ネットワークの信頼性の高い運用は、高い電力品質を維持することにかかっています23。電力品質は、不平衡な運用条件下における電圧調整、電流バランス、および技術的乱れの軽減の有効性によって決定されます24。これらの要因の中でも、相バランスは各相における電圧と電流の均一な分布を決定するため、特に重要です25。相バランスが不十分であると、導体の発熱、電圧偏差、および中性線電流が増加し、その結果、システムの効率と運用の信頼性が低下する可能性があります26。したがって、システムの性能、運用の安定性、および長期的な信頼性を向上させるため、設計プロセスにおいて相バランスを考慮する必要があります。それにもかかわらず、この側面が従来のミニグリッド設計手法に組み込まれることはほとんどありません。
ワークフローオーケストレーションシステムの最近の進歩により、産業用IoT環境におけるイベント駆動型オートメーションと視覚的なプロセス管理の利点が実証されています。それにもかかわらず、配電ネットワークの検証や低圧受電設備の手入れ・受入試験への適用は依然として限定的です。既存の低圧オートメーションシステムの多くは、主にモニタリングや監視制御に焦点を当てており、ワークフロー駆動型の受入管理や自動コンプライアンス検証を調査した研究は比較的少数に留まっています。同様に、機械学習の手法はスマートメーターの異常検知や電力品質評価において大きな注目を集めていますが、これらのアプローチは一般的に、統合されたワークフローオーケストレーションフレームワークのコンポーネントとしてではなく、独立した分析モデルとして開発されています。
近年、スマートビルディング管理およびホームオートメーション向けのさまざまなスマートエネルギーメーターソリューションが提案されています27。参考文献27では、大学レベルの教育的概念をスマートメータリング技術に統合することを実証するために、スマートメーターのプロトタイプが提示されました。開発されたスマートメーターは、エネルギー管理と制御において大きな可能性を示し、双方向のIoT通信を通じてエネルギー消費を削減し、電力会社と消費者の双方に利益をもたらしました。その後、インテリジェントなエネルギー監視をサポートするための、マイクロコントローラーベースのスマートプラグシステムが導入されました28。
提案されたスマートプラグシステムは、Androidベースのグラフィカルユーザーインターフェースを通じて、電力消費量をリアルタイムで表示します。さらに、本デバイスは接続された電気器具の有無を検知することができ、この機能は非侵入型負荷モニタリング(invasive load measurement)と呼ばれます28。実装には、低コストの市販スマートプラグを使用しました。今後の機能拡張として、実効値(RMS)電流、有効電力、無効電力、および電圧と電流の間の位相角のモニタリングを予定しています。先行研究で述べたように、部分的に系統連系された太陽光発電マイクログリッドは、ZigBeeおよびLoRa通信プロトコルを用いてスマートメーターデバイスと情報を交換しており、分散型エネルギーシステムにおけるIoT対応通信の実現可能性が示されています29,30。
従来の配電システム計画の限界に対処するため、工学実務および科学研究は、いくつかの相補的な方向性に沿って進展してきました。一つの研究方向は、立地選定および予備的な資源評価のための地理情報システム(GIS)を用いたハイレベルプランニングに焦点を当ててきました31,32。別の方向性では、導体選定、最適な発電および蓄電容量の決定、ならびに交流(AC)および直流(DC)配電システムの比較評価を含む、個々の構成要素やサブシステムの改善に重点が置かれています33,34,35,36。第三の研究方向では、配電ネットワーク計画、フィーダーのルーティング、およびネットワークトポロジー設計に最適化アルゴリズムを適用しています。最近の開発には、デバイスの配置とネットワーク構成を統合した研究者らのuGridプラットフォームなどのフレームワークが含まれますが、これには検証および最適化のための標準的な潮流解析が欠けています。その他のアプローチでは、トポロジー生成のために手動でのパラメータ調整に依存しているか、あるいは低電力DCマイクログリッドのような特化したアプリケーションに焦点を当てています37,38,39。これらのアプローチは重要な進展を示していますが、低圧配電システムのエンドツーエンド設計のための統合的な手法を確立するには、さらなる取り組みが必要です。さらに、単相、三相、およびハイブリッド低圧システムの包括的な技術経済評価は依然として限定的です。
人工知能(AI)と機械学習の最近の進展により、インテリジェント電力システムの機能はさらに拡大しています。ある包括的なレビューでは、Federated Learning、Generative AI、Large Language Models、Artificial Intelligence of Things(AIoT)、およびDigital Twinsなどの新興技術を含む、スマートグリッドにおけるAIおよび機械学習の応用事例がまとめられています40。このレビューでは、負荷予測、予知保全、異常検知、需要側管理、および電気自動車の統合におけるアプリケーションが強調される一方で、相互運用性、プライバシー、スケーラビリティ、ロバスト性、および倫理的配慮に関する継続的な課題が指摘されています。また、別の最近のレビューでは、IoT-edge-cloudインフラストラクチャにおける分散型エネルギー管理のためのAI手法が評価されており、分散型エネルギー制御のための機械学習、強化学習、およびマルチエージェントシステムに焦点が当てられています41。
総じて、これまでの研究により、低圧(LV)配電システムに向けたIoTベースのモニタリング、スマートメータリング、クラウド・エッジコンピューティング、人工知能、およびインテリジェントエネルギー管理が進展してきました。しかし、これらの技術は大部分が個別に開発されてきました。ワークフローのオーケストレーション、自動受入管理、プロセス駆動型バリデーション、および統合的な意思決定支援は依然として限定的であり、統一されたワークフロー指向の自動化フレームワークの必要性が浮き彫りになっています。
したがって、本研究では、視覚化されたプロセスキャンバスに基づく低圧受電自動検収プラットフォームを提示します。提案されたフレームワークは、IoTベースのデータ収集、データ前処理、特徴量エンジニアリング、ワークフローオーケストレーション、機械学習ベースの検証、クラウドエッジコンピューティング、およびリアルタイム視覚化を統合した単一のアーキテクチャにより、実際のスマートメーターデータを用いた自動的かつ信頼性の高い低圧(LV)ネットワークの検収試験をサポートします。図1に、提案プラットフォームのワークフロー指向アーキテクチャの概要を示します。このワークフローは、データ収集、前処理、特徴量エンジニアリング、ワークフローオーケストレーション、インテリジェントな意思決定、およびクラウドエッジ統合で構成されており、プロセス指向のフレームワークを通じて低圧配電ネットワークの自動検証を可能にします。本プラットフォームは、従来の手法と比較して、運用の意思決定レイテンシとワークフロー実行時間を短縮しつつ、高い検証精度を実証しました。
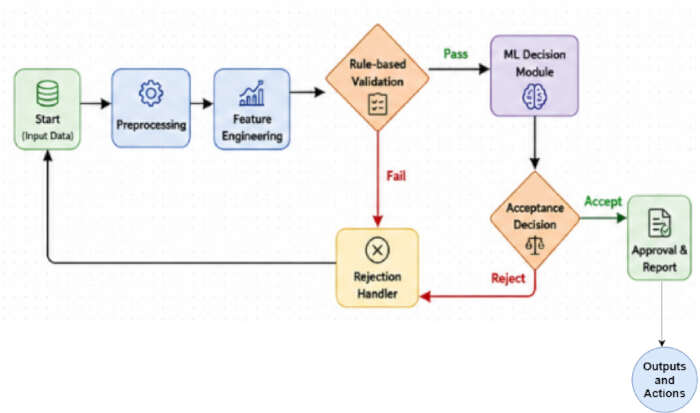
図 1. 提案する低圧受電自動検査プラットフォームのワークフロー指向アーキテクチャ。 提案するプロセス駆動型低圧 (LV) 受電自動検査プラットフォームのハイレベルアーキテクチャ。本フレームワークは、LV配電ネットワークの検証に向けた、IoTベースのデータ収集、データ前処理、特徴量エンジニアリング、ワークフローオーケストレーション、インテリジェントな意思決定、クラウド・エッジ協調、および自動受電検査の逐次的な統合を示している。IoT = Internet of Things、LV = 低圧、ML = 機械学習。 ここをクリックして、この図の拡大版を表示してください。
アクセスが制限されています。このコンテンツを表示するにはログインするか、トライアルを開始してください。
プロトコル
This study did not involve human participants, animals, or identifiable personal data. The analyses were performed using a publicly available dataset (UK Power Networks Open LV Network & Smart Meter dataset) together with synthetically generated data for validation; therefore, ethics committee approval and informed consent were not required. The research tools used in the protocol are listed in the Table of Materials.
1. Data acquisition
The Low-Voltage (LV) Acceptance Automation Platform was developed using electrical measurements acquired from smart meters, IoT sensors, and the Open LV Network & Smart Meter Dataset. Electrical parameters, including voltage, current, active power, reactive power, and energy consumption, were collected through Wi-Fi-, PLC-, and RS-485-based communication protocols. Real-time measurements were used for live system monitoring, whereas historical data supported model development and validation.
The proposed framework used the Open LV Network & Smart Meter Dataset provided by UK Power Networks42. The dataset comprises household smart meter consumption, feeder-level load profiles, and feeder voltage measurements. Time-series subsets containing load consumption and voltage data were selected for model training and evaluation. In addition, a simulated smart meter dataset was generated to represent operational conditions and fault scenarios required for workflow validation and machine learning model evaluation. The simulated dataset included timestamped measurements of voltage, current, active power, reactive power, energy consumption, total harmonic distortion (THD), and voltage imbalance. Fault samples were generated by simulating undervoltage, overvoltage, excessive harmonic distortion, and voltage imbalance based on established low-voltage operational thresholds. The dataset characteristics are summarized in Table 1.
| Attribute | Description |
| Dataset Name | Open LV Network & Smart Meter Dataset |
| Simulated Smart Meter Dataset | Geneated 1000 smaples for Fault simulation and workflow validation |
| Data Type | Time-series (historical smart meter data) |
| Data Granularity | Household-level and feeder-level measurements |
| Key Features | Voltage, current, active power, reactive power, energy consumption, timestamps |
| Data Frequency | High-resolution (e.g., half-hourly / minute-level depending on subset) |
| Coverage | Residential low-voltage distribution networks |
| Usage in Proposed Work | Model training, validation, load behavior analysis, and acceptance workflow evaluation |
Table 1: Dataset description. Summary of the Open LV Network & Smart Meter dataset used for model development and performance evaluation. The table presents the dataset components, measured electrical variables, sampling characteristics, and dataset partitioning for training, validation, and testing.
Because the Open LV Network & Smart Meter Dataset does not contain predefined fault labels, a rule-based labeling strategy was applied to both the real and simulated datasets. Samples satisfying normal operating limits were assigned a label of 0 (Normal), whereas samples exceeding operational thresholds (e.g., voltage deviations greater than ±10% of the nominal voltage, THD > 5%, or voltage unbalance > 2%) were assigned a label of 1 (Fault). These labels served as the ground truth during model training, validation, and testing. The proposed rule engine also allows threshold values to be configured in accordance with regional standards or utility-specific acceptance criteria.
The dataset was partitioned into training (70%), validation (15%), and testing (15%) subsets. Missing values were addressed using linear interpolation, mean imputation, and forward-fill techniques as described in the preprocessing stage. To ensure statistical robustness and reproducibility, all experiments were repeated five times using different random seeds.
2. Data preprocessing
Raw data from the Open LV Network & Smart Meter Dataset and IoT sensor measurements were preprocessed to improve data quality prior to feature extraction and model development. Missing values, noise, and inconsistencies caused by communication interruptions and sensor malfunctions were identified and corrected using interpolation, mean imputation, and forward-fill techniques. The detailed mathematical derivations are provided in Supplementary File 1 (Section S1).
The preprocessed time-series data were segmented into representative operational intervals (S₁–S₅ and Sk). Statistical and electrical features, including average load, peak load, minimum load, standard deviation, voltage deviation, and power consumption, were extracted from each segment. The extracted features are summarized in Table 2 and served as inputs for the subsequent feature engineering stage.
| Segment ID | Mean Load (kW) | Peak Load (kW) | Min Load (kW) | Std Deviation (kW) | Voltage Deviation (p.u.) | Power Consumption (kWh) | Time Interval |
| S₁ | 2.45 | 3.8 | 1.2 | 0.65 | 0.032 | 58.4 | 00:00–01:00 |
| S₂ | 2.9 | 4.1 | 1.5 | 0.72 | 0.028 | 64.2 | 01:00–02:00 |
| S₃ | 3.25 | 4.85 | 1.8 | 0.81 | 0.035 | 71.6 | 02:00–03:00 |
| S₄ | 3.8 | 5.2 | 2.1 | 0.9 | 0.041 | 78.9 | 03:00–04:00 |
| S₅ | 4.1 | 5.75 | 2.4 | 0.95 | 0.045 | 85.3 | 04:00–05:00 |
| Sk | 3.6 | 5.1 | 2 | 0.88 | 0.038 | 76.5 | tk |
Table 2: Representative feature representation extracted from time-series segments. Representative statistical, electrical, load behavior, voltage stability, and power quality features extracted from segmented LV time-series data during feature engineering. The values illustrate the engineered feature representation and are not experimental performance results. LF = Load Factor; PAR = Peak-to-Average Ratio; VSI = Voltage Stability Index; PF = Power Factor; THD = Total Harmonic Distortion.
3. Feature engineering
Feature engineering was performed to improve the representation of the preprocessed data for workflow orchestration and intelligent decision-making. Principal Component Analysis (PCA)^43 was applied to reduce data dimensionality by removing redundant and highly correlated variables while retaining the most informative feature components. The mathematical derivations are provided in Supplementary File 1 (Section S2).
Statistical descriptors, load behavior indicators, voltage stability indices, and power quality metrics were derived from the segmented time-series data. These engineered features included Load Factor (LF), Peak-to-Average Ratio (PAR), Voltage Stability Index (VSI), Voltage Unbalance Index, Power Factor (PF), and Total Harmonic Distortion (THD). The resulting feature set was used as the input to the workflow orchestration and intelligent decision-making modules.
The feature engineering workflow is summarized in Supplementary File 1 (Supplementary Algorithm 1). The procedure consisted of segmenting the preprocessed data, extracting statistical and electrical features, calculating load behavior, voltage stability, and power quality indicators, and applying PCA to generate the final feature vector used for model training and validation.
4. Visualized process canvas design
The Visualized Process Canvas was developed as a graph-based workflow orchestration framework for automating low-voltage (LV) acceptance procedures. The workflow was represented as a directed graph, G = (N, E), where N = {n1, n2, …, nm}denotes the workflow nodes corresponding to individual processing stages (e.g., data input, preprocessing, validation, and decision-making), and E = {eij}represents the directed edges defining the execution sequence between nodes. This graph-based representation enabled the creation of configurable workflows and their automated execution without manual coding.
Each workflow node performed a specific processing task by receiving input data, executing predefined operations, and forwarding the processed output to subsequent nodes. Acceptance criteria, including voltage and load thresholds, were implemented as configurable validation rules that could be updated without modifying the workflow structure. The workflow supported both sequential and parallel execution to improve computational efficiency. Machine learning models were integrated into designated workflow nodes to perform anomaly detection and automated acceptance validation (Figure 2).
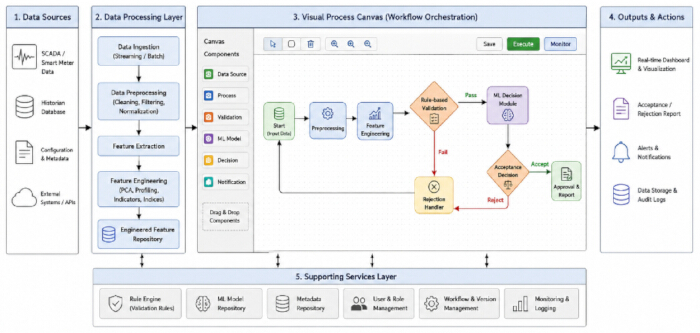
Figure 2: Visualized process canvas architecture for LV acceptance automation. Overview of the visual workflow orchestration framework used for LV acceptance automation. The process canvas illustrates the graphical organization of workflow nodes for data processing, feature engineering, rule-based validation, intelligent decision-making, and output generation to support workflow design, execution, and monitoring. Please click here to view a larger version of this figure.
The mathematical formulation describing information flow through the workflow graph is provided in Supplementary File 1 (Section S3). Supplementary File 1 (Supplementary Algorithm 2) describes the workflow orchestration procedure, including workflow traversal, node execution, rule validation, decision generation, and output aggregation.
The Visualized Process Canvas was implemented using a microservice-oriented software architecture to support scalability and modular deployment. The graphical workflow interface was developed using React.js to provide drag-and-drop workflow configuration. Backend orchestration services were implemented using Flask/FastAPI, while Eclipse Mosquitto served as the MQTT message broker for communication between workflow modules. EdgeX Foundry provided edge device management and IoT integration. Machine learning services were implemented with Scikit-learn, TensorFlow, and PyTorch, and containerized with Docker and Kubernetes.
5. Workflow orchestration engine
The workflow orchestration engine coordinated execution of the configured acceptance workflow. A detailed description is provided in Supplementary File 1 (Section S4), and the execution sequence is summarized in Supplementary Figure 1.
The workflow execution process consisted of validating the workflow definition, initializing the execution environment, scheduling workflow nodes according to their dependencies, executing nodes sequentially or in parallel, applying rule-based validation, aggregating intermediate outputs, and generating the final acceptance or rejection decision based on rule-based and machine learning evaluation. Execution results were published through dashboards, reports, application programming interfaces (APIs), and data storage services. The overall workflow orchestration process is illustrated in Figure 3.
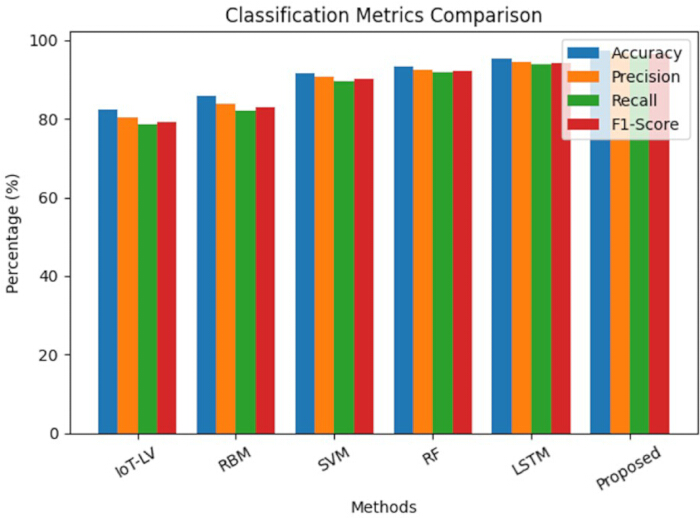
Figure 3: Comparison of classification performance metrics across different methods. Comparison of the classification performance of IoT-LV, RBM, Support Vector Machine (SVM), Random Forest (RF), Long Short-Term Memory (LSTM), and the proposed framework using the Open LV Network & Smart Meter dataset. Performance is evaluated using Accuracy, Precision, Recall, and F1-score. Results are presented as mean ± standard deviation (SD) from five independent experimental runs using a 70%/15%/15% training/validation/testing split. Error bars represent one standard deviation. Please click here to view a larger version of this figure.
6. Intelligent decision module
The Intelligent Decision Module was developed to automate low-voltage (LV) acceptance decisions using supervised machine learning models. Classification and regression algorithms were applied to the engineered feature vectors to support operational decision-making. Classification models identified normal and abnormal operating conditions, whereas regression models estimated future energy consumption and operational trends.
The input feature vector, X ∈ ℝd, comprised the statistical, voltage stability, load behavior, and power quality features extracted during the feature engineering stage. Standalone Support Vector Machine (SVM)44, Random Forest (RF)45, and Long Short-Term Memory (LSTM)46 models were implemented as baseline classifiers for comparative evaluation. The mathematical formulation of the learning models is provided in Supplementary File 1 (Section S5).
For classification, the output variable y ∈ {0,1} represented normal (0) and abnormal (1) operating conditions. When abnormal operating conditions or overload events were detected, the workflow generated a fault notification and flagged the acceptance process as invalid; otherwise, the process was classified as accepted.
The workflow orchestration engine integrated machine-learning predictions with rule-based validation, using a priority-based conflict-resolution strategy. Safety-critical operational rules and regulatory acceptance criteria were treated as hard constraints and therefore took precedence over machine-learning predictions when conflicts occurred. Final acceptance decisions were generated using the combined outputs of the rule-based validation and intelligent decision modules.
7. Cloud–edge integration and visualization dashboard
A cloud-edge computing architecture was implemented to support scalable data processing, storage, and visualization for the LV acceptance automation platform. Smart meters, SCADA systems, and IoT devices continuously collect electrical measurements, which are processed at the edge layer via filtering, normalization, feature extraction, and real-time inference to reduce communication overhead and enable low-latency decision-making. The mathematical derivations are provided in Supplementary File 1 (Section S6).
Processed data were transmitted to the cloud layer for long-term storage, advanced analytics, feature engineering, model training, and model management. Interactive dashboards provided real-time system monitoring, alerts, reporting, and operational decision support. The cloud-edge architecture is illustrated in Supplementary Figure 2, and the implementation details are summarized in Table 3.
| Layer | Component | Hardware / Software | Specification / Version | Purpose / Description |
| Edge Layer | Edge Device | Raspberry Pi 4 / NVIDIA Jetson Nano | Quad-core CPU, 4–8 GB RAM | Real-time data acquisition and local processing |
| IoT Gateway | Industrial IoT Gateway | MQTT / Modbus / OPC-UA support | Communication between sensors and edge/cloud | |
| Sensors / Smart Meters | Digital Smart Meters | Voltage, Current, Power Measurement | Data collection from LV network | |
| Edge Software | Python, EdgeX Foundry, MQTT Broker | Python 3.x | Data preprocessing, filtering, local inference | |
| Communication Protocols | Wi-Fi / PLC / RS-485 | Standard protocols | Data transmission to cloud layer | |
| Cloud Layer | Cloud Platform | AWS / Microsoft Azure / Google Cloud | Scalable cloud services | Data storage, analytics, and model training |
| Storage | AWS S3 / Azure Blob / InfluxDB | Time-series database | Storing historical and real-time data | |
| Compute & ML | Python, TensorFlow, PyTorch, Scikit-learn | ML libraries (latest versions) | Model training, evaluation, deployment | |
| Containerization | Docker, Kubernetes | Latest stable versions | Workflow orchestration and scalability | |
| Data Processing | Apache Spark / Pandas | Distributed processing | Large-scale data analytics | |
| Visualization Layer | Dashboard Tools | Grafana / Apache Superset / Plotly Dash | Web-based tools | Real-time monitoring and visualization |
| Web Framework | React.js / Angular / Flask / FastAPI | Modern web stack | UI development and API integration | |
| Notification System | Email / SMS Gateway / Push Notifications | Twilio / Firebase | Alert generation and communication | |
| API Services | REST APIs | JSON-based communication | Integration between modules |
Table 3: System implementation details. Summary of the hardware configuration, software environment, communication protocols, and cloud–edge computing components used for implementing the proposed LV acceptance automation platform.
アクセスが制限されています。このコンテンツを表示するにはログインするか、トライアルを開始してください。
結果
The performance of the proposed Low-Voltage (LV) Acceptance Automation Platform was evaluated using the Open LV Network & Smart Meter Dataset together with a synthetic smart meter dataset generated to represent additional operating conditions and fault scenarios. The synthetic dataset enabled controlled evaluation of workflow orchestration, intelligent decision-making, and fault detection under abnormal operating conditions. The Open LV Network & Smart Meter Dataset comprised household smart meter measurements, f...
アクセスが制限されています。このコンテンツを表示するにはログインするか、トライアルを開始してください。
ディスカッション
The experimental evaluation demonstrated that the proposed workflow-oriented Low-Voltage (LV) Acceptance Automation Platform consistently outperformed the benchmark approaches in classification, forecasting, fault detection, operational decision latency, and scalability. These performance improvements resulted from the integration of advanced feature engineering, workflow orchestration, cloud-edge collaboration, and hybrid rule-based and machine learning decision-making rather than from the use of a single machine learni...
アクセスが制限されています。このコンテンツを表示するにはログインするか、トライアルを開始してください。
開示事項
著者らは、競合する金銭的または非金銭的な利益がないことを宣言します。
謝辞
The authors thank the UK Power Networks Open Data Portal for providing the publicly available Open LV Network & Smart Meter dataset used in this study. This research received no external funding.
アクセスが制限されています。このコンテンツを表示するにはログインするか、トライアルを開始してください。
材料
| 名前 | 会社 | カタログ番号 | コメント |
|---|---|---|---|
| Apache Spark | Apache Software Foundation | バージョン 3.4+ | 大規模データ解析 |
| Apache Superset | Apache Software Foundation | バージョン 3.x | 分析ダッシュボード |
| Docker Engine | Docker Inc. | バージョン 24.x | アプリケーションのデプロイ |
| Eclipse Mosquitto MQTTブローカー | Eclipse Foundation | バージョン 2.x | データ交換 |
| EdgeX Foundry (Jakarta Release 以降) | LF Edge (Linux Foundation) | ジャカルタ / ジュネーブ版 | エッジデバイス管理 |
| Flask / FastAPI | パレットプロジェクト / Sebastián Ramírez | Flask 2.3+ / FastAPI 0.100+ | バックエンドAPI統合 |
| Grafana | Grafana Labs | バージョン 10.x | 可視化およびモニタリング |
| 産業用IoTゲートウェイ | Advantech / Siemens | ECU-1251 / SIMATIC IOT2040 | センサー・クラウド間通信 |
| IoTセンサ(電圧・電流センサ) | Texas Instruments / Analog Devices | INA219 / ACS712 | リアルタイムネットワークモニタリング |
| Jetson Nano 開発者キット | NVIDIA Corporation | 945-13450-0000-100 | エッジAI推論 |
| Kubernetes | クラウドネイティブコンピューティング財団 (CNCF) | バージョン 1.27+ | ワークフローの拡張性 |
| LSTMモデル(Keras/TensorFlow) | Google (TensorFlow/Keras) | TF 2.12以降に含まれています | 負荷予測および予測分析 |
| PLC(電力線通信)モジュール | STMicroelectronics | ST7580 | スマートグリッド通信 |
| Plotly Dash | Plotly Inc. | バージョン 2.x | インタラクティブな視覚化 |
| Python 3.10 | Python Software Foundation | バージョン 3.10.x | データ処理および解析 |
| PyTorch | Meta AI | バージョン 2.0+ | ディープラーニングの実装 |
| ランダムフォレストアルゴリズム | Scikit-learn | v1.3以降に含まれています | 故障分類 |
| Raspberry Pi 4 Model B (4GB RAM) | Raspberry Pi Foundation | RPI4-MODBP-4GB | エッジ処理 |
| React.js / Angular | Meta / Google | React 18.x / Angular 16+ | ユーザーインターフェースの開発 |
| RS-485トランシーバーモジュール | Maxim Integrated (Analog Devices) | MAX485 | 産業用デバイスの接続性 |
| Scikit-learn | Scikit-learn 開発者 | バージョン 1.3+ | 機械学習モデル |
| サポートベクターマシン (SVM) | Scikit-learn | v1.3以降に含まれています | 分類および検証 |
| TensorFlow | Google LLC | バージョン 2.12+ | モデルトレーニング |
| Twilio / Firebase Cloud Messaging | Twilio Inc. / Google | 該当なし | アラートと通知 |
| Wi-Fiモジュール | Espressif Systems | ESP8266 / ESP32 | データ伝送 |
| XGBoost | DMLC (分散機械学習コミュニティ) | バージョン 1.7+ | インテリジェント意思決定支援 |
参考文献
- Tong L, Zhou J, Li J. IoT-based low-voltage power distribution system management and control platform. Front Energy Res. 2022;10:902715. https://doi.org/10.3389/fenrg.2022.902715
- Babayigit B, Abubaker M. Industrial Internet of Things: A review of improvements over traditional SCADA systems for industrial automation. IEEE Syst J. 2023;18:120–133.
- Nakagawa EY, et al. Industry 4.0 reference architectures: State of the art and future trends. Comput Ind Eng. 2021;156:107241. https://doi.org/10.1016/j.cie.2021.107241
- Ladegourdie M, Kua J. Performance analysis of OPC UA for industrial interoperability towards Industry 4.0. Internet Things. 2022;3:507–525.
- Bader SR, Maleshkova M, Lohmann S. Structuring reference architectures for the industrial Internet of Things. Future Internet. 2019;11:151. https://doi.org/10.3390/fi11070151
- Fun TS, Samsudin A. Recent technologies, security countermeasure and ongoing challenges of industrial Internet of Things (IIoT): A survey. Sensors (Basel). 2021;21:6647. https://doi.org/10.3390/s21196647
- Mirani AA, et al. Key challenges and emerging technologies in industrial IoT architectures: A review. Sensors (Basel). 2022;22:5836. https://doi.org/10.3390/s22155836
- Fraile F, et al. Reference models for digital manufacturing platforms. Appl Sci. 2019;9:4433. https://doi.org/10.3390/app9204433
- Serôdio C, et al. Software and architecture orchestration for process control in Industry 4.0 enabled by cyber-physical systems technologies. Appl Sci. 2024;14:2160. https://doi.org/10.3390/app14052160
- Ungurean I, Gaitan NC. A software architecture for the industrial Internet of Things—A conceptual model. Sensors (Basel). 2020;20:5603. https://doi.org/10.3390/s20195603
- Hsiao CH, Lee WP. OPIIoT: Design and implementation of an open communication protocol platform for industrial Internet of Things. Internet Things. 2021;16:100441. https://doi.org/10.1016/j.iot.2021.100441
- Domínguez-Bolaño T, et al. An overview of IoT architectures, technologies, and existing open-source projects. Internet Things. 2022;20:100626. https://doi.org/10.1016/j.iot.2022.100626
- Sasiain J, et al. Towards flexible integration of 5G and IIoT technologies in Industry 4.0: A practical use case. Appl Sci. 2020;10:7670. https://doi.org/10.3390/app10217670
- Cañas H, et al. A conceptual framework for smart production planning and control in Industry 4.0. Comput Ind Eng. 2022;173:108659. https://doi.org/10.1016/j.cie.2022.108659
- Cabrini FH, et al. Enabling the industrial Internet of Things to cloud continuum in a real city environment. Sensors (Basel). 2021;21:7707. https://doi.org/10.3390/s21227707
- Gabriel MF, et al. Implementation of an IoT architecture for promoting healthy air quality in 84 homes of families with children. Build Environ. 2024;266:112040. https://doi.org/10.1016/j.buildenv.2024.112040
- Silva BN, Khan M, Han K. Internet of Things: A comprehensive review of enabling technologies, architecture, and challenges. IETE Tech Rev. 2018;35:205–220.
- Dhaou ISB, et al. Internet of Things technologies for smart grid. In: Research Anthology on Smart Grid and Microgrid Development. IGI Global; Hershey; 2022. p. 805–832.
- Kondoro A, et al. A low latency secure communication architecture for microgrid control. Energies. 2021;14:6262. https://doi.org/10.3390/en14196262
- Tightiz L, Yang H. A comprehensive review on IoT protocols' features in smart grid communication. Energies. 2020;13:2762. https://doi.org/10.3390/en13112762
- Kondoro A, et al. Real-time performance analysis of secure IoT protocols for microgrid communication. Future Gener Comput Syst. 2021;116:1–12.
- Rodrigues R, et al. A review of solid-state circuit breakers. IEEE Trans Power Electron. 2020;36:364–377.
- IEEE. IEEE Std 1159-2019: IEEE recommended practice for monitoring electric power quality. IEEE; Piscataway (NJ); 2019. https://doi.org/10.1109/IEEESTD.2019.8800097
- Otcenasova A, et al. The influence of power quality indices on active power losses in a local distribution grid. Energies. 2019;12:1389. https://doi.org/10.3390/en12071389
- Ma K, et al. Review of distribution network phase unbalance: Scale, causes, consequences, solutions, and future research direction. CSEE J Power Energy Syst. 2020;6:479–488.
- Peppanen J, et al. Modeling power electronic equipment to improve distribution feeder current and voltage balance [Presentation]. Presented at: IEEE PES Transmission and Distribution Conference and Exposition (T&D); Denver, CO; 2018. Available from: https://ieeexplore.ieee.org/ https://doi.org/10.1109/TDC.2018.8440261
- Sayed S, et al. Design and realization of an open-source and modular smart meter. Energy Sci Eng. 2019;7:1405–1422.
- Satapathy LM, et al. Arduino based home automation using Internet of Things (IoT). Int J Pure Appl Math. 2018;118:769–778.
- Shaban M, et al. Design of a partially grid-connected photovoltaic microgrid using IoT technology. Appl Sci. 2021;11:11651. https://doi.org/10.3390/app112411651
- Shaban M, Dhaou IB. Design of an IoT-enabled microgrid architecture for a partial grid-connected mode [Presentation]. Presented at: 18th International Multi-Conference on Systems, Signals and Devices (SSD); Virtual; 2021. Available from: https://ieeexplore.ieee.org/ https://doi.org/10.1109/SSD52085.2021.9429443
- Taye BZ, et al. Rural electrification planning using geographic information system (GIS). Cogent Eng. 2020;7:1836730. https://doi.org/10.1080/23311916.2020.1836730
- Huld T, et al. Geospatial analysis of photovoltaic mini-grid system performance. Energies. 2017;10:218. https://doi.org/10.3390/en10020218
- Domínguez J, et al. IntiGIS-Local: A geospatial approach to assessing rural electrification alternatives for sustainable socio-economic development in isolated communities—A case study of Guasasa, Cuba. Energies. 2024;17:3835. https://doi.org/10.3390/en17153835
- Tafula JE, et al. Multicriteria decision-making approach for optimum site selection for off-grid solar photovoltaic microgrids in Mozambique. Energies. 2023;16:2894. https://doi.org/10.3390/en16062894
- Isihak S, et al. Evolution of GIS-based rural electrification planning models and an application of OnSSET in Nigeria. Renew Sustain Energy Transit. 2022;2:100019. https://doi.org/10.1016/j.rset.2022.100019
- Korkovelos A, et al. The role of open access data in geospatial electrification planning and the achievement of SDG7: An OnSSET-based case study for Malawi. Energies. 2019;12:1395. https://doi.org/10.3390/en12071395
- Cicilio P, et al. uGrid: Reliable minigrid design and planning toolset for rural electrification. IEEE Access. 2019;7:163988–163999.
- Nasir M, et al. Optimal planning and design of low-voltage low-power solar DC microgrids. IEEE Trans Power Syst. 2018;33:2919–2928.
- Vai V, et al. Optimal low-voltage distribution topology with integration of PV and storage for rural electrification in developing countries: A case study of Cambodia. J Mod Power Syst Clean Energy. 2020;8:531–539.
- Banad Y, Sharif S, Rezaei Z. Artificial intelligence and machine learning for smart grids: from foundational paradigms to emerging technologies with digital twin and large language model-driven intelligence. Energy Convers Manag X. 2025;28:101329. https://doi.org/10.1016/j.ecmx.2025.101329
- Álvarez-López C, González-Briones A, Li T. Explainable AI and multi-agent systems for energy management in IoT-edge environments: a state-of-the-art review. Electronics. 2026;15(2):385. https://doi.org/10.3390/electronics15020385
- UK Power Networks. Open data portal [Online]. Available from: https://www.ukpowernetworks.co.uk/our-company/open-data-portal (Accessed June 2026).
- Jolliffe IT. Principal Component Analysis. 2nd ed. Springer; New York; 2002. https://doi.org/10.1007/b98835
- Cortes C, Vapnik V. Support-vector networks. Mach Learn. 1995;20:273–297.
- Breiman L. Random forests. Mach Learn. 2001;45:5–32.
- Hochreiter S, Schmidhuber J. Long short-term memory. Neural Comput. 1997;9:1735–1780.
- Fawcett T. An introduction to ROC analysis. Pattern Recognit Lett. 2006;27:861–874.
- Montgomery DC, Runger GC. Applied Statistics and Probability for Engineers. 8th ed. John Wiley & Sons; Hoboken (NJ); 2020.
- Montgomery DC. Design and Analysis of Experiments. 10th ed. John Wiley & Sons; Hoboken (NJ); 2020.
アクセスが制限されています。このコンテンツを表示するにはログインするか、トライアルを開始してください。