本研究は、Qiming Granule (QMG) が腸-網膜軸を調節することにより、糖尿病網膜症 (DR) を改善することを実証しています。QMGは腸内細菌叢を再構築し、全身性炎症を抑制し、CMKLR1を中心とする調節ネットワークを回復させることで、網膜の組織病理学的損傷を改善しました。これらの知見は、QMGがDRに対する有望な腸-網膜治療戦略となることを示唆しています。
この記事について
サマリー
要約
糖尿病網膜症(DR)は、慢性的な高血糖と全身性炎症によって引き起こされる神経血管合併症であり、近年、腸-網膜軸が重要ながらも十分に活用されていない治療標的であることが明らかになってきています。本研究では、啓明顆粒(QMG)が腸-網膜軸を調節することにより、DRに対して保護効果を発揮するかどうかを検討しました。C57BL/6マウスをランダムに実験群に分け、異なる介入を行いました。網膜の組織病理学的変化は、ヘマトキシリン・エオジン(HE)染色によって評価しました。血清中の炎症性サイトカイン(IL-1β、IL-6、TNF-α)レベルは、酵素結合免疫吸着法(ELISA)により測定しました。網膜および結腸組織における主要な調節タンパク質(CMKLR1、Wnt5a、PPAR-γ、AP-1、TP53)の発現は、ウェスタンブロッティング(WB)により検出しました。腸内細菌叢の組成と多様性は、フルレングス16S rDNAシーケンシングにより特徴付けました。腸内細菌叢と炎症因子または主要タンパク質との関係を評価するために、相関分析を行いました。QMG投与は、網膜の層構造の回復、網膜神経節細胞数の部分的な回復(P < 0.001)、および網膜薄層化の改善(P < 0.01)によって示されるように、網膜の組織病理学的異常を改善しました。また、血清中のIL-1β、IL-6、およびTNF-αレベルを有意に低下させました(P < 0.0001)。腸-網膜軸において、QMGは主要な調節タンパク質、特にCMKLR1を中心としたネットワーク(Wnt5a、PPAR-γ、AP-1、TP53)の異常発現を是正しました。さらに、QMGは腸内細菌叢の組成、多様性、および機能を回復させ、相関分析により、QMGが全身性炎症とこれらの調節タンパク質を結合させて腸-網膜軸を調節することが明らかになりました。 本研究は、QMGが腸-網膜軸を介してCMKLR1を中心とする調節ネットワーク(Wnt5a、PPAR-γ、AP-1、およびTP53を含む)と全身性炎症を結合させることでDRを改善するという予備的な薬理学的根拠を提供し、QMGがDRに対する有望な腸-網膜治療戦略であることを示しています。
概要
糖尿病網膜症(DR)は、糖尿病(DM)の最も一般的な微小血管合併症の一つであり、世界中の労働年齢層の成人における失明の主要な原因となっています1。世界的に、DRはDM患者の約20~30%に影響を及ぼします2。慢性的高血糖は、神経血管カップリングの障害、炎症反応の亢進、および酸化ストレスを含む一連の病理的イベントを誘発することで、DRの病態を進行させます3。最近では、網膜症を伴う糖尿病患者において、網膜症を伴わない患者と比較して、腸内細菌叢の多様性と組成に変化があることが観察されています4,5。その結果、腸の恒常性と網膜の健康を結ぶ双方向の通信ネットワークである「腸-網膜軸」が、DR進行の新たな寄与因子として浮上しています。しかし、腸-網膜信号を網膜病理へと変換する具体的な分子媒介物質は依然としてほとんど解明されておらず、信頼性の高いバイオマーカーや治療標的の特定を制限しています。
腸–網膜軸は、免疫学的、代謝的、神経内分泌的、および血管経路を通じて、腸内細菌叢およびその代謝産物と網膜組織との間の複雑な双方向通信ネットワークを規定しており、それによって恒常性維持を調節しています6。分子レベルでは、腸–retina軸は、主要なストレス応答性および細胞運命決定タンパク質、具体的にはAP-1およびTP53の調節不全によって特徴付けられます7,8,9。さらに、主要なケモカイン受容体であるCMKLR1が、内皮機能不全および代謝調節不全の主要な媒介因子として現れ、腸内細菌叢の変化と糖尿病網膜症の病態形成との間の重要な連結を確立しています10。重要なことに、Wntシグナル伝達は、網膜血管の恒常性と腸上皮バリア機能の維持において二重の調節的役割を担っており11、一方でPPARシグナル伝達は、眼組織と腸組織の両方における炎症反応および代謝プロセスのマスターレギュレーターとして機能しています12,13。これらの分子因子は、腸–網膜軸内において相互に連結したシグナリングネットワークを共同で構成しており、糖尿病関連合併症に対する新たなメカニズム的な洞察と治療の機会を提示しています。したがって、この軸に沿った構造的および機能的な変化を標的にすることは、DRを管理するための有望な戦略となります。
伝統的な中医学(TCM)は、歴史的に糖尿病および関連する網膜症の治療において重要な役割を果たしており、その治療方針は証(しょう)の鑑別に的に基づいて決定されています。14Qiming Granule(QMG)は、以下の成分で構成されています。 Astragalus membranaceus、Pueraria lobata、Rehmannia glutinosa、Lycium barbarum、Senna obtusifolia、Leonurus japonicus、Typha angustifolia および Whitmania pigraは、糖尿病網膜症(DR)の治療に広く適用されています。中国国家薬品監督管理局の承認(承認番号:Z20090036)を受け、QMGは臨床試験を完了し、販売承認を得ています。QMGは、網膜毛細血管における基底膜の肥厚を防ぐことで、保護効果を発揮します。 ペリサイトおよび網膜微小血管への損傷を軽減し、眼の局所的な病理学的形態を維持すること15これにより、DRへのアプローチとして有望な治療法となります。QMGの有効成分は、主要なタンパク質および炎症因子を標的とすることで、~を及ぼします。 抗炎症作用、抗酸化作用、および抗アポトーシス作用を有し、~の調節に関する機序的根拠を提供する 腸–網膜軸16これらの特性は、QMGが腸・網膜軸を調節し得る機序的な根拠となるが、この関連性を探究した研究は少ない。したがって、本研究では、腸・網膜軸を調節するQMGの有効性を検証し、DRにおける治療への可能性を裏付ける実験的根拠を提示することを目的とする。
本研究では、理論的な予測とin vivoの実験データを結びつけ、腸–網膜軸の調節におけるQMGの有効性を検証した。これらの知見は、QMGが腸–網膜軸を介して全身性炎症をCMKLR1を中心とした調節ネットワーク(Wnt5a、PPAR-γ、AP-1、およびTP53を含む)と結合させることでDRを改善することを示しており、QMGがDRに対する有望な腸–網膜標的治療戦略となることを位置づけている。グラフィカルアブストラクトは図1に示されている。
プロトコル
すべての動物実験はARRIVEガイドラインに準拠して実施されました。本研究は、Sichuan Scientist Biotechnology Co., Ltd.の倫理審査委員会によって承認されました(IACUC ISSUE SYST-2024-011)。 研究デザインをまとめた詳細な実験タイムラインを、以下に示します。 補足図1.
動物の調製および処置
マウスを2%イソフルラン吸入により深く麻酔した。深い麻酔下で、後眼窩血採血により血液を採取した。採血後直ちに、網膜組織を回収するために眼球を摘出した。続いて、安楽死を確実にするため、深い麻酔下で頸椎脱臼を行った。その後、直ちに結腸組織を摘出した。 有害事象を示した動物は速やかに研究から除外され、適切な獣医学的処置を受けた。
ランダム化と盲検化
週齢5週、体重20~30gのC57BL/6系統の雄マウスを、温度および湿度を厳密に制御した条件下で飼育した。1週間の馴化期間の後、コンピュータで生成した乱数を用いて、C57BL/6マウスを3群(ブランク群、モデル群、介入群)にランダムに割り当てた。ランダム化のシーケンスは、動物の取り扱いやアウトカム評価に関与しない研究者によって作成された。
盲検化を確実にするため、すべての動物飼育、薬剤投与、およびデータ収集は、群の割り当てを知らされていない研究者によって行われました。コード化された群の割り当ては、すべての実験および統計解析が完了した後にのみ開示されました。盲検化は、経口投与を行う技術者、網膜組織学を評価する病理学者、およびWestern blot(WB)バンドを定量化する解析者に適用されました。
サンプルサイズの計算
サンプルサイズは、同一の実験条件下で網膜神経節細胞(RGC)数を評価した予備実験に基づいて決定されました。両側有意水準(α)を0.05、統計的検出力(1-β)を0.80と仮定し、モデル群と介入群の間でRGC数に臨床的に意味のある差を検出するために、1群あたり最低5匹のマウスが必要であると算出されました。約20%の脱落率を考慮し、各群のマウス数は6匹に設定されました。
糖尿病動物モデルの作製
空白群には標準食を投与し、介入群およびモデル群には4週間にわたって高脂肪・高糖質食(HFHSD)を投与した。この食事期間の後、介入群およびモデル群に1%ストレプトゾトシン(STZ)溶液を35 mg/kgの用量で腹腔内投与した17,18,19,20。投与から72時間後、非空腹時血糖値が16.7 mmol/Lを超えたマウスをDMモデルの導入成功とみなし、さらなる実験のために選出した。DM動物にはさらに4か月間高脂肪・高糖質食を継続させ、空白群は引き続き標準食を維持させた。
分類学的検証および品質評価
QMGに含まれる8つの成分は、Modernized Plant Names Search (MPNS, http://mpns.kew.org/mpns-portal/)を用いて分類学的に検証されました。QMGの組成報告の質は、ConPhYMPツールを用いて評価されました。
投与方法
介入群の動物にはQMGを経口投与した。QMGはZhejiang Sansheng Mandi Pharmaceutical Co., Ltd.(中国国家薬品承認番号 Z20090036)から購入した。QMG懸濁液は、QMGを蒸留水で均一に混合して調製した。 介入群のマウスには、モデル群およびブランク群と同量の懸濁液を経口投与(ゾンド投与)した。投与量は、FDAおよびReagan-Shaw21が推奨する体表面積(BSA)標準化法を用い、成人60 kgあたり4.5 gという臨床単回治療量(市販製剤の標準単位用量)に基づいて算出した。成人(Km = 37)とマウス(Km = 3)の間の換算係数は12.33であり、その結果、マウスへの投与量は体重1 kgあたり0.9 gとなった。モデル群およびブランク群には、同量の生理食塩水を経口投与した。投与は、3ヶ月間にわたり、毎日午前9時から午前11時の間に行った。
観察および試験指標
一般的なバイタルサインのモニタリング
治療的介入を包括的に評価し、潜在的な合併症を検出するために、体重、血糖値、水分および食物摂取量、尿量、活動レベルと行動、体温、ならびに被毛および皮膚の状態を含む、一般的なバイタルサインおよび生理学的指標を系統的に観察し、記録した。
HE染色分析による網膜の形態学的変化の観察
すべての検体は、固定後、一連のエタノールおよびキシレン溶液を用いた自動脱水機で処理し、その後パラフィンに埋め込んだ。続いて、4 µmのパラフィン切片を作成し、HE染色を行い、中性粘着剤で封入した。網膜画像は3DHISTECH Pannoramic SCANスキャナーを用いてスキャンした。画像解析およびデータ測定にはImage-Pro Plusを使用した。
ELISA分析による血清IL-6、TNF-α、およびIL-1βの検出
血球サンプルは後眼窩脱出法により採取した。血清は 1,000 × g 、4 °C で 15 分間遠心分離して分離し、分析まで -80 °C で保存した。IL‑1β、IL‑6、および TNF‑α の血清レベルは、試薬の平衡化、サンプルの添加、インキュベーション、洗浄、コンジュゲートおよび基質の添加、反応停止、吸光度測定、および標準曲線に基づく濃度算出を含む標準手順に従って測定した。吸光度はマイクロプレートリーダーを用いて 450 nm で読み取り、サイトカイン濃度は標準曲線を用いて算出した。
WB解析による網膜および結腸における主要調節タンパク質の検出
3つの独立した生物学的反復試行を単一のメンブレン上で行い、標的タンパク質に対して順次プローブした。すべての反復試行は、同時に犠牲にした単一の動物コホートから得られたものである。標的タンパク質の分子量がGAPDHの分子量に近すぎた場合、<(5 kDaの差があるため)、シグナルの重なりを防ぐために独立した膜で解析した。正確な定量を行うため、各膜では標的タンパク質またはGAPDHのいずれかのみをプローブした。一次抗体として以下を使用した:GAPDH ポリクローナル 抗体(1:5000)、CMKLR1ポリクローナル抗体(1:1000)、Wnt5aポリクローナル抗体(1:1000)、TP53ポリクローナル抗体(1:1000)、AP-1モノクローナル抗体(1:5000)、およびPPARガンマ(PPAR-γ)ポリクローナル抗体(1:1000)。細胞溶解後、遠心分離を行うことで全タンパク質を回収した。タンパク質濃度を測定した。 BCA法を用いて定量した。抽出したタンパク質を12%分離ゲルのSDS-PAGEで分離し、その後メンブレンに転写した。メンブレンを5%脱脂粉乳を含むTBSTでブロッキングし、適切な一次抗体とともに一晩、以下の温度でインキュベートした。 4 °C洗浄後、メンブレンを10,000倍に希釈したHRP標識抗ウサギまたは抗マウス二次抗体とともにインキュベートした。最後に、化学発光イメージングによりタンパク質バンドを可視化し、解析した。可視化およびデータ処理において、不要な分子量領域を除去するためにブロットを水平方向にクロッピングしたが、レーン間の領域は除去せず、すべてのサンプルレーンを保持した。不要なゲル領域を除去するためのクロッピング時に、エッジ部分にわずかな歪みが生じている場合がある。
16S rDNAシーケンシング解析による腸内細菌叢の検出
最終処置の前に、各マウスから新鮮な糞便サンプルを採取した。マウスを個別に滅菌ケージに10–15分間入れ、自然排便を促した。糞便ペレットを滅菌鉗子で直ちに回収し、滅菌済みの1.5 mLチューブに移し、液体窒素で急冷後、DNA抽出まで-80 °Cで保存した。交差汚染を最小限に抑えるため、すべての操作は滅菌条件下で行った。微生物組成の整合性を確保するため、排便から凍結までの間隔は10分以内に維持した。糞便ゲノムDNA(gDNA)サンプルをFecal gDNA extraction kitを用いて精製し、次いでユニバーサルプライマー8F (5’-AGAGTTTGATCATGGCTCAG-3’)および1492R (5’-CGGTTACCTTGTTACGACTT-3’)を用いたポリメラーゼ連鎖反応(PCR)により、16S rDNA遺伝子の全長増幅を行った。PCR産物をアガロースゲル電気泳動で分析し、精製および定量して、後続のアプリケーションに使用した。ハイスループットシーケンシングは、Nanopore GridIONシーケンサーを用いて実施した。データ解析プロセスには、ベースコーリング、データ品質管理、種アノテーション、系統樹構築、コミュニティ解析、AlphaおよびBeta多様性解析、そして 差分的に豊富に存在する種の解析およびコミュニティ機能予測が含まれる。解析には、NanoFilt、Usearch、Rプログラミング言語、Python、およびSILVAデータベースなどのさまざまなツールとデータベースを利用した。
腸-網膜軸と全身性炎症および多層的な腸内細菌叢の相関分析
多レベルの腸内細菌叢と血清炎症性サイトカインおよび主要な調節タンパク質との潜在的な関連性を探索するため、Luoning Bio-Cloudプラットフォームを用いて相関分析を実施した。まず、シークエンシング結果から、界、門、綱、目、科、属、種の各レベルにおける種豊富度データを抽出した。血清炎症性サイトカインおよびタンパク質発現レベルを含む物理化学的因子を、環境因子ファイルにまとめた。相関の信頼性と可視化を確保するため、微生物の豊富度と臨床測定単位の間のスケールの差を排除するようにデータの正規化を行った。相関係数(R値)および対応する有意水準(P値)を算出した。結果は相関ヒートマップを用いて可視化し、色のグラデーションで相関の強さと方向を示し(赤は正の相関、青は負の相関を表す)、アスタリスク(**)で統計的有意性(P < 0.01)を示した。
統計手法
すべての統計解析および視覚化はGraphPad Prismを用いて行われた。平均値の比較には、正規分布に従うデータに対してt検定を用いた。データが正規分布から逸脱している場合は、Kruskal-Wallis検定を使用した。変数間の関係については、SpearmanまたはPearsonの相関分析を行った。すべての統計検定は両側検定として実施し、統計的有意水準は0.05とした。
結果
General situation of experimental animals
Blood glucose levels were significantly elevated in the model group (27.21 ± 6.03 mmol/L) compared with the blank group (P < 0.001), indicating the successful induction of the DM model. During the study period, the experimental animals showed stable body weight, continuous water and food intake, normal urine output, body temperature, healthy fur and skin condition, and normal behavior during the experiment.
Composition and validation of QMG
QMG, a proprietary Chinese medicine that passed Phase III clinical trials, encompasses Astragalus membranaceus (Fisch.) Bunge [Fabaceae, Astragali radix], Pueraria lobata (Willd.) Ohwi [Fabaceae, Puerariae lobatae radix], Rehmannia glutinosa (Gaertn.) Libosch. Ex Fisch. & C.A. Mey. [Orobanchaceae; Rehmanniae radix], Lycium barbarum L. [Solanaceae; Lycii fructus], Senna obtusifolia (L.) H.S. Irwin & Barneby [Fabaceae; Cassiae semen], Leonurus japonicus Houtt. [Lamiaceae, Leonuri herba], Typha angustifolia L. [Typhaceae; Typhae pollen], Whitmania pigra Whitman [Hirudinidae; Hirudo]15. The detailed information, including the Chinese name, scientific name by MPNS validation, species, family, part used, representative bioactive compounds, was summarized in Table 1, which defined the QMG and provided a transparent, scientifically grounded basis for the formulas under investigation.
| No. | Chinese name | Scientific name by MPNS validation | Species | Family | Part Used | Representative bioactive compounds | |||||||
| 1 | HuangQi | Astragalus membranaceus (Fisch.) Bunge [Fabaceae, Astragali radix] | Astragalus mongholicus (Fisch.) Bunge | Fabaceae | Radix | Astragaloside IV, Calycosin | |||||||
| 2 | GeGen | Pueraria lobata (Willd.) Ohwi [Fabaceae, Puerariae lobatae radix] | Pueraria lobata (Willd.) | Fabaceae | Radix | Puerarin, Daidzin | |||||||
| 3 | DiHuang | Rehmannia glutinosa (Gaertn.) Libosch. Ex Fisch. & C.A. Mey. [Orobanchaceae; Rehmanniae radix] | Rehmannia glutinosa (Gaertn.) Libosch. Ex Fisch. & C.A. Mey. | Orobanchaceae | Radix | Catalpol, Rehmannioside D | |||||||
| 4 | GouQiZi | Lycium barbarum L. [Solanaceae; Lycii fructus] | Lycium barbarum L. | Solanaceae | Fructus | Lycium barbarum polysaccharides, Betaine | |||||||
| 5 | JueMingZi | Senna obtusifolia (L.) H.S. Irwin & Barneby [Fabaceae; Cassiae semen] | Senna obtusifolia (L.) H.S. Irwin & Barneby | Fabaceae | Semen | Aurantio-obtusin, Emodin | |||||||
| 6 | Chong WeiZi | Leonurus japonicus Houtt. [Lamiaceae, Leonuri fructus] | Leonurus japonicus Houtt. | Lamiaceae | Fructus | Stachydrine, Leonurine | |||||||
| 7 | PuHuang | Typha angustifolia L. [Typhaceae; Typhae pollen] | Typha angustifolia L. | Typhaceae | Pollen | Isorhamnetin, Kaempferol | |||||||
| 8 | ShuiZhi | Whitmania pigra Whitman [Hirudinidae; Hirudo] | Whitmania pigra Whitman | Hirudinidae | Body | Hirudin, Calin | |||||||
Table 1: The composition and quality information of QMG ingredients. Detailed information on the composition and quality information of QMG ingredients, including the Chinese name, scientific name by MPNS validation, species, family, part used, and representative bioactive compounds.
QMG ameliorates the retinal morphology
As depicted in Figure 2A, the retina of the blank group exhibited a well-organized structure. The cellular arrangement was dense and orderly across all layers, with no evidence of structural disruption, exudation, or inflammatory infiltration. Compared with the blank group, retinal sections from the model group (Figure 2B) exhibited marked structural disorganization, characterized by disordered cellular arrangement, a significant reduction in RGC counts (P < 0.0001, Table 2, Figure 3A), and pronounced thinning of the total retinal thickness (P < 0.0001, Figure 3B). Notably, neovascular tufts penetrating the inner limiting membrane were observed (indicated by a red arrow), confirming successful establishment of the DR model. In contrast, the intervention group (Figure 2C) demonstrated significant attenuation of histopathological abnormalities relative to the model group, as evidenced by restoration of retinal laminar architecture, partial recovery of RGC numbers (P < 0.001, Table 2, Figure 3A), and reversal of retinal thinning (P < 0.01, Table 2, Figure 3B). These data provide strong evidence for QMG as an effective intervention for DR.
QMG attenuates systemic inflammatory response in DR
Compared with the blank group, the expression levels of IL-1β, IL-6, and TNF-α were significantly upregulated in the model group (P < 0.0001), confirming that the modeling procedure successfully induced a marked inflammatory response. Conversely, compared with the model group, the expression levels of IL-1β, IL-6, and TNF-α were significantly downregulated in the intervention group (p < 0.0001), indicating a potent inhibitory effect of QMG on systemic inflammation. The serum concentrations of IL-1β, IL-6, and TNF-α across the three groups are summarized in Table 3 and illustrated in Figure 4A–C.
QMG modulates the CMKLR1-centered regulatory network along the gut–retina axis
As shown in Figure 5, Figure 6, Figure 7, and Supplementary Figure 2, the results of this study showed that in DR model mice, the expression levels of five key regulatory proteins—AP-1, Wnt5a, CMKLR1, TP53, and PPAR-γ—exhibited a consistent downward trend in both colonic and retinal tissues. Following QMG intervention, the expression of these proteins showed varying degrees of recovery, with some proteins reaching statistical significance. Specifically, after QMG intervention, the expression of AP-1, Wnt5a, and CMKLR1 in colonic tissue was significantly higher than that in the model group (P < 0.05), while in retinal tissue, the expression of CMKLR1 and TP53 was significantly higher than that in the model group (P < 0.01). These findings may suggest that AP-1 and Wnt5a are more sensitive responders in the colon, whereas TP53, as an apoptosis regulator, plays a more critical role in retinal neuroprotection. Notably, CMKLR1 was the only protein that achieved significant recovery in both tissues, indicating that QMG may facilitate bidirectional communication along the gut–retina axis through systemic regulation of CMKLR1 expression.
The consistent directionality of expression changes for these five proteins in both colonic and retinal tissues holds important biological significance. As the primary habitat of the gut microbiota, changes in colonic protein expression reflect the state of the intestinal microenvironment, while the retina is the effector organ of DR. The consistency of expression patterns between these two tissues strongly supports the gut–retina axis as an important participant in the pathophysiological processes of DR.
QMG restores and improves the composition, diversity, and function of gut microbiota
The results of the community composition
Hierarchical clustering analysis revealed distinct shifts in gut microbial composition and clustering at multiple taxonomic levels following QMG intervention. At the phylum level (Figure 8A), the model group exhibited a marked reduction in Firmicutes abundance and a significant enrichment of Bacteroidetes compared with the blank group, indicating a diabetes-driven shift in the Firmicutes/Bacteroidetes ratio; notably, the intervention restored the proportions of both Firmicutes and Bacteroidetes to levels approaching those of the blank group, accompanied by an elevated relative abundance of Proteobacteria. At the class level (Figure 8B), the model group manifested an elevation in Bacteroidia and Clostridia and a lessening in Bacilli and Erysipelotrichia compared with the blank group; in contrast, the intervention group showed restoration in Bacteroidia and Erysipelotrichia to levels approaching those of the blank group, accompanied by elevated relative abundance of Clostridia and Alphaproteobacteria. At the order level (Figure 8C), the model group demonstrated an elevated proportion of Bacteroidales, and a decreased proportion of Erysipelotrichales and Lactobacillales compared with the blank group; conversely, the intervention group restored the proportions of Bacteroidales and Erysipelotrichales to levels approaching those of the blank group, accompanied by an elevated relative abundance of Clostridiales. At the family level (Figure 8D), the model group presented a growth in Odoribacteraceae, Peptostreptococcaceae, Rikenellaceae, and Tannerellaceae, and a decrease in Erysipelotrichaceae, Lactobacillaceae, Muribaculaceae, and Ruminococcaceae compared with the blank group; in contrast, the intervention group downregulated the proportions of Odoribacteraceae and Peptostreptococcaceae compared with the model group; restored the proportions of Erysipelotrichaceae and Ruminococcaceae to levels approaching those of the blank group, accompanied by an elevated relative abundance of Lachnospiraceae. At the genus level (Figure 8E), the model group exhibited an upward trend in Odoribacter, Paeniclostridium, Alistipes, Parabacteroides, and Clostridioides, and a decrease trend in Lactobacillus, Faecalibaculum, Ruminococcus, Bacteroides, and Muribaculum compared with the blank group; notably, the intervention group downregulated the proportions of Odoribacter, Clostridioides, and Paeniclostridium compared with the model group; restored the proportions of Faecalibaculum and Ruminococcus to levels approaching those of the blank group; and increased the relative abundance of Lachnoclostridium, Sphingomonas, Flavonifractor, and Blautia. At the species level (Figure 8F), the model group showed an increase in Odoribacter splanchnicus, Clostridioides difficile, and Paeniclostridium sordellii, and a decrease in Faecalibaculum rodentium, Bacteroides salanitronis, Muribaculum intestinale compared with the blank group; in contrast, the intervention group downregulated the proportion of Odoribacter splanchnicus and Clostridioides difficile compared with the model group; restored the proportions of Faecalibaculum rodentium, and Muribaculum intestinale, accompanied by elevated relative abundance of Lachnoclostridium phocaeense, and Flavonifractor plautii. Collectively, these findings indicate that QMG restored gut microbial composition across multiple taxonomic levels, shifting the community structure toward a homeostatic state.
The results of the Alpha diversity and Beta diversity
As indicated by the Alpha diversity results (Figure 9A), the intervention group exhibited the highest Chao1, PD, Simpson, and Shannon indices, while the model group displayed the lowest, with the blank group showing intermediate levels. These findings underscore the detrimental impact of DR on gut microbiota diversity and demonstrate that QMG intervention effectively restores and enhances microbial richness and evenness in DR mice.
As indicated by the Beta diversity representative results (Figure 9B,C), the principal coordinates analysis (PCoA) plots revealed a distinct separation of microbial communities across the three groups, which was statistically supported by the Permutational Multivariate Analysis of Variance (PERMANOVA). Specifically, the Bray-Curtis-based analysis indicated a significant structural divergence (PERMANOVA: R2 = 0.67, P < 0.001), suggesting that the DR model and QMG intervention accounted for a substantial proportion of the variation in microbial community composition. Consistent with this, the analysis based on Weighted unique fraction (UniFrac) distance, which incorporates phylogenetic relationships between taxa, further confirmed the significant community shift (PERMANOVA: R2 = 0.58, P < 0.01).
As displayed by the Beta diversity results (Figure 9D), the non-metric multidimensional scaling (NMDS) ordination plot demonstrated a clear spatial clustering of samples according to the respective groups, with a stress value of 0.04. Given that a stress value below 0.05 is generally considered to represent an excellent representation of the community structure in a reduced-dimensional space, these results collectively suggest that the QMG intervention significantly altered the global composition of the gut microbiota.
The results of the differential abundance analysis
According to the linear discriminant analysis effect size (LEfSe) analysis (Figure 9E), the results revealed that Clostridia, Clostridiales, Lachnospiraceae, and Lachnoclostridium were remarkably enriched in the intervention group, whereas Odoribacteraceae, Odoribacter, Peptostreptococcaceae, and Paeniclostridium were notably enriched in the model group. Therefore, the above gut microbiota might be the primary differential microbiota responsible for the intergroup differences between the model and intervention groups.
The results of community function prediction
The predicted functional profiles at Level 2 and Level 3 showed distinct clustering patterns across the three groups (Figure 9F,G). Specifically, compared with the blank group, the model group exhibited a significant deviation in the relative abundance of metabolic pathways. Notably, this functional perturbation in the model group was largely ameliorated in the intervention group. The functional composition of the intervention group showed a substantial shift back towards the profile observed in the blank group, indicating that the QMG intervention effectively modulated the gut microbial functional structure. These results suggest that the intervention not only reshaped the taxonomic composition and structure of the gut microbiota but also restored its functional metabolic capacity toward a homeostatic state.
QMG modulates the gut–retina axis by coupling systemic inflammation and key regulatory proteins
Associations at global levels
At the kingdom level (Figure 10A–C), QMG improved the CMKLR1-centered network mainly by modulating Bacteria along the gut-retina axis. Specifically, Bacteria positively correlated with retinal PPAR-γ in the blank group (P < 0.01), but this association was not observed in the model group. Following QMG intervention, bacterial abundance positively correlated with retinal CMKLR1 and Wnt5a yet negatively correlated with colonic TP53 and PPAR-γ (P < 0.01).
At the phylum level (Figure 10D–F), QMG improved the CMKLR1-centered network mainly by modulating Candidatus and Bacteroidetes along the gut-retina axis. Specifically, the positive correlation between Candidatus and colonic CMKLR1 observed in the blank group was lost following DR induction, but was restored by QMG intervention, which was accompanied by a negative correlation with serum IL-1β and TNF-α, while positively correlated with retinal PPAR-γ, AP-1, TP53, colonic AP-1, and serum IL-6 (P < 0.01). Proteobacteria in the model group negatively correlated with colonic CMKLR1 (P < 0.01), a trend that persisted following QMG intervention. Meanwhile, Firmicutes were positively correlated with retinal CMKLR1 in the model group, whereas Bacteroidetes and Tenericutes were negatively correlated with retinal CMKLR1 (P < 0.01). Following QMG intervention, Bacteroidetes shifted to positive correlations with retinal PPAR-γ, AP-1, TP53, and colonic CMKLR1 (P < 0.01). Additionally, Actinobacteria positively correlated with retinal CMKLR1 and Wnt5a (P < 0.01).
At the class level (Figure 10G–I), QMG improved the CMKLR1-centered network mainly by regulating Cytophagia and Bacteroidia along the gut-retina axis. Specifically, Cytophagia and Chitinophagia negatively correlated with retinal CMKLR1 in the blank group (P < 0.01). In the model group, Cytophagia, Bacteroidia, and Mollicutes negatively correlated with retinal CMKLR1, while colonic CMKLR1 positively correlated with Flavobacteriia and Epsilonproteobacteria, yet negatively with Tissierellia, Alphaproteobacteria, Clostridia, and Bacilli (P < 0.01). Following QMG intervention, Bacteroidia and Cytophagia positively correlated with colonic CMKLR1, retinal PPAR-γ, AP-1, TP53, colonic AP-1 and serum IL-6, whereas Mollicutes, Deltaproteobacteria, Alphaproteobacteria, and Gammaproteobacteria showed the opposite pattern (P < 0.01). Moreover, Chlamydiia, Actinobacteria, Tissierellia, Bacilli, and Negativicute negatively correlated with retinal CMKLR1 and Wnt5a, while Coriobacteriia exhibited the reverse correlation (P < 0.01).
At the order level (Figure 10J–L), QMG improved the CMKLR1-centered network mainly by modulating Bacteroidales, Bacillales, and Clostridiales along the gut–retina axis. Specifically, Cytophagales and Chitinophagales negatively correlated with retinal CMKLR1, whereas Marinilabiliales positively correlated with colonic CMKLR1 in the blank group (P < 0.01). In the model group, Mycoplasmatales, Cytophagales, Bacteroidales, and Marinilabiliales negatively correlated with retinal CMKLR1, while colonic CMKLR1 positively correlated with Flavobacteriales and Campylobacterales, yet negatively with Tissierellales, Bacillales, Sphingomonadales, Clostridiales, and Lactobacillales (P < 0.01). Following QMG intervention, Bacteroidales and Clostridiales positively correlated with colonic CMKLR1, AP-1, retinal PPAR-γ, AP-1, TP53, and serum IL-6, whereas Desulfovibrionales, Rhizobiales, Sphingomonadales, and Enterobacterales showed the opposite pattern (P < 0.01). Moreover, Eggerthellales and Coriobacteriales positively correlated with retinal CMKLR1 and Wnt5a, yet negatively with colonic TP53 and PPAR-γ, whereas Chlamydiales, Thermoanaerobacterales, Corynebacteriales, Tissierellales, and Bacillales exhibited the reverse correlation (P < 0.01).
Associations at Fine levels
At the family level (Figure 11A–C), QMG improved the CMKLR1-centered network primarily by modulating Lachnospiraceae, Bacteroidaceae, and Lactobacillaceae along the gut–retina axis. Specifically, Ruminococcaceae negatively correlated with retinal CMKLR1, whereas Lachnospiraceae positively correlated with retinal CMKLR1 in the blank group (P < 0.01). In the model group, Peptostreptococcaceae positively correlated with retinal CMKLR1, while Tannerellaceae, Bacteroidaceae, Odoribacteraceae, and Lachnospiraceae showed the opposite pattern (P < 0.01). Meanwhile, colonic CMKLR1 positively correlated with Marinilabiliaceae, Rikenellaceae, and Flavobacteriaceae, yet negatively with Lachnospiraceae and Lactobacillaceae (P < 0.01). Following QMG intervention, Enterobacteriaceae, Sphingomonadaceae, and Oscillospiraceae negatively correlated with colonic CMKLR1, AP-1, and serum IL-6, as well as retinal PPAR-γ, AP-1, and TP53, while positively correlating with serum IL-1β and TNF-α, whereas Peptococcaceae, Bacteroidaceae, Muribaculaceae, and Rikenellaceae showed the opposite pattern (P < 0.01). Moreover, Veillonellaceae, Peptostreptococcaceae, Lactobacillaceae, and Ruminococcaceae negatively correlated with retinal CMKLR1 and Wnt5a, yet positively with colonic TP53 and PPAR-γ, whereas Eggerthellaceae, Lachnospiraceae, and Hungateiclostridiaceae exhibited the reverse correlation (P < 0.01).
At the genus level (Figure 11D–F), QMG improved the CMKLR1-centered network primarily by modulating Lachnoclostridium, Clostridioides, and Bacteroides along the gut–retina axis. Specifically, Ruminococcus negatively correlated with retinal CMKLR1, whereas Lachnoclostridium showed the opposite pattern in the blank group (P < 0.01). In the model group, Lactobacillus and Sphingomonas negatively correlated with colonic CMKLR1, while Alistipes and Croceibacter positively correlated with colonic CMKLR1 (P < 0.01). Meanwhile, retinal CMKLR1 positively correlated with Paeniclostridium and Clostridioides, yet negatively with Mucinivorans, Intestinimonas, Flavonifractor, Parabacteroides, Bacteroides, Odoribacter, and Lachnoclostridium (P < 0.01). Following QMG intervention, Sphingomonas and Oscillibacter negatively correlated with colonic CMKLR1, AP-1, and serum IL-6, as well as retinal PPAR-γ, AP-1, and TP53, while positively correlating with serum IL-1β and TNF-α, whereas Bacteroides, Muribaculum, and Alistipes showed the opposite pattern (P < 0.01). Moreover, Dialister, Flavonifractor, Clostridioides, Ruminococcus, and Paeniclostridium negatively correlated with retinal CMKLR1 and Wnt5a, yet positively with colonic TP53 and PPAR-γ, whereas Pseudoclostridium, Lachnoclostridium, and Blautia exhibited the reverse correlation (P < 0.01).
At the species level (Figure 11G–I), QMG improved the CMKLR1-centered network primarily by modulating Clostridioides difficile, Alistipes shahii, and Paeniclostridium sordellii along the gut–retina axis. Specifically, Ruminococcus bicirculans and endosymbiont 'TC1' of Trimyema compressum negatively correlated with retinal CMKLR1, whereas Lactobacillus fermentum and Lactobacillus helveticus displayed the opposite pattern in the blank group (P < 0.01). In the model group, Croceibacter atlanticus, Alkalitalea saponilacus, Alistipes finegoldii, and Alistipes shahii positively correlated with colonic CMKLR1, while Sphingomonas panacis, Paeniclostridium sordellii, Clostridioides difficile, and Lactobacillus murinus positively correlated with retinal CMKLR1, yet Odoribacter splanchnicus, Mucinivorans hirudinis, Lachnoclostridium phocaense, Flavonifractor plautii, and Intestinimonas butyriciproducens showed the opposite pattern (P < 0.01). Following QMG intervention, Alistipes shahii and Muribaculum intestinale positively correlated with colonic CMKLR1, AP-1, and serum IL-6, as well as retinal PPAR-γ, AP-1, and TP53, while negatively correlating with serum IL-1β and TNF-α, whereas Sphingomonas panacis, Oscillibacter sp. PEA192, and Oscillibacter valericigenes exhibited the reverse pattern (P < 0.01). Moreover, Pseudoclostridium thermosuccinogenes, Lachnoclostridium phocaense, Bacteroides salanitronis, and Blautia sp. N6H1-15 positively correlated with retinal CMKLR1 and Wnt5a, yet negatively with colonic TP53 and PPAR-γ, whereas Paeniclostridium sordellii, Flavonifractor plautii, endosymbiont 'TC1' of Trimyema compressum, Clostridioides difficile, and Dialister pneumosintes showed the reverse correlation (P < 0.01). The detailed correlation results at kingdom, phylum, class, order, family, genus, and species levels are presented in Supplementary File 1.
DATA AVAILABILITY:
The 16S rDNA sequencing datasets generated and analyzed during the current study are available in the National Center for Biotechnology Information (NCBI) Sequence Read Archive (SRA) repository under the BioProject accession number: PRJNA1281561. All other data generated or analyzed during this study are included in this article.
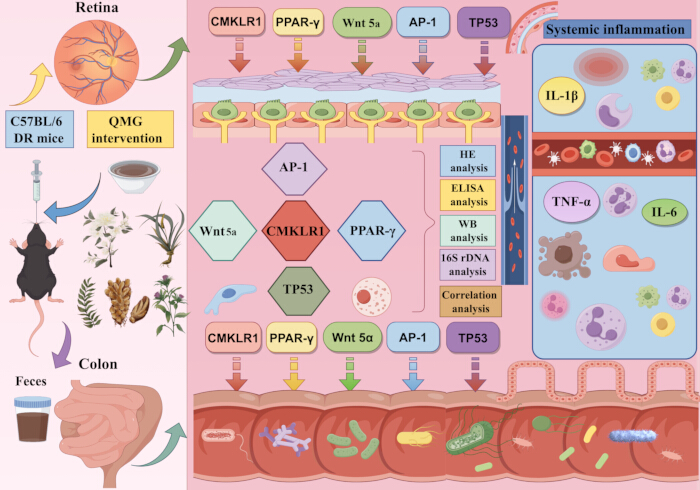
Figure 1: Graphical abstract. The graphical abstract shows the process of this study. Please click here to view a larger version of this figure.
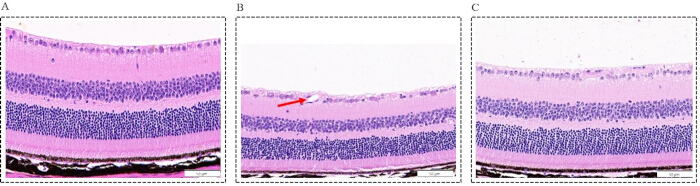
Figure 2: Morphological changes in the retina across the three groups (Scale bar = 50 µm, Magnification: ×400). (A) Blank group: representative photomicrographs of hematoxylin-eosin (HE)-stained retinal sections, showing an intact, well-organized retinal architecture with neatly arranged cellular layers; (B) Model group: representative photomicrographs of HE-stained retinal sections, showing marked structural disorganization, characterized by disordered cellular arrangement, a significant reduction in retinal ganglion cell (RGC) counts (P < 0.0001), pronounced thinning of the retinal thickness (P < 0.0001), and neovascular tufts penetrating the inner limiting membrane (indicated by a red arrow); (C) Intervention group: representative photomicrographs of HE-stained retinal sections, showing significant attenuation of histopathological abnormalities relative to the model group, as evidenced by restoration of retinal laminar architecture, partial recovery of RGC numbers (P < 0.001), and restoration of retinal thinning (P < 0.01). Please click here to view a larger version of this figure.
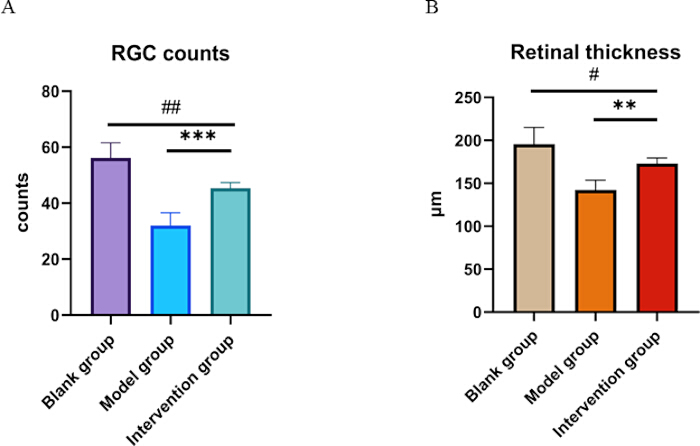
Figure 3: Histological quantification of RGC counts and retinal thickness. (A) Quantification of RGC counts in the ganglion cell layer. (B) Measurement of total retinal thickness (µm). Data are shown as mean ± SD (n = 6 per group). Compared with the blank group: #P <0.05, ##P <0.01; compared with the model group: **P <0.01, ***P <0.001. Please click here to view a larger version of this figure.
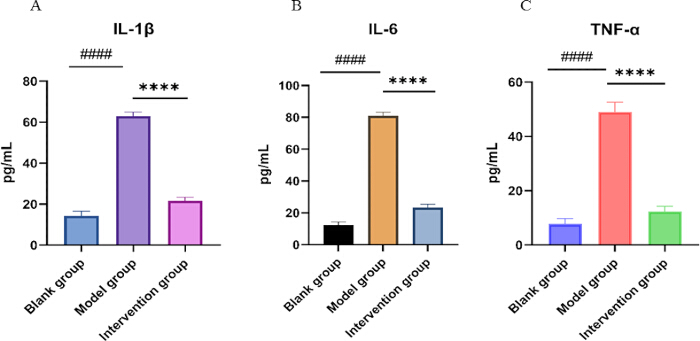
Figure 4: Serum concentrations of inflammatory cytokines in the three groups. Bar charts showing ELISA‑based quantification of serum IL‑1β (A), IL‑6 (B), and TNF‑α (C) levels in the blank control, model group, and intervention groups. Data are expressed as mean ± SD (n = 6 per group). Compared with the blank group: ####P < 0.0001; compared with the model group: ****P < 0.0001. Please click here to view a larger version of this figure.
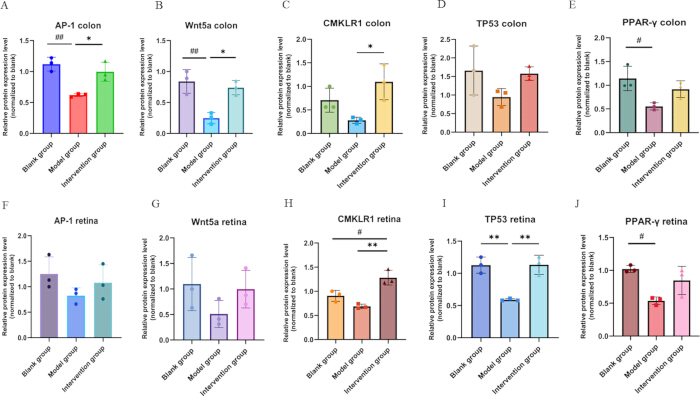
Figure 5: Bar chart of the expression levels of key regulatory proteins in the retina and colon. (A) Relative protein expression level (normalized to blank) of AP-1 in the colon (n = 3); (B) Relative protein expression level (normalized to blank) of Wnt5a in the colon (n = 3); (C) Relative protein expression level (normalized to blank) of CMKLR1 in the colon (n = 3); (D) Relative protein expression level (normalized to blank) of TP53 in the colon (n = 3); (E) Relative protein expression level (normalized to blank) of PPAR-γ in the colon (n = 3); (F) Relative protein expression level (normalized to blank) of AP-1 in the retina (n = 3); (G) Relative protein expression level (normalized to blank) of Wnt5a in the retina (n = 3); (H) Relative protein expression level (normalized to blank) of CMKLR1 in the retina (n = 3); (I) Relative protein expression level (normalized to blank) of TP53 in the retina (n = 3); (J) Relative protein expression level (normalized to blank) of PPAR-γ in the retina (n = 3). Compared with the blank group: #P < 0.05, ##P < 0.01; compared with the model group: *P < 0.05, **P < 0.01. Please click here to view a larger version of this figure.
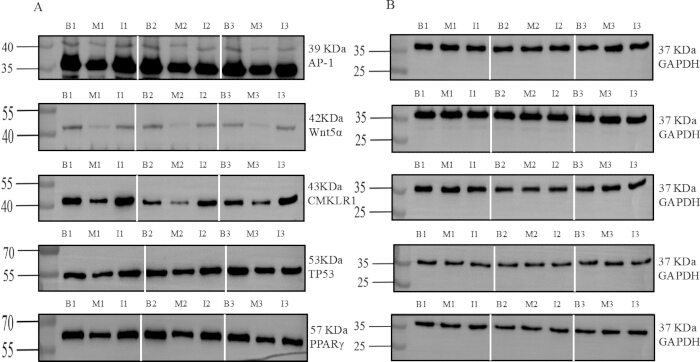
Figure 6: Representative WB grayscale blots of key regulatory proteins in the colon. (A) Target protein expression: AP-1, Wnt5a, CMKLR1, TP53, and PPAR-γ; (B) Loading control: GAPDH. Vertical white lines separate replicate sets (Rep1, Rep2, Rep3); Molecular weight markers (kDa) are indicated on the left, and protein names with corresponding kDa are shown on the right. Lanes are labeled as: B1 (Blank group 1), M1 (Model group 1), I1 (Intervention group 1); B2 (Blank group 2), M2 (Model group 2), I2 (Intervention group 2); B3 (Blank group 3), M3 (Model group 3), I3 (Intervention group 3). Full-length, uncropped Western blot (WB) images with visible molecular weight markers have been provided as Supplementary Figure 2. Please click here to view a larger version of this figure.
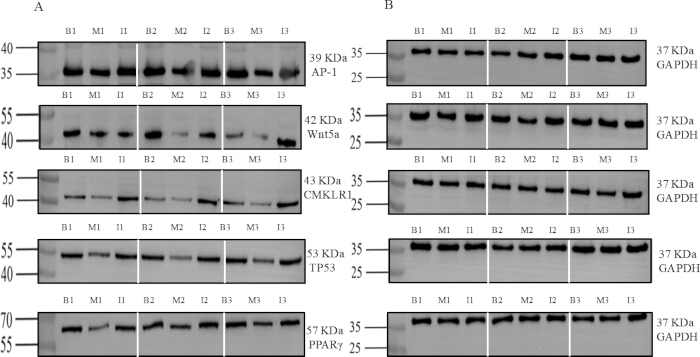
Figure 7: Representative WB grayscale blots of key regulatory proteins in the retina. (A) Target protein expression: AP-1, Wnt5a, CMKLR1, TP53, and PPAR-γ; (B) Loading control: GAPDH. Vertical white lines separate replicate sets (Rep1, Rep2, Rep3); Molecular weight markers (kDa) are indicated on the left, and protein names with corresponding kDa are shown on the right. Lanes are labeled as: B1 (Blank group 1), M1 (Model group 1), I1 (Intervention group 1); B2 (Blank group 2), M2 (Model group 2), I2 (Intervention group 2); B3 (Blank group 3), M3 (Model group 3), I3 (Intervention group 3). Full-length, uncropped WB images with visible molecular weight markers have been provided as Supplementary Figure 2. Please click here to view a larger version of this figure.
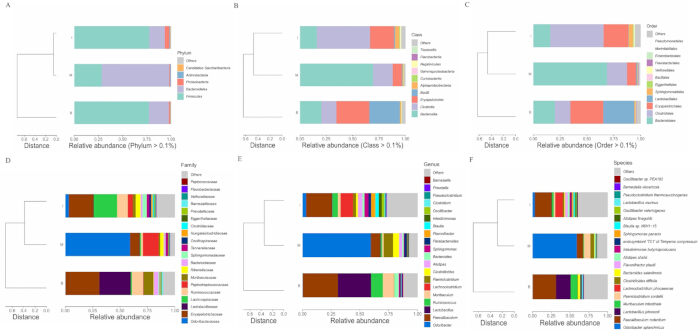
Figure 8: Hierarchical clustering of gut microbiota composition at different levels. Hierarchical clustering dendrogram based on Bray-Curtis dissimilarity among the blank control (B), model group(M), and intervention group (I). The branch length represents the degree of structural divergence. Stacked bar chart depicting the relative abundances of dominant phyla across the three groups. Phyla falling below the threshold are aggregated as “Others”. (A) Qiming granule (QMG) rebalances the gut microbiota composition at the phylum level; (B) QMG rebalances the gut microbiota composition at the class level; (C) QMG rebalances the gut microbiota composition at the order level; (D) QMG rebalances the gut microbiota composition at the family level; (E) QMG rebalances the gut microbiota composition at the genus level; (F) QMG rebalances the gut microbiota composition at the species level. Abbreviation: B, blank group; M, model group; I, intervention group. Please click here to view a larger version of this figure.
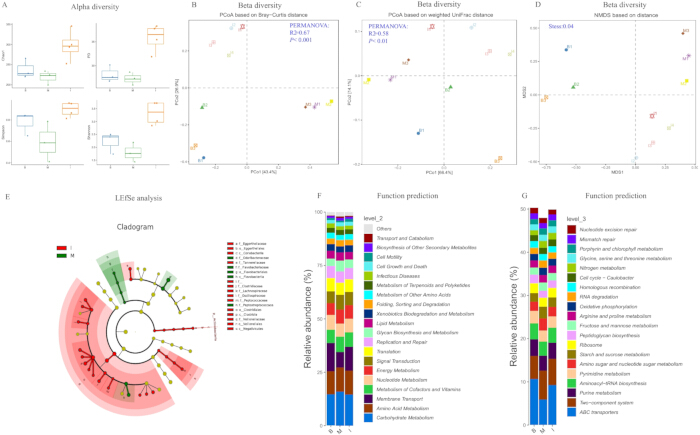
Figure 9: Analysis of gut microbiota diversity, differential abundance, and predicted functional pathways. (A) Alpha diversity analysis assessed by Chao1, PD, Simpson, and Shannon indices revealed that the intervention group exhibited higher microbial diversity than the model group, indicating that QMG treatment effectively restores gut microbial richness and evenness. (B) Beta diversity analysis assessed by principal coordinates analysis (PCoA) based on Bray-Curtis distance revealed significant differences among groups (PERMANOVA: R2=0.67, P < 0.001), indicating that the DR model and QMG intervention accounted for a substantial proportion of the variation in microbial community composition. (C) Beta diversity analysis assessed by PCoA based on weighted unique fraction (UniFrac) distance further confirmed the significant community shift (PERMANOVA: R2= 0.58, P < 0.01). (D) Beta diversity analysis assessed by non-metric multidimensional scaling (NMDS) ordination demonstrated a stress value of 0.04, suggesting that the QMG intervention significantly altered the global composition of the gut microbiota. (E) Cladogram of differential abundance analysis assessed by linear discriminant analysis effect size (LEfSe) revealed the primary differential microbiota between the model and intervention groups. Functional prediction of the gut microbiota at KEGG Level 2 (F) and KEGG Level 3 (G) suggested that the intervention not only reshaped the taxonomic composition and structure of the gut microbiota but also restored its functional metabolic capacity toward a homeostatic state. Please click here to view a larger version of this figure.
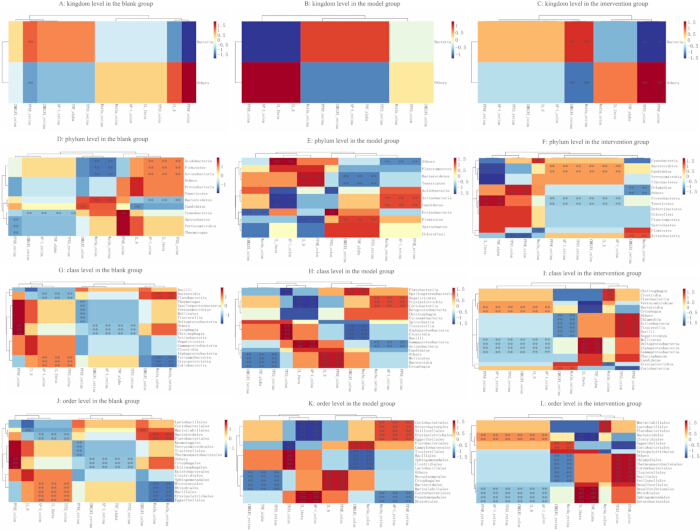
Figure 10: Global association of gut microbiota with inflammatory and regulatory factors. (A) Association of gut microbiota at kingdom level in the blank group; (B) Association of gut microbiota at kingdom level in the model group; (C) Association of gut microbiota at kingdom level in the intervention group; (D) Association of gut microbiota at phylum level in the blank group; (E) Association of gut microbiota at phylum level in the model group; (F) Association of gut microbiota at phylum level in the intervention group; (G) Association of gut microbiota at class level in the blank group; (H) Association of gut microbiota at class level in the model group; (I) Association of gut microbiota at class level in the intervention group; (J) Association of gut microbiota at order level in the blank group; (K) Association of gut microbiota at order level in the model group; (L) Association of gut microbiota at order level in the intervention group. Please click here to view a larger version of this figure.
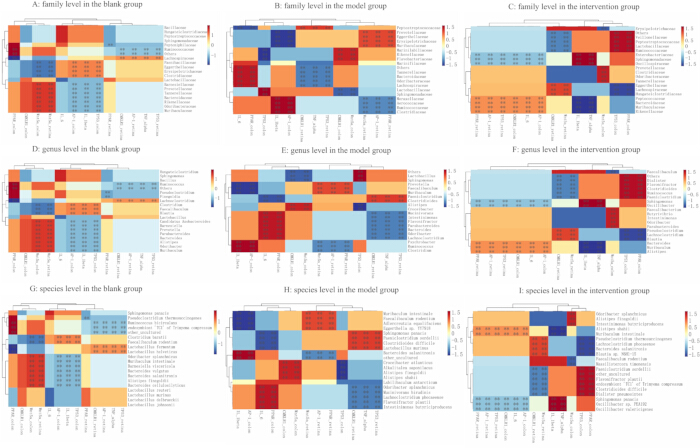
Figure 11: Fine association of gut microbiota with inflammatory and regulatory factors. (A) Association of gut microbiota at the family level in the blank group; (B) Association of gut microbiota at the family level in the model group. (C) Association of gut microbiota at family level in the intervention group; (D) Association of gut microbiota at genus level in the blank group; (E) Association of gut microbiota at genus level in the model group; (F) Association of gut microbiota at genus level in the intervention group; (G) Association of gut microbiota at species level in the blank group; (H) Association of gut microbiota at species level in the model group;(I) Association of gut microbiota at species level in the intervention group. Please click here to view a larger version of this figure.
| Groups (n = 6) | RGCs counts | Retinal thickness |
| Blank group | 56.17 ± 5.382 | 195.50 ± 19.54 μm |
| Model group | 32.00 ± 4.561#### | 142.30 ± 11.34 μm#### |
| Intervention group | 45.33 ± 2.066 ##*** | 173.00 ± 6.575 μm#** |
| p | <0.0001 | <0.0001 |
Table 2: Quantitative analysis of RGC counts and retinal thickness in the three experimental groups. Data are presented as Mean ± SD (n = 6 per group). Compared with the blank group: #P <0.05, ##P <0.01, ####P <0.0001; compared with the model group: **P <0.01, ***P <0.001.
| Groups (n = 6) | IL-1β | IL-6 | TNF-α |
| Blank group | 14.31 ± 2.28 | 12.48 ± 1.774 | 7.728 ± 2.048 |
| Model group | 62.88 ± 2.01#### | 80.95 ± 2.247#### | 49.00 ± 3.647#### |
| Intervention group | 21.7 ± 1.654**** | 23.27 ± 2.074**** | 12.35 ± 1.891**** |
| P | <0.0001 | <0.0001 | <0.0001 |
Table 3: Serum expression levels of IL-1β, IL-6, and TNF-α in the three experimental groups. Data are presented as Mean ± SD (n = 6 per group). Cytokine concentrations were determined by enzyme‑linked immunosorbent assay (ELISA) and are reported in pg/mL. Compared with the blank group: ####P < 0.0001; compared with the model group: ****P < 0.0001.
Supplementary Figure 1: Experimental Design and Study Timeline. Schematic overview of the experimental design.Please click here to download this file.
Supplementary Figure 2: Original, full-length, uncropped WB images corresponding to Figure 6 and Figure 7. Raw images without modification contain all molecular weight markers in colon and retina blots for AP-1, Wnt5a, TP53, CMKLR1, PPAR-γ, and loading control GAPDH. Molecular weight markers (kDa) are indicated. Lanes are labeled: B1 (Blank group 1), M1 (Model group 1), I1 (Intervention group 1); B2 (Blank group 2), M2(Model group 2), I2 (Intervention group 2); B3 (Blank group 3), M3 (Model group 3), I3 (Intervention group 3). The original blots were not subjected to high-contrast adjustments.Please click here to download this file.
Supplementary File 1: Detailed correlation analyses of gut microbiota with inflammatory and regulatory factors.Please click here to download this file.
ディスカッション
糖尿病網膜症(DR)は、慢性的高血糖、炎症、および代謝調節不全によって引き起こされる複雑な神経血管合併症である22。米国眼科学会は、DRを非増殖性DRと、新生血管の出現を特徴とする増殖性DRに分類している23。現在の治療戦略には限界があるため、新たなメカニズムの探索がDRへの対処に向けた有望な方向性として浮上している。特に、最近の画期的な研究により、腸・網膜軸がDRにおける重要ながらも十分に活用されていない治療標的であることが特定された。2017年にSheldon Rowanによって初めて導入・記述された腸・網膜軸は6、眼疾患の病態生理学的プロセスにおいて注目を集めている。しかし、DRの発症および進行における腸・網膜軸の役割を支える具体的な分子メカニズムは依然として不明であり、これがこの軸を標的とした治療戦略の開発および臨床応用を妨げている。
本研究では、DRに対するQMGの有効性とその基礎となるメカニズムを体系的に評価した。これらの知見は、QMGが網膜の組織病理学的損傷を軽減し、全身性炎症を抑制し、腸内細菌叢の恒常性を回復させ、さらに結腸と網膜の両方において主要な制御タンパク質(CMKLR1を中心とする制御ネットワーク)を双方向に調節することを、予備的な証拠として示すものであり、これによりQMGが腸-網膜軸の潜在的な調節因子であることが確立された。慢性的で低グレードの全身性炎症はDMの特徴であり、網膜微小血管損傷およびDR進行の主要な要因となる24。ELISAの結果から、DRモデルマウスでは血清中のIL-1β、IL-6、およびTNF-αのレベルが有意に上昇しており(P < 0.0001)、DR状態で強力な全身性炎症反応が存在することが確認された。これらのサイトカインの制御不全な放出は、血液網膜関門を破壊し、RGCのアポトーシスを促進し、病理的な新生血管を誘導する可能性がある。QMGの介入後、これらのサイトカインレベルは有意に低下し(P < 0.0001)、一方で網膜の構造的完全性が回復し、RGCの生存率が増加し、網膜の厚みが維持された。これらの結果は、QMGの網膜保護効果が、その強力な全身性抗炎症活性と密接に関連していることを示している。注目すべき点は、この全身性抗炎症効果が単独で起こるのではなく、QMGによる腸内細菌叢の調節および結腸における主要な制御タンパク質の回復と連動していることであり、QMGが「腸-全身性炎症-網膜」軸を通じて治療効果を発揮している可能性が示唆された。
QMGが腸–網膜軸に沿って抗DR効果を及ぼす分子メカニズムをさらに解明するため、結腸および網膜組織の両方において、CMKLR1を中心とした調節ネットワーク(CMKLR1、Wnt5a、TP53、AP-1、およびPPAR-γを含む)のタンパク質発現を検討した。その結果、DRモデルの誘導後、これら5つのタンパク質すべてが結腸と網膜の両方で一貫して低下傾向を示し、DR条件下では腸と網膜の間の信号伝達が全身的に遮断されている可能性が示唆された。QMGの投与後、CMKLR1 は結腸と網膜の両方で有意にアップレギュレートされ(P < 0.05 および P < 0.01)、QMGがCMKLR1の全身的な活性化を通じて、腸–網膜軸に沿った双方向のコミュニケーションを回復させる可能性があることが示された。さらに、QMGは結腸におけるAP-1およびWnt5aの発現、ならびに網膜におけるTP53の発現を有意に回復させた。これは、異なるタンパク質がこの軸に沿って組織特異的な機能的役割を担っていることを示唆しており、結腸ではAP-1とWnt5aがQMGに対するより感受性の高い応答因子であり、一方でアポトーシス調節因子であるTP53は網膜の神経保護においてより重要な役割を果たしていると考えられる。さらなる相関分析により、結腸におけるAP-1、CMKLR1、PPAR-γ、およびWnt5aの発現は、全身性炎症性サイトカインレベル(IL-1β、IL-6、TNF-α)と有意に負の相関があることが明らかになったが(P < 0.05 ~ P < 0.001)、血清サイトカインと網膜タンパク質発現との間に直接的な相関は認められなかった。この相違はメカニズム的に重要な意味を持つ。すなわち、QMGは主に結腸における主要な調節タンパク質の発現を回復させることで腸内微環境に作用し、それによって全身性炎症を抑制すると考えられる。対照的に、網膜タンパク質の回復は、全身性炎症因子によって直接的に介在されるのではなく、腸内細菌叢由来の代謝物が循環系に移行し、それが遠隔的に網膜のシグナル伝達カスケードを調節するといった間接的な経路を通じて達成される可能性がある。この知見は、「腸–全身性炎症–網膜」軸の調節モデルを支持し、腸–網膜軸を通じたQMGのDRに対する治療効果の重要なメカニズム的根拠を提供するものである。調査した標的の中で、CMKLR1は網膜および結腸組織の両方で有意な変動を示し、腸–網膜軸を連結する潜在的な主要バイオマーカーとして浮上した。CMKLR1は先行研究において、糖脂質代謝、DRの重症度、および腸内細菌叢の調節に関与していることが報告されており25,26,27,28,29,30、腸–網膜軸に沿ったその発現変動は、複数の病理学的プロセスへの関与を反映している可能性が示唆される。以上の結果から、CMKLR1はDRの診断および治療的介入のための有望な候補バイオマーカーであり、さらなるメカニズムの検証に値することが示された。
CMKLR1は腸・網膜軸における中心的なノードとして機能しますが、QMGの治療効果は、Wnt5a、TP53、AP-1、およびPPAR-γが不可欠な相乗的サポートを提供する多次元的な調節ネットワークを通じて達成されます。Wntシグナル伝達は、上皮の完全性の維持、炎症の調節、および微生物叢介在性の粘膜保護における役割を含め、腸上皮の恒常性と結腸の健康にとって極めて重要です31,32,33,34。PPAR-γは炎症反応を調節し、DRにおける脂質活性化食細胞を抑制し、ミクログリアの調節を介して光受容細胞の生存を促進することが示されています35,36,37。AP-1は転写因子として機能し、デオキシコール酸などの腸内細菌代謝物が炎症および免疫の恒常性に影響を及ぼす経路となります38,39,40,41。TP53は、高血糖条件下でのオートファジー、アポトーシス、および網膜ニューロン損傷に関与しています42,43,44,45。総じて、これらのシグナリングノードは、腸内細菌の動態を網膜の病理へと結びつける相互接続されたネットワークを形成しており、我々はQMGが腸・網膜軸に沿ってこのネットワークを調節するかどうかを調査することとなりました。
全身性炎症が調節される重要なメカニズムの一つは、腸内エコシステムに由来します。16S rDNAシーケンシング解析により、モデル群では糖尿病に伴う構造的なディスバイオーシス(菌叢不全)が認められました。これは、Firmicutes/Bacteroidetes比の顕著な不均衡、潜在的な病原性分類群(例:OdoribacterおよびClostridioides)の増加、および有益な分類群(例:LactobacillusおよびFaecalibaculum)の減少を特徴としています。注目すべきことに、QMG治療は菌叢回復剤として作用し、以下の機序によってこれらの病理学的変化を改善させました。(i) 微生物恒常性の回復:主要な科および属(Faecalibaculum、Ruminococcus、Erysipelotrichaceae)の割合を対照群のベースラインまで正常化させたこと。(ii) パソバイオントの標的調節:糖尿病に関連するOdoribacter splanchnicusおよびClostridioides difficileの過剰増殖を抑制したこと。(iii) 有益なコミュニティ構築の促進:Lachnoclostridium、Blautia、Flavonifractor plautiiなどの抗炎症性または代謝産物産生分類群の増殖を誘導したこと。さらに、多様性解析および多レベルのSpearman相関解析により、QMG介入が腸―網膜軸に沿った宿主と微生物の保護的な相互作用に資する形で、コアとなる多レベルの組成を効果的に再バランスさせることが示されました。この結果は、QMGの腸内細菌叢に対する調節効果を裏付けるだけでなく、QMGが菌叢のリモデリングを主要な調節タンパク質(例:IL-6、TP53)の活性と協調させ、共同して全身性炎症を抑制し、それによって糖尿病網膜症を軽減させるという潜在的な治療戦略を明らかにしています。
近年の研究 保持する 中薬(TCM)が、単一標的の医薬品とは異なり、微生物叢ー代謝ー免疫軸に対して多標的的に調節作用を及ぼすことが検証された。46蓄積されつつあるエビデンスにより、糖尿病網膜症(DR)および関連する眼疾患におけるQMGの治療的ポテンシャルが実証されている。多施設共同ランダム化比較試験において、QMGはDR患者の網膜動静脈循環時間を有意に短縮させ、網膜血流の改善および低酸素状態の軽減が示唆された。47さらにメタ解析により、糖尿病黄斑浮腫において、QMGを従来の治療法と併用することで、中心窩網膜厚、視力、および総合有効率が有意に改善することが確認された。48、ならびにドライアイ患者における涙液層破綻時間の延長および涙液分泌量の増加49NPDR(非増殖性糖尿病網膜症)に伴う神経損傷を有する患者において、QMGは網膜神経線維層の厚さと中心窩無血管領域の面積を維持する点において、カルシウムドベシレートに対して非劣性を示した。50メカニズム研究により、QMGはP2X7R/NLRP3経路を介したミュラー細胞のパイロトーシスおよび免疫炎症の抑制を含む、複数の経路を通じて網膜損傷を保護することが明らかになっている。51、アポトーシスを減少させるためのPI3K/Aktシグナル伝達経路の活性化、および血液網膜関門の完全性を維持するためのタイトジャンクションタンパク質の調節52ネットワーク薬理学解析により、QMGに含まれる複数の生物活性化合物が、糖尿病性網膜症(DR)関連の標的に相乗的に作用することが明らかになった。16、また臨床研究において重篤な有害事象は報告されておらず、良好な安全性プロファイルが示されている50QMGの治療効果は、ケルセチン、ケンフェロール、イソラムネチン、フォルモノネチンなどの活性成分による相乗作用に起因しています。 β-シトステロールであり、これらはIL-6やTNF-を標的とすることで、抗炎症作用、抗酸化作用、および抗アポトーシス作用を総合的に発揮する。α, TP53, および AP-153,54,55,56,57,58,59本研究は、QMGの保護効果が腸-網膜軸の調節、具体的には腸内細菌叢の恒常性の回復およびCMKLR1を中心とする分子ネットワークの制御を通じて、全身性炎症を抑制し網膜損傷を軽減させることによっても媒介されることを示すことで、この知見を拡張するものである。
本研究にはいくつかの限界があり、今後の研究でさらなる調査が必要です。第一に、腸内細菌叢の変化と網膜機能の改善との間の因果関係については、さらなる検証が必要です。QMG誘発性の細菌叢リモデリングと網膜保護表現型との間に強い相関が観察されましたが、今後の研究において、糞便微生物移植、無菌動物モデル、または抗生物質による細菌叢除去などの直接的な因果推論実験を行い、この関係を確認することが有益であると考えられます。第二に、微生物組成のプロファイリングには16S rDNAシーケンシングを用いたため、属レベル以上の分類学的解像度は十分でしたが、株レベルの機能情報や正確な代謝能を提示する能力には限界がありました。以降の研究では、メタゲノムシーケンシングやメタボローム解析を行い、QMGによって制御される主要な微生物機能経路を特定する予定です。第三に、細菌叢の変化は実験のエンドポイントでのみ評価されたため、QMG投与期間中における細菌叢再構築の時間的推移をダイナミックに追跡することができませんでした。今後の研究で経時的なサンプリングを行うことで、QMG駆動の細菌叢リモデリングのキネティクスと、網膜保護との時間的関係を明らかにすることが期待されます。第四に、組織病理学的解析により網膜の菲薄化、RGCの消失、および新生血管結節が観察されましたが、今後の研究では、STZの多回投与プロトコルや遺伝的糖尿病モデルを検討し、DR表現型のより包括的な特性評価を行う必要があります。
要約すると、本研究は、QMGが腸-網膜軸を介してCMKLR1を中心とする分子ネットワークを全身性炎症と結びつけることにより、DRを改善することを実証しています。QMGの作用機序は3つのレベルで現れます。微生物レベルでは、QMGは糖尿病誘発性の腸内細菌叢の乱れを改善します(例:Firmicutes/Bacteroidetes比の回復、OdoribacterおよびClostridioidesの抑制、そしてFaecalibaculumなどの有益菌の促進)。分子レベルでは、QMGはCMKLR1/Wnt5a/PPAR-γ/AP-1/TP53パスウェイを調節し、全身性炎症を軽減します。組織レベルでは、QMGは網膜の形態を保護します。これらの知見は、DRに対する有望な腸-網膜治療戦略としてのQMGを支持し、糖尿病合併症の治療における中医学(TCM)応用のメカニズム的根拠を提供するものです。
開示事項
著者らは、本論文で報告された研究に影響を及ぼしたと考えられる既知の競合する利害関係や個人の関係がないことを宣言します。
謝辞
著者は、本研究を完遂するために多大なるサポートと協力を提供してくれたすべてのチームメンバーに感謝いたします。
本研究は、中国国家自然科学基金(助成番号:82474580)および成都中医药大学附属医院の病院基金自由探索プロジェクト(No. 23ZYTS1601)の支援を受けて行われました。
材料
| 名前 | 会社 | カタログ番号 | コメント |
|---|---|---|---|
| AP-1モノクローナル抗体 | Proteintech | 66313-1-IG | 1:5000 |
| CMKLR1ポリクローナル抗体 | 親和性 | AF5291 | 1:1000 |
| GAPDHポリクローナル抗体 | 親和性 | AF7021 | 1:5000 |
| ヤギ抗マウスIgG(H+L) HRP標識抗体 | マルチサイエンス | GAM0072 | 1:10000 |
| ヤギ抗ウサギIgG(H+L) HRP | マルチサイエンス | GAR0072 | 1:10000 |
| GraphPad Prism | / | バージョン 9.5 | |
| Image-Pro Plus | Media Cybernetics, Inc.(米国メリーランド州ロックビル) | バージョン 6.0 | |
| Luoning Bio-Cloudプラットフォーム | http://www.biomediv.cn/login.html | ||
| マウスIL-1β(インターロイキン1β) ELISAキット | Elabscience | E-EL-M0037 | 血清サイトカイン検出 |
| マウスIL-6(インターロイキン-6)ELISAキット | Elabscience | E-EL-M0044 | 血清サイトカイン検出 |
| マウスTNF-αα(腫瘍壊死因子アルファ) ELISAキット | Elabscience | E-EL-M3063 | 血清サイトカイン検出 |
| NanoFilt | / | バージョン 2.7.1 | |
| Nanopore GridION シーケンサー | Oxford Nanopore Technologies | https://store.nanoporetech.com/gridion.html | |
| Pannoramic SCAN II | 3DHISTECH Pannoramic SCANスキャナー | Pannoramic Scan II デジタルスキャナー Pannoramic Scan IIは、組織切片のデジタル化に特化した高性能なスライドスキャナーです。高解像度のイメージング、高速スキャン、そして使いやすさを兼ね備え、病理学研究および診断におけるワークフローを最適化します。 主な特徴 高解像度イメージング: 精密な細胞レベルの構造を捉え、診断や研究に必要な詳細な情報を提供します。 高速スキャン: 効率的なスループットを実現し、大量のサンプルを迅速にデジタル化することが可能です。 直感的な操作性: ユーザーフレンドリーなインターフェースにより、専門的なトレーニングを最小限に抑えつつ、スムーズな操作が可能です。 正確なフォーカシング: 高度なオートフォーカス機能を搭載し、組織の厚みや形状に関わらず、全視野で鮮明な画像を維持します。 応用分野 病理診断: 組織切片の高精細なデジタル画像により、遠隔診断や共同診断を支援します。 がん研究: 腫瘍微小環境やバイオマーカーの解析において、広範囲かつ詳細な観察を可能にします。 デジタルアーカイブ: 貴重な標本をデジタル化して保存することで、物理的な劣化を防ぎ、永続的なアクセスを確保します。 技術仕様 光学系:高倍率・高解像度レンズを搭載 スキャン速度:高速スキャンモードを実装 対応フォーマット:主要なデジタル病理画像フォーマットとの互換性 ソフトウェア:画像解析および管理のための統合ソフトウェアを提供 | |
| PPAR γ (PPAR-γポリクローナル抗体 | ImmunoWay | bs-0530R | 1:1000 |
| Python | / | バージョン 3.7.4 | |
| 清明顆粒 | 浙江三生曼迪製薬有限公司 | 中国国家薬品管理局承認番号 Z20090036 | 0.9 g/kg、経口投与 |
| Rプログラミング言語 | / | バージョン 4.0.3 | |
| SILVAデータベース | / | バージョン 138 | |
| ストレプトゾトシン (STZ) | Sigma-Aldrich | S0130 | 35 mg/kg, 腹腔内投与 |
| TP53ポリクローナル抗体 | Abcam | ab131442 | 1:1000 |
| Usearch | / | バージョン 10.0.240 | |
| Wnt5aポリクローナル抗体 | Proteintech | 55184-1-AP | 1:1000 |
| Zymo Research BIOMICS DNA Microprep Kit | Zymo Research | D4301 | 糞便gDNA抽出 |
参考文献
- Lei C, et al. Homocysteine and diabetic retinopathy. Exp Eye Res. 2026;262:110729.
- Owens DR, et al. IDF diabetes Atlas: A worldwide review of studies utilizing retinal photography to screen for diabetic retinopathy from 2017 to 2024 inclusive. Diabetes Res Clin Pract. 2025;226:112346.
- Zhu J, Huang J, Sun Y, Xu W, Qian H. Emerging role of extracellular vesicles in diabetic retinopathy. Theranostics. 2024;14(4):1631–1646.
- Xie L, Lin W. The role of gut microbiota dysbiosis in the inflammatory pathogenesis of diabetic retinopathy. Front Immunol. 2025;16:1604315.
- Niu J, Liu Y, Peng H, Chen J, Chen L. Early-stage diabetic retinopathy: gut-metabolic triggers, immune-neurodegeneration, and interventions. Graefes Arch Clin Exp Ophthalmol. 2025;263(10):2723–2736.
- Rowan S, et al. Involvement of a gut-retina axis in protection against dietary glycemia-induced age-related macular degeneration. Proc Natl Acad Sci U S A. 2017;114(22):E4472–E4481.
- Rzeczycki P, Pęciak O, Plust M, Droździk M. Gut Microbiota in the Regulation of Intestinal Drug Transporters: Molecular Mechanisms and Pharmacokinetic Implications. Int J Mol Sci. 2025;26(24):11897.
- Yang H, et al. Mediating role of aging and obesity in the relationship between dietary index for gut microbiota and metabolic syndrome and its potential regulatory mechanisms. Eur J Med Res. 2025;31(1):137.
- Zahavi EE, et al. Repeat-element RNAs integrate a neuronal growth circuit. Cell. 2025;188(16):4350–4365.e22.
- Dander E, et al. The chemerin/CMKLR1 axis regulates intestinal graft-versus-host disease. JCI Insight. 2023;8(5):e154440.
- Zhang J, et al. Therapeutic targets in the Wnt signaling pathway: Treating cancer with specificity. Biochem Pharmacol. 2025;236:116848.
- Liu M, Lim ST, Song W, Coffman TM, Wang X. Beyond lipids: fenofibrate in diabetic retinopathy and nephropathy. Trends Pharmacol Sci. 2026;47(3):325–341.
- Wu Y, et al. The active ingredient β-sitosterol in the anti-inflammatory agents alleviates perianal inflammation in rats by inhibiting the expression of Srebf2, activating the PPAR signaling pathway, and altering the composition of gut microbiota. Int Immunopharmacol. 2025;152:114470.
- Lin T, Chen C, Zhao LC, Zhu HY, Li W. The beneficial effects of Traditional Chinese Medicine on diabetic retinopathy: mechanisms, therapeutics, and prospects. Acupunct Herb Med 2026;6(2):188–204.
- Huo J, et al. Evaluation of individualized treatment of nonproliferative diabetic retinopathy: a multicenter, randomized, parallel-controlled study. J Tradit Chin Med. 2022;42(1):90–95.
- Huang Y, et al. Pharmacological mechanism and clinical study of Qiming granules in treating diabetic retinopathy based on network pharmacology and literature review. J Ethnopharmacol. 2023;302(Pt A):115861.
- Salma B, et al. Ameliorative Efficacy of the Cassia auriculata Root Against High-Fat-Diet + STZ-Induced Type-2 Diabetes in C57BL/6 Mice. ACS Omega. 2020;6(1):492–504.
- Srinivasan K, Viswanad B, Asrat L, Kaul CL, Ramarao P. Combination of high-fat diet-fed and low-dose streptozotocin-treated rat: a model for type 2 diabetes and pharmacological screening. Pharmacol Res. 2005;52(4):313–320.
- Liu Y, Deng J, Fan D. Ginsenoside Rk3 ameliorates high-fat-diet/streptozocin-induced type 2 diabetes mellitus in mice via the AMPK/Akt signaling pathway. Food Funct. 2019;10(5):2538–2551.
- Hu RY, et al. AFG Ameliorates Diabetic Retinopathy through AMPK-Dependent Autolysosomal Pathway: From Network Pharmacology to In Vivo and In Vitro Validation. J Agric Food Chem. 2026;74(2):2124–2139.
- Reagan-Shaw S, Nihal M, Ahmad N. Dose translation from animal to human studies revisited. FASEB J. 2008;22(3):659–661.
- Zou Q, et al. Oxidative stress in diabetic retinopathy. Clin Chim Acta. 2026;584:120871.
- Clements JN, Mesawich J, Twisdale C. Current and Emerging Pharmacologic Therapies for Diabetic Retinopathy. Pharmacotherapy. 2026;46(3):e70119.
- Rezvani Z, Khani F, Afarid M, Asadian F, Takhshid MA. Clinical values of systemic inflammatory indices in diabetic retinopathy. Clin Exp Optom. 2026;109(3):371–385.
- Zhu Z, et al. Targeting the CMKLR1-Mediated Signaling Rebalances Immunometabolism State in Middle-Age Testicular Macrophages. Adv Sci (Weinh). 2026;13(14):e15166.
- Lin Y, et al. Epithelial chemerin-CMKLR1 signaling restricts microbiota-driven colonic neutrophilia and tumorigenesis by up-regulating lactoperoxidase. Proc Natl Acad Sci U S A. 2022;119(29):e2205574119.
- Puthanmadhom Narayanan S, et al. Epigenetic Alterations Are Associated With Gastric Emptying Disturbances in Diabetes Mellitus. Clin Transl Gastroenterol. 2020;11(3):e00136.
- Wang L, et al. Chemerin/CMKLR1 Axis Promotes the Progression of Proliferative Diabetic Retinopathy. Int J Endocrinol. 2021;2021:4468625.
- Zheng C, et al. α-NETA down-regulates CMKLR1 mRNA expression in ileum and prevents body weight gains collaborating with ERK inhibitor PD98059 in turn to alleviate hepatic steatosis in HFD-induced obese mice but no impact on ileal mucosal integrity and steatohepatitis progression. BMC Endocr Disord. 2023;23(1):9.
- Dranse HJ, et al. The impact of chemerin or chemokine-like receptor 1 loss on the mouse gut microbiome. PeerJ. 2018;6:e5494.
- Flores-Hernández E, et al. Canonical and non-canonical Wnt signaling are simultaneously activated by Wnts in colon cancer cells. Cell Signal. 2020;72:109636.
- Qi Y, et al. Heat-inactivated Bifidobacterium adolescentis ameliorates colon senescence through Paneth-like-cell-mediated stem cell activation. Nat Commun. 2023;14(1):6121.
- Ou W, et al. Cooperation of Wnt/β-catenin and Dll1-mediated Notch pathway in Lgr5-positive intestinal stem cells regulates the mucosal injury and repair in DSS-induced colitis mice model. Gastroenterol Rep (Oxf). 2024;12:goae090.
- Dong Y, et al. Berberine ameliorates DSS-induced intestinal mucosal barrier dysfunction through microbiota-dependence and Wnt/β-catenin pathway. Int J Biol Sci. 2022;18(4):1381–1397.
- Escandon P, et al. The role of peroxisome proliferator-activated receptors in healthy and diseased eyes. Exp Eye Res. 2021;208:108617.
- Blot G, et al. Perilipin 2-positive mononuclear phagocytes accumulate in the diabetic retina and promote PPARγ-dependent vasodegeneration. J Clin Invest. 2023;133(19):e161348.
- Zhou W, et al. TREM2-dependent activation of microglial cell protects photoreceptor cell during retinal degeneration via PPARγ and CD36. Cell Death Dis. 2024;15(8):623.
- Bala Kumar S, et al. Gut microbial metabolites targeting JUN in renal cell carcinoma via IL-17 signaling pathway: network pharmacology approach. Mol Divers. 2026;30(1):613–632.
- Wang L, et al. Gut microbial bile acid metabolite skews macrophage polarization and contributes to high-fat diet-induced colonic inflammation. Gut Microbes. 2020;12(1):1–20.
- Hagan T, et al. Antibiotics-Driven Gut Microbiome Perturbation Alters Immunity to Vaccines in Humans. Cell. 2019;178(6):1313–1328.e13.
- Meng Y, et al. Jinlida ameliorates diabetic kidney disease via gut microbiota-dependent production of pyridoxamine targeting renal AGEs/RAGE and TGF-β pathways. Phytomedicine. 2026;150:157744.
- Zhou H, Zhang L, Ding C, Zhou Y, Li Y. Upregulation of HMOX1 associated with M2 macrophage infiltration and ferroptosis in proliferative diabetic retinopathy. Int Immunopharmacol. 2024;134:112231.
- Mohammad HMF, et al. Neuroprotective effect of levetiracetam in mouse diabetic retinopathy: Effect on glucose transporter-1 and GAP43 expression. Life Sci. 2019;232:116588.
- Peng H, et al. Autophagy and senescence of rat retinal precursor cells under high glucose. Front Endocrinol (Lausanne). 2023;13:1047642.
- Ding Y, Chen L, Xu J, Feng Y, Liu Q. APAF1 Silencing Ameliorates Diabetic Retinopathy by Suppressing Inflammation, Oxidative Stress, and Caspase-3/GSDME-Dependent Pyroptosis. Diabetes Metab Syndr Obes. 2024;17:1635–1649.
- Yang T, et al. Clinical study on the modulating effects of Jiaotaiwan on the modulating effects of microbiota–SCFAs–neurotransmitter/immune axis in patients with depression. Acupunct Herb Med 2025;5(4):456–468.
- Luo XX, et al. Effect of qiming granule on retinal blood circulation of diabetic retinopathy: a multicenter clinical trial. Chin J Integr Med. 2009;15(5):384–388.
- Hu Z, et al. Add-on effect of Qiming granule, a Chinese patent medicine, in treating diabetic macular edema: A systematic review and meta-analysis. Phytother Res. 2021;35(2):587–602.
- Yang M, et al. The Efficacy and Safety of Qiming Granule for Dry Eye Disease: A Systematic Review and Meta-Analysis. Front Pharmacol. 2020;11:580.
- Ma XF, et al. Efficacy and Safety of Qiming Granule for Nerve Injury Associated with Non-proliferative Diabetic Retinopathy: A Multicenter, Randomized, Non-inferiority, Active-Controlled Clinical Trial. Chin J Integr Med. 2026;32(3):195–203.
- Zhou Q, et al. Qiming granules regulate Müller cell pyroptosis and the P2X7R/NLRP3 immune inflammatory pathway in diabetic retinopathy. Chin Med. 2026;21(1):89.
- Zhou L, Qin T, Lv Y, Wu Z. Qiming Granules Ameliorate Diabetic Retinopathy by Regulating the PI3K/Akt Signaling Pathway. J Ocul Pharmacol Ther. 2026;42(3):202–212.
- Li HD, Li MX, Zhang WH, Zhang SW, Gong YB. Effectiveness and safety of traditional Chinese medicine for diabetic retinopathy: A systematic review and network meta-analysis of randomized clinical trials. World J Diabetes. 2023;14(9):1422–1449.
- Chen F, et al. Isorhamnetin promotes functional recovery in rats with spinal cord injury by abating oxidative stress and modulating M2 macrophages/microglia polarization. Eur J Pharmacol. 2021;895:173878.
- Naudhani M, Thakur K, Ni ZJ, Zhang JG, Wei ZJ. Formononetin reshapes the gut microbiota, prevents progression of obesity and improves host metabolism. Food Funct. 2021;12(24):12303–12324.
- Qu Y, et al. Kaempferol Alleviates Murine Experimental Colitis by Restoring Gut Microbiota and Inhibiting the LPS-TLR4-NF-κB Axis. Front Immunol. 2021;12:679897.
- Saikia L, et al. Therapeutic Potential of Quercetin in Diabetic Neuropathy and Retinopathy: Exploring Molecular Mechanisms. Curr Top Med Chem. 2024;24(27):2351–2361.
- Yao H, et al. Kaempferol Protects Blood Vessels From Damage Induced by Oxidative Stress and Inflammation in Association With the Nrf2/HO-1 Signaling Pathway. Front Pharmacol. 2020;11:1118.
- Zhang HX, Li YY, Liu ZJ, Wang JF. Quercetin effectively improves LPS-induced intestinal inflammation, pyroptosis, and disruption of the barrier function through the TLR4/NF-κB/NLRP3 signaling pathway in vivo and in vitro. Food Nutr Res. 2022;66:10.