本研究では、適応型シミュレーテッドアニーリング、ステージ依存の提案選択、およびリヒーティング制御を組み合わせることで、没入型展示レイアウトを最適化するための再現可能なワークフローを提示します。選択されたレイアウトをバーチャルリアリティ(VR)展示環境に実装し、空間コスト指標、参加者の行動ログ、および体験後の評価を用いて検証しました。
この記事について
サマリー
要約
没入型展示空間には、効率的な動線、明確なウェイファインディング、バランスの取れたインタラクション、および快適な環境体験をサポートするレイアウトが必要です。しかし、展示レイアウトは手動のデザイン決定によって開発されることが多く、ルート距離、視覚的なアクセシビリティ、混雑リスク、環境的快適性、およびインタラクションノードの分布を同時に評価することは困難です。本研究では、ステージ依存の提案選択と再加熱制御を備えた適応的シミュレーテッドアニーリングに基づく空間設計最適化ワークフローを開発し、評価しました。36 m x 24 m の没入型展示ホールを構築し、6つのテーマゾーン、移行廊下、1つの休憩エリア、および複数のインタラクションノードを配置しました。手動レイアウト、標準的なシミュレーテッドアニーリングによるレイアウト、および再加熱を伴う適応的シミュレーテッドアニーリングによるレイアウトの3つの条件を比較しました。最適化モデルでは、歩行距離、視覚的アクセシビリティ、混雑、環境的快適性、およびインタラクションのバランスを組み込んだ加重空間コスト関数を最小化しました。選定されたレイアウトをバーチャルリアリティ展示シーンに実装し、参加者の行動ログと体験後の評価を通じて評価しました。適応的アルゴリズムは、標準的なシミュレーテッドアニーリングよりも、最終的な空間コストが低く、改善率が高く、最適解に達するまでの反復回数が少ないことが示され、計算時間はわずかに増加しました。適応的レイアウトに割り当てられた参加者は、より高い満足度、強いプレゼンス、より明確なウェイファインディング、低い知覚的混雑、および低い認知負荷を報告し、また、より短い歩行距離、少ないためらい、長い滞在時間、およびより広範なヒートマップカバレッジでルートを完了しました。これらの知見は、テストされた展示シナリオにおける意思決定支援アプローチとして本ワークフローを支持するものであり、普遍的に最適な展示レイアウトを確立したり、すべての代替メタヒューリスティクスに対する優位性を立証したりするものではありません。
概要
没入型展示空間では、空間デザイン、デジタルメディア、インタラクティブディスプレイ、および仮想現実(VR)技術を組み合わせることが増えており、来場者が単にコンテンツを観察するのではなく、空間体験として展示の中を移動し、反応し、解釈する環境が構築されています。このような環境において、体験の質は、視覚的またはインタラクティブなコンテンツの豊かさだけでなく、ルートの連続性、視認性、混雑状況、環境的快適さ、およびインタラクション機会の分布に依存します。したがって、展示空間のデザインは多変数的な課題を含んでおり、レイアウトはナラティブの順序、知覚的な開放感、およびエンゲージメントの機会を維持しつつ、来場者を効率的に誘導しなければなりません。博物館や展示における行動研究では、来場者の体験は展示内容だけでなく、空間構成、動線構造、および解釈へのアクセシビリティによって形成されることが古くから示されています1。
空間構成理論は、展示レイアウトを分析可能な設計問題として扱うための有用な基盤を提供します。この視点では、空間は単に物体を収める受動的な容器ではなく、移動、遭遇、視認性、そして選択を組織するものです。建築的な構成は、人々が環境の中をどのように移動し、空間同士の関係性をどの程度容易に理解できるかに影響を与えます2。視認性に基づく空間分析は、視野や視線関係が、空間認知およびナビゲーションの測定可能な特性としてモデル化できることを示すことで、この見解をさらに支持しています3。これらの考え方は、没入型展示において特に重要です。なぜなら、来場者は展示の中を移動しながら、視覚情報、ルートの決定、インタラクションの合図、および環境刺激を絶えず統合させる必要があるためです。
同時に、没入型技術の発展により、物理的に実装する前に展示環境を設計し、検証する方法が拡大しました。バーチャルおよび没入型インターフェースを用いることで、研究者やデザイナーは、コンテンツや環境設定を一定に保ったまま代替的なレイアウトの比較を行うことができ、制御された空間条件下でユーザーがどのように知覚し、行動するかを検証することが可能になります4。没入型VR(仮想現実)アプリケーションのレビューでは、空間構造、インタラクションデザイン、およびタスクの明確さが、ユーザーのエンゲージメントと学習の質を決定する重要な要因であることが示されています5。また、メタ分析による根拠から、没入のレベルや種類がプレゼンス(存在感)に影響を与えることが示唆されていますが、環境の構成が悪かったり、ナビゲーションが困難であったりする場合、没入感だけではより良い結果を保証することにはなりません6。
没入型展示におけるユーザーエクスペリエンスは、プレゼンス(存在感)、認知負荷、および身体的快適さと密接に関連しています。プレゼンスは、ユーザーが媒介された環境の中に身を置いていると感じる程度を反映しており、バーチャルおよび没入型設定における重要な成果指標となります7。しかし、ナビゲーション、インタラクション、または感覚情報が十分に調整されていない場合、没入型環境は認知的な負担を生じさせる可能性があります8。そのため、展示空間の最適化は、単にインタラクションの密度や視覚的な刺激を高めるだけでなく、一貫した空間体験をサポートし、不要な経路決定を減らし、回避可能な疲労を最小限に抑える必要があります。また、不快感はバーチャルリアリティへの露出における安全性とユーザーエクスペリエンスの結果の解釈の両方に影響を及ぼす可能性があるため、シミュレーター酔いについても監視しなければなりません9。
これらの要件があるにもかかわらず、多くの展示レイアウトは依然としてデザイナーの経験や反復的な手動調整、あるいは事後の来場者観察を通じて策定されています。これらのアプローチには依然として価値がありますが、複数のレイアウト制約を同時に評価することを困難にします。没入型展示の空間設計は、ルート長、視認性、混雑度、快適性、およびインタラクションの分布を総合的に考慮した制約付き最適化問題として定式化できます。シミュレーテッドアニーリング(擬似焼きなまし法)は、大規模で不規則な解空間を探索でき、かつ改善に至らない中間解を制御しながら許容できるため、局所最適解からの脱出を助けることができ、この種の問題に適しています10。その受理ロジックはメトロポリス則に従いますが1、より一般的なメトロポリス・ヘイスティングス枠組みでは、提案カーネルが非対称である場合に前方から後方への提案密度比が導入されます12。本実装では、4つの条件付き提案カーネルが対称であるため、形式的な導出により、可逆的な実行可能移動に対するヘイスティングス比は1であることが示されます。したがって、本手法は独立したメトロポリス・ヘイスティングスサンプラーではなく、メトロポリス受理と再加熱を伴う適応的シミュレーテッドアニーリングとして記述されます。
適応型擬似アニーリングの変種では、不均一な近傍選択、冷却スケジュールの修正、再加熱、リスタート戦略、およびハイブリッド探索コンポーネントが古くから採用されてきました13,14。したがって、本実装は新しいメタヒューリスティックのプリミティブとしてではなく、アプリケーション固有の設定として解釈されるべきです。本手法の貢献は、ステージ依存の4種類のムーブ提案スケジュールと再加熱を、展示固有の実現可能性制約、透明性の高いマルチコンポーネント空間コスト関数、および参加者レベルのバーチャルリアリティ検証と明示的に結合させた点にあります15。このように位置付けを限定することで、本ワークフローを根本的に新しい最適化原理であるという主張から明確に区別しています。ステージ依存の提案選択により、探索が広範なシーケンス/パスウェイの探索から局所的な空間的精緻化へと移行し、再加熱によって停滞後の探索可動性が回復することが期待されました。この探索と活用のバランスにより、局所解への早期のトラップが減少setImageし、同一の公称イテレーション予算内で、より低コストで実現可能なレイアウトに到達する可能性が高まると期待されました。
本研究では、適応的シミュレーテッドアニーリング、ステージ依存型の提案選択、リヒーティング制御、多成分空間コストモデル、および参加者レベルのバーチャルリアリティ評価を統合した、再現可能なワークフローを提案する。本手法の貢献は、根本的に新しい最適化原理を主張することではなく、アプリケーションへの適用と再現性の確保に重点を置いたものである16。この手法を用いて、制御されたバーチャルリアリティ展示環境において、手動によるレイアウト、標準的なシミュレーテッドアニーリングによるレイアウト、およびリヒーティングを伴う適応的シミュレーテッドアニーリングによるレイアウトを比較する。本研究では、最終的な空間コスト、改善率といったアルゴリズム的な結果と、プレゼンス、ウェイファインディングの明快さ、満足度、認知負荷、歩行距離、躊躇回数、滞在時間、およびヒートマップのカバレッジを含む参加者レベルの結果の両方を検証する。主な仮説は、適応的手法が標準的なシミュレーテッドアニーリングよりも低い最終空間コストを達成すること、および参加者レベルにおいて、対応するレイアウトが手動および標準的なシミュレーテッドアニーリングのレイアウトと比較して、全体的な満足度とルート効率の結果を向上させることであった。この枠組みは、計算による探索が人間の設計判断に取って代わるのではなく、それを支援するというメタヒューリスティック設計手法の広範な論理に従っている17。
プロトコル
本研究プロトコルは河南農業大学によって審査され、2025年12月20日に正式な倫理審査を免除されることが決定されました。審査機関による個別の倫理承認番号または免除参照番号は発行されていません。登録前に、すべての参加者から書面によるインフォームドコンセントを得ました。
被験者の準備
視力が正常または矯正して正常である18~60歳の成人被験者を募集した。重度の前庭疾患、コントロールされていないてんかん、重度の視覚障害、最近の大きな手術、または過去にバーチャルリアリティ(VR)への曝露中に深刻な不快感を報告した被験者は除外した。各被験者は実験前にスクリーニングフォームに記入した。年齢層、性別、教育レベル、過去のVR体験、および過去の美術館や展覧会への訪問頻度を制御変数として記録した。
コンピュータで生成されたランダム化リストを用いて、参加者を「手動レイアウト」、「標準的なシミュレーテッドアニーリング(焼きなまし法)レイアウト」、「再加熱を伴う適応的シミュレーテッドアニーリングレイアウト」の3つのレイアウト条件のいずれかに割り当てた。レイアウト間での学習効果を避けるため、被験者間設計を採用した。割り当て比率は1:1:1とし、各条件に60名、合計180名の参加者を割り当てた。参加者の特性を記述的に評価するため、割り当て前に年齢層、性別、教育水準、過去のVR体験の有無、および美術館・展覧会の訪問頻度を記録した。これらの変数は、ランダム化後の除外基準としては使用しなかった。
展示空間モデルの作成
36 m x 24 m、天井高 4.5 m の矩形没入型展示ホールを構築した。総有効床面積は 864 m2に設定した。ホールの対向する短辺に、入口と出口をそれぞれ1か所ずつ配置した。入口と出口の幅はともに 3.0 m とし、すべてのレイアウト条件において固定とした。
展示ホールは、6つのテーマ別展示ゾーン、2つの移行通路、1つの休憩エリア、および1つのメイン来場者ルートに分割されました。各テーマゾーンの許容面積は80–130 m2に設定され、休憩エリアの割り当ては40 m2に設定されました。メイン通路の許容幅は1.8–3.5 mに設定されました。各レイアウトには8〜12個のインタラクションノードが配置されました。各インタラクションノードは、参加者が立ち止まり、デジタルコンテンツを起動し、展示物を閲覧し、または方向を変更できる地点として定義されました。
フロアプランは0.5 m x 0.5 mの格子状セルに離散化されました。この格子は、可視性分析、ルートの連続性の確認、ヒートマップの被覆率算出、および局所的な密度推定に使用されました。各テーマゾーンは、その中心座標、境界ポリゴン、面積、およびルート順序上の位置によって定義されました。各インタラクションノードは、その座標、関連するゾーン、トリガー半径、およびクリアランスエリアによって定義されました。
展示レイアウト、視認性、およびルート構造が来場者の移動、ウェイファインディング、および空間認知に影響を与えるため、空間構成をコアとなる設計変数として扱った18。空間モデルの構築からレイアウトの最適化、バーチャルシーンの実装、被験者テスト、および統計解析に至る完全なワークフローを 図1に示す。
レイアウトパラメータおよび実現可能性の制約
すべてのレイアウト条件に共通の実現可能性の制約を適用した。第一に、すべてのテーマゾーンは36 m x 24 mの境界線内に収まっている必要がある。第二に、テーマゾーン同士の重複は認められない。第三に、メインの来場者ルートは、入口、6つのテーマゾーン、休憩エリア、および出口を途切れることなく接続する必要がある。第四に、インタラクションノードがメインパスを遮断することは認められない。第五に、各インタラクションノードは少なくとも1.2 mのクリアランス半径を維持する必要がある。第六に、メインルート上の予測局所密度は1.50 persons/m2以下である必要がある。第七に、最終的なルートに行き止まりや断絶したサブパスが存在してはならない。
3つのレイアウト条件において、同一のシーンスケール、ルートルール、環境ターゲット、およびインタラクション設定を使用した。最適化アルゴリズムを実行する前に、ホールの寸法、機能ゾーンのパラメータ、経路幅の範囲、インタラクションノードの設定、実現可能性の閾値、バーチャルリアリティの設定、目的関数の重み、アルゴリズムのパラメータ、および結果の定義を記録した。これらのパラメータは本プロトコルの再現可能な境界を定義するものであり、表1にまとめられている。
空間コスト関数
各候補レイアウトは、重み付き空間コスト関数を用いて評価されました:

ここで F(x) はレイアウト x の総空間コストである。Cdistance(x) は歩行距離コスト、Cvisibility(x) は視覚的アクセシビリティコスト、Ccrowding(x) は混雑コスト、Ccomfort(x) は環境快適性ペナルティ、そして Cinteraction(x) は相互作用バランスペナルティを示す。F(x) の値が低いほど、より好ましいレイアウトであることを意味する。
歩行距離コストは次のように算出されました:

ここで、Lxはレイアウトxの総ルート長(メートル)である。参照用の最大ルート長として120 mを用いた。
視覚的アクセシビリティコストは以下のように算出しました:
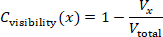
ここで、Vxはメインルートから見えるテーマゾーンの前面幅であり、Vtotalはすべてのテーマゾーンの前面幅の合計である。視線レイは、来場者ルートに沿って0.5 mごとに放射された。展示パーティション、壁、およびゾーン境界は、遮蔽物として扱った。
混雑コストは次のように算出されました:
Ccrowding(x) = min(Dmax / 1.50, 1)
ここで、Dmaxは予測される最大局所密度(persons/m2)である。メインルートには、1.50 persons/m2の上限密度しきい値を用いた。
環境快適性ペナルティは、次のように算出されました:

照度ペナルティは以下のように設定されました:
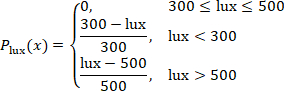
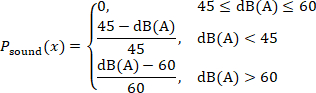
音圧ペナルティは次のように設定されました:
二酸化炭素ペナルティは次のように設定されました:

温度ペナルティは次のように設定されました:
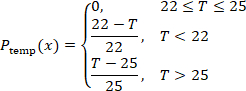
相互作用バランスペナルティは、以下のように算出されました:

ここで sk は、隣接する2つのインタラクションノード間の経路距離である。この値が低いほど、訪問者の経路に沿ってインタラクションの機会がより均等に分布していることを示す。
照明、音響、空気質、および温度は、疲労度、快適性、および展示環境への滞在意欲に影響を与えるため、環境的な快適性が含まれています19。これらの環境範囲は、普遍的な規制制限ではなく、プロトコルの制御目標です。300–50 lxの照度帯は、現在の中国の建築および博物館照明のガイダンスと一致しています。二酸化炭素の目標値である<90 ppmは、GB/T 1883-202における日平均制限値である1,0 ppmよりも意図的に保守的に設定されています20,21。2–25 °Cの温度帯は、軽い活動を行う利用者の一般的に認められている熱的快適条件の範囲内です2。また、45–60 dB(A)は、法定の室内騒音制限ではなく、制御された環境音帯として使用されています23,24。
目的関数の重みは、普遍的な係数や参加者の結果から適合させた選好推定値ではなく、シナリオ固有の明示的な設計優先順位として選択されました。ルート効率と混雑制御を2つの主要な運用上の制約として扱ったため、「歩行距離」と「混雑度」にはそれぞれ0.25の重みを割り当てました。「視覚的アクセシビリティ」には、視認性が方向感覚や展示物の露出に影響するため0.20を割り当てました。また、「環境的快適性」と「インタラクション」にはそれぞれ0.15を割り当て、これらの要因が循環に関する項を支配することなく探索に影響を与えるようにしました。展示の優先順位は文脈によって異なる可能性があるため、本プロトコルでは各重みを個別に±10%変動させ、合計が1.00になるよう残りの重みを比例的に再正規化することで、局所的な重みの堅牢性を検証します。したがって、得られた係数は、芸術的、歴史的、科学的、または商業的な展示に合わせて再調整可能な、プロトコル固有の設計設定として解釈されるべきです。
手動によるレイアウト生成
ベースライン条件として、手動によるレイアウトを作成した。6つのテーマゾーンを、入口から出口まで従来のナラティブな順序で配置した。休憩エリアはルートの中間付近に配置した。メイン通路の初期幅員は2.2 mに設定した。インタラクションノードは、各テーマゾーンの入口付近および主要なルートの転換点に配置した。手動レイアウトについて、すべての実現可能性制約に対する検証を行った。ゾーンの境界は、制約に違反した場合のみ調整した。レイアウトの実現可能性が確認された後、総ルート長、視認可能な前面比率、最大局所密度、環境快適性ペナルティ、インタラクション間隔係数、および総空間コストを記録した。
標準的な焼きなまし法
実行可能な手動レイアウトを初期状態として使用した。初期温度を10、冷却係数を0.95、最大反復回数を1,50回、停滞しきい値を20回に設定した。アルゴリズムは30個の独立した乱数シードを用いて実行した。これらの値は、計算予算を一致させるために使用した運用プロトコルの設定であり、文献由来の普遍的な定数や、結果に合わせて調整された最適値として提示したものではない。T₀ = 100により初期段階での広範な探索を可能にし、α = 0.95によって緩やかな冷却を行い、1,500回の反復により各実行に同一の上限検索予算を割り当て、20回の停滞しきい値によって改善が見られない場合の過度な継続を防止した。適応的手法においても同一の温度および最大反復回数の設定を用いたことで、差異が名目上の検索予算の大きさではなく、提案スケジューリングと再加熱に起因することを担保した。
各反復において、1つの移動を適用することで、1つの隣接レイアウトを生成しました。移動の内容は、1つのテーマゾーンを0.5–2.0 m移動させる、2つのテーマゾーンの順序を入れ替える、1つの経路セグメントを0.1–0.3 m調整する、または1つのインタラクションノードを0.5–1.5 m移動させるかのいずれかです。提案されたレイアウトが実現可能性の制約に抵触した場合は、即座に却下されました。
提案されたレイアウトが実現可能であり、空間コストがより低い場合は、それが採用されました。空間コストが高かった場合は、以下の確率式に従って採用されました:
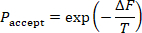
ここで、ΔFは空間コストの増加量を、Tは現在の温度を表します。各反復後の温度は、以下を用いて更新されました:
T新規 = 0.95T旧
各ランは、最大反復回数に達したとき、または最良の空間コストが20回連続して改善されなかったときに停止させました。展示レイアウトの最適化は、全探索では効率的に解決できない組み合わせ空間問題であるため、模擬的にアニーリングがこのタスクに適していると考えられました。
標準的なシミュレーテッドアニーリング(SA)は、レイアウトエンコーディング、実行可能ルール、目的関数、初期化、温度スケジュール、および計算予算が適応条件と同じであるため、主要な数値アルゴリズムのベンチマークとして使用されました。標準的なシミュレーテッドアニーリングは、本研究における唯一の数値的メタヒューリスティック比較対象であり、したがって、ワークフローレベルでの提案スケジューリングおよび再加熱の追加に対する、整合性の取れたアブレーションのようなベースラインとして機能しました。遺伝的アルゴリズム、粒子群最適化、蟻コロニー最適化、および学習ベースの最適化手法は実験に含まれていないため、性能に関する主張は、整合した標準SAベースラインに限定されました。各実行において、乱数シード、初期空間コスト、最終空間コスト、改善率、最良解に至るまでの反復回数、実行時間、採択率、および実行可能性の状態が保存されました。改善率は以下の式を用いて算出されました:

再加熱を伴う適応的シミュレーテッドアニーリング
標準的なシミュレーテッドアニーリング条件と同様の初期レイアウト、実行可能制約、初期温度、冷却係数、最大反復回数、および30個のランダムシードを使用した。適応的アルゴリズムは、実行可能な候補レイアウトに対する標準的なメトロポリス受容規則を維持しつつ、ステージ依存のムーブクラス確率と再加熱ルールのみが異なっていた。4つの提案ムーブクラスとして、局所変位(L)、ゾーンシーケンス・スワップ(S)、パス幅調整(W)、および相互作用ノード再配置(N)を定義した。全反復回数の最初の40%の間、ムーブクラス確率は pL = 0.20, pS = 0.35, pW = 0.30, pN = 0.15 に設定された。残りの60%の間は、pL = 0.35, pS = 0.15, pW = 0.20, pN = 0.30 に設定された。このムーブクラス頻度の変更により、探索の重点を広範なシーケンス・パスの探索から、局所的な空間的精緻化および相互作用ノードの調整へと移行させた。
イテレーション t において、提案密度全体は q(x′|x,t) = pm(t)qm(x′|x) と表され、ここで m ∈ {L,S,W,N} は選択されたムーブクラスを、pm(t) はそのフェーズ固有の確率を表します。局所変位(local displacement)の場合、6つのテーマゾーンのうち1つが均一に選択され、変位方向が [0,2π) から均一に抽出され、変位量(magnitude)が [0.5,2.0] m から均一に抽出されました。したがって、qL は (1/6)(1/2π)(1/1.5) に比例します。ゾーンシーケンスのスワップ(zone-sequence swap)の場合、順序のない15のゾーンペアのうち1つが均一に選択され、qS = 1/15 となります。経路幅の調整(pathway-width adjustment)の場合、J 個の調整可能な経路セグメントのうち1つが均一に選択され、符号付きの変化量が [−0.3,−0.1] ∪ [0.1,0.3] m から均一に抽出され、qW = (1/J)(1/0.4) となります。相互作用ノードの再配置(interaction-node relocation)の場合、K 個の現在の相互作用ノードのうち1つが均一に選択され、方向が [0,2π) から均一に抽出され、変位量が [0.5,1.5] m から均一に抽出され、qN は (1/K)(1/2π)(1/1.0) に比例します。制約に違反する提案は却下され、自己遷移としてカウントされました。

本実装におけるすべての可逆で実行可能な遷移について、条件付き提案カーネルは対称的であった。 qm(x′|x) = qm(x|x′)。同じ位相特異的なムーブクラス確率であるため pm(t) が、特定のイテレーションにおける順方向および逆方向の遷移に適用された。 q(x|x′,t)/q(x′|x,t) = 1 となる。したがって、受理確率は標準的なシミュレーテッドアニーリングのメトロポリス則に簡略化される。 A(x→翻訳するソーステキストが提供されていません。翻訳が必要なテキストを入力してください。′) = min{1, exp[−(C(x′)−C(x))/T]}. 非自明なヘイスティングス補正は適用されていない。したがって、本手法はメトロポリス・ヘイスティングス・サンプラーではなく、再加熱を伴う適応的シミュレーテッドアニーリングと称される。25.
最高の空間コストが150回連続して改善されなかった場合にリヒーティングを適用し、標準的なシミュレーテッドアニーリングで用いられる20回の停滞による停止よりも前に意図的な介入を行った。現在の温度を10%上昇させ、1回の実行につき最大3回までリヒーティングイベントを許可した。標準的なシミュレーテッドアニーリング条件と同様のアルゴリズム性能変数を保存した。本実験では、段階依存的な提案スケジュールとリヒーティング構成の組み合わせを評価したため、各構成要素の独立した因果的寄与については推定していない。正確な提案、実現可能性、メトロポリス受容、温度更新、リヒーティング、および出力保存のシーケンスに関する段階的な疑似コードは、Supplementary File 3に記載されている。
Treheated = 1.10Tcurrent
最終レイアウト
各条件について、1つの最終レイアウトを選出した。手動条件では、実現可能な手動レイアウトを使用した。標準的な焼きなまし法(simulated annealing)条件では、30回の試行の中で最終的な空間コストが最も低かったランを選択した。再加熱を伴う適応的焼きなまし法条件では、30回の試行の中で実現可能であり、かつ最終的な空間コストが最も低かったランを選択した。選択したレイアウトを書き出す前に、最終的な実現可能性チェックを行い、すべてのゾーンが境界内にあり、ゾーン同士の重複がなく、経路が連続しており、入口と出口に変更がなく、インタラクションノード間のクリアランスが1.2 m以上であること、最大密度が1.50 persons/m2未満に維持されていること、およびすべてのテーマゾーンがメインルートから到達可能であることを確認した。
バーチャル展示シーン
Unity 202.3.22f1 LTS (Unity Technologies) と XR Interaction Toolkit 2.5.4 を使用して、3つのバーチャル展示シーンを構築した。これらのシーンは、6自由度のヘッドおよびコントローラートラッキングを備えた Meta Quest 2 ヘッドマウントディスプレイ (Meta Platforms) を通じて提示された。展示内容、ビジュアルスタイル、オブジェクトモデル、サインのスタイル、ライティングアセット、環境音、インタラクションメカニズム、およびナビゲーション指示は、3つのシーンすべてで同一に設定した。空間配置、ルートの順序、通路の幅、およびインタラクションノードの配置のみを変更した。
仮想カメラの高さは1.65 mに、歩行速度は1.2 m/sに設定した。テレポート機能は無効にした。入口には同一の開始トリガーを、出口には同一の完了トリガーを使用した。インタラクションノードのトリガー半径は1.0 mに設定した。各インタラクションノードを訪問したかどうかを記録した。
すべてのシーンにおいて、同一の6つのテーマ内容が使用されました。レイアウト条件に関わらず、各テーマは対応するゾーンに割り当てられました。壁の高さ、パーテーションのスタイル、メディアディスプレイのサイズ、テキスト密度、および展示物のスケールは一定に保持されました。レイアウト条件を制御した状態で、空間的なプレゼンス、ルートの明快さ、および来場者体験を検証できるため、本プロトコルにはバーチャルリアリティ環境が適切であると判断されました26。
本プロトコルを再現するために必要なハードウェア、ソフトウェア、環境モニタリングツール、アンケート/コードブックファイル、および解析リソースは、材料表(Table of Materials)に記載され、補足ファイル1~3(Supplementary Files 1–3)としてまとめられています。登録済みのリサーチリソース識別子(RRID)を持つ研究リソースは、材料表(Table of Materials)にRRIDとともに記載されています。
参加者のセッション
参加者は1人ずつテストを受けました。セッション開始前に、参加者は2分間安静にしました。ヘッドマウントディスプレイを装着し、参加者が快適に感じるよう瞳孔間距離を調整しました。展示の一部ではない2分間の練習シーンが提供されました。この練習シーンは、参加者が動作とインタラクションに慣れるためだけに使用されました。
参加者を1人ずつテストしたため、プロトコルにおける混雑は、同時に発生する集団の移動ではなく、モデルに基づく密度推定によって表現されました。したがって、マルチユーザーの共在、対人回避、および動的な群衆相互作用は直接的にシミュレートされておらず、群衆に関連する結果を解釈する際に考慮されました。
練習の後、指定された展示シーンを開始した。参加者は、展示に入場し、自然にルートに従って進み、マークされたノードとインタラクションを行い、6つのテーマゾーンすべてを完了した後に退場するように指示された。追加のルートガイダンスは、参加者が30 s以上前進できなかった場合にのみ提供された。完了時間、滞在時間、歩行距離、躊躇回数、インタラクションノードへの訪問回数、および軌跡座標が自動的に記録された。
参加者が終了トリガーに到達した時点でセッションを終了した。ヘッドマウントディスプレイを取り外し、参加者に3分間の休憩を与えた。休憩後、直ちに参加者に体験後アンケートに回答させた。
行動的、環境的およびアンケートによるアウトカム
完了時間は、進入トリガーの作動から退出トリガーの作動までの時間と定義した。滞在時間は、テーマゾーンおよびインタラクションノード領域内で過ごした合計時間と定義した。歩行距離は、軌跡座標からの累積経路長と定義した。躊躇回数は、インタラクションノード領域外で3 sより長く停止した回数と定義した。ヒートマップのカバー率は、以下を用いて算出した:

平均照度はTesto 540照度計(Testo SE & Co. KGaA)を用いて、音圧レベルはTesto 816-1クラス2騒音計(Testo SE & Co. KGaA)を用いて、二酸化炭素濃度はTesto 535 CO₂測定器(Testo SE & Co. KGaA)を用いて、そして周囲温度はTesto 605i温湿度計(Testo SE & Co. KGaA)を用いてそれぞれ記録した。3つのシーン条件すべてにおいて、同一のモニタリング位置を使用した。照度はlx、音圧レベルはdB(A)、二酸化炭素はppm、温度は°Cで記録した。
プレゼンスおよび空間的プレゼンスのドメインは、研究プロトコルで規定された7点評定構造を用いて測定されました。これらの構成概念は、WitmerおよびSingerによる妥当性の確認されたPresence Questionnaire (PQ) フレームワーク、およびSchubertらによるIgroup Presence Questionnaire (IPQ) フレームワーク27を基準として解釈されました。研究変数は、標準的なPQまたはIPQの合計スコアではなく、ドメインレベルの7点スコアとして報告されました。シミュレーター酔いについては、Simulator Sickness Questionnaireの症状フレームワークを、事前に規定した0–30の研究要約変数とともに使用し、数値が高いほど不快感が強いことを示しました。この0–30の研究要約は、シミュレーター酔いの測定慣習とサイバー酔いの報告の区別に合わせ28、標準的な加重SSQ Total Severityスコアとは別に報告されました。インタラクションの質、経路探索の明快さ、視覚的快適性、音響的快適性、熱的快適性、知覚された混雑度、認知負荷、および総合的な満足度は、本研究固有の複数項目からなる7点評定尺度を用いて測定されました。補足ファイル2に、各ドメインの構成概念の出典、スコア範囲、および報告慣習が記載されています。
研究結果
主要なアルゴリズム上の評価項目は、最終的な空間コストと定義されました。主要な訪問者体験の評価項目は、総合的な満足度と定義されました。二次的なアルゴリズム上の評価項目は、改善率、最適解に達するまでの反復回数、実行時間、および受理率と定義されました。二次的な訪問者体験の評価項目は、プレゼンス、空間的プレゼンス、インタラクションの質、ウェイファインディングの明快さ、視覚的快適性、音響的快適性、熱的快適性、知覚される混雑度、認知負荷、シミュレーター酔い、完了時間、滞在時間、歩行距離、ためらい回数、およびヒートマップのカバー範囲と定義されました。完了時間と歩行距離は、ルート効率を評価するために用いられました。ためらい回数とウェイファインディングの明快さは、ナビゲーションの質を評価するために用いられました。プレゼンス、空間的プレゼンス、インタラクションの質、および滞在時間は、没入型のエンゲージメントを評価するために用いられました。知覚される混雑度、認知負荷、快適性の評価、およびシミュレーター酔いは、体験的負担を評価するために用いられました。
データのクリーニングおよび品質管理
解析前に、すべての参加者の記録を確認した。各記録に単一の参加者識別子、単一の条件ラベル、完全な行動ログおよび質問票スコアが含まれており、識別子の重複がないことを確認した。存在感、空間的存在感、および研究固有の体験評価は、定義された1–7の範囲に制限した。シミュレーター酔いの研究サマリー変数は、事前に指定された0–30の範囲に制限した。質問票/コードブックファイルを確認し、解析に使用された構成概念の根拠、回答範囲、ドメイン構成、および算出スコアの定義が記載されていることを確認した。
セッションが完了しなかった場合、完了時間が3 min未満または25 minを超えた場合、ヒートマップのカバー率が10%未満であった場合、軌跡ログが不完全または技術的に無効であった場合、不完全または無効な軌跡記録に伴い歩行距離が20 m未満であった場合、あるいは参加者が早期終了を希望した場合は、その参加者の記録を除外した。歩行距離の上限カットオフは適用せず、有効な観察範囲全体にわたって歩行距離を連続的な研究アウトカムとして保持した。実行されたアルゴリズムが実現可能性の制約のいずれかに違反した場合は、レイアウト選定から除外した。再現性を確保するため、乱数シード、レイアウトファイル、アルゴリズムの出力、アンケート/コードブックファイル、および解析スクリプトを保存した。確率的最適化の出力は、初期化および提案動作によって変動する可能性があるため、乱数シードの保存が必要であった29。
アルゴリズムの性能
30回の標準的なシミュレーテッドアニーリング実行と、30回の再加熱を伴う適応的シミュレーテッドアニーリング実行を分析した。初期空間コスト、最終空間コスト、改善率、最適解までの反復回数、実行時間、および採択率を平均値 ± 標準偏差(SD)としてまとめ、群間平均およびアルゴリズム間の差について95%信頼区間を報告した。
正規性は、分位点-分位点(Q-Q)プロットおよびShapiro-Wilk検定を用いて評価した。分散の均一性は、Levene検定を用いて評価した。前提条件を満たしている場合は、独立標本 t 検定を用いて2つのアルゴリズム条件を比較した。前提条件を満たしていない場合は、Mann-Whitney U検定を用いた。両側 p 値、95%信頼区間、および効果量を報告した。Cohen's d は以下の式を用いて算出した。

ここで:

ノンパラメトリック比較には、ランク二系列相関係数が用いられた。感度分析は、各目的関数の重みを個別に±10%変更し、合計が1.0になるように残りの4つの重みを比例的に再正規化することで実施した。それぞれの代替重みベクトルについて、最終的な空間コストと改善率を再計算した。再加熱条件を伴う適応シミュレーテッドアニーリングが、代替的な重み設定全般にわたってより低い最終空間コストを維持した場合に、アルゴリズムの比較は安定しているとみなした。
参加者のアウトカム分析
3つのレイアウト条件における参加者のアウトカムは、IBM SPSS Statistics 27.0 (IBM Corp.) を用いて分析した。連続変数は平均値 ± SD で、カテゴリー変数は数および割合で報告した。正規性は Q-Q プロットおよび Shapiro-Wilk 検定を用いて評価した。分散の均一性は Levene 検定を用いて評価した。分散の均一性が許容範囲内で正規分布したアウトカムには、一元配置分散分析 (ANOVA) を用いた。分散の均一性の仮定が満たされない場合は Welch の ANOVA を用いた。非正規分布のアウトカムには Kruskal-Wallis 検定を用いた。
手動レイアウト、標準的な焼きなまし法(simulated annealing)によるレイアウト、および再加熱を伴う適応的焼きなまし法によるレイアウトの間で、ペアごとの比較を行った。各アウトカムにおける3つのペア比較は、ホルム法を用いて調整した。95%信頼区間を、調整後のp値と共に報告した。標準的なANOVAではエータ二乗を、ウェルチのANOVAではオメガ二乗を、クラスカル・ウォリス検定ではイプシロン二乗を、そしてペア比較では標準化平均差をそれぞれ報告した。補足的な頑健性解析として、グループごとの平均値、標準偏差(SD)、および1グループあたりn = 60からペアごとのウェルチのコントラストを算出した。ウェルチの自由度、両側p値、ホルム調整後のp値、平均差の95% CI、およびHedges gを算出した。この補足解析ではグループレベルの統計量を使用し、付録表1(Supplementary Table 1)に提示した。
ランダム化された1:1:1の3群比較を主解析とした。サンプルの特性を明らかにし、明らかな不均衡を特定するため、割り当て前に年齢層、性別、教育レベル、過去のVR経験、および美術館・展示会の訪問頻度を記録した。本試験はサブグループ間相互作用テストを想定して設計または検定力を設定しておらず、事前規定の調整モデルも含まれていなかった。したがって、これらの特性は実証された調整変数ではなく、文脈変数として扱った。ランダム割り当てにより、ベースライン特性に対する設計上の制御を行ったが、事前のVR習熟度による残留影響については、明示的に制限事項として保持した。Eta-squaredは以下を用いて算出した。
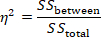
Kruskal-Wallis検定におけるイプシロン二乗は、次のように算出しました:
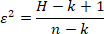
ここで、Hはクラスカル-ウォリス検定統計量、kは群数、nは全サンプルサイズである。
空間的な効率性と没入感のある来場者体験を直接的に反映する変数であるため、解釈においては、全体的な満足度、プレゼンス、ウェイファインディングの明快さ、知覚された混雑度、認知負荷、完了時間、歩行距離、躊躇回数、およびヒートマップのカバー範囲を優先しました。
結果
Participant flow and data completeness
A total of 180 participants completed the immersive exhibition experiment and were included in the final analysis. The three layout conditions were balanced, with 60 participants assigned to the manual layout, 60 to the standard simulated annealing layout, and 60 to the adaptive simulated annealing with reheating layout. No participant record was excluded after data quality control. All behavioral logs and post-experience questionnaire scores were complete. Environmental measurements were recorded as experimental control checks rather than participant outcomes; the same monitoring positions and prespecified target ranges were used across all three scene conditions, and these variables were not included in the between-condition inferential analysis.
The final analysis included 180 participant-session records and 60 algorithm runs from the two optimization conditions. The manual layout served as the non-optimized baseline. The standard simulated annealing and adaptive simulated annealing with reheating conditions each included 30 independent optimization runs. The main algorithmic, behavioral, and questionnaire outcomes are summarized in Table 2.
Questionnaire reliability and score distribution
Before comparing layout conditions, the internal consistency of the multi-item questionnaire domains was examined. The questionnaire domains showed acceptable to good reliability, with Cronbach’s alpha values ranging from 0.78 to 0.91. Presence, spatial presence, interaction quality, wayfinding clarity, comfort-related ratings, cognitive load, and overall satisfaction all met the predefined reliability threshold of 0.70.
Score distributions were also reviewed before group comparison. No substantial ceiling effect or floor effect was observed for the primary visitor-experience outcome. Overall satisfaction, presence, wayfinding clarity, and cognitive load showed sufficient variability across the three layout conditions. Simulator sickness scores were right-skewed, as expected for short-duration virtual-reality exposure, and were therefore interpreted alongside distributional checks and nonparametric sensitivity testing.
Algorithm performance
The adaptive simulated annealing with reheating algorithm produced a lower final spatial cost than standard simulated annealing. The mean final spatial cost was 0.475 ± 0.019 (95% CI, 0.468–0.482) for standard simulated annealing and 0.424 ± 0.016 (95% CI, 0.418–0.430) for Adaptive SA-R. The mean between-algorithm difference (Adaptive − Standard) was −0.051 (95% CI, −0.060 to −0.042), with Welch t = 11.25, p < 0.001, and Cohen's d = 2.90.
The improvement percentage was higher in the adaptive algorithm condition: 24.91% ± 3.22% for standard simulated annealing and 32.54% ± 3.29% for Adaptive SA-R, a mean difference of +7.63 percentage points (95% CI, 5.95–9.31; Welch t = 9.07; p < 0.001; d = 2.34). Adaptive SA-R reached the best solution in 722.20 ± 90.19 iterations versus 925.47 ± 86.38 for standard simulated annealing, a difference of −203.27 iterations (95% CI, −248.91 to −157.63; Welch t = 8.92; p < 0.001; d = 2.30).
Runtime was modestly longer for Adaptive SA-R. Mean runtime increased from 47.83 ± 9.42 s to 55.86 ± 9.49 s, a mean increase of 8.03 s (95% CI, 3.14–12.92; Welch t = 3.29; p = 0.002; d = 0.85), corresponding to a 16.8% relative increase. Acceptance rate increased from 0.294 ± 0.045 to 0.372 ± 0.054, a mean difference of +0.078 (95% CI, 0.052–0.104; Welch t = 6.08; p < 0.001; d = 1.57). In return, the mean final spatial cost was 10.7% lower, and the number of iterations to the best solution was 22.0% lower. This is interpreted as a modest computational cost within the tested problem size rather than as evidence of universal computational superiority.
The convergence curves showed that the adaptive simulated annealing with reheating algorithm reduced spatial cost more rapidly during the early search stage and maintained a lower cost trajectory during later iterations. Across independent runs, the adaptive algorithm showed numerically lower variability in final spatial cost; this descriptive difference was not subjected to a separate formal variance test. The algorithm performance results, including final spatial cost, improvement percentage, iterations to the best solution, runtime, acceptance rate, and representative convergence curves, are shown in Figure 2.
Visitor-experience outcomes
Overall satisfaction differed across the three layout conditions. Participants in the manual layout condition reported a mean of 3.59 ± 0.45 (95% CI, 3.47–3.71), the standard simulated annealing layout a mean of 3.96 ± 0.44 (95% CI, 3.85–4.07), and the adaptive simulated annealing with reheating layout a mean of 4.37 ± 0.31 (95% CI, 4.29–4.45). The between-condition effect was large. Overall satisfaction was not a component of the spatial-cost function and, therefore, is not directly optimized by the algorithm.
Presence and spatial presence followed the same pattern. Presence increased from 3.77 ± 0.56 in the manual layout condition to 3.99 ± 0.55 in the standard simulated annealing condition and 4.28 ± 0.42 in the adaptive simulated annealing with reheating condition. Spatial presence increased from 3.75 ± 0.64 to 3.96 ± 0.63 and 4.27 ± 0.47 across the same three conditions.
Interaction quality and wayfinding clarity also improved under the optimized layouts. Interaction quality increased from 3.74 ± 0.56 in the manual layout condition to 4.00 ± 0.57 in the standard simulated annealing condition and 4.24 ± 0.57 in the adaptive simulated annealing with reheating condition. Wayfinding clarity increased from 3.61 ± 0.58 to 3.90 ± 0.57 and 4.17 ± 0.48, respectively.
The optimized layouts reduced negative experience indicators. Perceived crowding decreased from 3.01 ± 0.49 in the manual layout condition to 2.75 ± 0.55 in the standard simulated annealing condition and 2.56 ± 0.45 in the adaptive simulated annealing with reheating condition. Cognitive load decreased from 3.21 ± 0.48 to 2.87 ± 0.52 and 2.73 ± 0.44. Simulator sickness was lowest in the adaptive layout condition, decreasing from 2.52 ± 0.55 in the manual layout condition to 2.44 ± 0.58 in the standard simulated annealing condition and 2.12 ± 0.56 in the adaptive simulated annealing with reheating condition.
Comfort-related ratings showed consistent but more moderate improvements. Visual comfort increased from 3.67 ± 0.44 in the manual layout condition to 3.87 ± 0.44 in the standard simulated annealing condition and 4.07 ± 0.45 in the adaptive simulated annealing with reheating condition. Acoustic comfort increased from 3.64 ± 0.52 to 3.75 ± 0.42 and 3.97 ± 0.44. Thermal comfort increased from 3.69 ± 0.46 to 3.79 ± 0.32 and 3.94 ± 0.44. The main visitor-experience and behavioral outcomes are shown in Figure 3.
Behavioral outcomes
Behavioral trajectory data supported the questionnaire findings. Completion time decreased across the three layout conditions. Participants in the manual layout condition required 19.11 ± 2.63 min to complete the exhibition, compared with 17.42 ± 2.77 min in the standard simulated annealing condition and 14.93 ± 2.32 min in the adaptive simulated annealing with reheating condition.
Walking distance showed a similar reduction. The mean walking distance was 234.88 ± 24.34 m in the manual layout condition, 217.95 ± 24.33 m in the standard simulated annealing condition, and 201.86 ± 23.47 m in the adaptive simulated annealing with reheating condition. Hesitation count also decreased, from 7.10 ± 1.80 in the manual layout condition to 5.51 ± 1.79 in the standard simulated annealing condition and 4.07 ± 1.99 in the adaptive simulated annealing with reheating condition.
Dwell time and heatmap coverage increased under the optimized layouts. Dwell time increased from 11.17 ± 2.03 min in the manual layout condition to 12.24 ± 2.04 min in the standard simulated annealing condition and 13.39 ± 2.28 min in the adaptive simulated annealing with reheating condition. Heatmap coverage increased from 66.18% ± 9.40% to 74.14% ± 7.93% and 84.40% ± 9.47%, respectively.
These findings indicate that the adaptive layout did not simply shorten the route. It reduced inefficient movement and hesitation while increasing dwell time and spatial coverage.
Spatial layout and trajectory distribution
The optimized layouts showed visible differences in route organization and spatial coverage. Compared with the manual layout, the standard simulated annealing layout reduced unnecessary route turning and improved continuity between thematic zones. The adaptive simulated annealing with reheating layout further produced a more balanced distribution of exhibition zones and interaction nodes, with fewer local congestion points along the main route.
The trajectory heatmaps showed that participants in the adaptive layout condition covered a larger proportion of the exhibition hall while maintaining shorter walking distances and fewer instances of hesitation. In the manual layout condition, trajectories were more concentrated around several turning points and transition areas. Under standard simulated annealing conditions, the trajectory distribution became more continuous but still exhibited several local regions of repeated movement. Under adaptive simulated annealing with reheating, the trajectory pattern was broader and more evenly distributed across the exhibition space. The spatial layouts and visitor trajectory heatmaps are shown in Figure 4.
Statistical comparison of participant outcomes
Group comparisons showed clear between-condition differences in the primary and major secondary outcomes. Overall satisfaction differed significantly across conditions, with the highest score observed in the adaptive simulated annealing with reheating condition. Heatmap coverage, completion time, hesitation count, walking distance, wayfinding clarity, and presence also showed strong between-condition effects.
The largest effects were observed for heatmap coverage, overall satisfaction, hesitation count, and completion time. Heatmap coverage showed a large between-condition effect, with η2 = 0.413. Overall satisfaction also showed a large effect, with η2 = 0.386. Hesitation count and completion time showed large effects, with η2 = 0.311 and η2 = 0.311, respectively. Walking distance showed a moderate-to-large effect, with η2 = 0.242.
Pairwise sensitivity analyses supported the principal three-group comparisons. Relative to standard simulated annealing, Adaptive SA-R increased overall satisfaction by 0.41 points (95% CI, 0.272–0.548; Holm-adjusted p < 0.001; Hedges g = 1.07), presence by 0.29 (95% CI, 0.113–0.467; adjusted p = 0.003; g = 0.59), and wayfinding clarity by 0.27 (95% CI, 0.079–0.461; adjusted p = 0.012; g = 0.51). It reduced completion time by 2.49 min (95% CI, −3.414 to −1.566; adjusted p < 0.001; g = −0.97), walking distance by 16.09 m (95% CI, −24.733 to −7.448; adjusted p < 0.001; g = −0.67), and hesitation count by 1.44 (95% CI, −2.124 to −0.756; adjusted p < 0.001; g = −0.76), while increasing heatmap coverage by 10.26 percentage points (95% CI, 7.101–13.419; adjusted p < 0.001; g = 1.17). Perceived crowding was 0.19 points lower (95% CI, −0.372 to −0.008; adjusted p = 0.041; g = −0.38), and the 0–30 simulator-sickness study summary was 0.32 points lower (95% CI, −0.526 to −0.114; adjusted p = 0.005; g = −0.56). The complete three-contrast results for all participant outcomes are reported in Supplementary Table 1.
Distributional and variance assumptions were evaluated using Q-Q plots, Shapiro-Wilk tests, and Levene tests before choosing the prespecified parametric or robust alternative. Nonparametric sensitivity testing was used for outcomes that were clearly non-normal. Pairwise comparisons were adjusted with the Holm method, and 95% confidence intervals are reported for principal group means, algorithmic between-group differences, figure error bars, and the supplementary summary-statistic pairwise contrasts. No subgroup or moderator effects are inferred from the contextual covariates because these analyses were not prespecified or powered.
Several participant-level outcomes provide convergent validation beyond the variables directly minimized by the spatial-cost function. Overall satisfaction, presence, cognitive load, simulator sickness, dwell time, and heatmap coverage are not explicit terms in the objective function. Their between-layout differences therefore extend the evaluation beyond simple re-expression of route length or crowding penalties, although they remain measured within the same controlled virtual-reality experiment and should not be interpreted as fully independent real-world validation.
Sensitivity analysis
Sensitivity analysis varied each objective-function weight by ±10% individually and proportionally renormalized the remaining weights to maintain a total weight of 1.00. Across the alternative weight settings, the adaptive simulated annealing with reheating condition retained the lowest mean final spatial cost. The direction of the comparison remained unchanged for the final spatial cost, the improvement percentage, and the number of iterations to the best solution. These results support local robustness to moderate weight perturbations but do not establish that the same weight vector is appropriate for other types of exhibitions.
The stability analysis indicates that the adaptive algorithm was not solely dependent on one nominal weight configuration. The visitor-experience pattern was also consistent with the algorithmic results: the layout with the lowest spatial cost showed the highest satisfaction, stronger presence, clearer wayfinding, and broader heatmap coverage.
The implementation is parameter-driven rather than hard-coded to a single floor plan: hall boundary, grid resolution, zone number and allowable area, pathway-width range, density ceiling, interaction-node count, environmental targets, and objective weights are external configuration values. These inputs can be replaced without changing the proposal/accept/reheat search logic, providing structural portability to other encoded layouts. This is a software architecture property, not empirical evidence of generalization; performance has been demonstrated only for the current 36 m x 24 m rectangular single-floor scenario.
Summary of findings
Within the tested 36 m x 24 m single-floor exhibition scenario, the adaptive simulated annealing with reheating method generated the lowest spatial cost, the highest improvement percentage, and the most favorable participant-experience profile among the three evaluated layout conditions. Compared with the manual layout, the adaptive layout produced higher satisfaction, stronger presence, clearer wayfinding, lower crowding and cognitive load, shorter completion time and walking distance, fewer hesitation events, longer dwell time, and broader heatmap coverage. These findings describe performance under the predefined objective function and experimental conditions and should not be interpreted as proof of a universally optimal exhibition layout. Compared with standard simulated annealing, the adaptive algorithm exhibited stronger optimization performance and better participant-level outcomes, albeit at a modest increase in runtime. The combined algorithmic, behavioral, questionnaire, and trajectory-heatmap results support the proposed layout-optimization workflow for immersive exhibition-space environmental design.
Data availability
The source data materials associated with the current study are available on Figshare: Zhang, Guangping; Hui, Xianghui; Wang, Hanye (2026). Optimizing Immersive Exhibition Space Design Using Adaptive Simulated Annealing with Reheating and Virtual Reality Evaluation. figshare. Dataset. https://doi.org/10.6084/m9.figshare.33313611.v1
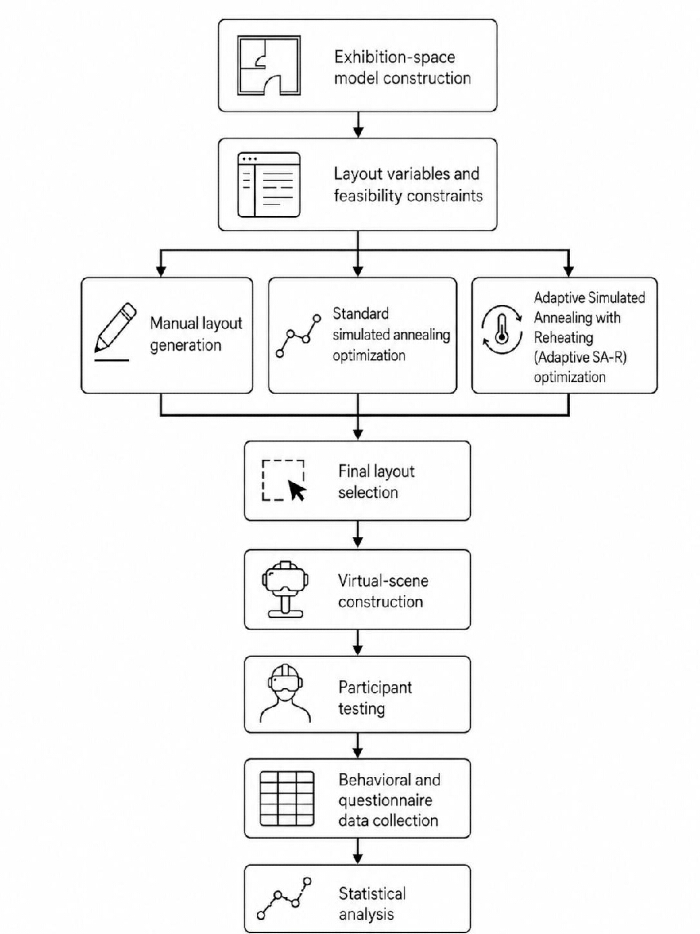
Figure 1: Workflow for immersive exhibition-space layout optimization and virtual-reality evaluation. The workflow includes exhibition-space model construction, definition of layout variables and feasibility constraints, manual layout generation, standard simulated annealing optimization, adaptive simulated annealing with reheating optimization, final layout selection, virtual-scene construction, participant testing, behavioral and questionnaire data collection, and statistical analysis. The figure summarizes the full methodological sequence used to link spatial design optimization to immersive experience evaluation. No panel subdivision or statistical notation is used in this figure. Please click here to view a larger version of this figure.
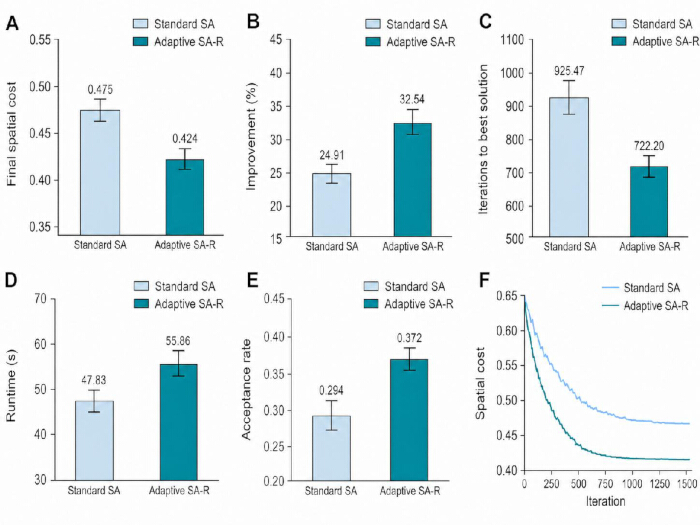
Figure 2: Algorithm performance of standard simulated annealing and adaptive simulated annealing with reheating. (A) Final spatial cost across independent optimization runs. (B) Improvement percentage from initial to final spatial cost. (C) Number of iterations required to reach the best solution. (D) Runtime in seconds. (E) Acceptance rate during the search process. (F) Representative convergence curves showing spatial cost across iterations. Standard SA denotes standard simulated annealing; Adaptive SA-R denotes adaptive simulated annealing with reheating. Panels A–E include n = 30 independent optimization runs per algorithmic condition. Central markers/bars represent the group means, and error bars represent 95% confidence intervals of the mean; individual run-level scatter points are not displayed. Between-algorithm inferential comparisons are reported in Table 2 with exact p-values and Cohen’s d effect sizes. Panel F shows representative convergence trajectories and is descriptive rather than an additional inferential test. Abbreviations: CI = confidence interval; SA = simulated annealing; SA-R = simulated annealing with reheating. Please click here to view a larger version of this figure.
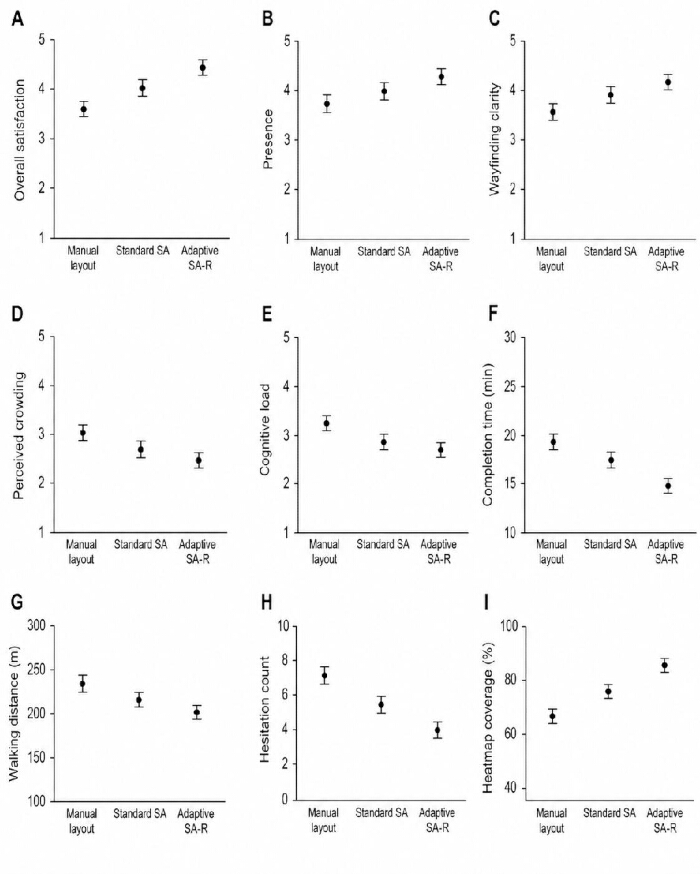
Figure 3: Visitor-experience and behavioral outcomes across the three layout conditions. (A) Overall satisfaction. (B) Presence. (C) Wayfinding clarity. (D) Perceived crowding. (E) Cognitive load. (F) Completion time. (G) Walking distance. (H) Hesitation count. (I) Heatmap coverage. The groups are Manual layout, Standard SA (standard simulated annealing), and Adaptive SA-R (adaptive simulated annealing with reheating), with n = 60 participants per group. Black markers represent group means, and vertical error bars represent 95% confidence intervals of the mean; individual participant-level scatter is not displayed. Outcomes were compared across the three groups using the prespecified ANOVA/robust alternative framework described in the Protocol; exact p values and effect sizes are provided in Table 2. Abbreviations: CI = confidence interval; ANOVA = analysis of variance; SA = simulated annealing; SA-R = simulated annealing with reheating. Please click here to view a larger version of this figure.
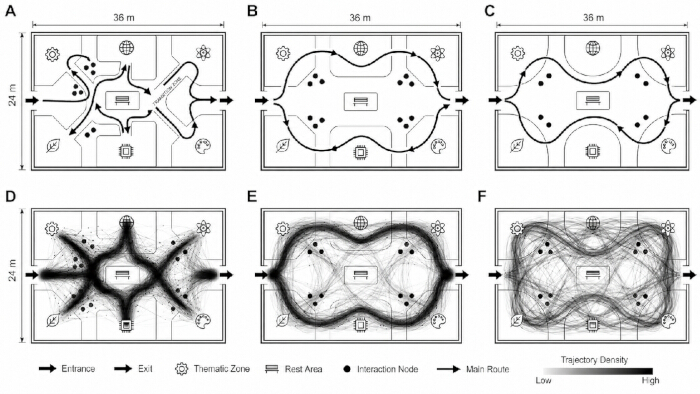
Figure 4: Spatial layouts and visitor trajectory heatmaps across the three layout conditions. (A) Manual exhibition layout. (B) Standard simulated annealing layout. (C) Adaptive simulated annealing with reheating layout. (D) Visitor trajectory heatmap in the manual layout condition. (E) Visitor trajectory heatmap in the standard simulated annealing condition. (F) Visitor trajectory heatmap for adaptive simulated annealing with reheating. The schematic symbols denote the entrance, exit, thematic zones, rest area, interaction nodes, and main route as indicated in the embedded legend. The density scale in panels D–F ranges from low to high trajectory density, and each trajectory heatmap summarizes n = 60 participant sessions in the corresponding condition. Panels A–C are layout schematics, and panels D–F are descriptive trajectory visualizations; no error bars or significance notation are used in this figure. Please click here to view a larger version of this figure.
| Parameter category | Parameter | Value / Setting | Role in protocol |
| Exhibition space | Hall size | 36 m × 24 m | Fixed spatial boundary |
| Exhibition space | Total floor area | 864 m² | Base model area |
| Exhibition space | Ceiling height | 4.5 m | Virtual scene parameter |
| Access points | Entrance width | 3.0 m | Fixed access point |
| Access points | Exit width | 3.0 m | Fixed access point |
| Functional zoning | Number of thematic zones | 6 | Main layout objects |
| Functional zoning | Thematic-zone area range | 80–130 m² | Feasibility constraint |
| Functional zoning | Transition corridors | 2 | Route-connection elements |
| Functional zoning | Rest area | 40 m² | Fixed functional space |
| Circulation | Main-pathway width | 1.8–3.5 m | Optimization variable |
| Circulation | Initial manual pathway width | 2.2 m | Baseline layout setting |
| Circulation | Maximum reference route length | 120 m | Normalization value for walking-distance cost |
| Interaction | Interaction nodes | 8–12 | Optimization variable |
| Interaction | Interaction-node trigger radius | 1.0 m | Virtual-reality interaction setting |
| Interaction | Interaction-node clearance radius | ≥1.2 m | Feasibility constraint |
| Spatial analysis | Grid size | 0.5 m × 0.5 m | Visibility, heatmap, and density calculation |
| Visibility analysis | Line-of-sight ray interval | 0.5 m | Visual-accessibility calculation |
| Crowding | Local density threshold | ≤1.50 persons/m² | Feasibility constraint and crowding-cost reference |
| Environmental comfort | Target illuminance | 300–500 lx | Component of environmental-comfort penalty |
| Environmental comfort | Target sound pressure level | 45–60 dB(A) | Component of environmental-comfort penalty |
| Environmental comfort | Target carbon dioxide | <900 ppm | Component of environmental-comfort penalty |
| Environmental comfort | Target temperature | 22–25 °C | Component of environmental-comfort penalty |
| Objective function | Walking-distance cost weight | 0.25 | Route-efficiency component |
| Objective function | Visual-accessibility cost weight | 0.2 | Visual-accessibility component |
| Objective function | Crowding cost weight | 0.25 | Crowding-control component |
| Objective function | Environmental-comfort penalty weight | 0.15 | Environmental-comfort component |
| Objective function | Interaction-balance penalty weight | 0.15 | Interaction-distribution component |
| Standard simulated annealing | Initial temperature | 100 | Starting search temperature |
| Standard simulated annealing | Cooling coefficient | 0.95 | Temperature reduction rule |
| Standard simulated annealing | Maximum iterations | 1500 | Stopping rule |
| Standard simulated annealing | Stagnation threshold | 200 iterations | Early stopping rule |
| Standard simulated annealing | Layout proposal moves | Zone movement; zone-sequence swap; pathway-width adjustment; interaction-node movement | Neighboring-solution generation |
| Standard simulated annealing | Zone movement range | 0.5–2.0 m | Proposal-move setting |
| Standard simulated annealing | Pathway-width adjustment range | 0.1–0.3 m | Proposal-move setting |
| Standard simulated annealing | Interaction-node movement range | 0.5–1.5 m | Proposal-move setting |
| Adaptive SA-R | First-stage iteration range | First 40% of iterations | Global exploration phase |
| Adaptive SA-R | First-stage proposal probabilities | Local displacement 0.20; zone-sequence swap 0.35; pathway-width adjustment 0.30; interaction-node relocation 0.15 | Adaptive proposal distribution |
| Adaptive SA-R | Second-stage iteration range | Final 60% of iterations | Local refinement phase |
| Adaptive SA-R | Second-stage proposal probabilities | Local displacement 0.35; zone-sequence swap 0.15; pathway-width adjustment 0.20; interaction-node relocation 0.30 | Adaptive proposal distribution |
| Adaptive SA-R | Reheating threshold | 150 iterations without improvement | Premature-convergence control |
| Adaptive SA-R | Reheating magnitude | 10% increase in current temperature | Adaptive reheating rule |
| Adaptive SA-R | Maximum reheating events | 3 per run | Search-stability rule |
| Algorithm evaluation | Independent random seeds | 30 per algorithmic condition | Algorithm-performance estimation |
| Virtual-reality scene | Camera height | 1.65 m | Approximate standing eye height |
| Virtual-reality scene | Walking speed | 1.2 m/s | Standardized navigation setting |
| Virtual-reality scene | Teleportation | Disabled | Standardized trajectory recording |
| Participant session | Practice scene duration | 2 min | Familiarization before test scene |
| Participant session | Pre-session seated rest | 2 min | Baseline preparation |
| Participant session | Post-session rest | 3 min | Recovery before questionnaire |
| Participant session | Route assistance threshold | >30 s unable to proceed | Standardized assistance rule |
| Study design | Layout conditions | 3 | Manual layout; standard simulated annealing layout; adaptive simulated annealing with reheating layout |
| Study design | Participants per condition | 60 | Between-subject allocation |
| Study design | Total participants | 180 | Full study sample |
| Primary algorithmic outcome | Final spatial cost | Continuous | Main optimization outcome |
| Primary visitor-experience outcome | Overall satisfaction | 1–7 scale | Main participant-reported outcome |
| Secondary algorithmic outcomes | Improvement percentage; iterations to best solution; runtime; acceptance rate | Continuous | Algorithm-performance evaluation |
| Secondary visitor-experience outcomes | Presence; spatial presence; interaction quality; wayfinding clarity; visual comfort; acoustic comfort; thermal comfort; perceived crowding; cognitive load; simulator sickness | Continuous | Experience evaluation |
| Secondary behavioral outcomes | Completion time; dwell time; walking distance; hesitation count; heatmap coverage | Continuous | Trajectory and route-behavior evaluation |
| Exclusion rule | Completion time | <3 min or >25 min | Participant-record exclusion criterion |
| Exclusion rule | Walking distance | No upper cutoff; records <20 m were considered invalid only when associated with incomplete/invalid trajectory | Data-integrity rule |
| Exclusion rule | Heatmap coverage | <10% | Participant-record exclusion criterion |
| Multiple comparison control | Pairwise comparison adjustment | Holm method | Type-I error control |
| Sensitivity analysis | Objective-function weight change | ±10%, total weight retained at 1.00 | Stability check |
Table 1: Spatial-design variables, optimization parameters, feasibility constraints, and outcome definitions. This table summarizes the fixed exhibition-space parameters, variable design elements, feasibility constraints, objective-function settings and rationale, standard simulated annealing parameters, adaptive simulated annealing with reheating settings, virtual-reality scene parameters, participant-session procedures, data-integrity exclusion rules, and primary and secondary outcomes used in the protocol. SA = simulated annealing; SA-R = adaptive simulated annealing with reheating; VR = virtual reality.
| Category | Outcome | Manual layout | Standard SA | Adaptive SA-R | Statistical test / mean difference | p value | Effect size |
| Algorithm-performance outcomes | Final spatial cost | — | 0.475 ± 0.019 (95% CI, 0.468–0.482) | 0.424 ± 0.016 (95% CI, 0.418–0.430) | Welch t = 11.25; mean difference = −0.051 (95% CI, −0.060 to −0.042) | <0.001 | Cohen’s d = 2.90 |
| Improvement percentage (%) | — | 24.91 ± 3.22 (95% CI, 23.708–26.112) | 32.54 ± 3.29 (95% CI, 31.311–33.769) | Welch t = 9.07; mean difference = +7.63 (95% CI, 5.95 to 9.31) | <0.001 | Cohen’s d = 2.34 | |
| Iterations to best solution | — | 925.47 ± 86.38 (95% CI, 893.215–957.725) | 722.20 ± 90.19 (95% CI, 688.523–755.877) | Welch t = 8.92; mean difference = −203.27 (95% CI, −248.91 to −157.63) | <0.001 | Cohen’s d = 2.30 | |
| Runtime (s) | — | 47.83 ± 9.42 (95% CI, 44.313–51.347) | 55.86 ± 9.49 (95% CI, 52.316–59.404) | Welch t = 3.29; mean difference = +8.03 (95% CI, 3.14 to 12.92) | 0.002 | Cohen’s d = 0.85 | |
| Acceptance rate | — | 0.294 ± 0.045 (95% CI, 0.277–0.311) | 0.372 ± 0.054 (95% CI, 0.352–0.392) | Welch t = 6.08; mean difference = +0.078 (95% CI, 0.052 to 0.104) | <0.001 | Cohen’s d = 1.57 | |
| Visitor-experience outcomes | Presence | 3.77 ± 0.56 (95% CI, 3.625–3.915) | 3.99 ± 0.55 (95% CI, 3.848–4.132) | 4.28 ± 0.42 (95% CI, 4.172–4.388) | ANOVA F = 14.86 | <0.001 | η² = 0.144 |
| Spatial presence | 3.75 ± 0.64 (95% CI, 3.585–3.915) | 3.96 ± 0.63 (95% CI, 3.797–4.123) | 4.27 ± 0.47 (95% CI, 4.149–4.391) | ANOVA F = 11.99 | <0.001 | η² = 0.119 | |
| Interaction quality | 3.74 ± 0.56 (95% CI, 3.595–3.885) | 4.00 ± 0.57 (95% CI, 3.853–4.147) | 4.24 ± 0.57 (95% CI, 4.093–4.387) | ANOVA F = 11.68 | <0.001 | η² = 0.117 | |
| Wayfinding clarity | 3.61 ± 0.58 (95% CI, 3.460–3.760) | 3.90 ± 0.57 (95% CI, 3.753–4.047) | 4.17 ± 0.48 (95% CI, 4.046–4.294) | ANOVA F = 15.83 | <0.001 | η² = 0.152 | |
| Visual comfort | 3.67 ± 0.44 (95% CI, 3.556–3.784) | 3.87 ± 0.44 (95% CI, 3.756–3.984) | 4.07 ± 0.45 (95% CI, 3.954–4.186) | ANOVA F = 12.21 | <0.001 | η² = 0.121 | |
| Acoustic comfort | 3.64 ± 0.52 (95% CI, 3.506–3.774) | 3.75 ± 0.42 (95% CI, 3.642–3.858) | 3.97 ± 0.44 (95% CI, 3.856–4.084) | ANOVA F = 7.94 | <0.001 | η² = 0.082 | |
| Thermal comfort | 3.69 ± 0.46 (95% CI, 3.571–3.809) | 3.79 ± 0.32 (95% CI, 3.707–3.873) | 3.94 ± 0.44 (95% CI, 3.826–4.054) | ANOVA F = 5.61 | 0.004 | η² = 0.060 | |
| Perceived crowding | 3.01 ± 0.49 (95% CI, 2.883–3.137) | 2.75 ± 0.55 (95% CI, 2.608–2.892) | 2.56 ± 0.45 (95% CI, 2.444–2.676) | ANOVA F = 12.33 | <0.001 | η² = 0.122 | |
| Cognitive load | 3.21 ± 0.48 (95% CI, 3.086–3.334) | 2.87 ± 0.52 (95% CI, 2.736–3.004) | 2.73 ± 0.44 (95% CI, 2.616–2.844) | ANOVA F = 15.79 | <0.001 | η² = 0.151 | |
| Overall satisfaction | 3.59 ± 0.45 (95% CI, 3.474–3.706) | 3.96 ± 0.44 (95% CI, 3.846–4.074) | 4.37 ± 0.31 (95% CI, 4.290–4.450) | ANOVA F = 55.67 | <0.001 | η² = 0.386 | |
| Simulator sickness | 2.52 ± 0.55 (95% CI, 2.378–2.662) | 2.44 ± 0.58 (95% CI, 2.290–2.590) | 2.12 ± 0.56 (95% CI, 1.975–2.265) | ANOVA F = 8.47 | <0.001 | η² = 0.087 | |
| Behavioral trajectory outcomes | Completion time (min) | 19.11 ± 2.63 (95% CI, 18.431–19.789) | 17.42 ± 2.77 (95% CI, 16.704–18.136) | 14.93 ± 2.32 (95% CI, 14.331–15.529) | ANOVA F = 39.85 | <0.001 | η² = 0.311 |
| Dwell time (min) | 11.17 ± 2.03 (95% CI, 10.646–11.694) | 12.24 ± 2.04 (95% CI, 11.713–12.767) | 13.39 ± 2.28 (95% CI, 12.801–13.979) | ANOVA F = 16.46 | <0.001 | η² = 0.157 | |
| Walking distance (m) | 234.88 ± 24.34 (95% CI, 228.592–241.168) | 217.95 ± 24.33 (95% CI, 211.665–224.235) | 201.86 ± 23.47 (95% CI, 195.797–207.923) | ANOVA F = 28.28 | <0.001 | η² = 0.242 | |
| Hesitation count | 7.10 ± 1.80 (95% CI, 6.635–7.565) | 5.51 ± 1.79 (95% CI, 5.048–5.972) | 4.07 ± 1.99 (95% CI, 3.556–4.584) | ANOVA F = 39.74 | <0.001 | η² = 0.310 | |
| Heatmap coverage (%) | 66.18 ± 9.40 (95% CI, 63.752–68.608) | 74.14 ± 7.93 (95% CI, 72.091–76.189) | 84.40 ± 9.47 (95% CI, 81.954–86.846) | ANOVA F = 62.33 | <0.001 | η² = 0.413 |
Table 2: Algorithmic and participant-level outcomes across the three layout conditions. This table reports algorithm-performance outcomes, visitor-experience outcomes, and behavioral trajectory outcomes across the Manual layout, Standard SA (standard simulated annealing), and Adaptive SA-R (adaptive simulated annealing with reheating) conditions. Algorithm-performance comparisons are based on n = 30 independent optimization runs per algorithmic condition. Participant-level comparisons are based on n = 60 participants per layout condition. Values are reported as mean ± SD with 95% confidence intervals for the mean. For algorithm outcomes, the Statistical Test column also reports the mean between-algorithm difference and its 95% CI. The p-value and Effect Size columns provide the corresponding inferential result. Detailed pairwise participant sensitivity contrasts are presented in Supplementary Table S1. SD = standard deviation; CI = confidence interval; ANOVA = analysis of variance; SA = simulated annealing; SA-R = adaptive simulated annealing with reheating; η2 = eta-squared; d = Cohen's d.
Supplementary File 1. Hardware, software, and environmental-monitoring resources. Hardware, software, and environmental monitoring resources are used for spatial optimization and virtual reality experiments. Please click here to download this file.
Supplementary File 2. Participant screening and questionnaire/codebook framework. Participant screening criteria and questionnaire/codebook information, including the study domains, scoring ranges, and reporting conventions used for participant outcomes. Please click here to download this file.
Supplementary File 3. Adaptive SA-R pseudocode and analysis resources. Pseudocode for the Adaptive SA-R workflow, including the four proposal kernels, together with software dependencies, variable definitions, and figure-source file descriptions. Please click here to download this file.
Supplementary Table 1. Pairwise sensitivity comparisons of participant outcomes. Pairwise sensitivity comparisons were calculated using the group means, standard deviations, and sample sizes. Please click here to download this file.
ディスカッション
本研究では、重み付き空間コストモデル、再加熱を伴う適応的シミュレーテッドアニーリング、および仮想現実(VR)における被験者テストを組み合わせた、再現可能な展示レイアウトワークフローを評価した。あらかじめ定義された36 m x 24 mのシナリオにおいて、適応的なレイアウトは標準的なシミュレーテッドアニーリングよりも低い空間コストを達成し、より高い満足度、より強いプレゼンス感、より明確なウェイファインディング、より短い経路、より少ない迷い、およびより広い空間的なカバー範囲に関連していた。ここで「最適化」という用語は、規定の制約条件下で指定されたコスト関数の値を低くするという限定的な数学的意味で使用されており、そのレイアウトが美学的質、感情的反応、ナラティブなシーケンシング、あるいはあらゆる可能な展示目的においてグローバルに最適であることを意味するものではない。空間構成は移動、視認性、および認知的アクセシビリティを形成し得るが30,31、デザインの質は依然として多基準の人中心的な判断に委ねられている。
参加者の結果は、いくつかの評価項目が目的関数に直接組み込まれていなかったため、限定的ではあるものの有用な検証レイヤーとなります。総合的な満足度、プレゼンス、認知負荷、シミュレーター酔い、滞在時間、およびヒートマップのカバレッジは、探索中に最小化されたのではなく、レイアウト生成後に測定されました。したがって、これらの結果の傾向は、低コストのレイアウトが単に歩行距離の短縮という数学的な成果物であったわけではないことを示唆しています32。同時に、この検証は単一ユーザーの仮想環境内で行われました。仮想現実への習熟度はナビゲーションの快適性やパフォーマンスに影響を与える可能性があり、文脈変数として記録はされたものの、本研究はサブグループ固有の効果や相互作用効果を推定するための十分な検出力を備えていませんでした。したがって、これらの結果は、人口統計学的要因や経験に関連する要因が影響を及ぼさないという証拠としてではなく、ランダム化されたレイアウト間の比較として解釈されるべきです3,34。
アルゴリズムの比較についても、同様に保守的に解釈されるべきである。4つの提案カーネルを形式的に導出した結果、可逆的な実行可能移動に対して順方向および逆方向の条件付き提案密度が対称であることが示された。したがって、Hastings比は1となり、実装された採択ルールはシミュレーテッドアニーリングにおける標準的なMetropolisルールとなる。したがって、本研究の貢献は新しいMetropolis-Hastingsアルゴリズムを提示することではなく、ステージ依存の移動選択、リヒーティング、明示的な実行可能性制約、および再現可能な仮想環境検証という、ドメイン固有の構成を提示したことにある。標準的なシミュレーテッドアニーリング(SA)は、エンコーディング、目的関数、制約、初期化、冷却スケジュール、および名目上の実行予算が同一であるため、制御された比較対象となる。本実験では、数値的なGA、PSO、ACO、または学習ベースのベンチマーク実行は含まれていない。したがって、主張は一致させた標準SAベースラインに限定される。また、統合された構成では、提案スケジューリングとリヒーティングの個別の効果は分離されていない。
実用的なトレードオフは、テストした問題サイズにおいては好ましい結果となりましたが、追加のベンチマーキングなしに一般化すべきではありません。標準的なシミュレーテッドアニーリングと比較して、実行時間は16.8%増加しましたが、最終的な空間コストは10.7%低下し、最良の解に至るまでの反復回数は2.0%減少しました。このことは、現在の単層モデルにおいて、追加された適応制御の計算コストが許容範囲内であったことを示唆しています。また、目的関数の重みは±10%の摂動に対しても方向的に堅牢でしたが、これらの重みは意図的にシナリオ固有に設定されており、環境的な快適性やインタラクションのバランスよりも、ルート効率と混雑回避が優先されました。芸術的、歴史的、科学的、または商業的な展示では、ルート効率を重視したコスト関数ではペナルティとなるような、非線形な動線やナラティブな遷移を含む、異なる優先順位を採用することが妥当であると考えられます。したがって、最適化はキュレーターや建築家の判断に代わるものではなく、トレードオフを明確にする意思決定支援レイヤーとして活用されるべきです35。
本研究の結論には、いくつかの限界が存在します。第一に、検証には1つの長方形の単層仮想展示空間を用い、一度に1名の参加者が参加しました。そのため、より広いホール、不規則な形状、複数階にわたる動線、グループによる同時移動、対人回避、動的な混雑、身体的疲労、および現実世界の環境的な注意散漫については検証されていません。第二に、比較セットに代表的な進化計算、群知能、または学習ベースの最適化アルゴリズムが含まれておらず、ステージ依存の提案確率の効果とリヒーティングの効果を分離するコンポーネント除去実験も行われませんでした。第三に、参加者による評価は部分的に主観的であり、無作為に割り当てられた場合であっても、事前のVR体験がナビゲーションや快適性に影響を与えた可能性があります。本研究は、サブグループ解析やモデレーター解析を目的とした設計にはなっていません。第四に、満足度、プレゼンス、認知負荷、シミュレーター酔い、滞在時間、およびヒートマップのカバー率は明示的な空間コスト項ではありませんが、本研究では独立した注意、感情的反応、学習効果、または長期記憶のエンドポイントを収集していません。第五に、空間コスト関数は、感情的反応、キュレーターによるナラティブ、驚き、意味形成、または長期記憶といった質的な次元を直接表現することはできません。第六に、短時間のVR曝露では、より長時間のセッションで現れる不快感を過小評価している可能性があります36,37。これらの限界により、本フレームワークは、あらゆる展示環境に対して一般的に検証された最適化ツールとしてではなく、検証済みのシナリオにおける再現可能なワークフローの証明として捉えられるべきです。
今後の研究では、より大規模で不規則な空間や多層階の空間におけるフレームワークの検証、複数ユーザーによる群衆シミュレーションおよび物理的または複合現実(mixed-reality)による妥当性確認、注意、感情的反応、学習、遅延記憶に関する客観的なエンドポイントの追加、ならびにステージ依存の提案スケジューリングおよびリヒーティングのコンポーネントごとのアブレーション解析を行うべきである。アルゴリズムの競争力については、NSGA-II38、粒子群最適化(particle swarm optimization)39、Ant System/蟻コロニー最適化(ant-colony optimization)40などの代表的な代替手法に対し、同等の計算予算の下でテストし、手法固有のパラメータ調整の内容を透明に報告する必要がある。また、展示固有の嗜好抽出を行うことで、ナラティブの順序、アクセシビリティ、教育的効果、感情的なエンゲージメント、または滞在時間の目標が現行のシナリオと異なる場合に、目的関数の重みを再調整できる可能性がある。これらの拡張により、単一の固定的なコスト関数が最適な展示体験を定義すると仮定することなく、スケーラビリティ、転移可能性、およびアルゴリズムの競争力を評価することが可能になる。
開示事項
著者は、競合する金銭的利益がないことを宣言します。
謝辞
著者は、バーチャルリアリティ展示の評価に参加した協力者に感謝いたします。また、没入型展示空間の設計ワークフローの開発および評価において支援をいただいた、河南省農業大学芸術設計学院および情報管理学院に謝意を表します。本研究は外部資金を受けていません。本研究は、著者の自己資金および河南省農業大学の日常的な機関施設によって支援されました。
材料
| 名前 | 会社 | カタログ番号 | コメント |
|---|---|---|---|
| 3Dモデリングソフトウェア | Blender Foundation | 該当なし | Blender 4.0.2; 展示空間のジオメトリ、テーマゾーン、パーティション、および空間アセットの構築に使用。RRID:SCR_08606 |
| 解析スクリプト | カスタム研究用スクリプト | 該当なし | バージョン1.0;統計解析、感度分析、信頼区間の算出、および図表データの作成に使用。 |
| 二酸化炭素モニター | Testo SE & Co. KGaA | testo 535; 0563 0535 | デジタルCO2 メーター;測定範囲 0–10,00 ppm。あらかじめ設定した環境目標における二酸化炭素濃度のプロトコルコントロールチェックとして使用する。 |
| デスクトップワークステーション | Dell Technologies | Precision 3660 Tower | 32 GB RAM;仮想シーンのレンダリング、レイアウトシミュレーション、アルゴリズムの実行、および参加者セッションのログ記録に使用。 |
| 図作成スクリプト | カスタムリサーチスクリプト | 提供されたソーステキストがございません。翻訳対象のテキストをご提示ください。 | バージョン1.0。アルゴリズム性能プロット、訪問者アウトカムプロット、および軌跡ヒートマップの作成に使用。 |
| ゲームエンジン / VRプラットフォーム | Unity Technologies | 該当なし | Unity 202.3.2f1 LTS:バーチャル展示シーンの構築および実行に使用。 |
| ヘッドマウントディスプレイ | Meta Platforms, Inc. | Meta Quest 2 (128 GB) | 6自由度(6-DoF)スタンドアロン型HMD; 1832 × 片眼あたり1920ピクセル、セッションのリフレッシュレート90Hz。没入型バーチャルリアリティシーンの提示および参加者の動作トラッキングに使用した。 |
| 照度計 | Testo SE & Co. KGaA | testo 540; 0560 0540 | デジタル照度計;測定範囲 0–9,99 lx。あらかじめ定義された環境目標の下での照度のプロトコルコントロールチェックとして使用。 |
| NumPy | NumPy開発者 | 該当なし | バージョン1.26.4。数値配列演算およびデータ準備に使用。RRID:SCR_0863 |
| 最適化スクリプト | カスタム研究スクリプト | 該当なし | Python 3.1, バージョン 1.0。標準的なSA(焼きなまし法)および再加熱を伴う適応的焼きなまし法(Adaptive SA-R)を実装しており、ステージ依存の提案選択、メトロポリス受理基準、および再加熱が含まれている。 |
| pandas | pandas開発チーム | 該当なし | バージョン2.1.4。データセットのクリーニング、表作成、および図用データの準備に使用。RRID:SCR_018214 |
| 参加者スクリーニングフォーム | カスタム研究依頼フォーム | 該当なし | バージョン1.0。適格性、人口統計学的変数、過去のバーチャルリアリティ体験、および美術館・展覧会への訪問頻度を記録するために使用した。 |
| 体験後評価アンケート | カスタム研究依頼フォーム | 入力がありません。翻訳するテキストをご提供ください。 | バージョン1.0;7段階のリッカート尺度;相互作用の質、ウェイファインディング(道案内)の明確さ、視覚的・音響的・熱的快適性、知覚される混雑度、認知負荷、および総合的な満足度の評価に使用。 |
| プレゼンスおよび空間的プレゼンス評価フォーム | カスタム研究依頼フォーム | 該当なし | バージョン1.0。研究固有の7段階ドメインスコアをPQ/IPQフレームワークに基づいて解釈した。標準的なPQまたはIPQの合計スコアは報告されていない。 |
| Pythonプログラミング言語 | Python Software Foundation | 該当なし | バージョン 3.1。アルゴリズムの実行、コスト関数の計算、データ処理、および感度分析に使用。RRID:SCR_08394 |
| SciPy | SciPyコミュニティ | 該当なし | バージョン1.11.4;統計検定および数値解析の補助に使用。RRID:SCR_08058 |
| シミュレーター酔い評価フォーム | カスタムリサーチ依頼書 | 該当なし | バージョン1.0; 事前指定 0–SSQ(症状チェックリスト)の症状フレームワークに基づく30件の研究サマリー。標準的な加重SSQ合計重症度スコアとは異なる。 |
| 騒音計 | Testo SE & Co. KGaA | testo 816-1; 0563 8170 | IEC 61672-1 クラス2; 30–130 dB;A/C周波数重み付け;定義済みの環境目標下における音圧レベルのプロトコル制御チェックとして使用。 |
| 表計算ソフトウェア | Microsoft | 該当なし | Microsoft Excel 2021:データセットの整理、コードブックの作成、および補足スプレッドシートファイルの作成に使用。RRID:SCR_016137 |
| 統計解析ソフト | IBM | 該当なし | IBM SPSS Statistics 27.0:ANOVA、ウェルチ検定、前提条件の確認、および補完的な統計学的検証に使用。RRID:SCR_02865 |
| 温度モニター | Testo SE & Co. KGaA | testo 605i; 0560 2605 03 | 温湿度計;温度範囲 −20から+60 °C; 0.1 °C 分解能;事前定義された環境目標における周囲温度のプロトコル制御チェックとして使用される。 |
| VR統合パッケージ | Unity Technologies | 該当なし | XR Interaction Toolkit 2.5.4:VRインタラクション、移動制御、トリガーイベント、および軌跡ログの記録に使用。 |
| 注:本研究では生物学的資源は使用されていません。適用可能な研究リソースについては、RRIDを提供しています。 |
参考文献
- Falk JH, Dierking LD. The museum experience revisited. Left Coast Press; Walnut Creek, CA; 2013.
- Hillier B, Hanson J. The social logic of space. Cambridge University Press; Cambridge; 1984.
- Turner A, Doxa M, O'Sullivan D, Penn A. From isovists to visibility graphs: a methodology for the analysis of architectural space. Environ Plan B Plan Des. 2001;28:103-21.
- Kuliga SF, Thrash T, Dalton RC, Hölscher C. Virtual reality as an empirical research tool: exploring user experience in a real building and a corresponding virtual model. Comput Environ Urban Syst. 2015;54:363-75.
- Radianti J, et al. A systematic review of immersive virtual reality applications for higher education: design elements, lessons learned, and research agenda. Comput Educ. 2020;147:103778.
- Cummings JJ, Bailenson JN. How immersive is enough? A meta-analysis of the effect of immersive technology on user presence. Media Psychol. 2016;19:272-309.
- Witmer BG, Singer MJ. Measuring presence in virtual environments: a presence questionnaire. Presence-Teleop Virt. 1998;7:225-40.
- Makransky G, Petersen GB. The Cognitive Affective Model of Immersive Learning: a theoretical research-based model of learning in immersive virtual reality. Educ Psychol Rev. 2021;33:937-58.
- Kennedy RS, Lane NE, Berbaum KS, Lilienthal MG. Simulator Sickness Questionnaire: an enhanced method for quantifying simulator sickness. Int J Aviat Psychol. 1993;3:203-20.
- Kirkpatrick S, Gelatt CD Jr, Vecchi MP. Optimization by simulated annealing. Science. 1983;220:671-80.
- Metropolis N, et al. Equation of state calculations by fast computing machines. J Chem Phys. 1953;21:1087-92.
- Hastings WK. Monte Carlo sampling methods using Markov chains and their applications. Biometrika. 1970;57:97-109.
- Aarts EHL, Korst JHM. Simulated annealing and Boltzmann machines: a stochastic approach to combinatorial optimization and neural computing. John Wiley & Sons; Chichester; 1989.
- Van Laarhoven PJM, Aarts EHL. Simulated annealing: theory and applications. D. Reidel Publishing Company; Dordrecht; 1987.
- Bertsimas D, Tsitsiklis J. Simulated annealing. Stat Sci. 1993;8:10-5.
- Talbi EG. Metaheuristics: from design to implementation. John Wiley & Sons; Hoboken, NJ; 2009.
- Sörensen K. Metaheuristics: the metaphor exposed. Int Trans Oper Res. 2015;22:3-18.
- Hillier B. Space is the machine: a configurational theory of architecture. Cambridge University Press; Cambridge; 1996.
- Lolli F, et al. Post-Occupancy Evaluation's (POE) applications for improving indoor environment quality (IEQ). Toxics. 2022;10:626.
- Ministry of Housing and Urban-Rural Development of the People's Republic of China, State Administration for Market Regulation. GB/T 50034-2024 Standard for lighting design of buildings. Beijing; 2024.
- State Administration for Market Regulation, Standardization Administration of China. GB/T 23863-2024 Specification for lighting design of museum. Beijing; 2024.
- State Administration for Market Regulation, Standardization Administration of China. GB/T 18883-2022 Standards for indoor air quality. Beijing; 2022.
- Ministry of Housing and Urban-Rural Development of the People's Republic of China, General Administration of Quality Supervision, Inspection and Quarantine. GB/T 50785-2012 Evaluation standard for indoor thermal environment in civil buildings. Beijing; 2012.
- Ministry of Environmental Protection of the People's Republic of China, General Administration of Quality Supervision, Inspection and Quarantine. GB 3096-2008 Environmental quality standard for noise. Beijing; 2008.
- Chib S, Greenberg E. Understanding the Metropolis-Hastings algorithm. Am Stat. 1995;49:327-35.
- Slater M, Sanchez-Vives MV. Enhancing our lives with immersive virtual reality. Front Robot AI. 2016;3:74.
- Schubert T, Friedmann F, Regenbrecht H. The experience of presence: factor analytic insights. Presence-Teleop Virt. 2001;10:266-81.
- Stanney KM, Kennedy RS, Drexler JM. Cybersickness is not simulator sickness. Proc Hum Factors Ergon Soc Annu Meet. 1997;41:1138-42.
- Blum C, Roli A. Metaheuristics in combinatorial optimization: overview and conceptual comparison. ACM Comput Surv. 2003;35:268-308.
- Benedikt ML. To take hold of space: isovists and isovist fields. Environ Plan B Plan Des. 1979;6:47-65.
- Penn A. Space syntax and spatial cognition: or why the axial line? Environ Behav. 2003;35:30-65.
- Sherman WR, Craig AB. Understanding virtual reality: interface, application, and design. Morgan Kaufmann; San Francisco, CA; 2003.
- Slater M. Place illusion and plausibility can lead to realistic behaviour in immersive virtual environments. Philos Trans R Soc Lond B Biol Sci. 2009;364:3549-57.
- Sweller J. Cognitive load during problem solving: effects on learning. Cogn Sci. 1988;12:257-85.
- Heydarian A, Carneiro JP, Gerber D, Becerik-Gerber B. Immersive virtual environments versus physical built environments: a benchmarking study for building design and user-built environment explorations. Autom Constr. 2015;54:116-26.
- Rebenitsch L, Owen C. Review on cybersickness in applications and visual displays. Virtual Real. 2016;20:101-25.
- Clay V, König P, König SU. Eye tracking in virtual reality. J Eye Mov Res. 2019;12:3.
- Deb K, Pratap A, Agarwal S, Meyarivan T. A fast and elitist multiobjective genetic algorithm: NSGA-II. IEEE Trans Evol Comput. 2002;6:182-97.
- Kennedy J, Eberhart RC. Particle Swarm Optimization. Proc IEEE Int Conf Neural Netw. 4, 1942-1948.
- Dorigo M, Maniezzo V, Colorni A. Ant system: optimization by a colony of cooperating agents. IEEE Trans Syst Man Cybern B Cybern. 1996;26:29-41.