本プロトコルでは、若年または高齢の前駆細胞から得られた Saccharomyces cerevisiae 配偶子のタイムラプス顕微鏡観察による、マイクロフルイディクスベースの寿命解析について説明します。
方法論記事
Saccharomyces cerevisiaeにおける配偶子形成回春因子の探索のためのマイクロフルイディクスベースのアッセイ
この記事について
サマリー
要約
Saccharomyces cerevisiaeは、不斉細胞分裂を通じて段階的に老化し、娘細胞が若く維持される一方で、母細胞に老化に伴う損傷が蓄積します。配偶子形成は老化細胞の複製寿命を完全にリセットし、次世代に向けて老化時計を巻き戻します。酵母における配偶子形成による若返りは以前から報告されていましたが、複製寿命のリセットを高スループットで定量化する手法は不足していました。配偶子形成後の若返りを定量化する従来の手法は、個々の細胞を繰り返し手作業でマイクロマニピュレーションする、低スループットで手間のかかるアプローチに限定されていました。本稿では、S. cerevisiaeにおける配偶子形成による若返りに必要な因子の体系的な特性解析を可能にする、高スループットなマイクロ流体ベースの顕微鏡アッセイについて詳細に解説します。この手法では、マイクロ流体ベースで配偶子の複製寿命を評価することを可能にする2つの不活性な遺伝子改変を利用しています。年齢選別と四分胞子の解離の後、条件付き不妊の配偶子をマイクロ流体イメージングデバイスに導入し、配偶子特異的マーカーを用いて同定します。長期的なタイムラプスイメージングにより、若い前駆細胞および老化前駆細胞由来の配偶子の複製寿命を、堅牢に追跡および比較することが可能です。本稿では、配偶子の寿命を体系的に定量化し、S. cerevisiaeにおける配偶子形成による細胞若返りを媒介する分子因子を高スループットで同定するための、ステップバイステップのプロトコルを提供します。
概要
Saccharomyces cerevisiae細胞は、有糸分裂時に非対称に分裂し、母細胞に加齢に伴う損傷を保持させつつ若い娘細胞を産生することで、複製老化を起こします1,2,3,4。したがって、酵母の複製寿命は限定的であり、これはある母細胞が最終分裂を経て、その後老化し、最終的に死に至るまでに産生する娘細胞の数として定義されます。驚くべきことに、老化したいS. cerevisiae細胞が配偶子形成を完了すると、得られたすべての配偶子の複製寿命は完全にリセットされ、若い前駆細胞由来の配偶子と区別がつかなくなります5,6,7,8,9 (Figure 1A)。酵母における配偶子形成による若返りが最初に発見されて以来、配偶子形成中に加齢に伴う損傷を除去する複数の重要な因子が同定されてきましたが、ハイスループット技術が欠如していたため、これらの経路が配偶子の寿命に与える影響を調査することは困難でした6。配偶子の複製寿命の定量化は、歴史的に蛍光マイクロダイセクション顕微鏡を用いて細胞分裂を手動でスコアリングすることに依存しており、そこでは数日間にわたり、生成された娘細胞を継続的にカウントし手動で除去することで、配偶子の複製寿命をスコアリングします7。この手法で配偶子の複製寿命を分析することは可能ですが、労力と時間がかかるため、ここ10年間のこの分野における導入は限定的でした10,11。最初の発見以来、配偶子形成による若返りに直接寄与することが示された特定の分子経路が存在しないという事実は、現在の手法の限界と、自動化されたハイスループットアッセイの必要性を強調しています7。
近年、マイクロ流体ベースの新しいアプローチが、マイクロマニピュレーションによる分裂寿命の定量法に取って代わっており、娘細胞を手動で分離する必要がなくなっています12。母細胞をイメージングチャンバー内に捕捉して保持し、全分裂寿命にわたって新鮮な培地を一定に流し続けることで、新たに形成された娘細胞を洗い流す様々なトラップが設計されています。さらに、複数のイメージングチャンバーを並列化することで、1回の実験で数日間にわたり、異なる遺伝的背景を持つ数百個の細胞から分裂寿命を取得することが可能になりました13,14,15,16,17,18,19。これらのマイクロ流体ベースのアプローチは、栄養増殖期の半数体酵母細胞において現在好んで用いられていますが、酵母配偶子の分裂寿命測定にこの技術を適用した例は、現在のところ報告されていません。
マイクロ流体デバイスを用いてS. cerevisiaeの配偶子複製寿命を評価するにあたり、3つの主要な技術的および生物学的障害が存在します。第一に、配偶子形成の間、二倍体の酵母細胞は2回の減数分裂を行い、2つの交配型(MATaおよびMATα)が2:2で分離した4つの半数体配偶子を含む、密に詰まった四分子を形成します(図 1A)。そのため、MATaとMATαの配偶子をマイクロ流体デバイスにロードすると、分泌された交配フェロモンが近接する細胞に交配反応を誘導し、増殖停止、異常な細胞形態、およびマイクロ流体デバイスの目詰まりを引き起こします。第二に、四分子嚢内の4つの配偶子は、発芽時に自然に分離しません。したがって、手動で分離しない限り、マイクロ流体チャンバーにトラップできるのは四分子全体のみとなります。分離されていない四分子のトラップ保持率が低下すること、および依然として連結している4つの配偶子の個別の分裂を追跡することが困難であることから、個々の配偶子の複製寿命を評価することは不可能です。第三に、マイクロ流体デバイスにロードする前に四分子を個々の配偶子に分離した場合、それらは栄養増殖細胞よりも大幅に小さいため、標準的なトラップでは捕捉できません(図 2A–C)。
これらの制限を克服するため、Spiriら(2026年)9は、不活性な遺伝子改変、四分胞子の分離と配偶子の増殖、および配偶子特異的マーカーを組み合わせることで、S. cerevisiaeにおける配偶子の複製寿命の高スループットなマイクロ流体ベースの定量化と、配偶子形成による若返りに必要な因子の特性解析を可能にした(Figure 1B–F)。まず、標準的な遺伝学的交雑を妨げることなく発芽後の接合を防ぐために、条件付き不妊アレルを構築した(Figure 3A)。次に、四分胞子を単一の配偶子に分離させるため、外胞子壁を弱めるZymolyase処理と機械的な操作を組み合わせた。第三に、分離後および標準的なマイクロ流体トラップの使用に必要な短期間の増殖後であっても配偶子を効率的に識別できるよう、長期にわたって保持される配偶子特異的な蛍光レポーターを導入した。この手法を用いることで、事前にソートされた若年および高齢の前駆細胞に由来する単一配偶子を単離し、マイクロ流体デバイスにロードして72時間にわたる連続タイムラプスイメージングを行うことができ、若年および高齢の前駆細胞由来の配偶子の複製寿命の定量的な解析と比較が可能となった9。ここに記載する詳細なプロトコルは、高齢および若年の前駆細胞における配偶子寿命解析の実現可能性とスループットを大幅に向上させ、配偶子形成中に細胞の若返りを媒介する分子経路の直接的な同定を可能にするものである。
プロトコル
A detailed list of reagents and equipment used in this protocol is listed in the Table of Materials.
1. Replicative aging of founder cells
NOTE: All experiments using the protocol below are performed in diploid S. cerevisiae cells of the SK1 strain background containing the following minimal genetic background: pPMA2-PMA2-eGFP, ste5::NATR-pTet07.1-STE5, pRNR2-TetR-TUP1, pTetO7.1-TetR, flo8Δ, amn1D368V. For all cultures incubated in glass flasks, the culture volume should not exceed 1/5 of the flask volume to ensure proper aeration.
- Thaw diploid cells on yeast extract peptone (YP) glycerol plates, incubate at 30 °C overnight. Transfer diploid cells to YP dextrose (YPD) plates, incubate at 30 °C (>8 h).
- Inoculate freshly thawed diploids in 5 mL liquid YPD (2% dextrose). Shake cultures (300 rpm) at room temperature overnight (>12 h).
- Re-dilute the starter culture to an optical density at 600 nm (OD600) = 0.2 in 30 mL YPD (2% dextrose). Shake cultures (300 rpm) at 30 °C for 3–4 h until cultures reach density OD600 = 0.6–1.
- Make sure to start with enough culture to have 16 OD600 units of cells to label per genotype. Transfer 2 x 8 OD600 units of cells for each genotype into a 50 mL conical tube.
- Recommended: split 16 OD600 units into two samples (8 OD600 units each) to set up two independent founder cell cultures for every genotype. After age sorting (step 2.16), combine the aged cells from the two founder cell cultures to increase the total yield of aged cells.
- Centrifuge 50 mL conical tube for 2 min at 1,900 x g and decant supernatant. Resuspend pellet with 20 mL phosphate-buffered saline (PBS) (pH 8).
- Repeat step 1.6 two more times for a total of three washes in PBS (pH 8). Prepare an 8 mg/mL biotin solution (500 μL needed per 8 OD600 units of cells).
- Weigh out biotin (4 mg/sample) and suspend powder completely in PBS (pH 8) to reach a final concentration of 8 mg/mL (500 μL needed per sample). After the third wash, resuspend cells in 1 mL PBS (pH 8).
- Distribute 500 μL of cell suspension into two low-adhesion centrifuge tubes, splitting the initial 2 x 8 OD600 units. Add 500 μL biotin solution (8 mg/mL) to each centrifuge tube for a total volume of 1 mL (Figure 1B).
- Seal the lid with parafilm and vortex for 1 minute. Aged cells are sensitive to mechanical stress; this is the last time the cells are vortexed. Resuspend cell pellets by gently pipetting up and down from now on.
- Transfer the centrifuge tubes to a rotating rack and incubate for 30 min at 4 °C. Centrifuge for 2 min at 1,900 x g, then pipette off supernatant. Resuspend pellet in 1 mL PBS (pH 8 + 100 mM glycine) to chemically quench excess biotin.
- Repeat step 1.11 three more times for a total of 3 washes with PBS (pH 8 + 100 mM glycine). Resuspend cells in 1 mL YPD (2% dextrose).
- Centrifuge for 2 min at 1,900 x g and pipette off supernatant. Prepare 50 mL YPD (2% dextrose) + ampicillin (100 µg/mL) cultures in 500 mL flasks for each biotin-labeled sample.
- Resuspend the biotin-labeled cells in 1 mL YPD (2% dextrose) and add to the 500 mL flask. Measure the optical density (OD600) of the founder culture to estimate the number of generations the next day.
- Shake the founder cultures (300 rpm) at 30 °C overnight (16–18 h) to achieve replicative aging (Figure 1B). This will result in approximately 6–7 divisions of each biotin-labeled founder cell.
2. Isolation of aged founder cells
NOTE: Store PBS (pH 7.4) + BSA (5 g/L) at 4 °C and keep on ice during the experiment.
When re-diluting cell pellets, ensure they are fully resuspended and mixed to avoid column clogging and maximize sorting efficiency. To enhance the purity of the aged cell population, two consecutive sorts are performed by re-applying the eluate from the first sorting column to a fresh second sorting column. This procedure yields aged cell populations with minimal contamination from young cells (90–98% purity). Aged cells are sensitive to mechanical stress; resuspend cell pellets by gently pipetting up and down using a serological pipette.
- After 16–18 h of incubation, record the optical density (OD600) of each founder culture. Calculate the estimated number of generations (mean age = log2(OD600End / OD600Start)).
- Centrifuge each culture for 2 min at 1,900 x g in 50 mL conical tubes and decant supernatant. Resuspend pellet with 20 mL PBS (pH 7.4 + BSA (5 g/L)) by pipetting up and down using a serological 25 mL pipette.
- Repeat step 2.2 once. Mix the vial of Anti-Biotin MicroBeads suspension by inversion. Using a cut tip, add 100 μL of Anti-Biotin MicroBeads to the cell suspension.
- Mix by inversion. Incubate at 4 °C for 15 min. Incubate on a rotating rack or invert the tube at least 3–4 times every 5 min (Figure 1C).
- Set up the QuadroMACS magnetic stand, columns, and pre-separation filters (30 µm). Add a container beneath the column to collect all waste that flows through.
- Prime each filter/column with 3 mL of PBS (pH 7.4 + BSA (5 g/L)). Label two 15 mL conical tubes for each column and condition (one for “aged cell eluate” and one for “young cell flow-through”).
- Centrifuge cell suspensions for 2 min at 1,900 x g and decant supernatant. Resuspend pellet with 20 mL PBS (pH 7.4 + BSA (5 g/L)) and spin down again.
NOTE: This step is important to remove excess free Anti-Biotin MicroBeads, which would otherwise saturate the column. - Completely resuspend the cell pellet in 5 mL PBS (pH 7.4 + BSA (5 g/L)) and apply to the first sorting column (Figure 1C). Label columns with the applied genotype to keep track.
- Collect the first flow-through in the 15 mL conical tubes labeled as “young cell flow-through”. Exchange the 15 mL conical tubes with a waste flow-through container once the cell suspension has flown through the column.
- Combine the two young cell flow-through suspensions from the same genotype into one 15 mL conical tube. Dilute 250 μL of combined young cell flow-through with 9.75 mL PBS (pH 7.4 + BSA (5 g/L)) in a new 15 mL conical tube. Set aside labeled as “diluted young cells” for later steps.
- Wash each column 4x with 3 mL PBS (pH 7.4 + BSA (5 g/L)). For the first wash, aliquot 3 mL of PBS (pH 7.4 + BSA (5 g/L)) back into the 50 mL conical tube that contained the cell suspension. Transfer to the corresponding column to apply any remaining cells to the column. Wash the column 3 times with fresh 3 mL PBS (pH 7.4) + BSA (5 g/L).
- Set up fresh columns and pre-separation filters (30 µm) for second sorting. Prime each filter/column with 3 mL of PBS (pH 7.4 + BSA (5 g/L)).
- Remove the first column from the magnet and hold it over the second column for the second sort. Add 5 mL of PBS (pH 7.4 + BSA (5 g/L)) to the first column and push steadily (gently but firmly) with the provided plunger to elute aged cells
- Apply the eluted aged cells to the second column. Label columns with the applied genotype to keep track.
- Wash each column 3 times with 3 mL PBS (pH 7.4) + BSA (5 g/L). Remove the column from the magnet and place it in a 15 mL conical tube labeled aged cell eluate. Add 5 mL of PBS (pH 7.4) + BSA (5 g/L) to the columns and push steadily (gently but firmly) with the provided plunger to elute aged cells.
- Combine two eluates from the two independent founder cultures of the same genotype to increase the total yield of aged cells (see step 1.5).
3. Fluorescent labeling of bud scars and biotin
NOTE: When labeled with fluorescent dyes, cells should be protected from light during incubation. Conditioned gametogenesis-inducing media is obtained by filter-sterilizing a gametogenesis-inducing culture in standard gametogenesis-inducing media 5 h after induction of gametogenesis. Store conditioned gametogenesis-inducing media sealed with parafilm at 4 °C.
- Centrifuge the combined aged and diluted young cell suspension for 2 min at 1,900 x g and decant the supernatant. Resuspend cells in 12 mL PBS (pH 7).
- Repeat step 3.1 twice and then resuspend cells in 4 mL PBS (pH 7) the second time. Add 4 μL of fluorescently labeled wheat germ agglutinin (1 µg/mL) and 4 μL of fluorescently labeled streptavidin (1 µg/mL) to each tube (Figure 1C).
- Incubate for 15 min in the dark at room temperature. Invert 3–4 times every 5 min. Centrifuge cells for 2 min at 1,900 x g, then decant supernatant.
- Resuspend in 12 mL gametogenesis-inducing media. Repeat the centrifugation and resuspension wash three times; after the final wash, resuspend the cells in 2 mL of conditioned gametogenesis-inducing medium containing ampicillin (100 µg/mL).
4. Induction of gametogenesis and analysis of age sorting
CAUTION: Formaldehyde is toxic and irritating; handle it in a chemical fume hood while wearing appropriate personal protective equipment (PPE).
- Measure density (OD600) of re-suspended cell suspension (from step 3.4). Dilute cultures to an OD600 of 0.8 with conditioned gametogenesis-inducing medium containing ampicillin (100 µg/mL), then transfer to a glass flask.
NOTE: Volume depends on total yield of aged cells; a final culture volume of 10 mL is sufficient for downstream applications. - Aliquot 135 μl diluted pre-gametogenic culture to 1.5 mL centrifuge tubes containing 15 μl formaldehyde (37%). Rotate and incubate at room temperature for 15 min. Store at 4 °C.
- Shake cultures (300 rpm) at 30 °C for 24 h to complete gametogenesis (Figure 1C).
PAUSE POINT: Imaging of formaldehyde-fixed cells can be done at any time most convenient. However, it is recommended to verify the sorting efficiency of aged cells before proceeding with the rest of the protocol. Cells can be stored for up to 48 h in formaldehyde fixation media at 4 °C. For long-term storage, exchange the formaldehyde-containing solution with sorbitol (1.2 M) and store at -20 °C. - Before imaging, centrifuge formaldehyde-fixed cells for 2 min at 1,900 x g. Pipette off supernatant into a dedicated formaldehyde waste container.
- Resuspend in 20 μL of sorbitol (1.2 M). Add 3.3 μL of cell suspension to a standard slide and apply a 22 x 22 mm coverslip.
- Acquire a z-stack including the complete volume of cells in DAPI, mCherry, FITC, and differential interference contrast (DIC) channels to assess the number of bud scars, biotin label, and Pma2-GFP (Figure 1C and Figure 4A; shown in magenta, yellow, and cyan, respectively).
- Continue to acquire at least 50 cells per condition.
5. Image analysis to assess biotin labeling efficiency and the number of bud scars
PAUSE POINT: Image analysis to verify age separation can be done at any point most convenient. However, it is recommended to verify sorting efficiency before proceeding with the rest of the protocol.
NOTE: Images are quantified using custom semi-automated Fiji/ImageJ (ImageJ2, V. 2.14.0/1.54m)20,21 macros. Specific notes on macro inputs are noted in the header of each macro and need to be adapted to individual input data.
- Open Fiji/ImageJ. Drag and drop the macro Manual ROI Selection and TIFF Export (Supplementary File 1) into Fiji/ImageJ to open.
- Click Run in the macro window. Choose the input and output folders as prompted and click OK.
- Draw a rectangle around cells of interest and add each rectangle to the region of interest (ROI) manager either manually or by using the shortcut t. Include the entire cell within the rectangle and leave a margin of approximately one cell diameter on each side.
- Once all ROI`s are added to ROI manager from the first image, click OK on the prompt window: Action Required (all ROI selected and saved to ROI manager (t)?) (Supplementary Figure 1). All chosen ROI´s will be cropped and saved automatically. The next image in the input folder will be opened automatically.
- Repeat steps 5.3–5.4 for all images in the input folder. Macro stops once it cycles through all images in the input folder. Drag and drop the macro Single-Cell 3D and Z Projection (Supplementary File 2) into Fiji/ImageJ to open.
- Adapt slice spacing in the 3D Project… command if required. Click Run in the macro window. Choose the input and output folders as prompted and click OK.
NOTE: Macro will run automatically, no input from the user needed. Macro stops once it cycled through all images in the folder. - Move all images called Y_projection… into a new input folder for counting. Drag and drop the macro Manual Budscar and Biotin Annotation (Supplementary File 3) into Fiji/ImageJ to open.
- Click Run in the macro window. Choose the input and output folders as prompted and click OK. Count bud scars by rotating the cell in 3D.
NOTE: Each DAPI and mCherry-positive ring-like structure is counted as one bud scar unless they overlap and represent the same bud scar event. The large filled circular biotin-positive (mCherry) mark on each cell from its birth is not counted towards total bud scar numbers (Figure 4A). - Click OK on the prompt window: Action Required (Number of bud scars?). Choose the counted number of bud scars on the prompt window, then click OK (Supplementary Figure 2).
- Determine whether the cell is biotin-labeled by examining the mCherry signal. If a cell was present during biotin labeling, the entire cell is mCherry-positive (Figure 4A).
- Click OK on the prompt window: Action Required (Biotin label: No = 0/ Yes = 1?). Choose 0 if the cell has no biotin label and 1 if the cell has a biotin label. In the Other prompt window, click OK (Supplementary Figure 3).
- Results will be automatically recorded in the Log window and saved as a .txt file in the output folder. Do not close the Log window during counting.
- The next image will be opened automatically. Repeat steps 5.9–5.13 for all images in the input folder. Macro stops once it cycled through all images in the input folder.
6. Assess the efficiency of gametogenesis and analyze the age of tetrads
NOTE: It is important to re-verify the tetrad age separation to exclude gametogenesis-specific de-enrichment of aged cells. Use the same analysis pipeline as for pre-gametogenic cells described in step 5 (Image analysis to assess biotin labeling efficiency and number of bud scars), with the difference that only tetrads are cropped and used for analysis for post-gametogenic conditions, as only gametes within tetrads will survive Zymolyase treatment and thus contribute to the gamete population. Images are quantified using custom semi-automated Fiji/ImageJ (ImageJ2, V. 2.14.0/1.54m)20,21 macros. Specific notes on macro inputs are noted in the header of each macro and need to be adapted to individual input data.
PAUSE POINT: Counting of sporulation efficiency can be done after setting up spore separation by setting aside an aliquot (100 μl) of the initial culture in a centrifuge tube for counting.
- Count sporulation efficiency by determining the number of monads, dyads, and tetrads for 300 cells from each culture using a light microscope.
- After 24 h in gametogenesis-inducing media, aliquot 135 μL of diluted post-gametogenesis culture (from step 4.3) to tubes containing 15 μL of formaldehyde (37%).
- Rotate and incubate at room temperature for 15 min. Store at 4 °C.
PAUSE POINT: If age sorting has been assessed for pre-gametogenic cells, imaging of formaldehyde-fixed tetrads can be done at any time most convenient. Cells can be stored for up to 48 h in formaldehyde fixation media at 4 °C. For long-term storage, exchange the formaldehyde-containing solution with sorbitol (1.2 M) and store at -20 °C. - Before imaging, centrifuge formaldehyde-fixed cells for 2 min at 1,900 x g. Pipette off supernatant into a dedicated formaldehyde waste container.
- Resuspend in 20 μL of sorbitol (1.2 M). Add 3.3 μL of cell suspension to a standard slide and apply a 22 x 22 mm coverslip.
- Acquire a z-stack including the complete volume of cells in DAPI, mCherry, FITC, and DIC channels to assess the number of bud scars, biotin label, and PMA2-GFP (Figure 1D and Figure 4A; shown in magenta, yellow, and cyan, respectively).
- Continue to acquire for at least 50 tetrads per condition.
PAUSE POINT: If age sorting has been assessed for pre-gametogenic cells, analysis of biotin labeling efficiency and the number of bud scars on tetrads can be done at any time that is most convenient. - Analyze the biotin labeling efficiency and number of bud scars of post-gametogenic tetrads as described in step 5.
7. Separation of tetrads into single gametes
NOTE: After Zymolyase treatment, cells are very sticky; take care when resuspending cell pellets to avoid aspirating or losing them. Prepare YPD (2% dextrose) + ampicillin (100 µg/mL) fresh and filter-sterilized on the day of the experiment to eliminate any unwanted debris or precipitation.
CAUTION: β-mercaptoethanol is toxic and volatile; handle it in a fume hood wearing appropriate PPE.
- After 24h in gametogenesis-inducing media, transfer cultures (from step 4.3) to 15 mL conical tubes. Centrifuge for 2 min at 1,900 x g decant the supernatant.
- Resuspend in 900 μl sterile deionized H2O and transfer to 1.5 mL low adhesion tubes. Add 100 μL of Zymolyase (1 mg/mL).
- In a fume hood, add 2 μL of β-mercaptoethanol. Seal tubes with parafilm, transfer to a rotating rack, and incubate for 3 h at 30 °C (Figure 1D).
- After 3 h of incubation, transfer the suspension to a 15 mL conical tube. Pipette carefully: cells are very sticky. Centrifuge samples for 2 min at 1,900 x g. Pipette off the supernatant completely and carefully, avoiding the sticky pellet, then resuspend in 1 mL of sterile deionized H2O.
- Repeat step 7.4 once. Sonicate samples with a hand sonicator (Figure 1D). Sonicate samples for 20 seconds at 1 pulse/second and 50% duty cycle. Put samples on ice for 1 minute between each sonication cycle.
- Wash the sonicator with 70% ethanol between samples. Repeat the sonication procedure described in step 7.5 five more times for a total of six sonication cycles.
- Verify tetrad separation using a light microscope (Figure 3B). Add 1 mL of YPD (2% dextrose) + ampicillin (100 µg/mL) (filter sterilized on the day of the experiment) to each sample.
- Re-dilute to OD600 = 0.8 with YPD (2% dextrose) + ampicillin (100 µg/mL). Volume depends on the total yield of separated cells.
NOTE: The maximum volume is 12 mL if 15 mL conical tubes are used. - Filter cultures through a pre-separation filter into a fresh 15 mL conical tube. Transfer to a rotating rack, incubate at 30 °C for 3 h before loading into microfluidic devices (Figure 1D).
8. Microfluidic device preparation
NOTE: This section describes the setup of microfluidic devices (Figure 2A–C) according to the manufacturer’s recommendations, using an inverted fluorescence microscope with an environmental control chamber. Use 70% Ethanol to sterilize the work area, scissors, tubing, and gloves throughout setup to reduce the risk of introducing contamination. To decrease the risk of cell clumping and clogging during the experiment, Pluronic F-127 is added to the growth media. Dissolve 5 g of Pluronic F-127 powder (10 g/L) in 500 mL of YPD (2% dextrose) media one day before the experiment, add ampicillin (100 µg/mL), and filter-sterilize 1–2 h before use. Make sure no air bubbles remain in media syringes and tubing during microfluidic device setup.
- Dissolve 5 g of Pluronic F-127 powder (10 g/L) in 500 mL of YPD (2% dextrose). Prepare one day prior to the experiment and let it dissolve overnight. On the day of the experiment, add ampicillin (100 µg/mL) to YPD (2% dextrose), Pluronic F-127 (10 g/L).
- Filter sterilize YPD (2% dextrose) + ampicillin (100 µg/mL) + Pluronic F-127 (10 g/L). Let it sit for 1–2 h before loading the media pumps to remove air bubbles introduced during filtration.
- Inspect the microfluidic device for any damage, such as cracked cover glass. Plug the cell loading inlet ports with solid stainless-steel pins (Figure 2A,D,E).
NOTE: Care must be taken not to insert solid stainless-steel pins too deeply into cell loading ports, as this can make removal difficult during cell loading. - Cut tubing for media outlet at necessary length to connect media outlet port to waste collection container, allowing slack for stage movement during imaging (Figure 2A,G).
- Connect hollow stainless-steel pins to media outlet tubing. Plug hollow stainless-steel pins and tubing into media outlet ports (Figure 2D–F). Add oil to the microscope objective and the cover glass on the microfluidic device.
- Mount the microfluidic device onto the microscope (Figure 2G). Find the focal plane of imaging units and inspect the integrity of polydimethylsiloxane (PDMS) U-trap structures (Figure 2C).
- Direct tubing from media outlet port into a waste container (Figure 2G). Tape media outlet tubing to the microscope stage (Figure 2G, green tape).
- Make sure the media outlet tubing is well above the bottom of the waste container to avoid tubing being submerged in waste media that will accumulate during the experiment, creating back pressure.
- Shorten media outlet tubing if necessary. Cut the media inlet tubing to the necessary length to connect the media inlet port to the media syringes placed on the micropumps. Allow slack for stage movement during imaging.
- Connect hollow stainless-steel pins to the media inlet tubing. Open the 20 mL syringe package and expel air completely.
- Take up 20 mL of YPD (2% dextrose) + ampicillin (100 µg/mL) + Pluronic F-127 (10 g/L) into 20 mL syringes. Connect a syringe adapter to the media syringe head.
- Ensure the syringe adapter is screwed on tightly. Connect the media inlet tubing to the media syringe adapter. Tape the other end of the media inlet tubing to a waste collection container so that the hollow stainless-steel pin faces the container.
- Carefully expel remaining air bubbles from the media syringe. Hold the media syringe vertically, letting air bubbles rise towards the syringe head. Apply pressure to expel air bubbles and media through the tubing into the waste container.
- Gently tap the syringe side against a table while holding it upright to release any remaining air bubbles, then reapply pressure until all air bubbles are expelled. Check the tubing and syringe carefully for any remaining air bubbles.
- Mount the media syringe onto the micropump. If using a micropump with multiple slots, repeat the syringe preparation described in steps 8.10–8.14 for each additional syringe and mount each prepared syringe onto the micropump until all desired slots are filled. Move the micropump plunger forward until it engages with the syringe plungers, and media starts to be expelled through the tubing of all syringes.
- Insert the hollow stainless-steel pins, connected to tubing and a media syringe, into the media inlet port of the mounted microfluidic device (Figure 2A,H,I).
- Start the pump with a flow rate of 2.4 µL/min once all syringes mounted on the micropump are plugged into the microfluidic device. Tape tubing connected to the media inlet port to the microscope stage (Figure 2I, green tape in the background).
- Ensure slack in tubing lines to allow for stage movement during imaging. Turn on the environmental chamber and set it to 30 °C. Run media pumps for at least 2 h before loading cells, to prime imaging units with media.
- Take test images of ROI after approximately 1 h of media flow to test focal plane differences across a single imaging unit.
- Depending on the microscope and magnification, acquire for each chamber, 2 x 27 images and three z-slices per position with 3–8 µm spacing, to compensate for focal plane differences across a single imaging unit.
- Stop the pumps 1 h before cell loading to reduce pressure and make loading easier.
9. Loading of gametes into microfluidics devices
NOTE: Cell loading for all conditions must be completed in less than 1 h to avoid premature cell divisions of gametes. Failure to do so will lead to dilution of gametes by newly generated daughter cells and imprecise assessment of total replicative lifespan. For each condition and genotype, two imaging units are loaded to acquire two technical replicas for analysis.
- Cut tubing for cell loading at the necessary length to connect the cell loading inlet with the syringe. Connect hollow stainless-steel pins to cell loading tubing. Connect a syringe adapter to the head of a 5 mL syringe.
- Connect the cell loading tubing to the syringe adapter on the 5 mL syringe. After 3 h of re-growth (step 7.9), check if most gametes have initiated growth. Check for enlarged gametes and emerging buds using a light microscope.
- Aliquot 2 mL of the first condition to be loaded into a 2 mL centrifuge tube. For each condition, do steps 9.3–9.15 one by one. Remove the solid stainless-steel pin from the two imaging units that will be loaded with cells from a specific condition to release pressure.
- Sonicate aliquoted cells with a hand sonicator (five pulses at 1 pulse/second and 50% duty cycle) right before taking up into a syringe. Pass sonicated cell suspension through pre-separation filter (30 µm) into a new 2 mL centrifuge tube.
- Load the cell suspension into the prepared 5 mL syringe through the hollow stainless-steel pin and connected tubing. Expel air from the syringe containing the cell suspension, ensuring no air remains in the syringe and tubing.
- Push the syringe plunger until a small drop of liquid appears on the hollow stainless-steel pin. Insert a hollow stainless-steel pin into the cell-loading inlet of the microfluidic device.
- Ensure no air is introduced by connecting a liquid drop from a stainless-steel pin directly to the cell loading inlet. Use a rolled-up lint-free laboratory wipe to dab excess liquid off the microfluidic device.
- Load cells manually by applying pressure carefully to the syringe plunger while observing the imaging unit directly on the microscope with live view. Apply pressure to the plunger until PDMS U-trap structures begin to warp slightly.
- Maintain pressure continuously and wait until cells start to flow into the imaging area. Do not apply excessive pressure, as this can lead to overloading and/or detachment of PDMS structures from the cover glass, rendering the imaging unit useless.
- Release pressure once cells start to load into traps and monitor loading efficiency across the imaging unit. Reapply pressure to repeat the loading cycle until enough cells are trapped.
- Repeat loading cycle if fewer than 200 traps are occupied. Optimally loaded units will have cells occupying 2/3 of the traps, balancing sufficient loading and the risk of overloading, which increases the risk of clogging during the experiment.
- If shared pumps are used for different imaging units and one imaging unit becomes overloaded, the tubing of the affected unit is disconnected from the media pump to prevent the pump from stalling due to clogging and to avoid loss of additional experimental conditions (Figure 2J).
- Remove the hollow stainless-steel pins from the cell loading inlet once sufficient cells have been loaded. Carefully re-plug the solid stainless-steel pin slowly into the cell loading inlet port.
- Avoid inserting the solid stainless-steel pin too deeply or too quickly into the loading port, as this can cause a sudden increase in pressure in the imaging unit, leading to the loss of trapped cells. Load the second channel for the same condition, starting over at step 9.6.
- Remove the solid stainless-steel pin from the imaging units to be loaded next, then start over at step 9.3 to load the next condition. Repeat until all conditions are loaded.
- Using live view on the microscope, inspect all loaded imaging units, assuring sufficient and stable loading and confirming that the unit is not overloaded. Once all imaging units connected to the micropump are loaded and appropriate cell loading is confirmed, start the micropump at a constant flow rate of 2.4 µL/min.
- Inspect the microfluidic device carefully for any leakage from re-plugged loading ports once media flow is resumed. If leaking is observed: unplug and carefully re-plug the solid stainless-steel pin.
- If the leak cannot be stopped, disconnect the affected imaging unit from the media pump by removing the tubing from the 20 mL media syringe adapter (Figure 2J). If the imaging unit is overloaded, unplug the imaging unit from the media pump by unplugging the tubing from the syringe adapter at the 20 mL media syringe head.
10. Image acquisition
NOTE: Once pumps are running and quality control has been completed, gametes are identified by imaging the entire field of view (areas containing trapped cells) for each chamber in the FITC and brightfield channels at the t0 timepoint (Figure 1E and Figure 3D,E). Imaging conditions depend on the specific system and experimental need and can be adapted accordingly. For example, using a 40x objective, 2 x 27 images and three z-slices per position with 3–8 µm spacing, to compensate for variable focal plane differences across a single unit, are acquired in FITC and brightfield channels. After acquisition of t0, time-lapse imaging of the same field of view is performed at 15–20 min intervals for 72 h to cover the complete replicative lifespan of gametes (Figure 3D,E). Time-lapse imaging is performed only in the DIC channel to avoid cumulative phototoxicity by repeated imaging in the FITC channel.
- Once micropumps are running, re-verify all ROIs and focal planes for all loaded imaging units. Acquire the first timepoint (t0) in the FITC and DIC channels for all ROIs to identify gametes (GFP-positive) (Figure 1D and Figure 3C).
- After acquisition of t0, start time-lapse imaging with intervals of 15–20 min for a total of 72 h, acquiring only in the DIC channel (Figure 1E and Figure 3D,E). Monitor the device sporadically during the experiment for any spontaneous leaks. If leaks are observed, unplug the corresponding syringe to prevent large-scale pump failures or media spillage into the microscope.
- Once the timelapse is completed, transfer data and proceed with cleanup.
11. Cleanup
- Stop pumps 30 min prior to cleaning up after time-lapse acquisition is completed. Remove media syringes from micropumps and shut off pumps. Unplug hollow stainless-steel pins connected to the tubing and media syringe.
- Remove the microfluidic device from the microscope and unplug all stainless-steel pins. Clean off the oil from the microscope objective.
- Discard the microfluidic device and stainless-steel pins into dedicated waste containers. Transfer data and shut down the microscope.
12. Replicative lifespan analysis of gametes
NOTE: To quantify gamete replicative lifespan upon completion of a time-lapse experiment, images are processed, and gamete replicative lifespan is counted (Figure 1F). Processing depends on the microscope setup and needs. Briefly, brightfield time-lapse images from each condition (same imaging unit) are stitched together to form a hyper-stack. If necessary, the brightfield time-lapse hyper stack and t0 FITC images are cropped and resized so that the X-Y coordinates of a specific point are the same across images. Images are quantified using custom semi-automated Fiji/ImageJ (ImageJ2, V. 2.14.0/1.54m)20,21 macros. Specific notes on macro inputs are noted in the header of each macro and need to be adapted to individual input data. Replicative lifespan is measured for 200 cells per technical replicate for each genotype and condition. Counts from two technical replicas are concatenated to obtain robust replicative lifespan measurements. The experiment is repeated to obtain an individual biological replica.
PAUSE POINT: Image analysis to assess the replicative lifespan of gametes can be performed at any convenient point once the experimental part of the protocol is completed.
- Open t0 FITC image for a specific microfluidics unit. Choose the input and output folders as prompted and click OK.
- Draw a rectangle around FITC-positive gamete loaded into microfluidic trap and add the rectangle to ROI manager (shortcut t). Do not crop tightly around the cell; leave a margin of approximately one trap width on each side. (Figure 1D, Figure 3C, and Supplementary Figure 4).
- Continue until all FITC-positive gametes are added to the ROI manager (Supplementary Figure 5). Go to the ROI manager and select all points. Click on More and Save.
- Save ROI list to output folder. Drag and drop the macro Manual ROI Crop and TIFF Export - Open Images (Supplementary File 4) into FIJI/ImageJ to open.
- Select the last ROI in the list and click Run in the macro window: Manual ROI Crop and TIFF Export - Open Images (Supplementary File 4). Choose the output folder following the prompts to start the macro.
- Macro starts duplicating and saving all chosen ROI`s to the specified output folder. Macro stops once it duplicates and saves all ROI´s.
- Close t0 FITC image. Open brightfield time-lapse hyper stack for the same microfluidics unit. If not already open, drag and drop the macro Manual ROI Crop and TIFF Export - Open Images (Supplementary File 4) into Fiji/ImageJ to open.
- If not already open, drag and drop the saved ROI list from the t0 FITC image into Fiji/ImageJ to open. Select the last ROI in the list and click Run on macro: Manual ROI Crop and TIFF Export - Open Images (Supplementary File 4).
- Choose the output folder following the prompts to start the macro and click OK. Macro starts duplicating and saving all chosen ROI`s to the specified output folder.
- Macro stops once it duplicates and saves all chosen ROIs. Close brightfield time-lapse hyper stack.
- Drag and drop the macro Manual GFP, RLS, and Terminal Phenotype Annotation (Supplementary File 5) into Fiji/ImageJ to open. Click Run in the macro window.
- Choose the input and output folders as prompted, then click OK. Inspect t0 FITC to make sure a gamete (GFP-positive cell) is loaded. Compare t0 FITC image and t0 brightfield time-lapse to make sure the same cell is still loaded in t0 brightfield time-lapse (Figure 3C).
- Click OK on the prompt window: Action Required (GFP cell trapped Y/N?) (Supplementary Figure 6). If the t0 FITC cell is not GFP positive, choose 0 on the prompt window.
- If the cell loaded in t0 brightfield time-lapse is not the same cell as loaded in t0 FITC image, choose 0 on the prompt window. If the t0 FITC cell is GFP positive and the cell loaded in t0 brightfield time-lapse is the same cell as loaded in t0 FITC image, choose 1 on the prompt window (Supplementary Figure 7). Click OK on the prompt window once the GFP cell decision is made.
- Count replicative lifespan by assessing how many daughter cells emerge from the loaded gamete before it reaches either a terminal phenotype (ceases to divide) or ejects from the trap (is lost from ROI).
- Once replicative lifespan has been counted, click OK on the prompt window: Action Required (RLS of cell?) (Supplementary Figure 8). In the prompt window, choose how many divisions have been observed (RLS) (Figure 3D,E; Supplementary Figure 9).
- Once RLS has been reported, click OK on the prompt window. Determine if the cell has reached the terminal phenotype or has been ejected from the trap before ceasing to divide.
- Click OK on the prompt window: Action Required (Terminal?) (Supplementary Figure 10). In the prompt window, choose 0 if the cell is ejected while still dividing, before the terminal phenotype has been observed.
- In the prompt window, choose 1 if a terminal phenotype has been observed (Supplementary Figure 11). In the prompt window, choose “?” if unclear.
- Click OK in the prompt window once the terminal fate decision has been made. Click OK in the prompt window: Action Required (Reason?) (Supplementary Figure 12).
- If the cell is ejected before reaching the terminal phenotype, choose the ejection cell fate: “ejected” = cell ejected while still dividing; if the cell reached the terminal phenotype choose terminal cell fates: (a) ejected/done = cell acquired terminal morphology but ejected within 3 h of last division; (b) enlarged = cell enlarged and ceased to divide; (c) failed division and enlarged = cell failed to separate during last division and ceased to divide; (d) shriveled up = cell no longer divides and shows a shrunken, shriveled morphology (Supplementary Figure 13); (e) other = any other class that does not fit descriptions above.
- Click OK on the prompt window once the terminal cell fate decision has been made. Results from all prompts will be automatically recorded in the Log window and saved as a .txt file in the output folder.
- Do not close the Log window during counting. The next image in the input folder will open automatically. Repeat steps 12.12–12.22 until the script has cycled through all images in the input folders.
結果
複製齢の分離および配偶子形成効率の評価
異なる年齢の前駆細胞に由来する配偶子の複製寿命を比較するには、細胞集団の十分な年齢分離と純度を確保しなければなりません。得られた高齢細胞集団の純度を90–100%まで高めるため、標準的な年齢分離プロトコルに重要な適応を加え、1回目のソートで得られた高齢細胞の溶出液を新しいカラムに再適用して2回目のソートを行いました9。ダブルソートされた高齢および若年細胞集団の純度と年齢を評価するため、出芽痕およびビオチンに対する染色の実施後、各条件について約50個の細胞をイメージングします。小麦胚芽凝集素(Wheat germ agglutinin)は、酵母細胞壁上のキチンに富む環状構造である出芽痕に特異的に結合します。出芽イベントのたびに1つの出芽痕が残るため、これにより細胞の正確な複製年齢を明らかにすることができます(図 1Cおよび図 4A)22。前配偶子形成細胞の画像は、プロトコルのステップ5に記載されている画像解析パイプラインに従って解析します。
ここで述べる連続ソートプロトコルを用いることで、ビオチン化細胞が約3.63%で平均複製年齢が1.16の若年細胞集団と、ビオチン化細胞が約96.74%で平均複製年齢が8.55の老化細胞集団を一貫して得ることができます(図 4B,C)9。ビオチン染色により評価した老化細胞集団または若年細胞集団のいずれかの純度が80%未満である場合、実験は中止します。最適な実験では、若年細胞集団と老化細胞集団の平均年齢の差が少なくとも6分裂あります。この分離が4分裂未満である場合、実験は中止します。
配偶子形成誘導培地での24時間後の配偶子形成効率を分析します。上述の条件下では、コントロール遺伝子型において、若年細胞の79.8%および高齢細胞の78.89%が、視覚的に明確な4分胞子を正常に形成しました(図4D)9。配偶子形成効率の低さは、本プロトコルにおける厳格なボトルネックではありませんが、配偶子の収量が減少するため、後続のステップがより困難になり、再現性が低下します。したがって、配偶子形成効率が30%を下回る場合は、高齢の前駆細胞から十分な収量の配偶子を確保するため、分取に用いる細胞投入量を2倍(4 x 8 OD600)に増やします。
若年前駆細胞由来の配偶子形成後の四分胞集団は、再現性をもって13.38%のビオチン化細胞純度と1.31の平均複製年齢を示し、一方で高齢細胞由来の集団は、97.34%のビオチン化細胞純度と8.17の平均複製年齢を示します(図 4E,F)9。特定の遺伝子型において、分取された四分胞集団の純度が20%以上変動した場合、あるいは高齢四分胞の平均年齢が配偶子形成前の高齢細胞集団と比較して3分裂分以上減少した場合は、さらなる評価を行う必要があります(図 4E,F)。
要約すると、連続的な磁気ビーズソートにより、減数分裂前の細胞を効率的に年齢分離することが可能となり、若年細胞(79.8%)と高齢細胞(78.89%)の両方で同等の配偶子形成効率が得られました。細胞集団の複製年齢と純度は、配偶子形成の前と後の2回分析されます。四分子(テトラッド)の年齢分離を再検証することは、特定の変異が年齢依存的に配偶子形成を妨げ、その結果として配偶子形成特異的に高齢細胞が減少している可能性を排除するために重要です。
配偶子形成による若返りの評価
配偶子形成前の野生型細胞を若齢細胞集団と老齢細胞集団に分取し、本手法に従って配偶子形成を誘導した。配偶子分離および配偶子の複製寿命獲得前の集団の複製年齢を決定するため、テトラードあたりの出芽痕数を定量化した(Figure 5A)9。タイムラプスイメージングの後、若齢および老齢の前駆細胞に由来する配偶子の複製寿命を定量して比較したところ、若齢前駆細胞由来および老齢前駆細胞由来の配偶子の複製寿命の中央値は同程度であった(それぞれ21回および22回の分裂、p = 0.982;Figure 5B)。これにより、本プロトコルが配偶子形成による若返りを捉えていることが確認された。
このアプローチを用いて、選択的オートファジーによる損傷した細胞成分の分解が、配偶子形成による若返りに必要であることを突き止めました9。液胞を介して損傷成分の分解を媒介するオートファジー経路は、加齢とともに低下し、その結果、損傷した細胞成分が増加します23,24。特定のカーゴを標識する選択的オートファジー受容体へのコアオートファジー装置のリクルートに必要な主要な選択的オートファジー足場タンパク質であるAtg11は、配偶子形成中にダイナミックにアップレギュレートされます9。選択的オートファジーによる損傷の除去が配偶子形成による若返りに重要であるかを検証するため、前配偶子形成期のatg11Δ細胞を若い細胞集団と老化した細胞集団に分取し、ここで述べるプロトコルに従って配偶子形成を誘導しました。テトラードあたりの出芽痕を定量することでテトラード集団の複製年齢を確認した後(Figure 5C)9、テトラードを分離し、配偶子の複製寿命を測定しました。若い前駆細胞および老化した前駆細胞由来のatg11Δ配偶子の複製寿命の中央値を定量したところ、老化した前駆細胞由来の配偶子は、若いatg11Δ前駆細胞由来の配偶子よりも有意に、かつ再現して短い複製寿命を示すことが明らかになりました(Figure 5D、Rep.1, p = 2 x 10⁻⁶、Rep.2, p = 3 x 10⁻⁶、Figure 5Bとの比較)9。この結果は、Atg11を介した選択的オートファジーが、老化した前駆細胞由来の配偶子の完全な若返りに重要な役割を果たすことを示唆しており、本ワークフローが完全に若返った配偶子を産生するために必要な構成要素を明らかにできることを示しています。
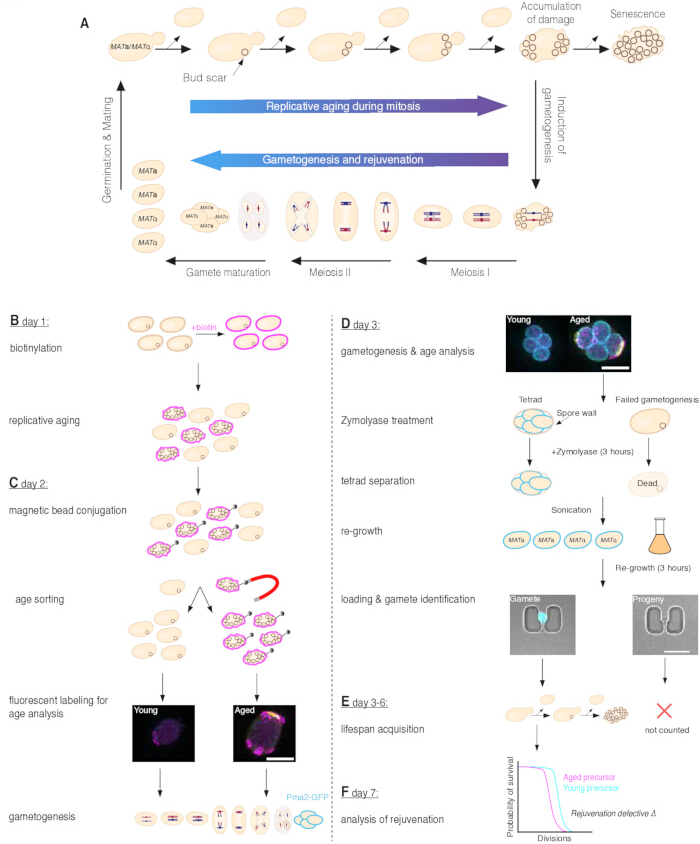
図1. 配偶子形成による若返りと、配偶子の複製寿命を評価するためのパイプライン。(A)栄養成長期において、出芽酵母は非対称に分裂します。新たに形成された娘細胞は若く生まれますが、母細胞は加齢に伴う損傷を徐々に蓄積し、最終的に老化します。個々の酵母細胞の複製年齢は、分裂ごとに形成され母細胞壁に残る出芽痕の数によって示されます(上パネル)。配偶子形成は栄養枯渇によって誘導されます(右側の下向き矢印)。この過程で、二倍体酵母は対称的に分裂し、2つの接合型からなる4つの等しく若い半数体配偶子を含む四分子体を形成します。配偶子の複製寿命は、複製老化が進んだ前駆細胞由来の配偶子であっても完全にリセットされます(下パネル)。栄養分が添加されると、配偶子は発芽して有糸分裂による成長を再開し、2つの接合型が接合することで二倍体細胞を形成します(左側の上向き矢印)。(B)1日目に創始細胞をビオチンで標識し、最適成長温度のリッチ培地で一晩培養して、複製老化が進んだ創始細胞と若い娘細胞を生成します。(C)2日目に、ビオチン標識された創始細胞を磁気ビーズに結合させ、続いて磁気年齢ソートを行い、老化創始細胞を若い娘細胞から分離します。その後、ビオチンおよび出芽痕の蛍光を評価してソート効率を決定し、分離された集団の複製年齢を確認します。次に、細胞を配偶子形成誘導培地で一晩インキュベートし、Pma2-GFPを発現する四分子体を生成します。(D)3日目に、配偶子形成効率、ビオチン標識、および出芽痕を評価して、配偶子形成と集団の年齢分布を確認します。四分子体をZymolyaseで3時間処理して胞子壁を消化し、配偶子形成が進まなかった細胞を溶解させた後、超音波処理によって機械的に分離します。分離された配偶子を再増殖させてマイクロ流路のUトラップへの保持を容易にし、その後マイクロ流路デバイスにロードします。代表的な画像は、Uトラップに捕捉され、明視野およびPma2-GFP蛍光(シアン)で可視化されたPma2-GFP陽性の配偶子(左)とPma2-GFP陰性の配偶子子孫(右)を示しています。(E)配偶子の複製寿命は、プロトコルの3〜6日目に、マイクロ流路ベースの長期タイムラプスイメージングを用いて測定されます。(F)プロトコルの7日目における、若返り欠損背景での配偶子複製寿命の解析後の仮想的な結果。スケールバー = 5 µm。この図はSpiri et al.9より改変したものである。ここをクリックして、この図の拡大版を表示してください。
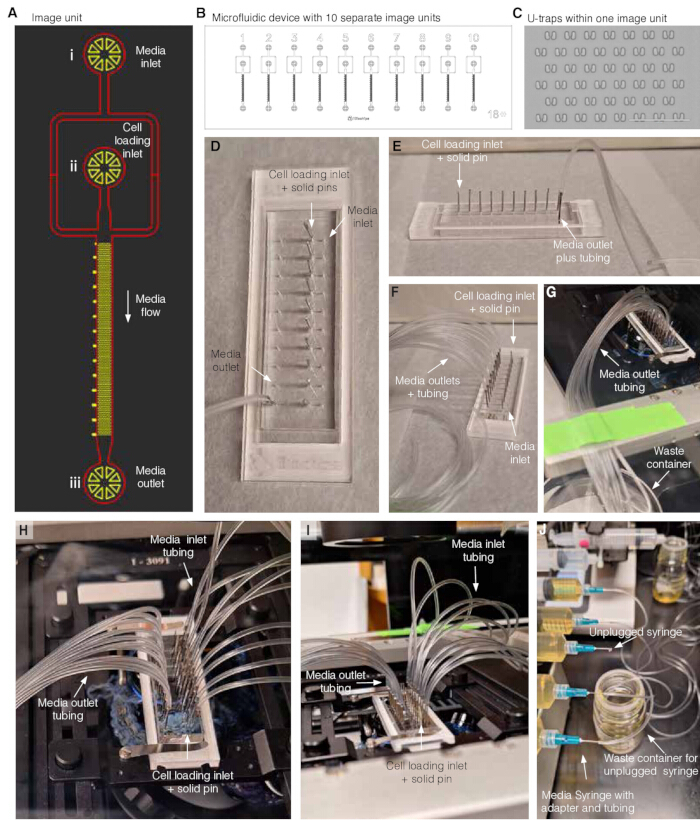
図 2. マイクロ流体デバイスの調製。(A) イメージングユニット1つの概略図。(i) メディア入口、(ii) 細胞導入入口、(iii) メディア出口。実験中、新鮮なメディアがメディア入口 (i) からメディア出口 (iii) へ流れる一方で、細胞導入入口 (ii) は固形のステンレスピンで塞がれている。(B) 10個の独立したイメージングユニットを含むマイクロ流体デバイス1つの概略図。(C) イメージングユニット内のPDMS Uトラップと間隔の画像。スケールバーは 100 µm。(D) すべての細胞導入入口に固形ステンレスピンが差し込まれ、メディア流出液回収用に1つのメディア出口に中空ステンレスピンとチューブが差し込まれたマイクロ流体デバイスの上面図。(E) すべての細胞導入入口に固形ステンレスピンが差し込まれ、メディア流出液回収用に1つのメディア出口に中空ステンレスピンとチューブが差し込まれたマイクロ流体デバイスの側面図。(F) すべての細胞導入入口に固形ステンレスピンが差し込まれ、メディア流出液回収用にすべてのメディア出口に中空ステンレスピンとチューブが差し込まれたマイクロ流体デバイス。(G) すべての細胞導入入口に固形ステンレスピンが差し込まれ、メディア流出液回収用にすべてのメディア出口に中空ステンレスピンとチューブが差し込まれたマイクロ流体デバイスを顕微鏡に搭載した様子。メディア流出液回収用チューブは、顕微鏡ステージにテープ(緑色のテープ)で固定され、廃棄物回収容器に向かっている。(H) すべての細胞導入入口に固形ステンレスピンが差し込まれ、すべてのメディア出口に中空ステンレスピンとチューブが差し込まれ、さらにすべてのメディア入口にメディアシリンジに接続された中空ステンレスピンとチューブが差し込まれたマイクロ流体デバイスを顕微鏡に搭載した様子。(I) すべての細胞導入入口に固形ステンレスピンが差し込まれ、すべてのメディア出口に中空ステンレスピンとチューブが差し込まれ、さらにすべてのメディア入口にメディアシリンジに接続された中空ステンレスピンとチューブが差し込まれたマイクロ流体デバイスを顕微鏡に搭載した様子。メディアシリンジからのチューブは、顕微鏡ステージにテープで固定されている(背景の緑色のテープ)。(J) 液漏れが発生した場合や、イメージングユニットが過負荷になった場合に、マイクロ流体デバイスからメディアシリンジを取り外す方法の例。図 2A–C は Jo et al.15.より改変。図 D–J は Spiri et al.9より改変。ここをクリックして、この図の拡大版を表示してください。
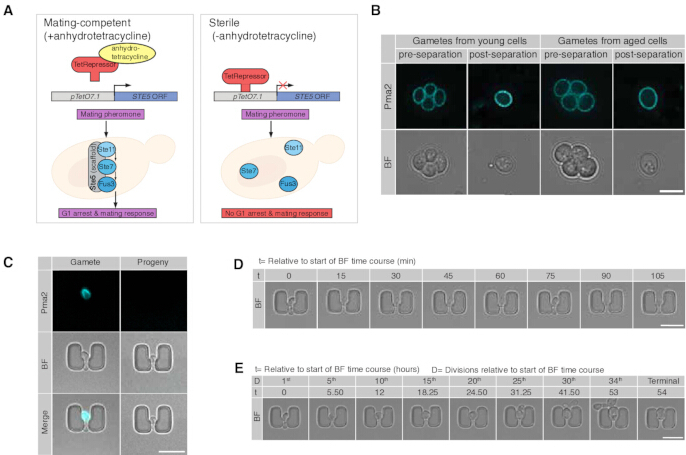
図3マイクロ流体デバイスを用いた配偶子の複製寿命測定のための配偶子調製。 (A条件付き不妊を達成するための遺伝子系の模式図。〜の内因性プロモーターの STE5交配フェロモン感知時の信号伝達に必要なスキャフォールドタンパク質である[タンパク質名]を、[置換後の名称]に置換し、 pTetO7.1 プロモーター断片。基底状態では、構成的プロモーターの下で発現したTetリプレッサータンパク質(TetR)が結合し pTetO7.1 そして、このプロモーターからの転写を抑制します。アンヒドロテトラサイクリンの添加と結合により、Tetリプレッサーに構造変化が誘起され、その親和性が低下します。 pTet07.1 これにより、〜の転写抑制が解除され、 STE5 (B) 分離前および分離後の若年(左パネル)および高齢(右パネル)の四分胞子および配偶子の代表的な単一zスライス像。明視野およびPma2-GFP(シアン)を可視化している。 (C) マイクロ流体デバイスにトラップされた、代表的なPma2-GFP陽性配偶子(左パネル)およびPma2-GFP陰性配偶子の子孫(右パネル)の明視野像およびPma2-GFP(シアン)の可視化像。D) 捕捉された代表的な配偶子が2時間かけて2回分裂する。E)マイクロ流体イメージングユニット内に捕捉された代表的な配偶子。5秒ごとに可視化。th 末端の34まで分割th 54時間にわたる分裂。スケールバー = 5 µmこの図はSpiriらの文献から改変したものである。9. この図の拡大版を表示するには、ここをクリックしてください。
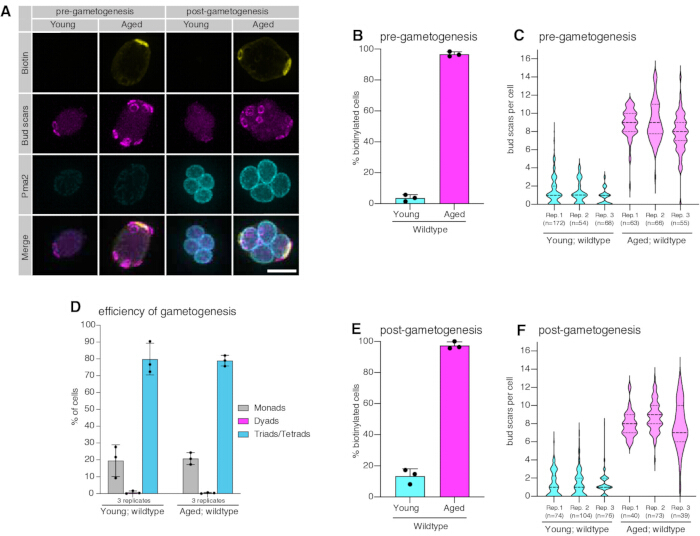
図4複製年齢および配偶子形成効率の定量化。 (A代表的な、年齢別に分級された配偶子形成前の最大強度投影細胞(左パネル)および配偶子形成後の四分体(右パネル)。蛍光標識ストレプトアビジン(黄色)を用いてビオチンを、蛍光標識小麦胚芽凝集素(マゼンタ)を用いてキチンに富む出芽痕を、そしてPma2-GFP(シアン)をそれぞれ可視化している。B) 若年(3.63 ± 2.12 %、平均値 ± 標準偏差(SD)、3回の繰り返し、n = それぞれ172、54、68)および高齢(96.74 ± 1.58%、平均値 ± SD、3つのレプリカ、n = それぞれ63、66、55)の野生型細胞集団。エラーバーはSDを示す。(C若齢個体における出芽痕の数を評価することによる複製寿命の定量化 (1.16 ± 0.41, 平均値 ± SD、n = 3 レプリカ、n = 172、54、および 68(それぞれ)、および高齢(8.55 ± 0.66, 平均値 ± SD、3つのレプリカ、n = それぞれ63、66、55)の野生型細胞集団。(D) 若年個体(79.8 ± 9.43%;平均値 ± SD、3つのレプリカ(Rep.1および3 n = 300、Rep. 2 n = 281)、および高齢(78.89 ± 3.17 %、平均値 ± SD、3つのレプリカ、n = 各300)、配偶子形成後の野生型細胞集団。エラーバーはSDを示す。E) 若年個体(13.38 ± 4.74%、平均値 ± SD、n = 3 反復、n = 74、104、および 76(それぞれ)、および高齢(97.34 ± 2.33%、平均値 ± SD、3つのレプリカ、n = それぞれ40、73、39)配偶子形成完了後の野生型集団。エラーバーはSDを示す。(F) 若年個体における芽痕数の評価による複製齢の定量化(1.31 ± 0.04, 平均値 ± SD、3つのレプリカ、nはそれぞれ74、104、および76)、および高齢(8.17 ± 0.54, 平均値 ± SD、3つのレプリカ(nはそれぞれ40、73、39)の野生型テトラド集団。スケールバー = 5 µm信頼区間はWilsonスコア法を用いて算出した。バイオリンプロットは中央値(実線)、25th および75th パーセンタイル(点線)。この図はSpiriらから改変したものである。9. この図の拡大版を表示するには、ここをクリックしてください。
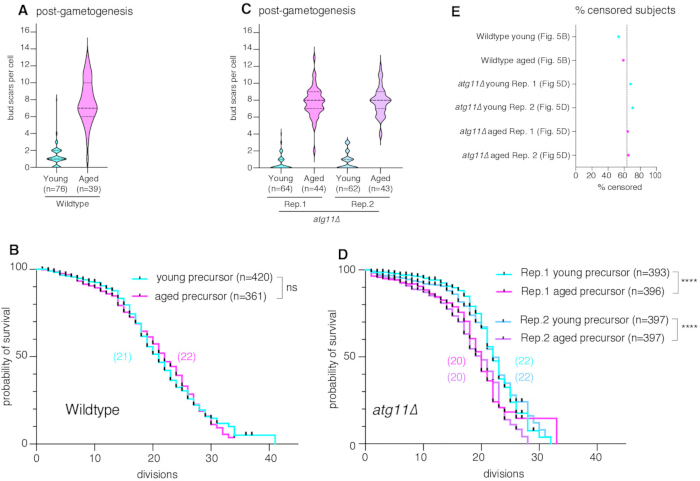
図5複製寿命の定量化。 (A若年個体(1.3...)における出芽痕の数を評価することによる複製年齢の定量化 ± 1.2, 平均値 ± (SD, n = 76)および年齢(7.8 ± 2.6, 平均値 ± SD, n = 39) 野生型配偶子集団。図(または表)に示されているものと同じデータ。 図4F 反復3回分(B若年個体(生存期間中央値 = 21、n = 420、打ち切り数 = 223)および高齢個体(生存期間中央値 = 22、n = 361、打ち切り数 = 213)の複製寿命の定量化 p =0.982(若齢群との比較)の野生型配偶子。2回のテクニカルレプリケートによるカウント値を連結した。(C) 芽痕数の評価による複製年齢の定量化 atg11Δ 4分胞子集団:再現性 1 若年 (0.53 ± 0.91, 平均値 ± SD、n = 64)、および年齢(7.8 ± 1.8, 平均値 ± SD, n = 44); 繰り返し 2 若年 (0.82 ± 1, 平均値 ± SD、n = 62)、および年齢(7.9 ± 1.7, 平均値 ± SD, n = 43). (D) の複製寿命の定量化 atg11Δ 2つの独立した生物学的レプリカの配偶子:Rep.1 若齢群(生存期間中央値 = 22, n = 393, 右側打ち切り個体数 = 267)および高齢群(生存期間中央値 = 20, n = 396, 右側打ち切り個体数 = 255) p = 2 x 10⁻⁶); 若齢群(生存期間中央値 = 22, n = 397, 右側打ち切り数 = 280)および高齢群(生存期間中央値 = 20, n = 397, 右側打ち切り数 = 259)の再現実験(Rep. 2)において、 p = 3 x 10⁻⁶ (若齢群と比較して)。各独立した生物学的レプリカについて、2つのテクニカルレプリカからのカウントを結合した。E) 全寿命試験における打ち切りイベントの割合。破線は平均値(63.4%)を示す。 ± 6.2 平均値 ± n = 6の実験における打ち切り被験者の標準偏差(SD)。複製寿命の差の統計的有意性は、ログランク(Mantel-Cox)検定を用いて評価した。生存曲線上のティックマークは打ち切りイベントを示す。バイオリン図は中央値(実線)、25th および75th パーセンタイル(点線)。 p 値が示されている(ns = p > 0.05, * = p ≤ 0.05, ** = p ≤ 0.01, *** = p ≤ 0.001, **** = p (p ≤ 0.0001)。この図はSpiriらによるものを改変したものである。9. この図の拡大版を表示するには、ここをクリックしてください。
補足図1:出芽痕解析のための関心領域の選択。矩形の関心領域(ROI)を用いて個々の細胞を選択し、その後の解析のためにROIマネージャーに追加したImageJのスクリーンショットの代表例。選択されたROIは黄色い枠で表示されています。 こちらのリンクからファイルをダウンロードしてください。
補足図2:芽痕数の手動入力。選択した各細胞について、特定された芽痕の手動入力に使用されるダイアログボックスを示すImageJのスクリーンショット。芽痕は、Y投影図を回転させて小麦凝集剤(wheat germ agglutinin)シグナルを確認することでカウントされる。 こちらをクリックしてファイルをダウンロードしてください。
補足図3:ビオチン標識の手動分類。選択した細胞がビオチン標識陽性か陰性かを記録するために使用されるImageJのダイアログボックスを示す代表的なスクリーンショット。値1はビオチン陽性細胞を、値0はビオチン陰性細胞を示す。 こちらのリンクからファイルをダウンロードしてください。
補足図 4:マイクロ流体デバイスにおける関心領域の選択。長方形のROI(関心領域)を使用して選択され、ROIマネージャーに追加された個々のマイクロ流体Uトラップを示すRepresentative ImageJのスクリーンショット。各ROIは、その後の解析のために単一のUトラップを囲んでいる。 こちらをクリックしてファイルをダウンロードしてください。
補足図5:選択したマイクロ流体UトラップROIの可視化。個々のUトラップを選択した後、マイクロ流体デバイス上に重ねて表示された複数の矩形ROIを示す代表的なImageJスクリーンショット。ROIマネージャーの「Show All」機能を用いて、ROIが同時に表示されている。 こちらをクリックしてファイルをダウンロードしてください。
補足図 6:マイクロ流体UトラップにおけるGFP陽性細胞の同定選択したUトラップ内にGFP陽性細胞が捕捉されているかを判定するために使用されたプロンプトを示すImageJスクリーンショットの代表例。同定を容易にするため、明視野像とともに蛍光像が表示されている。 こちらをクリックしてファイルをダウンロードしてください。
補足図 7:GFP陽性細胞の手動分類。選択したU-trap内の細胞のGFP状態を記録するために使用したダイアログボックスを示すImageJの代表的なスクリーンショット。値1はGFP陽性細胞を、値0はGFP陰性細胞を示す。 こちらをクリックしてファイルをダウンロードしてください。
補足図8:複製寿命の手動入力タイムラプス画像スタックを確認した後、個々の細胞の複製寿命(RLS)を入力するために使用するダイアログボックスを示すRepresentative ImageJのスクリーンショット。RLSは、観察された細胞分裂の総回数として決定される。 こちらのリンクからファイルをダウンロードしてください。
補足図 9:複製寿命の手動入力。明視野タイムラプス画像スタックを確認後、個々の細胞の複製寿命(RLS)を入力するために使用したダイアログボックスを示す代表的なFiji/ImageJのスクリーンショット。RLSは、観察された細胞分裂の総回数として記録される。こちらをクリックしてファイルをダウンロードしてください。
付随図10:複製寿命解析における終末状態の評価。解析した細胞が終末表現型に達したか、あるいは終末停止前にトラップから排出されたかを判断するために使用した「Terminal?(終末か?)」プロンプトを示す、Fiji/ImageJの代表的なスクリーンショット。 こちらのリンクからファイルをダウンロードしてください。
付録図11:複製寿命解析における終末状態の記録。終末表現型が観察されたか判定した後、終末状態の値を選択する様子を示すFijiの代表的なスクリーンショット。 こちらのリンクからファイルをダウンロードしてください。
補足図12:終末細胞運命の選択解析された細胞の除外理由または終末運命を割り当てる際に使用したプロンプトを示す、代表的なFijiのスクリーンショット。ここをクリックしてファイルをダウンロードしてください。
補足図13:末端細胞形態の分類。分裂を停止し、収縮した形態を示した細胞の「しぼんだ(shriveled up)」分類を含む、末端表現型の選択を示す代表的なFijiスクリーンショット。 こちらをクリックしてファイルをダウンロードしてください。
補足ファイル 1. 手動 ROI 選択および TIFF 書き出し Fiji マクロ 個々の細胞を関心領域(ROI)として手動で選択し、選択したROIをクロップして、その後の解析のためにクロップした画像をTIFFファイルとして書き出すために使用したカスタムFiji/ImageJマクロ。 こちらをクリックしてファイルをダウンロードしてください。
補足ファイル 2. 単一細胞 3D および Z プロジェクション Fiji マクロ。個別のクロップ済み細胞の 3 次元投影および Z プロジェクション画像を生成し、その後の出芽痕(bud-scar)およびビオチン標識解析に使用するカスタム Fiji/ImageJ マクロ。こちらのリンクからファイルをダウンロードしてください。
補足ファイル 3. 手動出芽痕およびビオチン注釈 Fiji マクロ出芽痕の数を手動で記録し、ビオチン標識の状態に従って個々の細胞を分類するために使用されたカスタム Fiji/ImageJ マクロです。こちらのリンクからファイルをダウンロードしてください。
補足ファイル 4. 手動 ROI クロップおよび TIFF エクスポート – Open Images Fiji マクロt0 FITC 画像および明視野タイムラプス ハイパースタックから、その後の配偶子複製寿命解析のために対応する関心領域(ROI)をクロップしてエクスポートするために使用したカスタム Fiji/ImageJ マクロです。こちらをクリックしてファイルをダウンロードしてください。
補足ファイル 5. 手動GFP、RLS、および最終表現型アノテーション用Fijiマクロ配偶子の複製寿命(RLS)解析において、GFP陽性配偶子の同定、RLSの手動記録、最終状態の判定、および最終表現型または放出表現型の分類に使用されるカスタムFiji/ImageJマクロです。 こちらをクリックしてファイルをダウンロードしてください。
ディスカッション
本稿では、Spiriらによって導入されたハイスループットなマイクロフルイディクスベースのワークフローを用いて9、異なる年齢の前駆細胞に由来する酵母配偶子の複製寿命を測定するための詳細なプロトコルを提供する。この手法により、多様な遺伝的背景における配偶子形成による若返りの効率に関する研究が加速され、保存されたプロセスである配偶子形成による若返りのメカニズム的な知見を得るために活用できる。酵母において配偶子形成が複製寿命をリセットするという発見は、当初、マイクロダイセクションアッセイを読み出しとして用いてW303およびA364株の背景で行われた7。SK1株は配偶子形成の研究に広く用いられているが、配偶子から最初の数個の娘細胞を分離することが困難であったため、配偶子形成に伴う複製寿命のリセットを評価することができなかった7。本プロトコルの開発にあたり、我々はSK1株の背景をエンジニアリングし、細胞分離を調節するためにAMN1遺伝子座にD368V点変異を導入し、凝集を排除するためにFLO8を欠損させることで、この制限を回避した25,26。さらに、交配反応のトリガーに不可欠なシグナル足場タンパク質であるSTE5の発現を、内因性遺伝子座にアンヒドロテトラサイクリン誘導性Tet-OFFシステムを実装することで条件付きに制限した(Figure 3A)27,28,29。これにより、MATa細胞とMATα細胞の間で完全な条件付き交配欠損が生じ、実験中にMATaおよびMATα配偶子間の交配反応がトリガーされるのを避けつつ、遺伝的交雑を可能にした。最後に、短期間の増殖後に配偶子を同定し、栄養細胞と区別するために、内因性プロモーター制御下でPma2-GFP融合タンパク質を発現するトランスジェニックレポーターを導入した。Pma2-GFPは配偶子形成の後半に特異的に発現し、配偶子の細胞膜に局在し、発芽後の数回の細胞分裂後も保持される(Figure 1D, Figure 3B,C, および Figure 4A)9。ここで述べるマイクロフルイディクスベースのアッセイは、配偶子形成による若返りを定量化するための唯一の従来の手法であった、労力を要し数日かかるマイクロダイセクションアッセイと比較して、配偶子形成による若返りプログラムの研究のスループットと実現可能性を大幅に向上させる。マイクロダイセクションによってW303およびA364で得られた結果と一致して7、我々はSK1株の背景においても配偶子形成後に複製寿命が完全にリセットされることを実証する。さらに、本手法を適用することで、配偶子の完全な若返りにはAtg11依存的な選択的オートファジーが不可欠であることを明らかにした(Figure 5B,D)(Spiriらによるデータ)9。
マイクロ流体デバイス(図 2A–D)を、記載されたプロトコル(ステップ 8)に従ってセットアップし、取り付けます。マイクロ流体デバイスを顕微鏡に取り付ける前に、カバーガラスにひび割れがないか注意深く検査します。マイクロ流体デバイスを取り扱う際は、カバーガラスを損傷させないように注意してください。ひび割れが検出された場合、顕微鏡内への培地の漏出や、実験中の圧力不整合を防ぐため、該当するイメージングユニットは使用しません。理論的には、同じマイクロ流体デバイス内の影響を受けていないイメージングユニットは引き続き使用可能ですが、構造的に損なわれたカバーガラスは実験中にさらにひび割れが広がるリスクが高いため、新しいマイクロ流体デバイスに交換することを推奨します。次に、顕微鏡下で各イメージングユニットを検査し、PDMS構造の完全性とカバーガラスへの適切な接合を確認する必要があります。実験中の細胞の凝集や詰まりのリスクを低減するため、増殖培地にPluronic F-127を添加し、実験前に培地をフィルター滅菌して不純物を除去します。イメージングユニットに培地が十分に充填されるよう、細胞をロードする少なくとも 2 h 前に、培地をマイクロ流体イメージングユニットに流しておきます。特定のイメージングユニットのUトラップ領域の上部に大量の不純物が蓄積し、細胞のロードや培地の流れが妨げられる場合は、培地ポンプから切り離して、そのユニットを実験から除外することを推奨します(図 2J)。培地がイメージングユニット全体に完全に分布したら、単一のイメージングユニット内およびマイクロ流体デバイス全体の焦点面の差を制御するために、ROIのテスト画像を撮影します。マイクロ流体デバイスに内部的な傾きがある場合は、ステージの傾きを微調整することでこの問題を軽減できます。あるいは、単一のイメージングユニットにおける焦点面の差を補正するために、1つの位置およびタイムポイントにつき、z方向の間隔を 3–8 µm として3つのzスライス画像を撮影してください。
四分子体を単一の配偶子に分離させるため、配偶子形成後の年齢選別培養物をZymolyaseと共に3時間インキュベートします (図 1D)。この酵素は酵母の細胞壁を特異的に消化し、配偶子を保護している四分子子囊(ascus)を弱めて、非配偶子を溶解させます (図 1D)。分離した配偶子は、消化に対する耐性がより高い自身の細胞壁によって保護されており、溶解が防止されます。四分子体分離後、分離した配偶子を観察し、十分な四分子体の解離と配偶子の完全性が維持されているかを確認します。30%以上の細胞が未分離の四分子体のままである場合は、追加のソニケーションサイクルを行うことで、さらなる解離を促進させることができます (図 3B)。30%以上の四分子体が未分離のままである場合は、出芽増殖中に細胞凝集体を形成し、マイクロ流路システムのロードや動作に支障をきたす可能性があるため、実験を中止し、新しいバッチのZymolyaseを用いて最初からやり直すことが推奨されます。分離後、配偶子培養物を富栄養培地中、30 °Cで3時間増殖させます。この時間は、配偶子がマイクロ流路デバイス内で容易にトラップされるまでサイズを増大させるのに十分であり、かつ、ほとんどの細胞が最初の分裂を完了しない程度の短い時間です (図 1D)。増殖後、光学顕微鏡下で細胞を観察し、サイズの増大と最初の出芽の出現を確認します。特定の遺伝子型において、配偶子のサイズ増大および分裂開始に著しく時間がかかる場合は、配偶子を効率的にトラップできるよう、適宜時間を調整してください。
その後、顕微鏡のライブビューでユニットを観察しながら、シリンジに注意深く圧力をかけて、増殖しきった細胞をマイクロ流体イメージングユニットに手動でロードします。過剰な圧力をかけると、PDMS構造がカバーガラスから剥離し、イメージングユニットを損傷させる可能性があるため、注意が必要です。PDMS構造がわずかに歪み始め、細胞がイメージング領域に流れ込むまで、継続的に圧力をかけます。細胞がイメージングデバイスに流れ込み始めたら、細胞がユニットを通過して個々のトラップに配置されるに従って圧力を下げます。最初のラウンドでトラップされた細胞が200個未満である場合は、再び圧力をかけてロードサイクルを繰り返します。最適にロードされたユニットでは、トラップの少なくとも66%に細胞が配置されており、十分なロード量と、実験中の目詰まりのリスクを高める過剰ロードとのバランスが取れている状態となります。過剰ロードされたイメージングユニットでは、Uトラップ領域の上部および内部に過剰な量の細胞やデブリが存在し、イメージングユニット全体の培地フローを妨げる可能性があります。異なるイメージングユニットに共通のポンプを使用している場合に、あるイメージングユニットが誤って過剰ロードされた場合は、目詰まりによるポンプの停止を防ぎ、他の実験グループへの影響を回避するため、該当するユニットを培地ポンプから外します(Figure 2J)。配偶子の早期分裂による娘細胞の生成に伴う配偶子の希釈や、複製寿命の不正確な評価を避けるため、すべての条件のロードは1 h以内に完了させます。すべての条件のロードが完了し、培地のフローを再開させた後、再接続したロードポートから培地の漏れがないか、マイクロ流体デバイスを慎重に検査します。漏れが観察された場合は、ステンレス製のソリッドピンを慎重に取り外し、ロードポートに挿入し直して問題を解決します。あるいは、漏れが止まらない場合は、実験中に顕微鏡内に液体が漏れ出すのを防ぐため、イメージングユニットを培地ポンプから外します(Figure 2J)。最初の数個のトラップ周囲の細胞数やデブリから判断してイメージングユニットが過剰ロードされている場合も、培地フローの減少による背圧の上昇で実験中にポンプが停止するのを防ぐため、培地ポンプから外します(Figure 2J)。
ここで使用したSK1向けに調整されたカスタムオープンUトラップマイクロ流体デバイスは、他のトラップ設計と比較して細胞の空間的閉じ込めが少なく、複製寿命の広いダイナミックレンジを捕捉できるため、過去に報告されている寿命への影響30を最小限に抑えることができます。しかし、このオープン設計には、細胞が老化して観察される前に早期に放出されてしまう可能性があるという欠点があります。これは主に、複製寿命の最後の数回の分裂中に細胞サイズが著しく増大すること(特にSK1で観察され、不可避である)や、時間の経過に伴う流体システムのわずかな圧力変動に起因します。したがって、デバイスの準備および細胞のローディング中にマイクロ流体システムに空気が混入しないよう、細心の注意を払う必要があります。配偶子の複製寿命を評価する際のバイアスを避けるため、タイムラプス開始時にロードされたすべての配偶子を、200個の配偶子が解析されるまでカウントします。老化前に放出された細胞は、解析目的で厳格に打ち切り(censored)検体として分類されます。打ち切り率は遺伝子型間で同等であり(Figure 5E、打ち切り検体 = 63.4% ± 6.2, mean ± SD)、放出頻度と観察された寿命表現型との間に系統的な関係は見られませんでした。これまでに観察されてはいませんが、解析細胞における放出率が80%を超える場合は、実験を繰り返すことを推奨します。このように、最初の数回の分裂で放出された場合でもロードされたすべての配偶子をカウントしているため、細胞の放出はこのアッセイに固有の主要な打ち切り要因となりますが、遺伝子型間の放出率の差が報告された寿命の差の原因となっているという証拠は見られませんでした。このアプローチに従うことで、複製寿命を一貫して頑健に測定することが可能です。今後の実験で放出イベントを減らすため、現在、新しいトラップ設計を備えたデバイスの開発とテストが進められています。
配偶子形成による寿命のリセットを定量化するためのスループットは、既存の方法よりも大幅に向上していますが、各配偶子の細胞分裂回数は熟練した研究者が手作業でカウントする必要があり、それが現在の本手法におけるデータ解析上の制限となっています。酵母の複製寿命解析を自動化するための機械学習アプローチにおける最近の進展は、前述の制限を克服するための有望な戦略を提供しています31。特に有望なのは、最近発表されたBudFinderと呼ばれる手法であり、これは大規模な酵母画像データで自己教師あり学習により事前学習されたMasked Autoencoderを採用し、それを用いてトランスフォーマーモデルを微調整することで、細胞分裂イベントを直接検出するものです32。このアプローチは、従来の手法と比較して、モデルの微調整に必要な手動アノテーション付き分裂イベントの数を大幅に削減します。刺激的なことに、本プロトコルを用いてすでに生成およびアノテーションされた膨大なデータは、将来的に配偶子の複製寿命解析を自動化し、現在の制限を克服できる同様のアプローチに非常に適しています。さらに、今後の応用として、本プロトコルを確立されたバイオマーカーや高度な発現系と容易に組み合わせることで、S. cerevisiaeの配偶子形成中に細胞の若返りを媒介する分子メカニズムや要因を特定でき、それによってこの保存されたプロセスに関する新たな知見を得ることが可能になります。
開示事項
著者は、競合する利害関係がないことを宣言します。
謝辞
原稿に対する重要な議論とコメントをいただいたBrarおよびÜnal研究室の現員および元メンバーに感謝いたします。本研究は、S.S.へのSwiss National Science Foundation mobility fellowship P500PB_214421によって支援されています。G.A.B.はNational Institutes of Health (R01AG071869)からの資金提供を受けています。T.L.S.は、Norn Group、Hevolution Foundation、およびRosenkranz FoundationからのLongevity Impetus Grantによる支援を受けました。E.Ü.は、National Institutes of Health (R01AG071801)およびAstera Instituteからの資金提供を受けています。
材料
| 名前 | 会社 | カタログ番号 | コメント |
|---|---|---|---|
| 1000 mL 真空ろ過・保存ボトルシステム | Corning | 431098 | 0.22 µm 細孔 54.5 cm<上付き文字クラス="相互参照">2 PESメンブレン、滅菌済み。室温で保存すること。 |
| 20 mL シリンジ | Becton, Dickinson and Company (BD) | 302830 | 20 mL ルアーロックシリンジ。室温で保存すること。 |
| 5 mL シリンジ | Becton, Dickinson and Company (BD) | 14-829-45 | 5mLルアーロックシリンジ、室温で保存。 |
| アンピシリン | Alpha Teknova | A9510 | -に保存してください20 °C 再構成後 水中で。 |
| 抗ビオチン磁気ビーズ | Miltenyi Biotechnology | 130-097-046 | 保存温度 4 °C. |
| β-メルカプトエタノール | MilliporeSigma | M625-250mL | 保存温度 4 °C. |
| BSA | MilliPORE SIGMA | A4503-100G | 保存温度 4 °C. |
| Clay Adams Intramedic ルアースタブアダプター | Becton, Dickinson and Company (BD) | 427565 | 23ゲージ、室温で保存。 |
| キュベット | Bio Rad | 2239955 | セミマイクロボリューム使い捨てポリスチレンキュベット。室温で保存すること。 |
| エタノール | 該当なし | 多様な | |
| EZ-Link Sulfo-NHS-LC-biotin | ThermoFisher Scientific | 21335 | 複製老化のための創始細胞のビオチン標識 |
| Fijiソフトウェア | https://fiji.sc/ | 該当なし | バージョン: Fiji/ImageJ (ImageJ2, V. 2.14.0/1.54m) |
| 蛍光標識ストレプトアビジン | ThermoFisher Scientific | S11225 | Alexa Fluor 546 抱合体、- で保存20 °C 分注して。 |
| 蛍光標識小麦胚芽凝集素 | ThermoFisher Scientific | W11263 | アレクサ Fluor 350 抱合体、-で保存20 °C 分注して。 |
| ホルムアルデヒド | ThermoFisher Scientific | F79-1 | 37%、保存温度 4 °C. |
| 配偶子形成誘導培地 | 該当なし | 標準的なレシピに従い、施設内で調製 | 2% 酢酸カリウム、アミノ酸サプリメント、およびアンピシリン(40 mg/L アデニン、40 mg/L ウラシル、10 mg/L ヒスチジン、10 mg/L ロイシン、および 10 mg/L トリプトファン、 100 μg/mL アンピシリン) |
| グリシン | ThermoFisher Scientific | BP381-1 | 100%、200プルーフ。室温で保存すること。 |
| 中空ステンレス製ピン | iバイオチップ | HSP-100 | 部品番号: 0.28”, OD, 0.016”, ID, 0.500” 長期保存、室温で保管。 |
| 倒立蛍光顕微鏡 | 該当なし | 該当なし | |
| Legato 200 シリンジポンプ | kdScientific | 788200 | 室温で保存してください。 |
| Legato 200/210 プラスチックまたはガラス製 6/10 マルチラック | kdScientific | 788300 | 室温で保存してください。 |
| 光学顕微鏡 | 該当なし | 該当なし | |
| 低吸着チューブ | USA Scientific | 1415-2600 | 室温で保存してください。 |
| LSカラム | Miltenyi Biotechnology | 130-042-401 | 室温で保存してください。 |
| マイクロ流体デバイス | iバイオチップ | ADU-10, (#18++のADチップ) | 室温で保存してください。 |
| 非DEHP医療グレードチューブ | iBiochips | MTB-100 | ID = 0.202”, OD = 0.060”, 壁 = 0.20”、室温で保存する。 |
| リン酸緩衝生理食塩水 | 該当なし | 標準レシピに従い、施設内で調製済み | 以下を1Lずつ調製してください:PBS pH 7、PBS pH 8、PBS pH 8 + 100 mM グリシン PBS pH 7.4 + 0.5% BSA |
| Pluronic F-127 | MilliporeSigma | P2443 | 室温で保存してください。 |
| 分離前フィルター | Miltenyi Biotechnology | 130-041-407 | 細孔径 30 µm |
| QuadroMACSセパレーターおよびスターティングキット | Miltenyi Biotechnology | 130-091-051 | 室温で保存してください。 |
| ステンレス鋼製ソリッドピン | iBiochips | SSP-200 | OD, 0.027”, ID, 0.500”、室温で保存する。 |
| ソニケーター | Branson | 100-132-1623R & 101-135-066R | |
| 分光光度計 | 該当なし | 該当なし | |
| チューブローテーター | 該当なし | 該当なし | |
| Y+A8+2:29+2:31+A8+2+2:33 | Brar-Ü酵母菌株データベース | pÜB42275 | trp1::pPma2-Pma2-eGFP::TRP1, ste5::NatR-pTet07.1-STE5, ura3::pRNR2-TetR-Tup1, pTetO7.1-TetR::URA3, flo8Δ, Amn1D368V |
| 酵母株2 | Brar-Ü酵母株データベース | pÜB48561 | atg11Δ::KanMX, trp1::pPma2-Pma2-eGFP::TRP1, ste5::NatR-pTet07.1-STE5, ura3::pRNR2-TetR-Tup1, pTetO7.1-TetR::URA3, flo8Δ, Amn1D368V |
| YPD(YEP + 2% グルコース、TrpおよびUra添加) | 該当なし | 標準的なレシピに従い、施設内で調製した | YPD(1% 酵母エキス、2% ペプトン、2% グルコース、22.4 mg/L ウラシル、および 80 mg/L トリプトファン)。 |
| Zymolyase 100T | MP Biomedicals | 8320932 | -℃で保存20 °C 水で再構成後、分注して保存する。 |
参考文献
- Denoth Lippuner A, Julou T, Barral Y. Budding yeast as a model organism to study the effects of age. FEMS Microbiol Rev. 2014;38(2):300-25.
- Higuchi-Sanabria R et al. Role of asymmetric cell division in lifespan control in Saccharomyces cerevisiae. FEMS Yeast Res. 2014;14(8):1133-46.
- Hughes AL, Gottschling DE. An early age increase in vacuolar pH limits mitochondrial function and lifespan in yeast. Nature. 2012;492(7428):261-5.
- Nyström T, Liu B. Protein quality control in time and space—links to cellular aging. FEMS Yeast Res. 2014;14(1):40-8.
- Neiman AM. Sporulation in the budding yeast Saccharomyces cerevisiae. Genetics. 2011;189(3):737-65.
- Sing TL, Brar GA, Ünal E. Gametogenesis: exploring an endogenous rejuvenation program to understand cellular aging and quality control. Annu Rev Genet. 2022;56(1):89-112.
- Ünal E, Kinde B, Amon A. Gametogenesis eliminates age-induced cellular damage and resets life span in yeast. Science. 2011;332(6037):1554-7.
- Ünal E, Amon A. Gamete formation resets the aging clock in yeast. Cold Spring Harb Symp Quant Biol. 2011;76:73-80.
- Spiri S et al. A role for selective ER autophagy in gametogenic rejuvenation revealed by high-throughput lifespan profiling. Nat Commun. 2026. doi:10.1038/s41467-026-77993-0.
- Koch BA, Staley E, Jin H, Yu HG. The ESCRT-III complex is required for nuclear pore complex sequestration and regulates gamete replicative lifespan in budding yeast meiosis. Nucleus. 2020;11(1):219-36.
- Lee MB et al. Defining the impact of mutation accumulation on replicative lifespan in yeast using cancer-associated mutator phenotypes. Proc Natl Acad Sci U S A. 2019;116(8):3062-71.
- Mortimer RK, Johnston JR. Life span of individual yeast cells. Nature. 1959;183(4677):1751-2.
- Chen KL, Crane MM, Kaeberlein M. Microfluidic technologies for yeast replicative lifespan studies. Mech Ageing Dev. 2017;161(Pt B):262-9.
- Jin M et al. Divergent aging of isogenic yeast cells revealed through single-cell phenotypic dynamics. Cell Syst. 2019;8(3):242-53.e3.
- Jo MC et al. High-throughput analysis of yeast replicative aging using a microfluidic system. Proc Natl Acad Sci U S A. 2015;112(30):9364-9.
- Li Y et al. A programmable fate decision landscape underlies single-cell aging in yeast. Science. 2020;369(6501):325-9.
- Li Y et al. Multigenerational silencing dynamics control cell aging. Proc Natl Acad Sci U S A. 2017;114(42):11253-8.
- Liu P, Young TZ, Acar M. Yeast Replicator: a high-throughput multiplexed microfluidics platform for automated measurements of single-cell aging. Cell Rep. 2015;13(3):634-44.
- Thayer NH et al. The Yeast Lifespan Machine: a microfluidic platform for automated replicative lifespan measurements. bioRxiv. 2022;2022.02.14.480146.
- Schindelin J et al. Fiji: an open-source platform for biological-image analysis. Nat Methods. 2012;9(7):676-82.
- Spiri S. Fiji macros for microscopy analysis of gametogenic rejuvenation [Internet]. Zenodo; 2026. Available from: [https://doi.org/10.5281/zenodo.22004193](https://doi.org/10.5281/zenodo.22004193)
- Cabib E, Bowers B. Chitin and yeast budding: localization of chitin in yeast bud scars. J Biol Chem. 1971;246(1):152-9.
- Mizushima N, Levine B, Cuervo AM, Klionsky DJ. Autophagy fights disease through cellular self-digestion. Nature. 2008;451(7182):1069-75.
- Rubinsztein DC, Mariño G, Kroemer G. Autophagy and aging. Cell. 2011;146(5):682-95.
- Kobayashi O, Suda H, Ohtani T, Sone H. Molecular cloning and analysis of the dominant flocculation gene FLO8 from Saccharomyces cerevisiae. Mol Gen Genet. 1996;251(6):707-15.
- Fang O et al. Amn1 governs post-mitotic cell separation in Saccharomyces cerevisiae. PLoS Genet. 2018;14(10):e1007691.
- Azizoglu A, Brent R, Rudolf F. A precisely adjustable, variation-suppressed eukaryotic transcriptional controller to enable genetic discovery. eLife. 2021;10:e69549.
- Choi KY, Satterberg B, Lyons DM, Elion EA. Ste5 tethers multiple protein kinases in the MAP kinase cascade required for mating in S. cerevisiae. Cell. 1994;78(3):499-512.
- Bellí G et al. An activator/repressor dual system allows tight tetracycline-regulated gene expression in budding yeast. Nucleic Acids Res. 1998;26(4):942-7.
- Gao Z et al. Comparative analysis of yeast replicative lifespan in different trapping structures using an integrated microfluidic system. Adv Mater Technol. 2020;5(12):2000655.
- Aspert T, Hentsch D, Charvin G. DetecDiv, a generalist deep-learning platform for automated cell division tracking and survival analysis. eLife. 2022;11:e79519.
- Nguyen P et al. BudFinder: a masked auto-encoder vision transformer framework for yeast budding detection and lifespan quantification. PLoS Comput Biol. 2026;22(5):e1013700.
再版と許可
この記事は公開されました
動画は近日公開