E-Coach-based chronic disease management significantly improved the self-management behavior and quality of life compared to usual care for patients receiving maintenance hemodialysis.
研究記事
Effects of E-Coach-Based Chronic Disease Management on Self-Management, Quality of Life, and Mental Health in Maintenance Hemodialysis Patients
* These authors contributed equally
この記事について
サマリー
要約
The study investigated the effects of E-Coach on self-management behavior, quality of life (QoL), and mental health of patients with maintenance hemodialysis (MHD). The study included 96 patients receiving regular MHD, and they were randomly assigned to receive either usual care (a UC group) or usual care plus E-Coach intervention (an E-Coach group). The E-Coach was implemented through a WeChat-based mini-application that provided health education, dietary and exercise guidance, medication reminders, and regular online counseling through text-based materials, videos, and interactive quizzes. After adjustment for baseline score, the self-management behavior score after 6 months remained significantly higher in the E-Coach group than in the UC group (analysis of covariance (ANCOVA): F(1, 93) = 6.3, p = 0.014, partial η2 = 0.06), with a mean difference of +11.6 (95%CI: 9.7 to 13.6; p < 0.001 by Bonferroni correction). The mean self-management behavior score increased from 57.1 to 78.3 points in the E-Coach group, representing a change of +21.2 points, compared with a change of +7.9 points (from 58.6 to 66.5 points) in the UC group. The between-group difference in change was +13.3 (95%CI: 9.9 to 16.5). As for the Kidney Disease Quality of Life-Short Form, the magnitude of score increase from baseline to 6 months was higher in the E-Coach group than the UC group, suggesting an improvement in patients’ QoL. Regarding the Self-Rating Depression Scale (SDS) and Self-Rating Anxiety Scale (SAS), the E-Coach group had a greater magnitude of score reduction from baseline to 6 months compared to the UC group, indicating a reduction in depressive and anxiety symptoms. The E-Coach group exhibited lower levels of potassium and phosphorus after 6 months than the UC group. The study demonstrates the superior effectiveness of E-Coach in enhancing self-management behavior, improving QoL, and alleviating depressive and anxiety symptoms in patients receiving MHD.
概要
Chronic kidney disease (CKD) is an increasingly prevalent disease that affects over 850 million people globally and is projected to become the fifth leading underlying cause of death worldwide by 20501. In China, an estimated 82 million adults were living with CKD in 2018 to 20192. CKD irreversibly and progressively impairs kidney function, eventually leading to kidney failure requiring kidney replacement therapy, including dialysis and kidney transplantation3. Hemodialysis is the most commonly used kidney replacement therapy for patients with end-stage kidney failure, accounting for nearly 89% of all dialysis and 69% of all kidney replacement therapy4. The 5-year survival rate is about 40% after commencement of maintenance hemodialysis (MHD) in the US5. Many patients receiving MHD experience a high burden of symptoms that contribute to significant physical, psychological, and social challenges, negatively affecting their self-management behavior and overall quality of life (QoL)6. The level of self-management among patients receiving MHD was moderate in China and affected by residence, educational level, motivation for fluid intake, and autonomous perception7. Healthcare providers should develop targeted nursing strategies to improve their self-management behavior, thus reducing their complication rates, slowing disease progression, improving QoL, and survival in the short and long term for patients receiving MHD8.
E-Coach, also known as electronic coaching, integrates health coach technology with the internet to create a virtual coaching experience that emulates in-person coaching and breaks the temporal and spatial barriers of conventional medical services9. Healthcare providers have increasingly embraced e-coaching to improve patient-clinician communication about chronic conditions, such as chronic pain, depression, and impaired mobility, due to its accessibility and cost-effectiveness10,11. For older adults (≥ 70 years), the E-Coach could help them to maintain nutrition and physical activity recommendations during rehabilitation12. A recent study has demonstrated that E-Coach-based chronic disease management could effectively improve self-management behavior, alleviate inflammatory response, stabilize blood sugar, and increase the QoL for patients with chronic diabetic retinopathy13. In patients with chronic obstructive pulmonary disease, the E-Coach technology-assisted care transition system was found to be associated with significantly fewer days in the hospital14. Although digital health interventions have increasingly been used to support patients undergoing MHD, existing approaches have primarily focused on isolated components of self-management support, such as healthy lifestyle behaviors15. Different from traditional single offline intervention and simple mobile health reminder mode, the theoretical rationale of the E-Coach intervention may be supported by Social Cognitive Theory, which emphasizes the reciprocal interaction between structural and social factors. In the context of MHD, E-Coach may facilitate individualized education, achieve personalized guidance, realize real-time monitoring and goal setting, and give timely feedback, thereby promoting adherence to recommended self-management behaviors and ultimately improving health-related QoL. Thus, the study explored the effects of E-Coach on patients receiving MHD. The primary outcome was the self-management behavior score, while the secondary outcomes included the patient’s QoL, depression, and anxiety symptoms after a 6-month intervention. The authors hypothesized that, compared with usual care (UC), the E-Coach intervention could significantly improve the self-management behavior, enhance the QoL, alleviate depression and anxiety symptoms after a 6-month intervention for patients receiving MHD.
プロトコル
Participants
This prospective randomized controlled study was conducted in accordance with the principles of the Declaration of Helsinki and was approved by the Ethics Committee of Ningbo Municipal Hospital of Traditional Chinese Medicine, Affiliated Hospital of Zhejiang Chinese Medical University (approval number: 2024-013-01; approval date: February 23, 2024). All participants provided written informed consent. Patients with MHD were consecutively recruited between January 2024 and October 2025. Patients were eligible based on the following inclusion criteria: i) diagnosis of ESRD (an estimated glomerular filtration rate < 15 mL/min/1.73 m2)16; ii) hemodialysis treatment time ≥ 3 months, 3 times/week, 4 h/session; iii) MHD delivered by the same hemodialysis machine (AK98, Gambro, Lund, Sweden); and iv) an age of 18 years or older. The exclusion criteria were: i) concurrent with peritoneal dialysis; ii) mental illness or cognitive impairment; iii); presence of other diseases affecting the QoL, such as cerebrovascular disease, myocardial infarction, or severe infection diseases; iv) patients who cannot take care of themselves; or v) refusal to participate in this study. The digital literacy of participants was assessed before enrollment according to their ability to independently use a smartphone and perform the basic operations required to access and use the E-Coach platform. Participants who were unable to perform these basic procedures independently were also excluded from the study. Eligible participants were randomly assigned to a UC group and an E-Coach group by a computer-generated random-number table. All the materials used in this study are listed in the Table of Materials.
Sample size calculation
According to the following formula, n represents the required sample size for each group, and n1 should equal n2. Assuming a two-sided significance level of (α = 0.05), a statistical power of 80% (1-β = 0.80), and an anticipated effect size of (d = 0.50)17, the required sample size was calculated accordingly. As Uα = 1.98 and Uβ = 1.28, the required sample size for each group is 43. Considering an anticipated 10% dropout, the target sample size was increased to 48 for each group, resulting in a sample size of 96 participants in total.
 (1)
Randomization and masking
Participants were randomly allocated into either the E-coach group or the UC group in a 1:1 ratio via a computer-generated randomization sequence by an independent researcher outside the trial. A total of 96 sequences were prepared. To maintain allocation concealment, each randomization sequence corresponding to one participant was labeled on a separate card and then placed into sequentially numbered, opaque, sealed envelopes by an independent researcher outside the trial. Given the nature of the E-coach intervention, masking to participants and intervention providers was not feasible. Participants were aware of whether they received access to the E-coach platform, and the researcher delivering the E-coach intervention was necessarily aware of participants' group allocation. To minimize the potential risk of detection bias, clinical data extraction, outcome assessments, and data analysis were performed by independent researchers who were masked to participants' group allocation and were not involved in intervention delivery. Group allocation was only revealed after completion of the prespecified analyses.
Usual care interventions
Participants assigned to the UC group received usual care during the 6-month intervention period, including a weekly health education manual, individualized guidance, and monthly follow-up during dialysis days. At the beginning of the intervention, participants received a standardized health education manual that covered hemodialysis knowledge, vascular access maintenance, dietary and fluid management, exercise, prevention of common complications, and medication-related knowledge. Nurses introduced the main contents of the manual at the time of distribution and encouraged participants to review the relevant sections as needed. Distribution of the manual and completion of the initial education were documented in the study records. Participants received individualized face-to-face guidance once per week during their scheduled dialysis session. The guidance was provided by a hemodialysis specialist nurse and focused on patients' current treatment and self-management needs, including hemodialysis-related knowledge, vascular access maintenance, dietary and fluid management, appropriate physical activity, prevention of dialysis-related complications, and medication management. The duration of each face-to-face guidance was approximately 10–15 min based on the patient's needs. The main topics discussed and the guidance provided were documented in the nursing record. Participants received face-to-face follow-up once per month during their scheduled dialysis day. Follow-up was conducted by the hemodialysis specialist nurse and lasted approximately 15–20 min. During each follow-up visit, the nurse reviewed the participant's medication use, dietary and fluid management, vascular access care, physical activity, recent dialysis-related problems, and occurrence of complications, and provided routine guidance when necessary. The date of follow-up, major problems identified, health education provided, and any additional recommendations were documented in the follow-up record.
E-Coach intervention
Participants assigned to the E-Coach group received the usual care, the same as participants in the UC group, and the 6-month E-Coach intervention. The E-Coach approach was implemented through a digital health platform delivered by a multidisciplinary E-Coach team comprising a hemodialysis specialist nurse, nephrologist, nutritionist, rehabilitation therapist, psychiatrist, and IT engineer. The hemodialysis specialist nurse served as the primary coordinator, reviewed participants’ daily platform records and self-reported health information, provided routine health education and medication-related guidance, and identified findings requiring further assessment. The nephrologist was responsible for evaluating and managing clinically significant abnormalities related to hemodialysis, dialysis-related complications, or other medical conditions. The nutritionist provided individualized dietary and fluid-intake recommendations, particularly when participants reported difficulties with dietary adherence or abnormal nutritional-related findings. The rehabilitation therapist provided individualized advice regarding physical activity and exercise safety. The psychiatrist provided psychological assessment and counseling for participants with clinically relevant psychological concerns. The IT engineer was responsible for technical support, platform maintenance, and monitoring of platform-related problems rather than clinical decision-making. This platform was a WeChat-based mini-application and was finally released in December 2023. Participants were given an individual account and provided with an initial introduction to the platform functions and instructions for use. During the 6-month intervention period, participants were instructed to use the platform for at least 30 min each day. Daily platform usage (30 min/d) was reviewed by the research team throughout the intervention period, and participants with insufficient use were reminded to complete the recommended daily online-use time. Daily activities included reviewing hemodialysis-related health education materials and completing interactive quizzes designed to reinforce the educational content. Educational materials were delivered in the form of text, videos, and interactive learning activities and covered medication management, hemodialysis-related knowledge, dietary management, physical activity, psychological well-being, and daily self-management. Each daily quiz consisted of 6 scenario-based questions covering hemodialysis knowledge, self-management, medication management, dietary and fluid management, physical activity, and psychological well-being. After submitting each answer, participants received immediate feedback indicating whether the response was correct, together with a brief explanation of the relevant health-management principle. Quiz completion was automatically recorded by the platform. Participants' quiz performance was indicative of participants' clinical conditions, treatment requirements, dietary and exercise needs, psychological concerns, and self-management difficulties, which were mainly used to guide individualized health education and coaching. Medication reminders and health-related prompts were delivered through the platform to support daily self-management. The online-use time and activity records of each participant in the platform were continuously monitored by the platform. Participants were encouraged to maintain regular platform use throughout the 6-month intervention period. Online counseling was provided twice per week through the platform and conducted by the E-Coach team members according to participants' quiz performance as well as the participants' specific needs, including nursing, nephrology, nutritional, rehabilitation, or psychological concerns. Abnormal findings identified through participant self-reports, daily records, or online consultations were initially reviewed by the hemodialysis specialist nurse. Findings that could be managed through routine education or behavioral guidance were addressed directly by the nurse. Findings requiring professional assessment were referred to the appropriate team member according to the predefined responsibilities described above. Clinically significant or potentially urgent medical problems were escalated to the nephrologist for further evaluation and management, and participants were advised to seek immediate in-person medical care when necessary. All referrals, consultations, recommendations, and follow-up actions were documented in the E-Coach platform. Adherence to the E-Coach intervention was assessed using the platform-generated records, involving daily platform engagement adherence, quiz adherence, and counseling adherence. Daily platform engagement adherence was assessed by daily platform engagement time and percentage of days meeting the≥30 min/day requirement. Quiz adherence was assessed by the number of quizzes completed, the quiz completion rate, and the correct-response rate. Counseling adherence was assessed by the number of scheduled counseling sessions and counseling sessions attended.
Outcome measures
The primary outcome measure was self-management behavior after a 6-month intervention. The secondary outcome measures were QoL, depressive, and anxiety symptoms after 6-month intervention. Other outcome measures included patients’ levels of serum creatinine (Cr), blood urea nitrogen (BUN), hemoglobin (Hb), albumin (ALB), potassium (K+), and phosphorus (P) after a 6-month intervention.
Self-management behavior scale
The self-management behavior scale taps 4 dimensions, which were designed by Haichuan Dou et al.: diet and fluid intake, physical activity, psychosocial behavior, and therapeutic behavior. This scale has 27 items in total. Each item uses a 4-point rating scale (1 = “never”, 2 = “infrequently”, 3 = “often”, and 4 = “always”). No items require reverse scoring. The total score is the simple sum of all raw item scores. Higher scores suggest better self-management behavior.
Chinese version of the Kidney Disease Quality of Life-Short Form (KDQOL-SF). The Chinese version of KDQOL-SF 1.3 was employed to reflect patients’ QoL. Previous psychometric evaluation of the Chinese version in patients with end-stage renal disease demonstrated satisfactory internal consistency for most domains, with Cronbach's α coefficients ranging from 0.78 to 0.9818. According to the RAND Health Surveys (RAND Corporation, Santa Monica, CA, USA) use policy and the KDQOL-S 1.3 User’s Manual, the instrument may be used for non-commercial purposes without a separate written permission or licensing agreement. The KDQOL-SF consists of a kidney disease targeted area (KDTA) and a general SF-36 assessment. The KDTA part includes a symptoms/discomfort list (SPL), effects of kidney disease (EKD), burden of kidney disease (BKD), work status (WS), cognitive function (CF), quality of social interaction (QSI), sexual function (SeF), sleep, social support (SoS), dialysis staff encouragement (DSE), and patient satisfaction (PS). The general SF-36 part includes physical functioning (PF), role physical (RP), bodily pain (BP), general health (GH), vitality (VT), social functioning (SF), role emotional (RE), and mental health (MH). Each field was scored from 0 (minimum) to 100 points (maximum). Higher scores suggest better QoL.
Zung's Self-Rating Depression Scale (SDS) and Self-Rating Anxiety Scale (SAS). The Chinese versions of Zung's SDS and SAS were used to assess patients’ subjective feelings regarding depressive and anxiety symptoms within the past week19. Both have 20 items, in which items tap psychological and physiological symptoms and are rated from 1 to 4 (never or very infrequently to most or all of the time. Both scales have raw total scores ranging from 20 to 80. After converting, the standardized total score ranged from 25 to 100. A standardized SDS/SAS score of ≥ 50 was considered indicative of clinically relevant depressive/anxiety symptoms. A higher score suggests more severe depressive and anxiety symptoms.
Routine-care laboratory data
Blood samples were collected during routine clinical care and analyzed in the hospital’s central laboratory using standardized laboratory procedures. Serum Cr and BUN levels were measured using routine automated biochemical assays. The levels of serum ALB, K+, and P were measured using standard automated biochemical methods, while the Hb was determined using an automated hematology analyzer. All laboratory measurements were performed according to the manufacturer’s instructions and the hospital laboratory’s standard operating procedures.
Statistical analysis
Continuous variables conforming to normal distribution, confirmed by the Shapiro-Wilk test, were described as mean ± standard deviation, with an independent t-test performed for two-group differences. Counting data are described as numbers with percentages (%) and analyzed by using the chi-squared test. The scores of the self-management behavior scale, KDQOL-SF, SAS, and SDS after 6-month intervention were analyzed by using analysis of covariance (ANCOVA), controlling for corresponding baseline scores, followed by multiple comparisons (Bonferroni correction). The assumptions of ANCOVA, including linearity, normality of residuals, homogeneity of regression slopes, and homoscedasticity, were assessed as appropriate. Mean difference (MD) with 95% confidence interval (95%CI), partial η2 indicating the effect size, and corresponding p values were reported. The intention-to-treat (ITT) principle was applied in this study, and the full analysis set (FAS) included all randomized patients who provided the baseline evaluations. Multiple imputation was performed to handle missing outcome measurements during follow-up. Baseline patient characteristics and available outcome measurements at all time points were included in the imputation model, and 5 imputed datasets were generated. Each imputed dataset was analyzed using the prespecified statistical methods, and the resulting estimates were pooled using Rubin’s rules. Considering four outcomes were assessed, the risk of inflation of the family-wise type I error rate was considered due to multiple testing. The Holm-Bonferroni procedure was used to adjust the p-values across the four prespecified outcomes. All data were entered into IBM SPSS Statistics 27.0 for Windows for statistical analyses, and a significant difference was indicated by a p-value of < 0.05 (two-tailed).
結果
Baseline characteristics of participants
During the study period, among 100 screened patients, 4 refused to participate in the study. Finally, 96 eligible participants consented to the study and underwent randomization (48 patients receiving usual care and 48 receiving usual care plus E-Coach-based chronic disease management). Of these, 96 completed the baseline evaluations and received the intervention, while 5 participants (2 in the E-Coach group and 3 in the UC group) were relocated and lost to contact for follow-up. According to the ITT principle, the FAS included 48 in the E-Coach group and 48 in the UC group (Figure 1). Two groups showed no significant difference regarding age, sex, educational level, marital status, and monthly per capita family income (Table 1, p > 0.05).
Adherence to the E-Coach intervention
All 46 participants assigned to the E-Coach group accessed the intervention platform during the 6-month intervention period. The mean daily platform-use time was 37.2 ± 7.0 min/d. There were 86.7% (39/45) of participants who met the predefined requirement of at least 30 min/d. The completion rates for interactive quizzes and scheduled online consultations were 89.0% ± 5.0% and 88.0% ± 6.0%, respectively.
Comparison of self-management behavior between the E-Coach and UC groups
After adjustment for baseline score in the FAS, the self-management behavior score after 6 months remained significantly higher in the E-Coach group than in the UC group (ANCOVA: F(1, 93) = 6.3, p = 0.014, partial η2 = 0.06), with mean difference (MD) of +11.6 (95%CI: 9.7 to 13.6; p < 0.001 by Bonferroni correction) (Figure 2). The mean self-management behavior score increased from 57.1 to 78.3 points in the E-Coach group, representing a change of +21.2 (95%CI: 18.7 to 23.7), compared with a change of +7.9 (95%CI: 5.4 to 10.4) (from 58.6 to 66.5 points) in the UC group. The between-group difference in change was +13.3 (95%CI: 9.9 to 16.5). These data suggest that the E-Coach intervention could improve the self-management behavior of patients receiving MHD.
Comparison of QoL between E-Coach and UC groups
When controlling for baseline score in the FAS, compared with the UC group, the E-Coach group exhibited significantly higher scores in the following fields of the KDTA-SF after 6 months: BKD [MD: +31.9 (95%CI: 25.4 to 38.7); ANCOVA: F(1, 93) = 5.3, p = 0.024, partial η2 = 0.05], QSI [MD: +9.1 (95%CI: 4.9 to 14.6); ANCOVA: F(1, 93) = 6.6, p = 0.022, partial η2 = 0.06], SoS [MD: +19.6 (95%CI: 13.1 to 26.7); ANCOVA: F(1, 93) = 4.9, p = 0.029, partial η2 = 0.05], DSE [MD: +8.6 (95%CI: 0.6 to 16.6); ANCOVA: F(1, 93) = 4.6, p = 0.034, partial η2 = 0.05] and PS [MD: +14.5 (95%CI: 7.6 to 20.1); ANCOVA: F(1, 93) = 5.8, p = 0.017, partial η2 = 0.06], SF [MD: +14.1 (95%CI: 5.4 to 22.8); ANCOVA: F(1, 93) = 4.4, p = 0.038, partial η2 = 0.05], RE [MD: +14.0 (95%CI: 7.7 to 19.7); ANCOVA: F(1, 93) = 6.9, p = 0.010, partial η2 = 0.07] and MH [MD: +23.0 (17.8 to 29.4); ANCOVA: F(1, 93) = 5.1, p = 0.026, partial η2 = 0.05]. The MD of these scores after 6 months between the two groups was statistically significant (p < 0.001 by Bonferroni correction). The score change from baseline to 6 months in the two groups and the between-group difference in change of these fields are presented in Table 2. These data suggest that the E-Coach intervention could enhance the QoL of patients receiving MHD. The scores of other fields of the KDTA-SF are listed in Supplementary Table 1.
Comparison of mental health between the E-Coach and UC groups
After controlling baseline score in the FAS, the E-Coach group scored lower on the SDS scale after 6 months in the E-Coach group than in the UC group (ANCOVA: F(1, 93) = 4.6, p = 0.033, partial η2 = 0.05), with a mean difference of -12.0 (95%CI: -17.3 to -10.5; p < 0.001 by Bonferroni correction) (Figure 3A). The mean SDS score decreased from 58.5 to 41.9 points, with a change of -16.6 (95%CI: -18.5 to -14.8), in the E-Coach group, and from 56.6 to 53.9 points, with a change of -2.7 (95%CI: -5.4 to 0.3), in the UC group. The between-group difference in change was -13.9 (95%CI: -17.3 to -10.5). After controlling for baseline score in the FAS, the E-Coach group had a lower SAS score after 6 months than the UC group. after 6 months in the E-Coach group than in the UC group (ANCOVA: F(1, 93) = 4.5, p = 0.037, partial η2 = 0.05), with a mean difference of -10.6 (95%CI: -12.7 to -8.6; p < 0.001 by Bonferroni correction) (Figure 3B). The mean SAS score decreased from 59.7 to 41.7 points, with a change of -18.0 (95%CI: -20.9 to -15.1), in the E-Coach group, and from 58.9 to 52.2 points, with a change of -6.7 (95%CI: -9.6 to -3.8), in the UC group. The between-group difference in change was -11.3 (95%CI: -14.3 to -8.2). These data suggest that the E-Coach intervention could alleviate depression and anxiety symptoms of patients receiving MHD.
Comparison of routine-care laboratory data between E-Coach and UC groups
After controlling baseline data in the FAS, the E-Coach group exhibited a lower level of K+ after 6 months than the UC group (ANCOVA: F(1, 93) = 4.8, p = 0.030, partial η2 = 0.05), with a mean difference of -0.21 (95%CI: -0.25 to -0.15; p < 0.001 by Bonferroni correction). The mean K+ level decreased from 4.01 to 3.81 mmol/L, with a change of -0.20 (95%CI: -0.26 to -0.14), in the E-Coach group, and from 4.05 to 4.02 mmol/L, with a change of -0.03 (95%CI: -0.09 to 0.03), in the UC group. The between-group difference in change was -0.17 (95%CI: -0.23 to -0.10). After controlling baseline data in the FAS, the E-Coach group exhibited a lower level of P after 6 months than the UC group (ANCOVA: F(1, 93) = 4.2, p = 0.043, partial η2 = 0.04), with a mean difference of -0.16 (95%CI: -0.20 to -0.10; p < 0.001 by Bonferroni correction). The mean P level decreased from 2.07 to 1.85 mmol/L, with a change of -0.22 (95%CI: -0.26 to -0.14), in the E-Coach group, and from 2.05 to 2.01 mmol/L, with a change of -0.04 (95%CI: -0.09 to 0.01), in the UC group. The between-group difference in change was -0.18 (95%CI: -0.24 to -0.11). The levels of serum Cr, BUN, ALB, and Hb did not significantly differ between the two groups 6 months after the intervention (p > 0.05). The levels of serum Cr, BUN, ALB, Hb, K+, and P at baseline and at 6 months after intervention between the E-Coach and UC groups are listed in Table 3. These data suggest that the E-Coach intervention may improve metabolic control in patients receiving MHD. The raw data for all results are presented in Supplementary Table 2.
DATA AVAILABILITY:
All raw data supporting the findings of this study are presented in Supplementary Table 2, including de-identified participant-level data for the primary and secondary outcomes and the numerical data underlying the tables and figures presented in the manuscript.
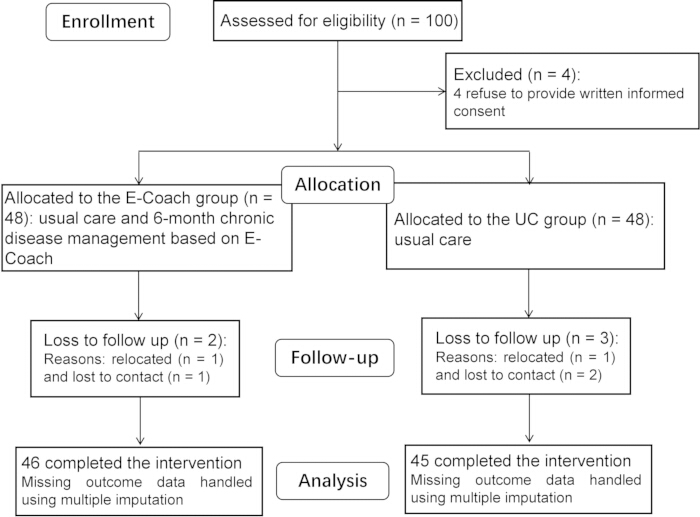
Figure 1: Flow diagram of participant recruitment, eligibility assessment, randomization, and follow-up. The flow diagram illustrates the screening and enrollment of eligible participants, randomization to the E-Coach group or UC group, and completion of the 6-month follow-up. The numbers of participants assessed for eligibility, excluded before randomization, randomized to each group, and included in the final analysis are shown. Five participants were lost to follow-up during the 6-month intervention period, and the reasons for loss to follow-up are indicated. Multiple imputation was performed to handle missing outcome measurements during follow-up. UC, usual care. Please click here to view a larger version of this figure.
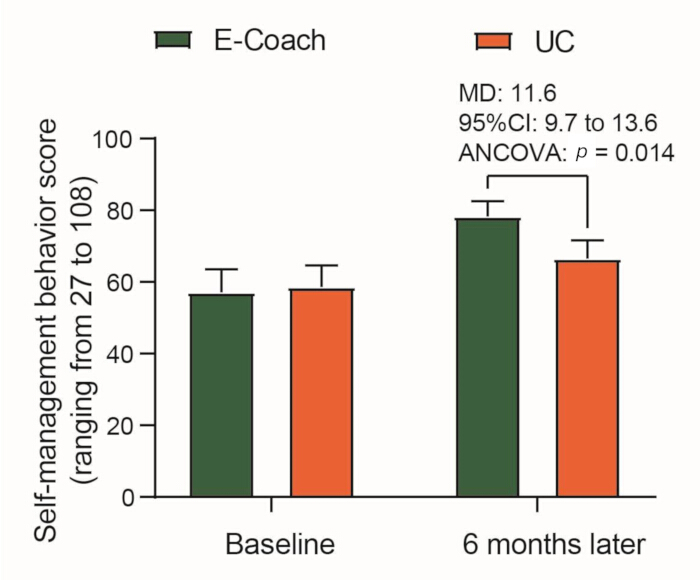
Figure 2: Self-management behavior scores at baseline and at 6 months after intervention between the E-Coach and UC groups. The bars show the self-management behavior scores from baseline to 6 months after the intervention in the E-Coach and UC groups. After adjustment for baseline score, the self-management behavior score after 6 months remained significantly higher in the E-Coach group than in the UC group. Data are presented as mean ± standard deviation. Error bars represent the standard deviation. UC, usual care; MD: mean difference; CI: confidence interval; ANCOVA: analysis of covariance. Please click here to view a larger version of this figure.
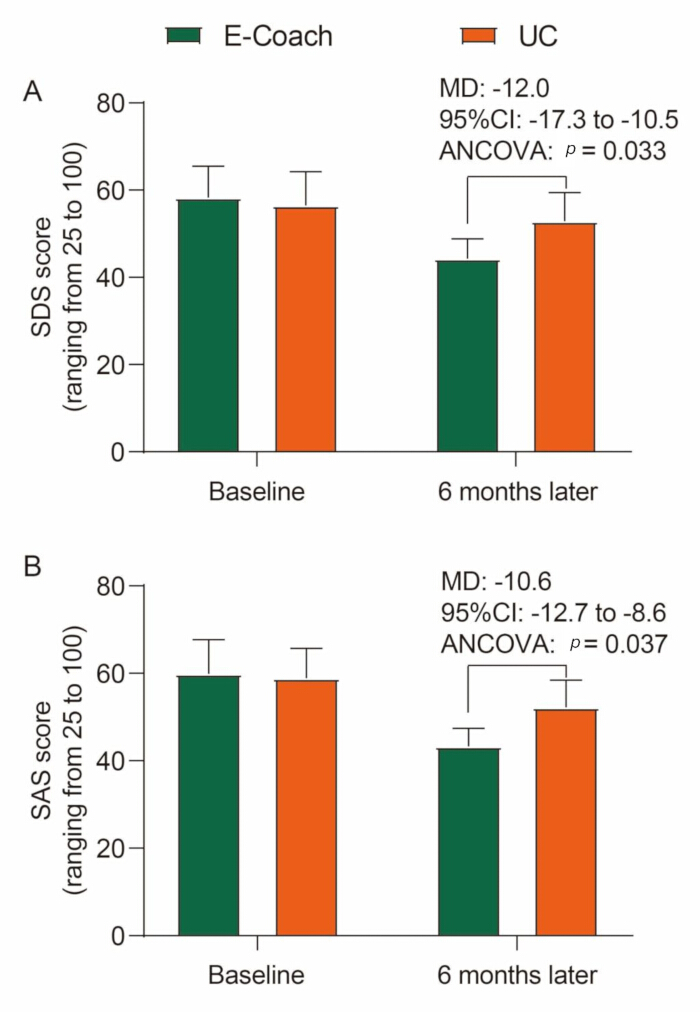
Figure 3: SDS and SAS scores at baseline and at 6 months after intervention between the E-Coach and UC groups. The bars show the SDS (A) and SAS (B) scores from baseline to 6 months after the intervention in the E-Coach and UC groups. After adjustment for baseline score, the SDS and SAS scores after 6 months were significantly lower in the E-Coach group than in the UC group. Data are presented as mean ± standard deviation. Error bars represent the standard deviation. A, SDS score. B, SAS score. UC, usual care; SDS, Self-Rating Depression Scale; SAS, Self-Rating Anxiety Scale; MD: mean difference; CI: confidence interval; ANCOVA: analysis of covariance. Please click here to view a larger version of this figure.
| Characteristic | E-Coach (n = 48) | UC (n = 48) | p |
| Age, year (mean ± s.d.) | 54.5 ± 10.0 | 56.2 ± 7.8 | 0.359 |
| Sex, n (%) | 0.682 | ||
| Male | 25 (52.1%) | 27 (56.3%) | |
| Female | 23 (47.9%) | 21 (43.7%) | |
| Educational level, n (%) | 0.597 | ||
| Junior high school and below | 24 (50.0%) | 28 (58.3%) | |
| High school and technical secondary school | 16 (33.3%) | 15 (31.3%) | |
| College or above | 8 (16.7%) | 5 (10.4%) | |
| Marital status, n (%) | 0.603 | ||
| Married | 40 (83.3%) | 36 (75.0%) | |
| Single, divorced, or separated | 6 (12.5%) | 9 (18.8%) | |
| Widowed | 2 (4.2%) | 3 (6.2%) | |
| Monthly per capita family income (yuan), n (%) | 0.735 | ||
| < 1000 | 6 (12.5%) | 5 (10.4%) | |
| 1000–3000 | 17 (35.4%) | 20 (41.7%) | |
| 3000–5000 | 13 (27.1%) | 15 (31.2%) | |
| > 5000 | 12 (25.0%) | 8 (16.7%) |
Table 1: Baseline characteristics of participants. Data described as mean ± standard deviation were analyzed by the independent t-test. Data described as numbers with percentages (%) were analyzed by the chi-squared test. Abbreviations: UC = usual care.
| KDTA-SF field | E-Coach (n = 48) | UC (n = 48) | Between-group difference in change |
| KDTA | |||
| BKD | |||
| Baseline | 29.2 ± 12.7 | 31.0 ± 12.5 | |
| 6 months later | 62.7 ± 17.5 | 30.8 ± 15.3 | |
| MD (95%CI) | 33.5 (26.8 to 40.2) | -0.2 (-6.9 to 6.5) | 33.6 (25.6 to 41.6) |
| QSI | |||
| Baseline | 64.5 ± 14.9 | 67.0 ± 16.4 | |
| 6 months later | 79.1 ± 11.2 | 70.0 ± 14.8 | |
| MD (95%CI) | 14.6 (7.9 to 21.3) | 3.0 (-3.6 to 9.6) | 11.6 (4.6 to 18.3 ) |
| SoS | |||
| Baseline | 56.6 ± 19.4 | 53.7 ± 17.9 | |
| 6 months later | 76.6 ± 14.7 | 57.0 ± 18.5 | |
| MD (95%CI) | 20.0 (11.8 to 28.1) | 3.3 (-4.8 to 11.4) | 16.7 (5.9 to 27.4) |
| DSE | |||
| Baseline | 76.4 ± 17.5 | 80.0 ± 15.8 | |
| 6 months later | 89.1 ± 19.2 | 80.5 ± 21.1 | |
| MD (95%CI) | 12.7 (4.2 to 21.2) | 0.5 (-8.0 to 9.0) | 12.2 (1.7 to 22.5) |
| PS | |||
| Baseline | 52.8 ± 12.7 | 55.0 ± 12.9 | |
| 6 months later | 71.8 ± 17.7 | 57.3 ± 13.7 | |
| MD (95%CI) | 19.0 (12.4 to 25.6) | 2.3 (-4.3 to 8.9) | 16.7 (7.5 to 25.7) |
| SF-36 | |||
| SF | |||
| Baseline | 63.0 ± 16.9 | 63.1 ± 18.9 | |
| 6 months later | 81.1 ± 21.8 | 67.0 ± 23.6 | |
| MD (95%CI) | 18.1 (8.7 to 27.5) | 3.9 (-5.5 to 13.3) | 14.2 (3.4 to 24.8) |
| RE | |||
| Baseline | 47.6 ± 17.0 | 44.4 ± 15.5 | |
| 6 months later | 60.3 ± 13.2 | 46.3 ± 16.2 | |
| MD (95%CI) | 12.7 (5.5 to 19.8) | 1.9 (-5.2 to 9.0) | 10.8 (2.3 to 19.3) |
| MH | |||
| Baseline | 53.9 ± 14.6 | 52.7 ± 15.3 | |
| 6 months later | 79.1 ± 14.0 | 56.1 ± 14.5 | |
| MD (95%CI) | 25.2 (18.5 to 31.9) | 3.4 (-3.3 to 10.1) | 21.8 (14.9 to 30.3) |
Table 2: The scores of KDTA-SF fields at baseline and at 6 months after intervention between the E-Coach and UC groups. Abbreviations: UC = usual care; MD = mean difference; CI = confidence interval; KDTA = kidney disease targeted area; BKD = burden of kidney disease; QSI = quality of social interaction; SoS = social support; DSE = dialysis staff encouragement; PS = patient satisfaction; SF-36 = Short Form-36; SF = social functioning; RE = role emotional; MH = mental health.
| Parameter | E-Coach (n = 48) | UC (n = 48) |
| Cr (μmol/L) | ||
| Baseline | 967.4 ± 108.3 | 976.7 ± 96.0 |
| 6 months later | 923.2 ± 107.5 | 948.5 ± 98.1 |
| MD (95%CI) | -44.2 (-91.4 to 3.0) | -28.2 (-75.4 to 19.0) |
| BUN (mmol/L) | ||
| Baseline | 23.51 ± 3.03 | 23.24 ± 2.80 |
| 6 months later | 22.82 ± 2.79 | 23.17 ± 2.42 |
| MD (95%CI) | -0.71 (-1.98 to 0.56) | -0.07 (-1.34 to 1.20) |
| ALB (g/L) | ||
| Baseline | 34.33 ± 1.82 | 34.57 ± 1.89 |
| 6 months later | 34.75 ± 1.66 | 34.53 ± 2.15 |
| MD (95%CI) | 0.42 (-0.45 to 1.29) | -0.04 (-0.91 to 0.83) |
| Hb (g/L) | ||
| Baseline | 104.50 ± 5.10 | 105.00 ± 5.05 |
| 6 months later | 108.2 ± 6.43 | 106.4 ± 5.46 |
| MD (95%CI) | 3.7 (1.15 to 6.25) | 1.4 (-1.15 to 3.95) |
| K+ (mmol/L) | ||
| Baseline | 4.01 ± 0.14 | 4.05 ± 0.12 |
| 6 months later | 3.81 ± 0.12 | 4.02 ± 0.14 |
| MD (95%CI) | -0.20 (-0.26 to -0.14) | -0.03 (-0.09 to 0.03) |
| P (mmol/L) | ||
| Baseline | 2.07 ± 0.11 | 2.05 ± 0.12 |
| 6 months later | 1.85 ± 0.12 | 2.01 ± 0.12 |
| MD (95%CI) | -0.22 (-0.26 to -0.14) | -0.04 (-0.09 to 0.01) |
Table 3: The levels of serum Cr, BUN, ALB, Hb, K+, and P at baseline and at 6 months after intervention between the E-Coach and UC groups. Abbreviations: UC = usual care; MD = mean difference; CI = confidence interval; Cr = creatinine; BUN = blood urea nitrogen; Hb = hemoglobin; ALB = albumin; K+ = potassium; P = phosphorus.
Supplementary Table 1: The scores of KDTA-SF fields at baseline and at 6 months after intervention between the E-Coach and UC groups. Abbreviations: UC = usual care; MD = mean difference; CI = confidence interval; KDTA = kidney disease targeted area; SPL = symptoms/discomfort list; EKD = effects of kidney disease; WS = work status; CF = cognitive function; SeF = sexual function; SoS = social support; SF-36 = Short Form-36; PF = physical functioning; RP = role physical; BP = bodily pain; VT = vitality; GH = general health.Please click here to download this file.
Supplementary Table 2: Raw data. The raw data for all results.Please click here to download this file.
ディスカッション
In this study, the implementation of the E-coach approach for patients receiving MHD conferred benefits, including improving self-management behavior, enhancing QoL, and alleviating depressive and anxiety symptoms. The self-management level of MHD patients is influenced mainly by educational background, dialysis-related knowledge, and psychological health20. Tailored interventions addressing both knowledge and emotional support to enhance self-management behavior are recommended to improve patient outcomes in this population21. The internet is widely applied in clinical care pathways for chronic diseases and can provide real-time monitoring and tracking, disease knowledge communications, telemedicine services, intelligent consultation, and online therapy consultation services22. The enhancement of self-management behavior is likely considered a benefit from the implementation of the E-coach approach in the management of patients receiving MHD23. MHD patients are confronted with strict hemodialysis regimens involving restriction of fluid and diet intake, multiple medications, vascular access care, and frequent and effective counseling24. E-Coach systematically enhances self‑management through personalized goal-setting, incremental task progression, and real-time feedback to promote an individual’s confidence in executing specific health-related behaviors14. The E-Coach could help MHD patients to obtain disease management experiences, including proper dietary choices, gain confidence from success stories of peers, receive continuous motivational messaging, and receive tailored encouragement from the E-Coach team simply using a mobile device25. This multifaceted construction of self- management plausibly explains the evident enhancement in self-management behaviors. In addition to a higher score of self-management behavior, lower levels of K+ and P in the E-coach group than the UC group indicated benefits from improved self-management behavior conferred by the E-coach approach.
Parallel to self-management, MHD patients perceived more social support due to the digital reconfiguration of social support via the E-Coach. Social support plays a significant mediating role in improving the physical and mental well-being of patients undergoing MHD, thus enhancing patients’ QoL26. Besides, social support directly affects the self-management behavior of MHD patients and indirectly affects it by increasing internality while reducing helplessness27. E Coach appears to reconstruct social support networks through digital clinician-patient communication and more effective home-based involvement in daily care28,29. As shown by the results, according to the KDQOL-SF scale, improvements in patients’ QoL focused on disease burden, social support, functioning, and mental health after a 6-month E-Coach intervention. MHD patients were given daily reminders for medication, health education promotion, diet and exercise advice, and regular online counseling through the E-Coach team for symptom assessment and management. One of the significant advantages of the E-Coach is its accessibility, and the E-Coach could help improve communication, coordination, and information sharing between clinicians and patients during transition periods via a telehealth manner30. Through the E-Coach, clinicians could focus on acknowledging, prioritizing, and responding to symptoms that are most important to precision prevention31. Healthcare professionals emphasized the vital role of social and family resources in providing appropriate support and interventions for MHD patients to promote psychological resilience and mental health development. Given the well-established positive association between social support and self-management behavior in chronic diseases, the E-Coach converts support from an occasional, relationship-dependent resource into a systematic, sustainable, and extendable digital resource32. Beyond self-management ability and social support, the QoL of patients receiving MHD is affected by broader social and structural determinants, such as travel burden, caregiver availability, and access to digital infrastructure33. Therefore, the effectiveness of E-Coach should not be interpreted solely as a consequence of the intervention itself but rather as an interaction between the digital intervention and the surrounding healthcare and social environment. Patients with insufficient digital literacy or inadequate social support may find it difficult to engage with digital health programs. Future studies should take these contextual factors into consideration when implementing and assessing the E-Coach intervention and develop strategies to improve E-Coach’s accessibility among diverse hemodialysis populations. Consistent with this study, Yao et al.13 found an improvement in patients’ QoL after 6- and 12-month intervention of internet-based E-Coach in patients with chronic diabetic retinopathy. The clinical relevance of changes in QoL was considered in addition to statistical significance. Because established minimally clinically important differences (MCIDs) are not consistently available for all KDQOL-SF domains in patients receiving MHD, statistical significance was not interpreted as evidence of clinical meaningfulness by itself. The magnitude and 95%CIs of the observed between-group differences were therefore considered when interpreting the findings.
MHD patients are prone to experience depression and anxiety symptoms due to disease burden, which also negatively affects their self-management capabilities and overall QoL34,35. The psychological adjustment of MHD patients is a dynamic process characterized by accepting their health status, reshaping personal values, and reconstructing social roles, in which perceived social support plays an important role36. The E-Coach, as a scalable digital approach, could integrate online counseling into routine MHD management to prevent depression and anxiety symptoms37. As shown in the results, the E-Coach group scored lower on the SDS and SAS scales, indicating their improvements in depression and anxiety symptoms after the E-Coach intervention. Although statistically significant improvements were observed, whether these changes reached a clinically meaningful threshold remains uncertain, as validated MCIDs for these outcomes in the present population are not well established.
Several limitations warrant consideration in this study. First, the outcomes were based on patients’ self-reported measures, which may be subject to recall and reporting bias. Additionally, this study did not include clinical endpoints to confirm sustained clinical benefits. Second, masking of participants and intervention deliverers was not feasible due to the nature of the E-coach intervention, which may lead to performance or expectation bias. Third, participants with poor digital literacy were excluded from the study, which may limit the generalizability of these findings to those who have difficulty accessing or using digital health technologies. Fourth, the self-management behavior scale applied in this study is a Chinese clinical assessment tool routinely used in patients undergoing MHD, but a clearly documented original development and comprehensive psychometric validation study for the exact version used in the institution was not available. Although the scale demonstrated acceptable internal consistency in the present study, as indicated by the Cronbach’s α coefficient, internal consistency alone does not establish other aspects of measurement validity. Thus, the findings related to self-management behavior should be interpreted with caution. Fifth, the single-center design and relatively small sample size also constrain the generalizability of the results. Besides, 5 participants were lost to follow-up during the 6-month intervention period, resulting in missing outcome data. Although multiple imputation was used to address the missing data and reduce potential bias associated with attrition, the validity of the imputed values depends on assumptions regarding the underlying missing-data mechanism. Future studies should consider incorporating more objective outcome measures, performing masked outcome assessment where feasible, and evaluating strategies to improve accessibility for patients with limited digital literacy in multicenter randomized controlled trials involving patients from diverse dialysis centers and healthcare settings. Moreover, the psychometric properties of the self-management behavior scale applied in this study should be further evaluated in larger and independent Chinese MHD populations. Importantly, future investigations should incorporate clinical endpoints, such as kidney function parameters, interdialytic weight gain, fluid-related complications, emergency department visits, hospitalization, treatment adherence, and healthcare utilization, rather than patient-reported outcomes. If the effectiveness, sustainability, and generalizability of the E-Coach platform are confirmed, this platform could be integrated into routine care in hemodialysis centers and extended to hospital-to-home transitional care and further remote management for patients receiving MHD. Such an approach may facilitate continuous monitoring, individualized health education, and self-management support beyond the dialysis unit.
In conclusion, this study developed an E-Coach care for patients receiving MHD and demonstrated improvements in self-management behavior, QoL, and mental health in patients receiving MHD. Clinically, the E-Coach could be incorporated into routine multidisciplinary care for patients undergoing MHD. Dialysis nurses may play a central role in implementation by introducing the platform, reviewing engagement and self-management information, and providing individualized feedback. The E-Coach could be integrated into routine dialysis workflows, for example, by briefly reviewing patients’ platform-generated information during scheduled dialysis visits and using these data to identify patients who require additional health education or support.
開示事項
The authors declare no conflicts of interest.
謝辞
The study was supported by the Ningbo Health Science and Technology Plan Project in 2023 (Grant No. 2023Y30) and the Ningbo Clinical Research Center for Traditional Chinese Medicine Nephrology (Grant No. 2024L001).
材料
| 名前 | 会社 | カタログ番号 | コメント |
|---|---|---|---|
| E-Coach chronic disease management platform | In-house developed | N/A | Mobile-based platform delivering hemodialysis knowledge, daily medication reminders, diet/exercise advice, and online counseling by a multidisciplinary team |
| Ethical approval | Ningbo Municipal Hospital of Traditional Chinese Medicine, Affiliated Hospital of Zhejiang Chinese Medical University | 2024-013-01 | This prospective randomized controlled study was conducted in accordance with the principles of the Declaration of Helsinki and was approved by the Ethics Committee of Ningbo Municipal Hospital of Traditional Chinese Medicine, Affiliated Hospital of Zhejiang Chinese Medical University (approval number: 2024-013-01; approval data: February 23, 2024). |
| Hemodialysis machine | N/A | N/A | For maintenance hemodialysis, 3 times/week, 4 h/session |
| IBM SPSS Statistics | IBM | Version 27.0 | For all statistical analyses |
| Kidney Disease Quality of Life-Short Form (KDQOL-SF) | RAND Corporation | N/A | Chinese version; KDTA + SF-36; scored 0–100; higher = better QoL; Cronbach's α = 0.835 |
| Self-management behavior scale | Clinical practice in China | N/A | 27-item scale; 4 dimensions; scored 1–4; higher scores = better self-management; Cronbach's α = 0.819 |
| Zung's Self-Rating Anxiety Scale (SAS) | William W.K. Zung | N/A | 20 items; standardized score ≥50 = anxiety; Cronbach's α = 0.827 |
| Zung's Self-Rating Depression Scale (SDS) | William W.K. Zung | N/A | 20 items; standardized score ≥50 = depression; Cronbach's α = 0.898 |
参考文献
- Herrington WG, Judge PK, Grams ME, Wanner C. Chronic kidney disease. Lancet. 2026;407(10523):90-104.
- Wang L, et al. Prevalence of chronic kidney disease in China: results from the Sixth China Chronic Disease and Risk Factor Surveillance. JAMA Intern Med. 2023;183(4):298-310.
- Prakash S, et al. Understanding the kidney replacement therapy decision-making process. BMC Nephrol. 2026;27(1):3.
- Bello AK, et al. Epidemiology of hemodialysis outcomes. Nat Rev Nephrol. 2022;18(6):378-395.
- Flythe JE, Watnick S. Dialysis for chronic kidney failure: a review. JAMA. 2024;332(18):1559-1573.
- Zhang N, et al. Correlation between symptom clusters and self-management among maintenance hemodialysis patients: a cross-sectional study. J Clin Nurs. 2025;34(8):3224-3232.
- Wang L, et al. Self-management and its predictors in maintenance hemodialysis patients: based on triadic reciprocal determinism. Int J Nephrol Renovasc Dis. 2025;18:373-386.
- Zhang L, et al. Facilitators and barriers to self-management among patients with maintenance hemodialysis in central China: a qualitative study. BMC Nephrol. 2026;27(1):267.
- Yuan YY, et al. Application of the E-coach chronic disease management model in the rehabilitation management of patients with arteriosclerosis obliterans. J Health Popul Nutr. 2023;42(1):115.
- Geerts P, et al. Rationale and development of an e-health application to deliver patient-centered care during treatment for recently diagnosed multiple myeloma patients: pilot study of the MM E-coach. Pilot Feasibility Stud. 2023;9(1):85.
- Allen M, Iezzoni LI, Huang A, Huang L, Leveille SG. Improving patient-clinician communication about chronic conditions: description of an internet-based nurse E-coach intervention. Nurs Res. 2008;57(2):107-112.
- Happe L, Sgraja M, Hein A, Quinten V, Diekmann R. Usability and feasibility of a tablet-based e-coach for older adults in rehabilitation units to improve nutrition and physical activity: a prospective pilot study. BMC Geriatr. 2023;23(1):578.
- Yao X, et al. Effectiveness of Internet + E-Coach chronic disease management on blood glucose, lipid levels, liver function, and quality of life in patients with chronic diabetic retinopathy: a comparative study. BMC Ophthalmol. 2024;24(1):468.
- Ritchie CS, et al. The E-Coach technology-assisted care transition system: a pragmatic randomized trial. Transl Behav Med. 2016;6(3):428-437.
- Li WY, et al. Digital health interventions to promote healthy lifestyle in hemodialysis patients: an interventional pilot study. Sci Rep. 2024;14(1):2849.
- Isakova T, et al. KDOQI US commentary on the 2017 KDIGO Clinical Practice Guideline Update for the diagnosis, evaluation, prevention, and treatment of chronic kidney disease-mineral and bone disorder (CKD-MBD). Am J Kidney Dis. 2017;70(6):737-751.
- Park S, Kim YH, Bang HI, Park Y. Sample size calculation in clinical trial using R. J Minim Invasive Surg. 2023;26(1):9-18.
- Cheung YB, Seow YY, Qu LM, Yee AC. Measurement properties of the Chinese version of the Kidney Disease Quality of Life-Short Form (KDQOL-SF) in end-stage renal disease patients with poor prognosis in Singapore. J Pain Symptom Manage. 2012;44(6):923-932.
- Dunstan DA, Scott N, Todd AK. Screening for anxiety and depression: reassessing the utility of the Zung scales. BMC Psychiatry. 2017;17(1):329.
- Zhao Q, et al. Self-management level and influencing factors of middle-aged and younger adults undergoing hemodialysis: a latent profile analysis. Nurs Health Sci. 2026;28(2):e70346.
- Zhou L, et al. Experiences of dietary management and social adaptation in young end-stage renal disease maintenance hemodialysis patients: a qualitative study. Patient Prefer Adherence. 2025;19:1731-1745.
- Vansimaeys C, Benamar L, Balague C. Digital health and management of chronic disease: a multimodal technologies typology. Int J Health Plann Manage. 2021;36(4):1107-1125.
- Curtin RB, Mapes D, Schatell D, Burrows-Hudson S. Self-management in patients with end stage renal disease: exploring domains and dimensions. Nephrol Nurs J. 2005;32(4):389-395.
- Kalantar-Zadeh K, et al. Dietary restrictions in dialysis patients: is there anything left to eat? Semin Dial. 2015;28(2):159-168.
- Zhang QL, Zhang Y, Lin LL, Meng F, Yan L. A review of mobile device interventions for continuous nursing of patients undergoing maintenance haemodialysis. J Multidiscip Healthc. 2024;17:317-324.
- Zhou X, et al. Mediating role of social support in dysphoria, despondency, and quality of life in patients undergoing maintenance hemodialysis. World J Psychiatry. 2024;14(3):409-420.
- Xie C, et al. Mediating role of learned helplessness' components in the association between health literacy/social support and self-management among maintenance haemodialysis patients in Changsha, China: a cross-sectional study. BMJ Open. 2023;13(8):e068601.
- Weiner JP. Doctor-patient communication in the e-health era. Isr J Health Policy Res. 2012;1(1):33.
- Kingod N, Cleal B, Wahlberg A, Husted GR. Online peer-to-peer communities in the daily lives of people with chronic illness: a qualitative systematic review. Qual Health Res. 2017;27(1):89-99.
- Backman C, et al. Platform-based patient-clinician digital health interventions for care transitions: scoping review. J Med Internet Res. 2024;26:e55753.
- Lau ECH, et al. Telehealth and precision prevention: bridging the gap for individualized health strategies. Yearb Med Inform. 2024;33(1):64-69.
- Lin C, et al. The impact of perceived social support on chronic disease self-management among older inpatients in China: the chain-mediating roles of psychological resilience and health empowerment. BMC Geriatr. 2025;25(1):284.
- GBD 2023 Kidney Failure with Replacement Therapy Collaborators. Global, regional, and national prevalence of kidney failure with replacement therapy and associated aetiologies, 1990-2023: a systematic analysis for the Global Burden of Disease Study 2023. Lancet Glob Health. 2025;13(8):e1378-e1395.
- Ye W, Wang L, Wang Y, Wang C, Zeng J. Depression and anxiety symptoms among patients receiving maintenance hemodialysis: a single-center cross-sectional study. BMC Nephrol. 2022;23(1):417.
- Meng Y, et al. Prevalence of depression and anxiety and their predictors among patients undergoing maintenance hemodialysis in Northern China: a cross-sectional study. Ren Fail. 2022;44(1):933-944.
- Zhang L, et al. Experiences of effective psychological adjustment in patients undergoing maintenance hemodialysis: a qualitative study. Patient Prefer Adherence. 2026;20:576627.
- Sander LB, et al. Effectiveness of a guided web-based self-help intervention to prevent depression in patients with persistent back pain: the PROD-BP randomized clinical trial. JAMA Psychiatry. 2020;77(10):1001-1011.