9.7
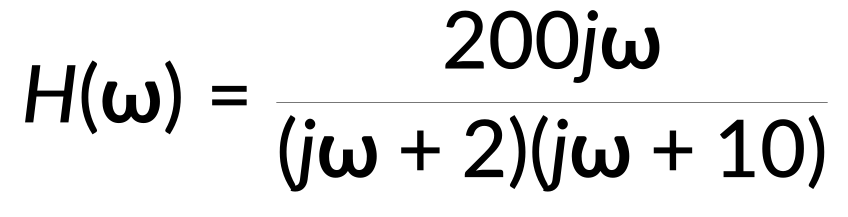
보드 플롯은 로그 주파수 축에 대해 크기 플롯과 위상 플롯을 통해 시스템의 주파수 응답을 매핑하는 제어 시스템 분석의 필수 도구입니다. 보드 플롯을 구성하려면 전달 함수 H(Ω)를 고려해 보세요.
일정한 이득, 0 및 극점을 가집니다. 정규화 후 전달 함수는 다음과 같…
심전도의 조직 전극(E-C-G)은 조직과 측정 전극 사이에 전류에 대한 전도성 경로를 설정하여 심장 활동을 관찰할 수 있도록 합니다.
전극-조직 계면 역학은 전극 저항, 전극-조직 계면에서의 커패시턴스 및 조직 저항을 포함하는 회로 모델을 가지고 있습니다. 전위차는 전극과 조직 사이의 전압 차이를 나타냅니다.
여기서 입력 임피던스는 조직 저항과 같습니다. 출력 임피던스는 전극-조직 계면에서 저항과 커패시턴스의 병렬 조합에 조직 저항을 추가한 것입니다.
알려진 저항 및 커패시턴스 값을 사용하여 계산된 입력 페이저에 대한 출력 페이저의 비율이 전달 함수입니다.
이는 세 가지 고유한 주파수 범위에서 근사화할 수 있습니다.
세미로그 그래프의 보드 크기 플롯은 초당 라디안 단위의 주파수에 대해 계산된 로그 이득을 데시벨 단위로 보여줍니다.
저주파 및 고주파 점근선은 일정한 이득을 가진 수평선입니다. 중간 주파수 범위에서 점근 크기 플롯은 10년당 20데시벨 기울기로 선형입니다.
View the full transcript and gain access to JoVE Core videos
Q1: What is a Bode plot and why is it used in frequency response analysis?
A Bode plot is an essential tool in control system analysis that maps the frequency response of a system through a magnitude plot and a phase plot, both against a logarithmic frequency axis. It enables engineers to visualize how a system responds across different frequencies, making it invaluable for designing and analyzing circuits and control systems.
Q2: How do zeros and poles affect the construction of a Bode plot?
Zeros and poles are critical components of the transfer function that determine the Bode plot's shape. A zero at the origin contributes a positive slope starting from the origin, while each pole introduces a breakpoint or corner frequency where the magnitude plot's slope decreases by 20 decibels per decade. Superposing the individual contributions of all zeros and poles creates the overall Bode plot.
Q3: What are corner frequencies and how do they influence the magnitude plot?
Corner frequencies, also called breakpoints, are specific frequencies where poles or zeros cause changes in the magnitude plot's slope. At each corner frequency, the slope of the magnitude plot decreases by 20 decibels per decade for poles. These frequencies mark transitions between different frequency ranges and are essential for constructing accurate asymptotic Bode plots.
Q4: How does the magnitude plot behave across low, intermediate, and high frequency ranges?
At low frequencies, the magnitude plot maintains a flat response with constant gain until reaching the first corner frequency. In the intermediate frequency range, the asymptotic magnitude plot becomes linear with a 20-decibel-per-decade slope. At high frequencies, the plot again becomes flat with a constant gain determined by the cumulative effect of all poles and zeros.
Q5: What role does the phase plot play in a complete Bode plot representation?
The phase plot complements the magnitude plot by showing how the system's phase response varies with frequency on a logarithmic scale. A zero at the origin causes the phase plot to start at 90 degrees, while poles cause the phase to decrease. The phase plot bends downward at corner frequencies, approaching -90 degrees at frequencies much higher than the highest corner frequency.
Q6: How is the asymptotic Bode plot refined to approximate actual frequency response?
The asymptotic Bode plot consists of straight lines connecting the contributions of each term in the transfer function. To approximate the actual frequency response more closely, smooth curves are added that intersect the asymptotic plot at each corner frequency. This refinement typically results in slight overshoot near corner frequencies, known as peaking.
Q7: How does the electrode-tissue interface model relate to Bode plot construction in biomedical applications?
In electrocardiogram electrodes, the electrode-tissue interface has a circuit model with resistance, capacitance, and tissue resistance components. The transfer function derived from this model can be approximated across three frequency ranges and plotted as a Bode magnitude plot on a semilog graph, showing logarithmic gain in decibels against frequency in radians per second.