모종 홍수 분석은 슈도모나스 주사기 박테리아에 대한 저항성을 위한 야생 토마토 접근물의 신속한 스크리닝을 용이하게 한다. 이 분석법은, 모종 세균 성장 분석과 함께, 박테리아에 대한 근본적인 저항성을 더욱 특성화하는 데 도움을 줄 수 있으며, 저항의 유전적 기초를 결정하기 위해 매핑 인구를 스크리닝하는데 사용될 수 있다.
이 콘텐츠를 보려면 JoVE 구독이 필요합니다. 로그인하거나 오늘 무료 평가판을 시작하세요.
이 논문에서
정오 공지
Important: There has been an erratum issued for this article. View Erratum Notice
요약
초록
토마토는 그람 음성 박테리아인 슈도모나스 주사기에감염되어 세균성 반점 질환을 초래할 수 있는 농업학적으로 중요한 작물입니다. 토마토-P. 주사기 pv. 토마토 병리 시스템은 널리 식물 타고난 반응과 질병 저항의 유전 기초를 해부하는 데 사용됩니다. 질병은 성공적으로 재배 토마토에 Solanum pimpinellium에서 Pto/Prf 유전자 클러스터의 도입을 통해 수십 년 동안 관리되었지만, P. 주사기의 경주 1 균주는 Pto/Prf 유전자 클러스터에 의해 수여된 저항을 극복하기 위하여 발전하고 전 세계적으로 발생합니다.
야생 토마토 종은 병원체 인식에서 자연 다양성의 중요한 저수지입니다, 그들은 다른 병원균 압력을 가진 다양한 환경에서 진화하기 때문에. 야생 토마토의 질병 저항에 대한 일반적인 화면에서 성인 식물이 사용되며, 이는 성장 시간이 길어지고 성장 공간 요구 사항이 커지므로 선별 할 수있는 식물의 수를 제한 할 수 있습니다. 우리는 식물의 성장 시간과 성장 챔버 공간을 최소화하고 식물의 빠른 회전율을 허용하며 큰 샘플 크기를 테스트 할 수있는 저항을위해 10 일 된 토마토 묘목을 선별하는 방법을 개발했습니다. 생존 또는 죽음의 묘목 결과는 홍수 후 살아남은 묘목의 새로운 성장양에 의해 정의된 이산 표현형 또는 저항 척도로 취급될 수 있습니다. 이 방법은 두 개의 P. 주사기 균주에 대한 저항성을 위해 10 일 된 토마토 묘목을 스크리크로 최적화되었으며 다른 P. 주사기 균주에 쉽게 적응 할 수 있습니다.
서론
슈도모나스 주사기는 광범위한 식물 숙주를 감염시키는 그람 음성 병원성 박테리아입니다. 세균은 구내 또는 물리적 상처를 통해 숙주 식물에 진입하여 apoplast1에서증식합니다. 식물은 세균성 병원체에 의한 감염으로부터 보호하기 위해 2계층 면역 반응을 진화시켰습니다. 첫번째 수준은 식물 세포 막에 패턴 인식 수용체가 PAMP 트리거된 면역 (PTI)에게 불린 프로세스에 있는 높게 보존된 병원체 관련 분자 패턴 (PAMPs)를 인식하는 식물 세포 표면에서 생깁니다2. 이 과정에서 숙주 식물은 세포벽에 칼로오스 증착, 구내 종단 폐쇄, 반응성 산소 종의 생산 및 병인 관련 유전자의 유도를 포함한 방어 반응 경로를 upregulates.
박테리아는 식물 세포3에직접 이펙터라고 불리는 단백질을 전달하기 위해 III 형 분비 시스템을 이용하여 PTI를 극복 할 수 있습니다. 이펙터 단백질은 일반적으로 PTI의 성분을 표적으로 하고 병원체독성을 촉진합니다 4. 식물 면역의 두 번째 단계는 이펙터 단백질을 인식하면 식물 세포 내에서 발생합니다. 이러한 인식은 레지스탕스 유전자에 의존하며, 이는 뉴클레오티드 결합 부위류신-풍부한 수용체(NLRs)를 함유하고 있다. NlR은 이펙터를 직접 인식하거나 독성 대상 또는 미끼5에서자신의 활동을 인식 할 수 있습니다. 그(것)들은 감염의 사이트에 현지화한 세포 죽음의 한 형태인 과민반응 (HR)과 수시로 연관되는 이펙터 트리거된 면역 (ETI)에게 불린 프로세스에 있는 이차 면역 반응을트리거합니다 6. ETI와 관련된 유전자 에 대한 유전자 저항과는 대조적으로, 식물은 다중 유전자7의기여에 의존하는 양적 부분 저항성을 나타낼 수 있다.
P. 주사기 pv. 토마토 (Pst)는토마토에 세균 성 반점의 인과 에이전트이며 지속적인 농업 문제입니다. 필드에 우세한 균주는 일반적으로 중 하나 또는 유형 III 이펙터 AvrPto 및 AvrPtoB의 둘 다를 표현하는 Pst 경주 0 균주되었습니다. DC3000(PstDC3000)은 대표적인 경주 0 균주 및 토마토에 세균 성 반점을 일으킬 수있는 모델 병원체입니다. 세균성 반점 질환에 대처하기 위해, 육종가들은 Pto [P. 주사기 pv. 토마토]/Prf [Pto 저항성 및 펜티온 민감성]유전자 클러스터를 야생 토마토 종솔라눔 포피넬리폴리움에서 현대 품종으로8,9. Pto 유전자는 Prf NLR과 함께, 이펙터 AvrPto 및 AvrPtoB10,11,12,13,14의인식을 통해 PstDC3000에 저항성을 부여하는 세린-트레오닌 단백질 키나아제인을 인코딩한다. 그러나, 이 저항은 신흥 인종에 대한 효과가 1 균주, 최근 몇 년 동안 자신의 신속하고 공격적인 확산을 허용15,16. 레이스 1 균주는 AvrPto가 이러한 균주에서 분실되거나 돌연변이되기 때문에 Pto / Prf 클러스터에 의한 인식을 회피하고 AvrPtoB는 최소15,17,18을축적하는 것으로 보입니다.
야생 토마토 개체군은 Pst 저항에 대한 자연변화의 중요한 저수지이며, 이전에는 잠재적 저항성 로시19,20,21을식별하는 데 사용되어 왔다. 그러나, 병원체 저항에 대한 현재의 스크린은 4-5 주 령 성인 식물20,21를이용합니다. 따라서, 이들은 성장 시간, 성장 챔버 공간 및 상대적으로 작은 샘플 크기에 의해 제한된다. 종래의 접근법의 한계를 해결하기 위해 10일 된 토마토 묘목22를사용하여 고처리량 토마토 P. 주사기 저항 분석법을 개발했습니다. 이 접근 방식은 성인 용 식물을 사용하는 데 비해 몇 가지 이점을 제공합니다: 즉, 성장 시간 단축, 공간 요구 사항 감소 및 더 높은 처리량. 더욱이, 우리는 이 접근법이 성인 식물22에서관찰된 질병 저항 표현형을 충실하게 재현한다는 것을 입증했다.
본 프로토콜에 기재된 모종 홍수 분석에서, 토마토 모종은 10일 동안 멸균무라시게 및 스쿠그(MS) 매체의 페트리 접시상에서 재배된 후 관심 있는 박테리아및 계면활성제를 함유하는 접종제로 범람한다. 홍수 후, 모종은 세균 성장 분석을 통해 질병 저항성을 정량적으로 평가할 수 있습니다. 또한, 모종 생존 또는 사망은 홍수 후 7-14일 후에 이산 저항성 또는 질병 표현형으로 작용할 수 있다. 이 접근법은 Pst 균주T1(PstT1)과 같은 Pst 경주 1 균주에 대한 저항성을 위해 많은 수의 야생 토마토 수탁을 스크리닝하기 위한 높은 처리량 대안을 제공하며, 관심 있는 다른 세균 균주에 쉽게 적응할 수 있다.
액세스가 제한되었습니다. 이 콘텐츠를 보려면 로그인하거나 체험판을 시작하세요.
프로토콜
1. 생체 안전 성 캐비닛의 준비 및 사용
- 70% 에탄올로 생체 안전 캐비닛을 닦아냅니다.
- 새시를 닫고 생체 안전 성 캐비닛에서 자외선을 15 분 동안 켭니다.
- 15 분 후, 생체 안전 성 캐비닛에서 자외선을 끕니다. 새시를 들어 올려 송풍기에서 15분 동안 켭니다.
- 살균 된 캐비닛에 품목을 넣기 전에 70 % 에탄올로 생체 안전 캐비닛에 사용할 모든 품목을 닦으하십시오.
- 생체 안전 성 캐비닛에서 작업하기 전에 70 % 에탄올로 장갑이나 맨손을 청소하십시오.
- 송풍기에서 멀리 떨어진 생체 안전 캐비닛의 중앙에서 작업하십시오.
- 실험을 위해 오토클레이브 멸균 10 mM MgCl2 및 초순수 H2O의 미개봉 병을 사용하십시오. 병은 생체 안전 캐비닛에 넣고 벤치탑이 아닌 멸균 된 생물 안전 성 캐비닛에서만 열수 있습니다.
- 멸균 된 생물 안전 성 캐비닛에서 작업을 위해 전용 유리 파이펫 및 파이펫 팁을 사용합니다. 벤치탑에 절대로 생체 안전 캐비닛에서만 열리도록 하십시오.
- 생체 안전 성 캐비닛을 사용한 후 모든 폐기물 (표백제 폐기물 제외)을 오토 클레이브하고 70 % 에탄올로 표면을 닦으하십시오.
2. 식물 매체의 준비
- 0.5x MS 기저 염을 초순수 H2O. 무게 0.8% 바토 한천에 넣고 용해된 0.5x MS에 첨가합니다.
- 오토클레이브및 부설 또는 파이펫팅 전에 50°C 수조에서 1시간 동안 냉각된 용지를 허용한다.
- 플레이트가 과도하게 채워지지 않도록 폴리스티렌 일회용 멸균 100 x 25mm 플레이트를 40 mL의 충진 수준으로 표시하십시오. 멸균된 생체 안전 성 캐비닛에 100 x 25mm 멸균 플레이트에 미디어를 붓습니다.
3. 식물 재료 및 성장 조건의 준비
- 토마토 씨앗을 2.2 mL 미세 원심 분리튜브에 넣고 2.0 mL의 50 % 표백제를 추가하십시오.
- 25 분 동안 로커에 튜브를 흔들어.
- 25 분 후, 로커에서 씨앗을 제거하고 멸균 생물 안전 캐비닛에 피펫표백제를 제거합니다. 모든 표백제가 제거되었는지 확인하십시오.
- 멸균 된 초순수 H2O 2 mL을 추가하여 씨앗을 씻으세요. 튜브를 5x 반전시.
- 파이펫으로 튜브에서 액체를 제거합니다.
- 3.3-3.5 단계를 반복하여 씨앗을 4배 더 씻는다.
- 멸균 울트라 퓨어 H2O 2 mL을 넣고 씨앗을 빈 멸균 페트리 접시에 붓습니다.
- 에탄올에 화염 집게와 0.5x MS + 0.8 % 한천 미디어를 포함하는 100 x 25mm 플레이트에 씨앗을 옮기고 균등하게 간격을 두기 전에 식힙니다.
- 한 접시의 중간을 가로 질러 라인에 5-7 씨앗을 전송하고 수술 테이프 (1.25cm x 9.1 m)로 플레이트의 가장자리를 밀봉.
- 멸균된 종자(4°C)를 암흑에서 적어도 3일 동안 층층으로 층화하여 발아를 동기화하였다. 씨앗이 접시에 이동하지 않도록 접시가 평평하게 쌓여 있고 위를 향하도록하십시오.
- 뿌리가 성장 챔버로 전송 할 때, 수평 으로 방향 씨앗의 라인과 함께, 플레이트의 표면을 따라 아래로 성장할 수 있도록 수직으로 플레이트를 배향.
참고: 성장 챔버를 22°C로 설정하고 ~ 200-220 μE 미터-2 s-1 및 8h의 빛의 강도로 16h의 빛을 제공합니다. - 홍수 에 앞서, 모종을 성장 챔버에서 10 일 동안 성장 모종은 일반적으로 완전히 등장하고 확장 된 코틸레톤과 신흥 첫 번째 진정한 잎을 표시합니다(그림 1).

그림 1: 전형적인 10일 된 토마토 묘목의 발달 단계. 리오그란데-PtoR 토마토 종자를 멸균, 도금, 4°C에서 어둠 속에서 3일 이상 층화하였다. 모종은 침수되기 전에 22°C에서 10일 동안 0.5x MS 플레이트에서 재배하였다. 일반적으로 10 일 에서 코틸레온이 완전히 확장되고 첫 번째 진정한 잎이 나타나기 시작했습니다. 이 그림의 더 큰 버전을 보려면 여기를 클릭하십시오.
4. 킹스 B23 (KB) 미디어 준비
- 비커를 500 mL의 초퓨어 H2O로 채우고 저어줍니다.
- 20 g의 박토 펩톤, 1.5 g의 무수 K2HPO4,12.5 mL의 글리세롤을 초순수 H2O로 비커에 완전히 녹입니다.
- 용해된 혼합물을 1L 의 진원통에 붓고 초순수H2O로1L 최종 부피를 올인합니다.
- 국물을 다시 비커에 붓고 섞일 때까지 저어줍니다.
- 바토 한천 7.5 g을 500 mL 유리 병 2 개에 넣고 각 병 4.4 단계에서 500 mL의 KB 국물을 추가하십시오. 오토클레이브 20분
- 오토클레이브에서 병을 제거하고 부드럽게 소용돌이치면서 한천을 분배합니다.
- 병을 50 °C 의 수조로 1 시간 동안 옮니다.
- 1 시간 후, 생체 안전 성 캐비닛에 병을 옮기고 무균 조건하에서 1,600 μL의 멸균 1 M MgSO4를추가하고 적절한 항생제를 미디어에 추가하십시오.
참고: 리팜피신 내성 균주 PstDC3000 및 PstT1의 경우, 디메틸포마미드에 용해된 리팜피신을 50 μg/mL의 최종 농도에서 사용하십시오. 플레이트의 곰팡이 성장을 방지하기 위해 50 μg/mL의 최종 농도에서 에탄올에 용해된 사이클로육시미드를 사용하십시오. - 용지를 부드럽게 돌리면서 섞은 다음 붓고 접시 바닥을 덮습니다.
- 4 °C에서 거꾸로 저장하기 전에 플레이트가 굳어지도록 적어도 1 시간 동안 두십시오.
5. 세균성 균주 및 배양 조건의 유지 보수
- 포화 세균 배양1 mL, 멸균 80% 글리세롤 333 μL로 박테리아의 단일 콜로니로부터 글리세롤 스톡을 -80°C에서 유지합니다.
- 패치 박테리아 (즉, PstT1) 적절 한 항생제와 KB 한천에 글리세롤 스톡에서 (섹션 4).
- 박테리아가 28 °C에서 2 일 동안 회복된 후 신선한 박테리아를 평평한 멸균 이쑤시개를 사용하여 선택적 KB 한천에 줄무늬를 두었습니다.
- 글리세롤 스톡에서 부터 평평한 멸균 이쑤시개를 사용하여 적절한 선택적 KB 한천에 신선한 박테리아를 줄무늬.
참고: 패치된 글리세롤 스톡이 2주 이상 되지 않았는지 확인하십시오. - PstDC3000의 경우, 홍수 실험에서 박테리아를 사용하기 전에 24시간 동안 28°C에서 KB 플레이트를 배양한다.
- PstT1의 경우, 홍수 실험에서 박테리아를 사용하기 전에 48시간 동안 28°C에서 KB 플레이트를 배양한다.
6. PstT1 접종의 준비
- 무균 10 mM MgCl2에서 0.1의 600 nm (OD600)또는 약 5 x 10⁷ 콜로니 형성 단위 (CFU)/mL)에서 광학 밀도로 박테리아를 재중단시낸다.
- 생물 안전 성 캐비닛에서 멸균 10mMM MgCl2 용액을 사용하여 직렬 희석을 수행합니다. PstT1의 경우 분광광도계를 사용하여 OD600 = 0.1의 시작 농도로 접종을 만듭니다.
- PstT1의 경우, OD600 = 0.1에서 초기 재서스펜션으로부터 1/10 희석을 하여 OD600 = 0.01의 농도에서 직렬 희석을 수득한다.
- OD600 = 6.3 단계에서 0.01에서 직렬 희석을 사용하여 3/4 희석을 하여 최종 OD600 = 0.0075를 얻습니다.
- 비이온성 유기 실리콘 계면 활성제 중면합체 C13H34O4Si3 (즉, 계면활성제)에서 10 mM MgCl2 및 15 s. 계면활성제의 1/10 주식을 마지막 직렬 희석 (OD600 = 0.0075)에 추가하여 최종 농도0.015%를 넣고 잘 섞는다.
7. PstDC3000 접종의 준비
- 무균 10 mM MgCl2에서 0.1 (약 5 x 10⁷ CFU/mL)의 광학 밀도로 박테리아를 무균 재중단합니다.
- 생물 안전 성 캐비닛에서 멸균 10mMM MgCl2 용액을 사용하여 직렬 희석을 수행합니다. PstDC3000의 경우 분광광도계를 사용하여 OD600 = 0.1의 시작 농도로 접종을 만듭니다.
- PstDC3000의 경우, OD600 = 0.1에서 초기 재서스펜션으로부터 1/10 희석을 하여 OD600 = 0.01의 농도에서 직렬 희석을 얻습니다.
- 3단계에서 OD600 = 0.01에서 직렬 희석을 사용하여 1/2 희석을 하여 최종 OD600 = 0.005를 얻습니다.
- 10 mM MgCl2및 15 s의 와류에서 계면활성제의 1/10 희석을 만들고 1/10 재고를 마지막 직렬 희석 (OD600 = 0.005)에 추가하여 0.015 %의 최종 농도로 혼합하고 잘 섞습니다.
8. 토마토 모종 홍수 방법
- 성장 챔버에서 10 일 된 묘목과 접시를 가지고 홍수 에 대한 판을 준비하기 위해 생물 안전 캐비닛에 넣어.
- 수술 용 테이프를 두 개의 플레이트에서 제거합니다.
- 3 분 동안 타이머를 설정하십시오. 최종 접종의 측정 6 mL(PstT1 OD600 = 0.0075 [섹션 6] 또는 PstDC3000 OD600 = 0.005 [섹션 7]) 10 일 된 묘목으로 각 접시에 접종6 mL을 옮니다.
- 멸균 피펫 팁으로 모종을 접종실로 부드럽게 밀어 넣습니다. 타이머를 시작합니다.
- 한 손에 접시 를 잡습니다. 플레이트의 앞쪽을 아래로 기울여 접종을 축적하고 주로 모종의 자엽과 잎을 잠급합니다.
- 5-7x 옆으로 휘젓은 다음 판을 뒤로 돌려 뿌리와 전체 접시를 덮습니다.
- 접시를 다시 아래로 기울여 코틸레톤과 잎을 담그고 총 3분 동안 반복합니다.
- 플레이트에서 접종을 붓고 평평한 표면에 판을 내려 놓은 다음 잔류 접종을 두 번째로 붓습니다.
- 수술 용 테이프로 플레이트를 다시 포장하고 나머지 플레이트에 대해 8.2-8.8 단계를 반복하십시오.
- 모든 플레이트가 침수된 후 성장 챔버에서 플레이트를 다시 배양합니다(단계 3.11 NOTE 참조).
- PstDC3000의 경우 7-10일 후 또는 PstT1의 경우 10-14일 후에 표현형(섹션 11). 세균 성장 검사를 수행하는 경우, 4일 후 잎 조직을 수집(섹션 9 및 10) 다음 표현형(섹션 11). 양자택일로, 식물의 별도 세트에 현상형 분석 및 세균성 성장 분석을 수행합니다.
9. 세균 성장 분석에 대 한 cotyledons의 표면 살균
- 4일 후, 성장 챔버(섹션 8)에서 묘목을 침수하고 재배양한 후, 성장 챔버로부터 토마토 묘목으로 플레이트를 제거한다.
- 모종은 각 유전자형에 대한 플레이트에 부착 플레이트의 하단 외부에 개별 묘목을 번호.
- 개별 모종 번호로 멸균 1.5 mL 마이크로 원심 분리튜브에 라벨을 부착하고 깨끗한 집게를 사용하여 비드 비터와 함께 사용하기 위해 각 튜브에 3mm 멸균 보로실리케이트 비드 1개를 떨어뜨립니다. (10.1단계의 참고 사항 참조))
- 각 튜브 및 닫기 튜브에 10 mMMgCl2의 파이펫 200 μL.
- 70% 에탄올을 준비하고 깨끗한 비커에 100 mL를 붓습니다. 멸균 된 초순수 H2O 100 mL를 별도의 깨끗한 비커에 붓습니다.
- 에탄올톱 톱니 모양의 팁이 있는 깨끗한 스테인리스 스틸 스트레이트 파인 포인트 집게. 깨끗한 집게로 하나의 코틸레돈의 무균 제거를 허용하기 위해 약간 접시를 엽니 다.
- 잎을 꼬집고 잎을 제거하고 70 % 에탄올로 비커에 떨어뜨려 10 초순수 H2O로 코틸레온을 10 초고온으로 헹구고 표면 살균합니다.
- 종이 타월에 코틸레온을 놓고 섬세한 과학 물티슈로 말립니다.
- 표면 살균 및 블로팅 후 각 코틸레온을 개별적으로 계량하고 무게를 기록합니다.
- 코틸레온을 이전에 준비된 1.5 mL 미세원원지 튜브(9.3단계 및 9.4단계)에 해당 유전자형 및 개별 번호로 라벨을 붙인 곳에 놓습니다.
- 멸균 테이프로 플레이트를 다시 밀봉하고 성장 챔버에서 모종을 다시 배양하십시오 (단계 3.11 NOTE 참조).
10. 세균 성장 분석
- 단계 9.10에서 샘플을 사용하여, 10 mMMgCl2에서 비드 비터를 사용하여 조직을 균질화 1-2 분. 조직이 적절하게 macerated되지 않는 경우, 다시 균질화.
참고 : 많은 제조 업체는 비드 비터 균질화를 생산하고 있습니다. 비드의 수와 종류뿐만 아니라 균질화 시간 및 속도(프로그래밍 가능한 경우)는 균질화의 각 유형에 맞게 최적화되어야 합니다. 균질화 중에 시료가 과열되지 않도록 하십시오. - 10.1 단계에서 macerated 조직을 포함하는 각 관에 10 mM MgCl2의 800 μL을 추가하고 혼합하기 위하여 여러 번 반전합니다.
- 다중 채널 파이펫을 사용하여 10 mMMgCl2에서 96 웰 플레이트(100,10-1,10-2,10-3,10-4,10-5)에서각 샘플에 대한 직렬 희석을 준비한다(도2A).
- 각 희석 계열로부터 피펫 5 μL은 다중 채널 파이펫을 사용하여 KB 한천 플레이트(150 mm x 15 mm)에 사이클로헥시미드와 관심 있는 세균 균주에 적합한 선택(단계 4.8 NOTE 참조)에. 접시를 완전히 말리십시오.
- 플레이트를 36시간 동안 28°C에서 거꾸로 배양한 다음해부현미경을 사용하여 플레이트상에 콜로니를 시각화하여 콜로니가 셀 수 있을 정도로 큰지 확인합니다.
참고 : 식민지가 충분히 크지 않은 경우 접시를 다시 배양하고 몇 시간마다 식민지의 크기를 다시 확인하십시오. 전형적으로, 콜로니는 배양 후 ~36-48시간 카운트할 수 있다.

그림 2: 모종 세균 성장 아세포를 위한 직렬 희석제. (A)감염된 식물로부터 의한 잎 조직을 식민지 카운트 전에 희석한다. 희석은 96 웰 플레이트에서 수행된다 (100은 희석되지 않습니다). 전형적으로 희석은10-1 ~10-5로이루어진다. (B)세균 성 콜로니 카운트에 대한 도금 희석. 희석 계열의 각 컬럼의 총 5 μL은 가장 희석된 것부터 가장 농축된 것까지 도금된다. 콜로니가 완전히 건조된 후, 플레이트는 36-48 h. 콜로니를 10배 해부 현미경으로 계수하여 28°C에서 배양된다. 이 그림의 더 큰 버전을 보려면 여기를 클릭하십시오.
- 병합하기 전에 해부 현미경으로 식민지를 계산합니다(그림2B). 100개 미만의 콜로니로 희석 시리즈 플레이트의 식민지를 계산합니다.
- 콜로니 카운트를 얻은후(그림 2B),모종에 대한 조직의 0.01 g으로 카운트를 정상화하고 로그 세균 성장으로 전환한다(표1).
참고 : 하나의 머니 메이커 -PtoS 코틸돈의 평균 질량은 0.01 g이며 경험적으로결정됩니다 22.
| 유전자형1 열 A | 조직 무게 (g) 열 B | 스팟 열 C에 있는 식민지의 # | 스팟2 열 D의 희석 계수 | 식민지 3 열 E의 조정 된 # | 직렬 희석 컬럼 F용 희석 계수 | 콜로니 컬럼 G의 총 # (cfu/0.01 g)4 | 평균 # 콜로니 (cfu/ 0.01 g) 열 H | 평균 로그 증가(cfu/0.01 g(로그10))열 I |
| 샘플 1 | 0.004 g | 10 | 200 | 계산: (C2 x 0.01 g) / B2 = 25 | 1000 | 다음과 같이 계산: (D2 x E2 x F2) = 5000000 | 샘플 1에서 마지막 샘플까지의 평균: (예: 평균 G1:G3) = 70000000 | 평균 즉, 로그. 로그(H2) = 6.85 |
| 샘플 2 | 0.003 g | 15 | 200 | 50 | 1000 | 10000000 | ||
| 샘플 3 | 0.002 g | 6 | 200 | 30 | 1000 | 6000000 | ||
| 1개 3개의 샘플에 대해 표시된 데이터 | ||||||||
| 2개 도금 5 μL x 200 : 1 mL 기준 | ||||||||
| 3개 코틸레돈은 코어에 너무 작기 때문에 식민지 수는 하나의MoneyMaker-PtoS cotyledon의 평균 질량에 따라 조직의 0.01 g로 정규화되었습니다 (데이터는 표시되지 않음) | ||||||||
| 4개 도금 된 볼륨에 따라 mL당 조정 | ||||||||
표 1: 모종 세균 성장 분석에 대한 샘플 계산. 샘플 계산은 세균 수를 정규화하고 로그 박테리아 성장을 결정하는 방법을 보여줍니다.
- 복잡한 유전 적 배경을 가진 야생 접근 및 기타 라인의 경우 섹션 11에 설명 된 대로 개별 모종의 세균 성장 수준을 표현형과 상관 관계가 있습니다.
11. 저항을 위한 현상표
- 7-14 일 후에 성장 챔버에서 플레이트를 제거하고 사망 (질병으로 인한) 또는 생존 (저항으로 인한) 개별 묘목을 표현합니다.
- Phenotype 식물은 홍수 접종 후 7-10 일 이전에 PstDC3000과 같은 매우 악성 균주에 감염되었습니다.
- Phenotype 식물은 홍수 접종 후 10-14 일에 PstT1에 감염되었습니다.
- 관찰된 저항 표현형의 범위에 기초하여 채점 시스템을 결정한다. 품종, 등소성 선 및 야생 접근에 대한 기록 이진 표현형은 일관되고, 중간 저항 표현형에 강하다(그림 4A, 4B).
- 묘목이 표현형에 대한 시간 프레임 내에 정점 메리스템으로부터 새로운 성장을 표시하는 경우, 생존으로 계산합니다. 모종에 갈색 정점 메리스템이 있고 새로운 녹색 식물 성장이 표시되지 않는 경우, 죽음으로 계산합니다(그림 3).

그림 3: 토마토 모종의 개략적 표현. 토마토 묘목의 다른 부분은 hypocotyl, 코일레온, 에피코틸, 정점 meristem 촬영, 진정한 잎을 포함하여 묘사된다. 이 그림의 더 큰 버전을 보려면 여기를 클릭하십시오.
- 광범위한 저항 표현형을 가진 F2 매핑 인구와 같은 집단을 위한 질병 스펙트럼에 표현형을 기록합니다(그림 4C).
- 신중하게 질병 증상과 죽음의 모양에 대한 묘목을 모니터링하여 자형질에 대한 적절한 창을 식별합니다.
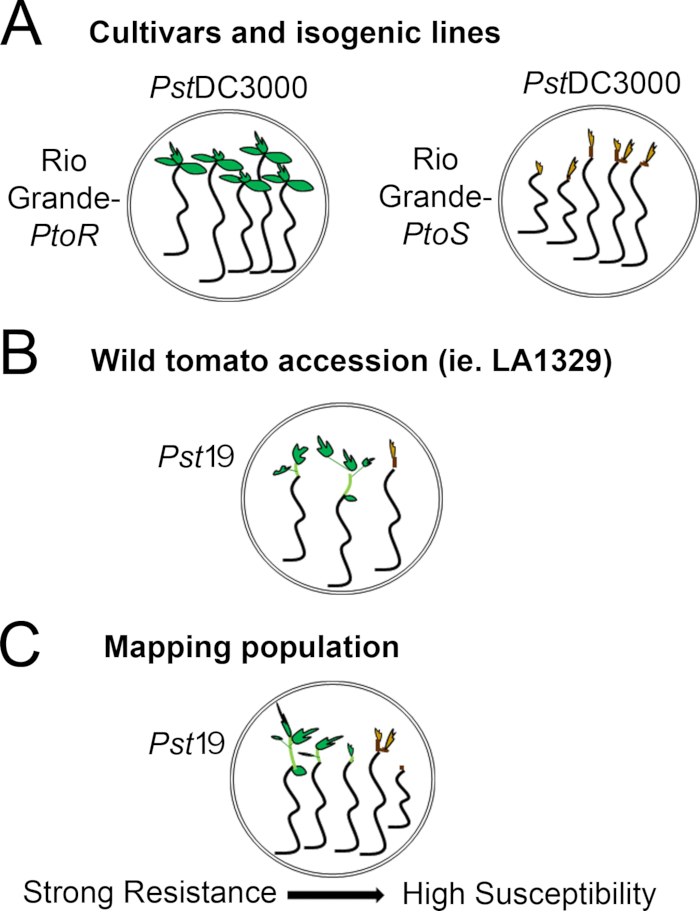
그림 4: 다양한 유전적 배경에서 모종 저항성 및 사망에 대한 예상 표현형의 개략적 표현. (A)리오 그란데-PtoR 및 근이종 품종 리오 그란데-PtoS의 모종은 PstDC3000 (OD600 = 0.005) + 0.015% 계면 활성제로 홍수 후 7 일 후에 표시됩니다. 리오 그란데-PtoR은 일관된 저항을 표시하고, 리오 그란데-PtoS는 PstDC3000감염에 일관된 감수성을 표시합니다. 이러한 선은 이산 및 이진 표현형을 발생시다. (B) 솔라눔 네오릭키 LA1329와 같은 야생 수탁의 모종은 PstT1(OD600 = 0.0075) + 0.015% 계면활성제로 범람한 후 10일 후에 도시된다. 묘목은 표현형 가변성을 표시하지만 이진 표현형으로 기록되었다. 자형질가변성의 양과 자형질(이진 저항 또는 저항 스펙트럼)의 방법은 시험된 특정 수표에 의존할 것이다. (C)취약한 품종에 야생 접근을 교차하여 생성 된 매핑 인구는 F2 분리 인구에서 표현형의 넓은 스펙트럼을 표시 할 수 있습니다. 이 경우, 스펙트럼에 모종 표현형을 기록하는 것이 가장 적합 할 수있다. 매핑 인구에서 매우 취약 한 묘목 PstT1와 홍수 때 일찍 죽음에 대 한 표현 될 수 있습니다 7, 일반적으로 갈색 정점 meristem을 표시, 에피코틸의 거의 확장, 그리고 새로운, 녹색 식물 성장. 영향을 받기 쉬운 모종의 정점 meristem더 많은 시간 동안 녹색 또는 매우 밝은 갈색 을 유지 될 수 있습니다., 그리고 에피코틸과 아주 작은 식물 성장의 일부 확장 있을 수 있습니다., 하루에 의해 갈색과 체포 10. 개별 묘목은 14일까지 새롭고 지속적인 식물 성장의 양에 따라 저항을 표현할 수 있습니다. 모종은 약한, 중간, 또는 강한 저항과 같은 저항의 다른 종류로 위에 기술된 표현형에 근거하여 그 때 분류될 수 있습니다. 이 그림의 더 큰 버전을 보려면 여기를 클릭하십시오.
액세스가 제한되었습니다. 이 콘텐츠를 보려면 로그인하거나 체험판을 시작하세요.
결과
묘목 저항 성 분석기를 사용하여 품종 및 등화 선에서 PtoR-매개 면역 검출
그림 5는 PstDC3000으로 홍수 후 머니메이커-PtoR 및 머니메이커-PtoS 품종 7-10일 의 대표적인 결과를 보여줍니다. 감염 되기 전에, 10 일 된 묘목 표시 완전히 등장 하 고 확장 된 자엽 과 신흥 첫 번째 진정한 잎. 모종은 0.005 + 0.015% 계면활성제의 광학 밀도에서 음의 대조군(데이터 미도시) 및 PstDC3000으로서 10 mM MgCl2 + 0.015% 계면활성제로 침수되었다. 모종은 홍수 후 7-10일 후에 표현형을하였다(도 5). Genono에서 개별 모종일반적으로 균일 한 라인, 머니 메이커-PtoR 및 머니 메이커-PtoS 는 모종 홍수 ...
액세스가 제한되었습니다. 이 콘텐츠를 보려면 로그인하거나 체험판을 시작하세요.
토론
토마토 모종에서 이러한 세균 균주에 대한 저항성을 검출하도록 최적화된 PstDC3000 또는 PstT1을 사용하여 홍수 접종을 위한 프로토콜이 설명되어 있다. 세균 농도 및 계면활성제 농도를 포함하는 모종 저항성 분석에서 최적의 결과를 위한 몇 가지 중요한 파라미터가 있으며, 이는 경험적으로22로결정되었다. PstDC3000의 경우, 광학 밀도는 Pto/Prf 클러스터를 포함하는 내성 품종에서 완전한 생존을 달성하도록 최적화되었으며 Pto/Prf 클러스터(22)가결여된 취약한 품종에서 완전한 죽음을 달성하도록 최적화되었다. 알려진 내성 품종이 없는 PstT1과 같은 변형의 경우, 광학 밀도는 일관되고 완전한 식물사멸(22)에대해 가능한 가장 낮은 것으로 최적화되었다. Uppalapati 외
액세스가 제한되었습니다. 이 콘텐츠를 보려면 로그인하거나 체험판을 시작하세요.
공개 사항
저자는 공개 할 것이 없다.
감사의 글
우리는 질병 이나 저항 결과에 미디어 볼륨의 효과 테스트 에 대 한 제이미 Calma 감사 합니다. 루이스 연구소의 마엘 보딘 박사와 칼 J. 셰이버 박사에게 원고에 대한 건설적인 의견과 제안을 해주신 것에 감사드립니다. 루이스 실험실에서 식물 면역에 대한 연구는 USDA ARS 2030-21000-046-00D 및 2030-21000-050-00D (JDL) 및 생물 과학 IOS-1557661 (JDL)에 대한 NSF 이사회(JDL)에 의해 지원되었습니다.
액세스가 제한되었습니다. 이 콘텐츠를 보려면 로그인하거나 체험판을 시작하세요.
재료
| 이름 | 회사 | 카탈로그 번호 | 댓글 |
|---|---|---|---|
| 3M 테이프 Micropore 1/2" x 10 YD CS 240 (1.25 cm x 9.1 m) | VWR International | 56222-182 | |
| 3mm 붕규산 유리 구슬 | Friedrich & Dimmock | GB3000B | |
| Bacto 펩톤 | BD | 211677 | |
| Bacto 한천 | BD | 214010 | |
| 생물 광도계 플러스 | Eppendorf | E952000006 | |
| Biosafety 캐비닛, 클래스 II 유형 A2 | |||
| 브랜드 일회용 플라스틱 큐벳, 폴리스티렌 | VWR International | 47744-642 | |
| 셔닐 실 Kraft 편평한 나무 이쑤시개 | VWR International | 500029-808 | |
| 시클로헥시미드 | Research Products International | C81040-5.0 | |
| 이염기성 인산칼륨 무수, ACS 등급 | Fisher Scientific | P288-500 | |
| 디메틸포름아미드 | |||
| 해부 현미경(최소 10배 확대) | |||
| 에탄올 - 190 Proof | |||
| Falcon 폴리스티렌 96 웰 마이크로 플레이트, 평평한 바닥 | Fisher Scientific | 08-772-3 | |
| 유리 알코올 버너 심지 | Fisher Scientific | S41898A / No. W-125 | |
| 유리 알코올 버너 | Fisher Scientific | S41898 / No. BO125 | |
| 글리세롤 ACS 시약 | VWR International | EMGX0185-5 | |
| Kimberly-Clark™ Kimtech 과학 및 무역; 킴와이프스&트레이드; 섬세한 작업 와이퍼 | Fisher Scientific | 06-666-A | |
| 염화마그네슘, ACS 등급 | VWR International | 97061-356 | |
| 황산 마그네슘 헵타하이드레이트, ACS 등급 | VWR International | 97062-130 | |
| 마이크로 원심분리기 튜브, 1.5mL | |||
| 마이크로 원심분리기 튜브, 2.2mL | |||
| Mini Beadbeater-96, 115 볼트 | 바이오 스펙 제품 Inc. | 1001 | |
| 무라시게 & Skoog, 기초 염 | Caisson Laboratories, Inc. | MSP01-50LT | |
| Pipet-Lite XLS LTS 8-CH Pipet 20-200uL | Rainin | L8-200XLS | |
| Pipet-Lite XLS LTS 8-CH Pipet 2-20uL | Rainin | L8-20XLS | |
| 폴리스티렌 100mm x 25mm 멸균 페트리 접시 | VWR International | 89107-632 | |
| 폴리스티렌 150mm x 15mm 멸균 페트리 접시 | Fisher Scientific | FB08-757-14 | |
| 폴리스티렌 150x15mm 멸균 페트리 접시 | Fisher Scientific | 08-757-148 | |
| Pure Bright Germicidal Ultra Bleach 5.7% Available Chlorine (100% bleach로 정의) | 스테이플 | 1013131 | |
| Rifampicin | Gold Biotechnology | R-120-25 | |
| Silwet L-77 (비이온 유기실리콘 계면활성제 공중합체 C13H34O4 Si3 계면활성제) | Fisher Scientific | NCO138454 | |
| 팁 LTS 20 μ L 960/10 GPS-L10 | Rainin | 17005091 | |
| 팁 LTS 250 μ L 960/10 GPS-L250 | Rainin | 17005093 | |
| VWR 해부 겸자 미세 팁, 4.5" | VWR International | 82027-386 |
참고문헌
- Underwood, W., Melotto, M., He, S. Y. Role of plant stomata in bacterial invasion. Cell Microbiology. 9 (7), 1621-1629 (2007).
- Zipfel, C. Early molecular events in PAMP-triggered immunity. Current Opinion in Plant Biology. 12 (4), 414-420 (2009).
- Galan, J. E., Wolf-Watz, H. Protein delivery into eukaryotic cells by type III secretion machines. Nature. 444 (7119), 567-573 (2006).
- Lewis, J. D., Desveaux, D., Guttman, D. S. The targeting of plant cellular systems by injected type III effector proteins. Seminars in Cell and Developmental Biology. 20 (9), 1055-1063 (2009).
- Schreiber, K. J., Baudin, M., Hassan, J. A., Lewis, J. D. Die another day: molecular mechanisms of effector-triggered immunity elicited by type III secreted effector proteins. Seminars in Cell and Developmental Biology. 56, 124-133 (2016).
- Heath, M. C. Hypersensitive response-related death. Plant Molecular Biology. 44 (3), 321-334 (2000).
- Boyd, L. A., Ridout, C., O'Sullivan, D. M., Leach, J. E., Leung, H. Plant-pathogen interactions: disease resistance in modern agriculture. Trends in Genetics. 29 (4), 233-240 (2013).
- Pitblado, R. E., MacNeill, B. H. Genetic basis of resistance to Pseudomonas syringae pv. tomato in field tomatoes. Canadian Journal of Plant Pathology. 5 (4), 251-255 (1983).
- Pedley, K. F., Martin, G. B. Molecular basis of Pto-mediated resistance to bacterial speck disease in tomato. Annual Reviews of Phytopathology. 41, 215-243 (2003).
- Ronald, P. C., Salmeron, J. M., Carland, F. M., Mehta, A. Y., Staskawicz, B. J. The cloned avirulence gene AvrPto induces disease resistance in tomato cultivars containing the Pto resistance gene. Journal of Bacteriology. 174 (5), 1604-1611 (1992).
- Martin, G. B., et al. Map-based cloning of a protein kinase gene conferring disease resistance in tomato. Science. 262 (5138), 1432-1436 (1993).
- Salmeron, J. M., Barker, S. J., Carland, F. M., Mehta, A. Y., Staskawicz, B. J. Tomato mutants altered in bacterial disease resistance provide evidence for a new locus controlling pathogen recognition. Plant Cell. 6 (4), 511-520 (1994).
- Salmeron, J. M., et al. Tomato Prf is a member of the leucine-rich repeat class of plant disease resistance genes and lies embedded within the Pto kinase gene cluster. Cell. 86 (1), 123-133 (1996).
- Scofield, S. R., et al. Molecular basis of gene-for-gene specificity in bacterial speck disease of tomato. Science. 274 (5295), 2063-2065 (1996).
- Kunkeaw, S., Tan, S., Coaker, G. Molecular and evolutionary analyses of Pseudomonas syringae pv. tomato race 1. Molecular Plant-Microbe Interactions. 23 (4), 415-424 (2010).
- Cai, R., et al. The plant pathogen Pseudomonas syringae pv. tomato is genetically monomorphic and under strong selection to evade tomato immunity. PLoS Pathogens. 7 (8), 1002130(2011).
- Almeida, N. F., et al. A draft genome sequence of Pseudomonas syringae pv. tomato T1 reveals a type III effector repertoire significantly divergent from that of Pseudomonas syringae pv. tomato DC3000. Molecular Plant-Microbe Interactions. 22 (1), 52-62 (2009).
- Lin, N. C., Abramovitch, R. B., Kim, Y. J., Martin, G. B. Diverse AvrPtoB homologs from several Pseudomonas syringae pathovars elicit Pto-dependent resistance and have similar virulence activities. Applied and Environmental Microbiology. 72 (1), 702-712 (2006).
- Rose, L. E., Langley, C. H., Bernal, A. J., Michelmore, R. W. Natural variation in the Pto pathogen resistance gene within species of wild tomato (Lycopersicon). I. Functional analysis of Pto alleles. Genetics. 171 (1), 345-357 (2005).
- Thapa, S. P., Miyao, E. M., Davis, R. M., Coaker, G. Identification of QTLs controlling resistance to Pseudomonas syringae pv. tomato race 1 strains from the wild tomato Solanum habrochaites LA1777. Theoretical and Applied Genetics. 128 (4), 681-692 (2015).
- Bao, Z. L., et al. Identification of a candidate gene in Solanum habrochaites for resistance to a race 1 strain of Pseudomonas syringae pv. tomato. Plant Genome. 8 (3), 1-15 (2015).
- Hassan, J. A., Zhou, Y. J., Lewis, J. D. A rapid seedling resistance assay identifies wild tomato lines that are resistant to Pseudomonas syringae pv. tomato race 1. Molecular Plant-Microbe Interactions. 30 (9), 701-709 (2017).
- King, E. O., Ward, M. K., Raney, D. E. Two simple media for the demonstration of pyocyanin and fluorescin. Journal of Laboratory and Clinical Medicine. 44 (2), 301-307 (1954).
- Uppalapati, S. R., et al. Pathogenicity of Pseudomonas syringae pv. tomato on tomato seedlings: phenotypic and gene expression analyses of the virulence function of coronatine. Molecular Plant-Microbe Interactions. 21 (4), 383-395 (2008).
- Bhardwaj, V., Meier, S., Petersen, L. N., Ingle, R. A., Roden, L. C. Defence responses of Arabidopsis thaliana to infection by Pseudomonas syringae are regulated by the circadian clock. PLoS One. 6 (10), 26968(2011).
- Lu, H., McClung, C. R., Zhang, C. Tick tock: circadian regulation of plant innate immunity. Annual Review of Phytopathology. 55, 287-311 (2017).
- Wang, W., et al. Timing of plant immune responses by a central circadian regulator. Nature. 470 (7332), 110-114 (2011).
액세스가 제한되었습니다. 이 콘텐츠를 보려면 로그인하거나 체험판을 시작하세요.
재인쇄 및 허가
정오
Formal Correction: Erratum: High-Throughput Identification of Resistance to Pseudomonas syringae pv. Tomato in Tomato using Seedling Flood Assay
Posted by JoVE Editors on 10/18/2023. Citeable Link.
An erratum was issued for: High-Throughput Identification of Resistance to Pseudomonas syringae pv. Tomato in Tomato using Seedling Flood Assay. The Introduction, Protocol, Representative Results and Discussion sections were updated.
The last paragraph of the Introduction section was updated from:
In the seedling flood assay described in this protocol, tomato seedlings are grown on Petri dishes of sterile Murashige and Skoog (MS) media for 10 days and then are flooded with an inoculum containing the bacteria of interest and a surfactant. Following flooding, seedlings can be quantitatively evaluated for disease resistance via bacterial growth assays. Additionally, seedling survival or death can act as a discrete resistance or disease phenotype 7–14 days after flooding. This approach offers a high-throughput alternative for screening large numbers of wild tomato accessions for resistance to Pst race 1 strains, such as Pst strain T1 (PstT1), and can easily be adapted to other bacterial strains of interest.
to:
In the seedling flood assay described in this protocol, tomato seedlings are grown on Petri dishes of sterile Murashige and Skoog (MS) media for 10 days and then are flooded with an inoculum containing the bacteria of interest and a surfactant. Following flooding, seedlings can be quantitatively evaluated for disease resistance via bacterial growth assays. Additionally, seedling survival or death can act as a discrete resistance or disease phenotype 7–14 days after flooding. This approach offers a high-throughput alternative for screening large numbers of wild tomato accessions for resistance to Pst race 1 strains, such as Pst strain 19 (Pst19), and can easily be adapted to other bacterial strains of interest.
Step 4.8 of the Protocol section was updated from:
- After 1 h, transfer the bottle to the biosafety cabinet and under aseptic conditions, add 1,600 µL of sterile 1 M MgSO4, and appropriate antibiotics to the media.
NOTE: For rifampicin resistant strains PstDC3000 and PstT1, use rifampicin dissolved in dimethylformamide at a final concentration of 50 µg/mL. Use cycloheximide dissolved in ethanol at a final concentration of 50 µg/mL to prevent fungal growth on the plates.
to:
- After 1 h, transfer the bottle to the biosafety cabinet and under aseptic conditions, add 1,600 µL of sterile 1 M MgSO4, and appropriate antibiotics to the media.
NOTE: For rifampicin resistant strains PstDC3000 and Pst19, use rifampicin dissolved in dimethylformamide at a final concentration of 50 µg/mL. Use cycloheximide dissolved in ethanol at a final concentration of 50 µg/mL to prevent fungal growth on the plates.
Step 5.2 of the Protocol section was updated from:
- Patch bacteria (i.e., PstT1) from a glycerol stock onto KB agar with appropriate antibiotics (section 4).
to:
- Patch bacteria (i.e., Pst19) from a glycerol stock onto KB agar with appropriate antibiotics (section 4).
Step 5.6 of the Protocol section was updated from:
- For PstT1, incubate the KB plate at 28 ˚C for 48 h prior to using bacteria in the flood experiment.
to:
- For Pst19, incubate the KB plate at 28 ˚C for 48 h prior to using bacteria in the flood experiment.
Step 6 of the Protocol section was updated from:
6. Preparation of PstT1 inoculum
to
6. Preparation of Pst19 inoculum
Step 6.2 of the Protocol section was updated from:
- Perform serial dilutions using sterile 10 mM MgCl2 solution in the biosafety cabinet. For PstT1, use a spectrophotometer to make inoculum with a starting concentration of OD600 = 0.1.
to:
- Perform serial dilutions using sterile 10 mM MgCl2 solution in the biosafety cabinet. For Pst19, use a spectrophotometer to make inoculum with a starting concentration of OD600 = 0.1.
Step 6.3 of the Protocol section was updated from:
- For PstT1, make a 1/10 dilution from the initial resuspension at OD600 = 0.1 to obtain a serial dilution at a concentration of OD600 = 0.01.
to:
- For Pst19, make a 1/10 dilution from the initial resuspension at OD600 = 0.1 to obtain a serial dilution at a concentration of OD600 = 0.01.
Step 8.3 of the Protocol section was updated from:
- Set a timer for 3 min. Measure 6 mL of final inoculum (PstT1 OD600 = 0.0075 [section 6] or PstDC3000 OD600 = 0.005 [section 7]) and transfer 6 mL of inoculum to each plate with the 10-day-old seedlings.
to:
- Set a timer for 3 min. Measure 6 mL of final inoculum (Pst19 OD600 = 0.0075 [section 6] or PstDC3000 OD600 = 0.005 [section 7]) and transfer 6 mL of inoculum to each plate with the 10-day-old seedlings.
Step 8.11 of the Protocol section was updated from:
- Phenotype after 7–10 days for PstDC3000 or 10–14 days for PstT1 (section 11). If carrying out bacterial growth assays, collect leaf tissue after 4 days (sections 9 and 10) and then phenotype (section 11). Alternatively, perform phenotypic analysis and bacterial growth assays on separate sets of plants.
to:
- Phenotype after 7–10 days for PstDC3000 or 10–14 days for Pst19 (section 11). If carrying out bacterial growth assays, collect leaf tissue after 4 days (sections 9 and 10) and then phenotype (section 11). Alternatively, perform phenotypic analysis and bacterial growth assays on separate sets of plants.
Step 10.7 of the Protocol section was updated from:
- After obtaining colony counts (Figure 2B), normalize the counts to 0.01 g of tissue for seedlings and convert to log bacterial growth (Table 1).
NOTE: The average mass of one Moneymaker-PtoS cotyledon is 0.01 g and is empirically determined22.
| Genotype1 Column A | Tissue Weight (g) Column B | # of Colonies in a spot Column C | Dilution factor for spot2 Column D | Adjusted # of Colonies3 Column E | Dilution factor for serial dilution Column F | Total # of Colonies Column G (cfu/0.01 g)4 | Average # of Colonies (cfu/0.01 g) Column H | Average Log Growth (cfu/0.01 g (log10)) Column I |
| Sample 1 | 0.004 g | 10 | 200 | calculated as: (C2 x 0.01 g) / B2 = 25 | 1000 | calculated as: (D2 x E2 x F2) = 5000000 | average for sample 1 through last sample: (ie. average G1:G3) = 7000000 | log of average ie. log(H2) = 6.85 |
| Sample 2 | 0.003 g | 15 | 200 | 50 | 1000 | 10000000 | ||
| Sample 3 | 0.002 g | 6 | 200 | 30 | 1000 | 6000000 | ||
| 1Data shown for 3 samples | ||||||||
| 2Based on plating 5 µL x 200 for 1 mL | ||||||||
| 3Cotyledons are too small to core so colony counts were normalized to 0.01 g of tissue based on the average mass of one MoneyMaker-PtoS cotyledon (data not shown) | ||||||||
| 4Adjusted per mL based on volume plated | ||||||||
Table 1: Sample calculations for seedling bacterial growth assay. Sample calculations demonstrate how to normalize bacterial counts and determine log bacterial growth.
to:
- After obtaining colony counts (Figure 2B), normalize the counts to 0.1 g of tissue for seedlings and convert to log bacterial growth (Table 1).
NOTE: The average mass of one Moneymaker-PtoS cotyledon is 0.1 g and is empirically determined22.
| Genotype1 Column A | Tissue Weight (g) Column B | # of Colonies in a spot Column C | Dilution factor for spot2 Column D | Adjusted # of Colonies3 Column E | Dilution factor for serial dilution Column F | Total # of Colonies Column G (cfu/0.01 g)4 | Average # of Colonies (cfu/0.01 g) Column H | Average Log Growth (cfu/0.1 g (log10)) Column I |
| Sample 1 | 0.04 g | 10 | 200 | calculated as: (C2 x 0.1 g) / B2 = 25 | 1000 | calculated as: (D2 x E2 x F2) = 5000000 | average for sample 1 through last sample: (ie. average G1:G3) = 7000000 | log of average ie. log(H2) = 6.85 |
| Sample 2 | 0.03 g | 15 | 200 | 50 | 1000 | 10000000 | ||
| Sample 3 | 0.02 g | 6 | 200 | 30 | 1000 | 6000000 | ||
| 1Data shown for 3 samples | ||||||||
| 2Based on plating 5 µL x 200 for 1 mL | ||||||||
| 3Cotyledons are too small to core so colony counts were normalized to 0.1 g of tissue based on the average mass of one MoneyMaker-PtoS cotyledon (data not shown) | ||||||||
| 4Adjusted per mL based on volume plated | ||||||||
Table 1: Sample calculations for seedling bacterial growth assay. Sample calculations demonstrate how to normalize bacterial counts and determine log bacterial growth.
Step 11.3 of the Protocol section was updated from:
- Phenotype plants infected with PstT1 at 10–14 days after flood inoculation.
to:
- Phenotype plants infected with Pst19 at 10–14 days after flood inoculation.
Figure 4 in the Protocol section was updated from:
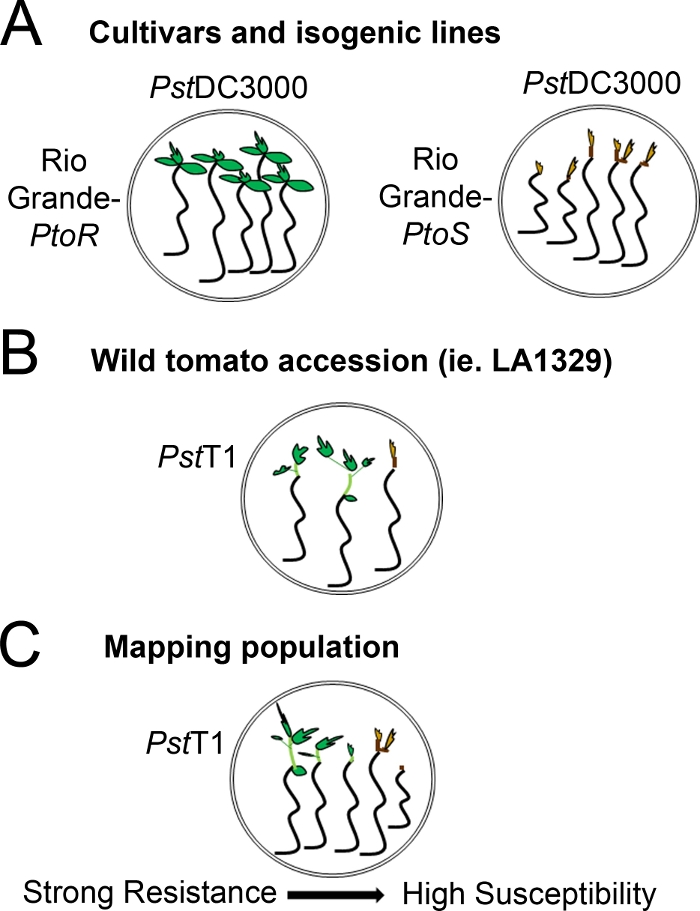
Figure 4: Schematic representation of expected phenotypes for seedling resistance and death in various genetic backgrounds. (A) Seedlings of Rio Grande-PtoR and the near-isogenic cultivar Rio Grande-PtoS are displayed 7 days after flooding with PstDC3000 (OD600 = 0.005) + 0.015% surfactant. Rio Grande-PtoR displays consistent resistance, and Rio Grande-PtoS displays consistent susceptibility to infection with PstDC3000. These lines give rise to discrete and binary phenotypes. (B) Seedlings of a wild accession, such as Solanum neorickii LA1329, are shown 10 days after flooding with PstT1 (OD600 = 0.0075) + 0.015% surfactant. Seedlings display phenotypic variability but were recorded as binary phenotypes. The amount of phenotypic variability and the method of phenotyping (binary resistance or resistance spectrum) will depend on the particular accession tested. (C) Mapping populations generated by outcrossing wild accessions to susceptible cultivars may display a wider spectrum of phenotypes in F2 segregating populations. In this case, it may be most appropriate to record seedling phenotypes on a spectrum. Highly susceptible seedlings from a mapping population may be phenotyped for death as early as day 7 when flooded with PstT1, and typically show a brown apical meristem, no to very little extension of the epicotyl, and no new, green vegetative growth. The apical meristem of susceptible seedlings may stay green or very light brown for more time, and there may be some extension of the epicotyl and very little vegetative growth, which turns brown and arrests by day 10. Individual seedlings can be phenotyped for resistance based on the amount of new and ongoing vegetative growth by day 14. Seedlings can then be grouped based on the phenotypes described above into different categories of resistance such as weak, medium, or strong resistance. Please click here to view a larger version of this figure.
to:
Figure 4: Schematic representation of expected phenotypes for seedling resistance and death in various genetic backgrounds. (A) Seedlings of Rio Grande-PtoR and the near-isogenic cultivar Rio Grande-PtoS are displayed 7 days after flooding with PstDC3000 (OD600 = 0.005) + 0.015% surfactant. Rio Grande-PtoR displays consistent resistance, and Rio Grande-PtoS displays consistent susceptibility to infection with PstDC3000. These lines give rise to discrete and binary phenotypes. (B) Seedlings of a wild accession, such as Solanum neorickii LA1329, are shown 10 days after flooding with Pst19 (OD600 = 0.0075) + 0.015% surfactant. Seedlings display phenotypic variability but were recorded as binary phenotypes. The amount of phenotypic variability and the method of phenotyping (binary resistance or resistance spectrum) will depend on the particular accession tested. (C) Mapping populations generated by outcrossing wild accessions to susceptible cultivars may display a wider spectrum of phenotypes in F2 segregating populations. In this case, it may be most appropriate to record seedling phenotypes on a spectrum. Highly susceptible seedlings from a mapping population may be phenotyped for death as early as day 7 when flooded with Pst19, and typically show a brown apical meristem, no to very little extension of the epicotyl, and no new, green vegetative growth. The apical meristem of susceptible seedlings may stay green or very light brown for more time, and there may be some extension of the epicotyl and very little vegetative growth, which turns brown and arrests by day 10. Individual seedlings can be phenotyped for resistance based on the amount of new and ongoing vegetative growth by day 14. Seedlings can then be grouped based on the phenotypes described above into different categories of resistance such as weak, medium, or strong resistance. Please click here to view a larger version of this figure.
The second paragraph of the Representative Results section was updated from:
Phenotypic screening of wild accessions using the seedling resistance assay
Figure 6 shows representative results for seedlings of susceptible and resistant accessions 10–14 days after flooding with PstT1. Susceptible accessions include RG-PtoR, S. pimpinellifolium LA1375, and S. pimpinellifolium LA1606, and resistant accessions include S. neorickii LA1329. Ten-day-old seedlings were flooded with 10 mM MgCl2 + 0.015% surfactant as a negative control, and PstT1 at an optical density of 0.0075 + 0.015% surfactant. The seedlings were phenotyped at least 10 days after flooding, as PstT1-infected seedlings died more slowly than PstDC3000-infected seedlings. Mock-inoculated seedlings were green, healthy, and actively growing. This control is important to ensure that the accessions are not sensitive to the concentration of surfactant, and to ensure there is no bacterial contamination. Susceptible accessions (Rio Grande-PtoR [n = 7], S. pimpinellifolium LA1375 [n = 7], and S. pimpinellifolium LA1606 [n = 5]) were dead, had brown apical meristems, and lacked new growth 10–14 days after inoculation with PstT1. In contrast, two S. neorickii LA1329 (n = 3) seedlings displayed a high level of new, green growth and survived infection with PstT1 (Figure 6). Three LA1329 seedlings did not germinate. Typically, 5–7 individuals were screened for each accession in a primary screen to determine the prevalence of resistance in the population. When a more genetically complex wild accession, such as LA1329, is flooded with PstT1, the resistance phenotypes display slightly more variability among individual seedlings, compared to Moneymaker-PtoR treated with PstDC3000. However, the resistance phenotypes were usually less variable than those seen in F2 mapping populations. Thus, binary phenotyping criteria was used for LA1329.
to:
Phenotypic screening of wild accessions using the seedling resistance assay
Figure 6 shows representative results for seedlings of susceptible and resistant accessions 10–14 days after flooding with Pst19. Susceptible accessions include RG-PtoR, S. pimpinellifolium LA1375, and S. pimpinellifolium LA1606, and resistant accessions include S. neorickii LA1329. Ten-day-old seedlings were flooded with 10 mM MgCl2 + 0.015% surfactant as a negative control, and Pst19 at an optical density of 0.0075 + 0.015% surfactant. The seedlings were phenotyped at least 10 days after flooding, as Pst19-infected seedlings died more slowly than PstDC3000-infected seedlings. Mock-inoculated seedlings were green, healthy, and actively growing. This control is important to ensure that the accessions are not sensitive to the concentration of surfactant, and to ensure there is no bacterial contamination. Susceptible accessions (Rio Grande-PtoR [n = 7], S. pimpinellifolium LA1375 [n = 7], and S. pimpinellifolium LA1606 [n = 5]) were dead, had brown apical meristems, and lacked new growth 10–14 days after inoculation with Pst19. In contrast, two S. neorickii LA1329 (n = 3) seedlings displayed a high level of new, green growth and survived infection with Pst19 (Figure 6). Three LA1329 seedlings did not germinate. Typically, 5–7 individuals were screened for each accession in a primary screen to determine the prevalence of resistance in the population. When a more genetically complex wild accession, such as LA1329, is flooded with Pst19, the resistance phenotypes display slightly more variability among individual seedlings, compared to Moneymaker-PtoR treated with PstDC3000. However, the resistance phenotypes were usually less variable than those seen in F2 mapping populations. Thus, binary phenotyping criteria was used for LA1329.
Figure 6 in the Representative Results section was updated from:
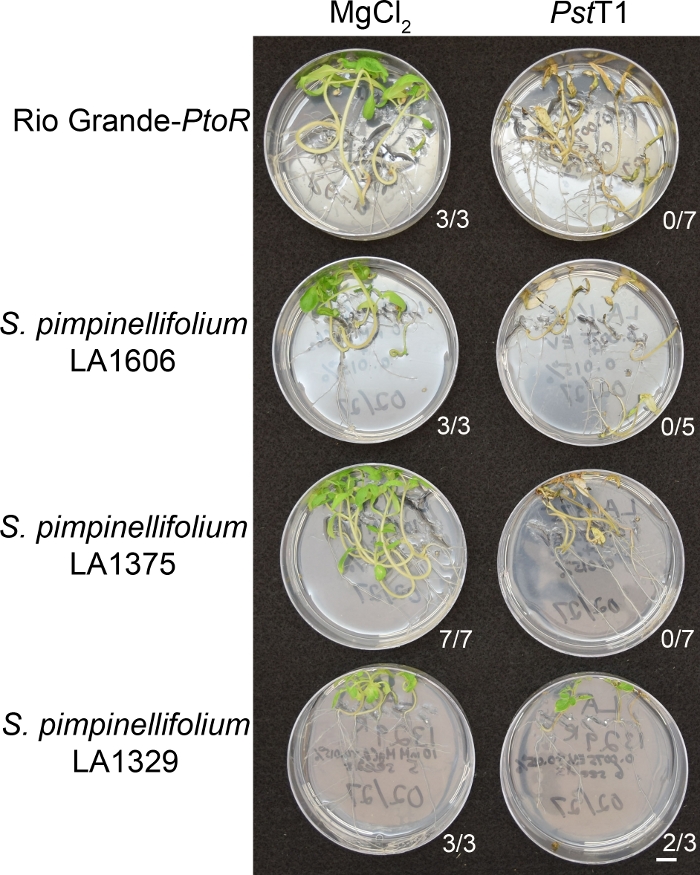
Figure 6: Phenotypic characterization of resistance or disease symptoms 10–14 days post-infection in wild accessions. Rio Grande-PtoR, S. pimpinellifolium LA1606, S. pimpinellifolium LA1375 and S. neorickii LA1329 tomato seedlings were grown on 0.5x MS plates for 10 days, and then flooded with PstT1 (OD600 = 0.0075) + 0.015% surfactant. The number of surviving seedlings for each wild accession out of the total number tested is shown. Scale bar = 1 cm. Please click here to view a larger version of this figure.
to:
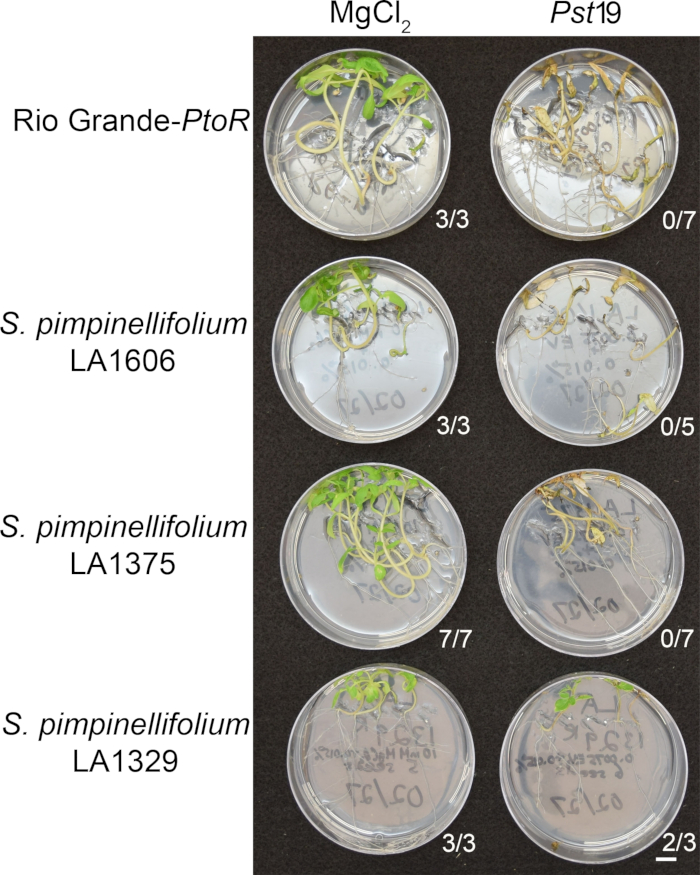
Figure 6: Phenotypic characterization of resistance or disease symptoms 10–14 days post-infection in wild accessions. Rio Grande-PtoR, S. pimpinellifolium LA1606, S. pimpinellifolium LA1375 and S. neorickii LA1329 tomato seedlings were grown on 0.5x MS plates for 10 days, and then flooded with Pst19 (OD600 = 0.0075) + 0.015% surfactant. The number of surviving seedlings for each wild accession out of the total number tested is shown. Scale bar = 1 cm. Please click here to view a larger version of this figure.
The third paragraph of the Representative Results section was updated from:
Quantitative assessment of bacterial growth using the seedling flood assay
To confirm that the observed resistance in LA1329 to PstT1 resulted in lower bacterial growth, bacterial growth assays were carried out in tomato seedlings. The level of PstT1 growth in Moneymaker-PtoS and S. neorickii LA1329 was determined 4 days post-infection. Moneymaker-PtoS is a near-isogenic line with consistent susceptibility among individual seedlings. Wild accessions such as S. neorickii LA1329 are often more genetically complex. LA1329 displays approximately 60% resistance to PstT1 across the population22. Because seedlings may drop their cotyledons after infection, one seedling was grown on each plate to correlate bacterial growth in the harvested cotyledon with overall seedling survival or death as determined phenotypically at least 10 days after flooding. The bacterial counts on day 4 for each seedling were normalized to 0.01 g of tissue and converted to log growth (CFU/0.01 g(log10)). Log growth for phenotypically resistant LA1329 seedlings (LA1329RES) or phenotypically susceptible seedlings (LA1329SUS) were separately pooled and compared to each other and the susceptible cultivar Moneymaker-PtoS. For example, there was a 1.7 log difference in bacterial growth between LA1329RES (log 6.3) and LA1329SUS (log 8.0), and a 1.6 log difference between LA1329RES (log 6.3) and Moneymaker-PtoS (log 7.9) (Figure 7). Therefore, phenotypic resistance correlated with quantitative resistance in the seedling assays.
to:
Quantitative assessment of bacterial growth using the seedling flood assay
To confirm that the observed resistance in LA1329 to Pst19 resulted in lower bacterial growth, bacterial growth assays were carried out in tomato seedlings. The level of Pst19 growth in Moneymaker-PtoS and S. neorickii LA1329 was determined 4 days post-infection. Moneymaker-PtoS is a near-isogenic line with consistent susceptibility among individual seedlings. Wild accessions such as S. neorickii LA1329 are often more genetically complex. LA1329 displays approximately 60% resistance to Pst19 across the population22. Because seedlings may drop their cotyledons after infection, one seedling was grown on each plate to correlate bacterial growth in the harvested cotyledon with overall seedling survival or death as determined phenotypically at least 10 days after flooding. The bacterial counts on day 4 for each seedling were normalized to 0.01 g of tissue and converted to log growth (CFU/0.01 g(log10)). Log growth for phenotypically resistant LA1329 seedlings (LA1329RES) or phenotypically susceptible seedlings (LA1329SUS) were separately pooled and compared to each other and the susceptible cultivar Moneymaker-PtoS. For example, there was a 1.7 log difference in bacterial growth between LA1329RES (log 6.3) and LA1329SUS (log 8.0), and a 1.6 log difference between LA1329RES (log 6.3) and Moneymaker-PtoS (log 7.9) (Figure 7). Therefore, phenotypic resistance correlated with quantitative resistance in the seedling assays.
Figure 7 in the Representative Results section was updated from:
x
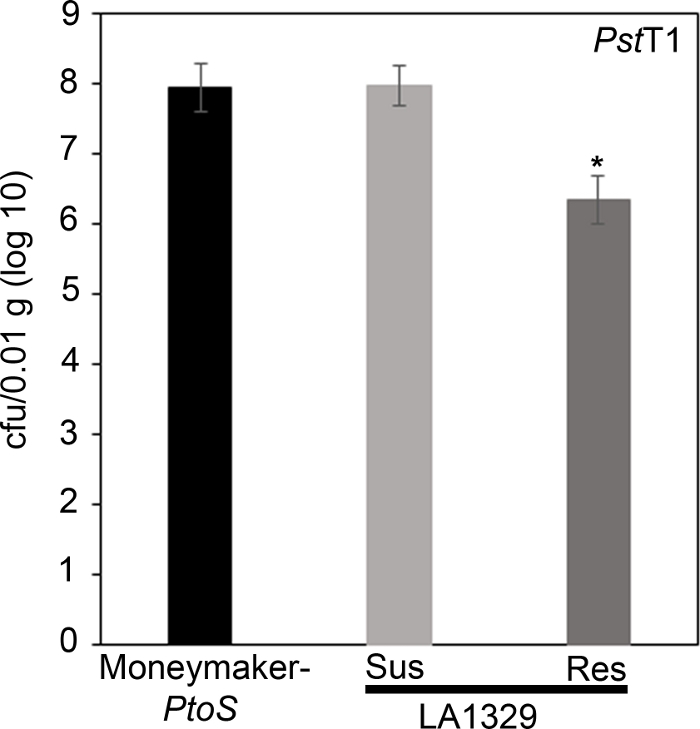
Figure 7: Resistant Solanum neorickii LA1329 seedlings support lower bacterial growth than Moneymaker-PtoS or susceptible S. neorickii LA1329. Bacterial counts were determined 4 days post-inoculation from S. neorickii LA1329 (n = 14) and Moneymaker-PtoS (n = 10) seedlings infected with PstT1 and normalization was performed to 0.01 g of tissue. For LA1329, the two phenotypic groups, susceptible (SUS) or resistant (RES), were observed and counted separately. Above the bar * = statistically significant difference determined by a one-factor analysis of variance. A general linear model procedure (p < 0.001) followed by a multiple comparison of means using Tukey's post hoc test was used. Error bars = standard error. The figure indicates one representative experiment. Please click here to view a larger version of this figure.
x
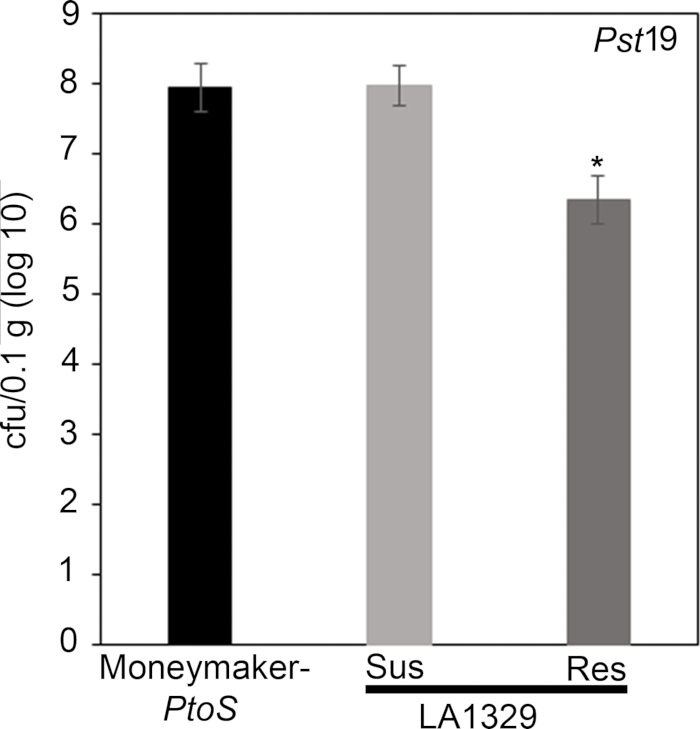
Figure 7: Resistant Solanum neorickii LA1329 seedlings support lower bacterial growth than Moneymaker-PtoS or susceptible S. neorickii LA1329. Bacterial counts were determined 4 days post-inoculation from S. neorickii LA1329 (n = 14) and Moneymaker-PtoS (n = 10) seedlings infected with Pst19 and normalization was performed to 0.1 g of tissue. For LA1329, the two phenotypic groups, susceptible (SUS) or resistant (RES), were observed and counted separately. Above the bar * = statistically significant difference determined by a one-factor analysis of variance. A general linear model procedure (p < 0.001) followed by a multiple comparison of means using Tukey's post hoc test was used. Error bars = standard error. The figure indicates one representative experiment. Please click here to view a larger version of this figure.
The first paragraph of the Discussion section was updated from:
A protocol for flood inoculation with PstDC3000 or PstT1 optimized to detect resistance to these bacterial strains in tomato seedlings is described. There are several critical parameters for optimal results in the seedling resistance assay, including bacterial concentration and surfactant concentration, which were empirically determined22. For PstDC3000, the optical density was optimized to achieve complete survival on a resistant cultivar containing the Pto/Prf cluster and complete death on a susceptible cultivar lacking the Pto/Prf cluster22. For a strain such as PstT1, where there are no known resistant varieties, the optical density was optimized to be the lowest possible for consistent and complete plant death22. Uppalapati et al.24 designed a tomato seedling assay to investigate the pathogenesis of PstDC3000 and the virulence function of coronatine. In this virulence assay, infections were performed using bacteria concentrated to an OD600 of 0.124, 20x higher than the optical density of strains used in our resistance assay. Recognition of PstDC3000 effectors AvrPto and AvrPtoB in tomato seedlings carrying the Pto/Prf gene cluster results in ETI and a macroscopic HR22. In the context of a strong immune response such as ETI, a lower bacterial titer was used for PstDC3000 to avoid overwhelming genetic resistance from the Pto/Prf gene cluster22. In addition, these results suggest that a high bacterial concentration could overwhelm weaker immune responses such as PTI or quantitative partial resistance, where multiple genes contribute to the overall phenotype. Surfactant is necessary for the bacteria to adhere to the leaf surface; however, high concentrations can cause chlorosis of the leaf22. We previously tested a range of surfactant concentrations to empirically determine the ideal concentration in 10-day-old tomato seedlings22. When testing new species that may differ in their sensitivity to surfactant, the surfactant concentration should be optimized to identify a concentration that does not cause damage or chlorosis in the absence of bacteria. Appropriate assay conditions will require optimization of a surfactant concentration that does not cause damage, and a bacterial concentration that causes disease in all susceptible controls.
to:
A protocol for flood inoculation with PstDC3000 or Pst19 optimized to detect resistance to these bacterial strains in tomato seedlings is described. There are several critical parameters for optimal results in the seedling resistance assay, including bacterial concentration and surfactant concentration, which were empirically determined22. For PstDC3000, the optical density was optimized to achieve complete survival on a resistant cultivar containing the Pto/Prf cluster and complete death on a susceptible cultivar lacking the Pto/Prf cluster22. For a strain such as Pst19, where there are no known resistant varieties, the optical density was optimized to be the lowest possible for consistent and complete plant death22. Uppalapati et al.24 designed a tomato seedling assay to investigate the pathogenesis of PstDC3000 and the virulence function of coronatine. In this virulence assay, infections were performed using bacteria concentrated to an OD600 of 0.124, 20x higher than the optical density of strains used in our resistance assay. Recognition of PstDC3000 effectors AvrPto and AvrPtoB in tomato seedlings carrying the Pto/Prf gene cluster results in ETI and a macroscopic HR22. In the context of a strong immune response such as ETI, a lower bacterial titer was used for PstDC3000 to avoid overwhelming genetic resistance from the Pto/Prf gene cluster22. In addition, these results suggest that a high bacterial concentration could overwhelm weaker immune responses such as PTI or quantitative partial resistance, where multiple genes contribute to the overall phenotype. Surfactant is necessary for the bacteria to adhere to the leaf surface; however, high concentrations can cause chlorosis of the leaf22. We previously tested a range of surfactant concentrations to empirically determine the ideal concentration in 10-day-old tomato seedlings22. When testing new species that may differ in their sensitivity to surfactant, the surfactant concentration should be optimized to identify a concentration that does not cause damage or chlorosis in the absence of bacteria. Appropriate assay conditions will require optimization of a surfactant concentration that does not cause damage, and a bacterial concentration that causes disease in all susceptible controls.
The third paragraph of the Discussion section was updated from:
Pst is a foliar pathogen that preferentially colonizes the aerial parts of tomato seedlings, including the cotyledons24 (Figure 3). Therefore, qualitative phenotyping in the seedling flood assay focuses on growth and disease symptoms in aerial portions of the seedling, and tissue for the bacterial growth assay is sampled from the cotyledons for quantitative analysis. After flood inoculation, seedlings may die within 7–10 days after inoculation with PstDC3000 or 10–14 days after inoculation with PstT1, as discussed in section 11. Seedling death is visualized by a brown apical meristem, arrested epicotyl elongation, and/or arrested vegetative growth. If different bacterial strains are used, the timing will have to be empirically determined. In addition, the progression of disease on control plants should be monitored daily after flooding until a consistent time frame from the onset of disease symptoms to seedling death can be identified. Depending on the genotypes and treatments used in the flood assay, seedling phenotypes can be recorded as binary phenotypes or on a disease spectrum (Figure 4). A broader spectrum of phenotypes may be observed when flood inoculating F2 mapping populations from wild tomato accessions crossed to susceptible cultivars (Figure 4C). It may be best to phenotype segregating populations on a disease spectrum depending on how quickly the seedling dies and the degree of new vegetative growth and branching (Figure 4C). The seedling flood assay can also be used in conjunction with the seedling bacterial growth assay to quantitatively assess levels of bacterial growth associated with qualitative phenotypes in individual seedlings (Figure 7). Very large reductions (i.e., ~log 3) in bacterial growth or strong resistance in resistant seedlings of a wild accession compared to a susceptible cultivar suggest that the underlying genetic basis of resistance may be due to ETI22. Smaller reductions in bacterial growth (i.e., ~log 1.7), as observed in LA1329 seedlings, may be due to the contribution of weaker resistance from quantitative trait loci and/or PTI. Thus, the seedling growth assay can be an important tool in further characterizing resistance in wild tomato lines.
to:
Pst is a foliar pathogen that preferentially colonizes the aerial parts of tomato seedlings, including the cotyledons24 (Figure 3). Therefore, qualitative phenotyping in the seedling flood assay focuses on growth and disease symptoms in aerial portions of the seedling, and tissue for the bacterial growth assay is sampled from the cotyledons for quantitative analysis. After flood inoculation, seedlings may die within 7–10 days after inoculation with PstDC3000 or 10–14 days after inoculation with Pst19, as discussed in section 11. Seedling death is visualized by a brown apical meristem, arrested epicotyl elongation, and/or arrested vegetative growth. If different bacterial strains are used, the timing will have to be empirically determined. In addition, the progression of disease on control plants should be monitored daily after flooding until a consistent time frame from the onset of disease symptoms to seedling death can be identified. Depending on the genotypes and treatments used in the flood assay, seedling phenotypes can be recorded as binary phenotypes or on a disease spectrum (Figure 4). A broader spectrum of phenotypes may be observed when flood inoculating F2 mapping populations from wild tomato accessions crossed to susceptible cultivars (Figure 4C). It may be best to phenotype segregating populations on a disease spectrum depending on how quickly the seedling dies and the degree of new vegetative growth and branching (Figure 4C). The seedling flood assay can also be used in conjunction with the seedling bacterial growth assay to quantitatively assess levels of bacterial growth associated with qualitative phenotypes in individual seedlings (Figure 7). Very large reductions (i.e., ~log 3) in bacterial growth or strong resistance in resistant seedlings of a wild accession compared to a susceptible cultivar suggest that the underlying genetic basis of resistance may be due to ETI22. Smaller reductions in bacterial growth (i.e., ~log 1.7), as observed in LA1329 seedlings, may be due to the contribution of weaker resistance from quantitative trait loci and/or PTI. Thus, the seedling growth assay can be an important tool in further characterizing resistance in wild tomato lines.
The fourth paragraph of the Discussion section was updated from:
Typically, genetic screens have been performed on four- to five-week-old adult tomato plants to identify the genetic basis of P. syringae resistance in wild accessions20,21. Adult tomato plants require much longer growth times, require more space in the growth chamber, and are much larger plants, which means that usually few individuals are screened for each line. The seedling flood assay provides a powerful, alternative approach in the identification of P. syringae resistance in wild tomato accessions. Screening at the seedling stage permits a large sample size to be tested which can be particularly advantageous in detecting resistance in genetically complex populations. Reduced growth chamber space requirements and growth time facilitate a high-throughput approach and rapid detection of natural resistance in wild accessions to emerging pathogens. Furthermore, P. syringae resistance that was identified at the seedling stage in this assay is not restricted to the developmental stage. S. neorickii LA1329 and S. habrochaites LA1253 were initially identified at the seedling stage and also display resistance to PstT1 in adult plants as previously described22.
to:
Typically, genetic screens have been performed on four- to five-week-old adult tomato plants to identify the genetic basis of P. syringae resistance in wild accessions20,21. Adult tomato plants require much longer growth times, require more space in the growth chamber, and are much larger plants, which means that usually few individuals are screened for each line. The seedling flood assay provides a powerful, alternative approach in the identification of P. syringae resistance in wild tomato accessions. Screening at the seedling stage permits a large sample size to be tested which can be particularly advantageous in detecting resistance in genetically complex populations. Reduced growth chamber space requirements and growth time facilitate a high-throughput approach and rapid detection of natural resistance in wild accessions to emerging pathogens. Furthermore, P. syringae resistance that was identified at the seedling stage in this assay is not restricted to the developmental stage. S. neorickii LA1329 and S. habrochaites LA1253 were initially identified at the seedling stage and also display resistance to Pst19 in adult plants as previously described22.
