본 프로토콜은 마이오신 모터 활성이 막 유사 인터페이스에서 분지형 액틴 조립 및 네트워크 구조에 어떠한 영향을 미치는지 정량적으로 조사하기 위한 조절 가능한 액틴 코멧-테일 비드 운동성 분석법을 설명합니다.
이 논문에서
요약
초록
actin-related protein 2/3 (Arp2/3) 복합체에 의해 매개되는 분지형 액틴 중합은 세포 이동, 내세포작용(endocytosis) 및 식세포작용(phagocytosis)을 포함한 다양한 세포 과정에 주요한 추진력을 제공합니다. 세포 전단부(leading edge)의 분지형 액틴 네트워크와 자주 공국소화(colocalize)되는 Myosin-I 모터 또한 이러한 과정에 참여하는 것으로 나타났으며, 액틴 네트워크의 조직화와 기계적 출력을 조절하는 것으로 생각됩니다. 하지만, myosin-I가 Arp2/3 복합체와 상호작용하여 분지형 액틴 조립과 힘 생성을 조절하는 분자적 메커니즘은 여전히 상당 부분 알려지지 않은 상태입니다. 본 연구에서는 마이크론 크기의 비드 표면에서 세포 전단부의 myosin-I, 액틴 및 Arp2/3 복합체 간의 상호작용을 재구성하는, 정밀하게 조절 가능한 in vitro 액틴 코멧-테일 비드 운동성 분석법(actin comet-tail bead motility assay)을 설명합니다. 이 방법은 비드 표면에 myosin-I와 핵 형성 촉진 인자(NPFs)를 함께 고정하여 막과 유사한 액틴 조립 인터페이스를 생성함으로써, 잘 확립된 액틴 코멧-테일 분석법을 응용한 것입니다. 이 분석법을 통해 액틴 네트워크 조립, 네트워크 밀도, 비드 운동성 및 성장 효율을 시각화하고 정량적으로 분석할 수 있습니다. 또한, 분지형 액틴 네트워크에서 myosin-I에 의해 매개되는 힘의 증강을 간접적으로 정성 분석할 수 있는 리드아웃을 제공합니다. 본 프로토콜은 비드 기능화, 반응 조립, 형광 이미징, 정량적 이미지 분석 및 문제 해결 전략을 포함하며, 막과 유사한 인터페이스에서 myosin-I가 조절하는 액틴 조립을 연구하기 위한 재현 가능한 플랫폼을 제공합니다.
서론
actin-related protein 2/3 (Arp2/3) 복합체에 의해 매개되는 분지형 액틴 중합은 세포 이동, 내포 작용, 식세포 작용 및 세포 접착 복합체 형성을 포함한 다양한 세포 과정의 핵심 동력이 되는 일차적인 돌출력을 생성합니다1,2,3,4,5,6. 이동하는 세포의 선단부에서 핵형성 촉진 인자(nucleation-promoting factors, NPFs)는 세포막에서 Arp2/3 복합체를 활성화하여 막을 앞으로 밀어내는 수지상 액틴 네트워크 조립을 시작합니다. Myosin-I 모터는 막 계면의 이러한 분지형 액틴 네트워크와 빈번하게 공국소화되며, 액틴 구조 조절 및 힘 생성 변조에 관여하는 것으로 알려져 있습니다7,8,9,10,11,12,13. Myosin-I이 액틴 의존적 기계적 과정에 기여한다는 증거가 축적되고 있음에도 불구하고, Myosin-I이 Arp2/3 매개 분지형 액틴 조립과 상호작용하여 네트워크 구조와 기계적 출력을 조절하는 분자적 기제는 여전히 충분히 밝혀지지 않았습니다.
이러한 공백을 메우기 위해, 우리는 마이크론 크기 비드 표면에서 myosin-I, actin 및 Arp2/3 complex 간의 상호작용을 재구성하고자, 잘 확립된 actin comet-tail 비드 운동성 시스템14,15,16,17에 myosin-I를 통합하였습니다. 이 방법의 전반적인 목표는 막과 유사한 계면에서 myosin-actin 결합이 분지형 actin 조립, 네트워크 구조, 대칭성 붕괴 및 비드 운동성에 어떻게 영향을 미치는지 정량적으로 조사하는 것입니다. 이 분석법에서는--plasma membrane에서의 공동 국소화를 모방하기 위해 myosin-I와 NPF를 마이크로 스케일 비드에 함께 코팅합니다18. 중합이 시작되면, 표면에 결합된 NPF가 Arp2/3 의존적 분지형 actin 조립을 촉진하여, actin-shell 형성, 대칭성 붕괴 및 비드 추진을 유도하는 편향된 comet tail의 발달로 이어집니다 14,19,20,21,22,23. myosin 표면 밀도를 체계적으로 변화시키고18 capping protein (CP) 농도를 통해 actin 네트워크 밀도를 조절함으로써15,19,24, 이 방법은 actin 조립 역학, 성장 효율, 네트워크 구조 및 비드 운동성을 정량적으로 분석할 수 있게 하며, myosin-I 의존적인 기계적 출력 변화와 관련된 간접적인 판독값을 제공합니다.
이 분석법은 상보적인 접근 방식들에 비해 뚜렷한 장점을 제공합니다. 피렌-액틴 분석법(pyrene-actin assays)과 같은 벌크 중합 분석법과 비교하여, 이 비드 운동성 시스템은 분지형 액틴 조립과 액틴 중합으로 유도되는 비드의 움직임을 직접적으로 시각화할 수 있게 합니다. 단백질 기능의 중첩과 복잡한 세포 환경으로 인해 개별 기여도를 파악하기 어렵고 해석이 복잡해질 수 있는 세포 연구와는 대조적으로, 이 분석법은 단백질 조성, 농도 및 표면 구성을 정밀하게 제어할 수 있어, 정의된 생화학적 조건 하에서 myosin-I이 Arp2/3 매개 액틴 조립과 어떻게 상호작용하는지를 체계적으로 조사할 수 있게 합니다.
이 방법은 세포골격 성분들이 막 유사 계면에서 어떻게 협력하여 액틴 네트워크 구조와 기계적 출력을 조절하는지 연구하는 데 가장 적합합니다. 현재 프로토콜은 myosin-I 매개 분지 액틴 조립에 최적화되어 있지만, 그 모듈형 설계 덕분에 향후 다른 막 관련 마이오신 클래스(예: myosin VI, VII, X, XV 및 XIX) 및/또는 액틴 결합 단백질(예: formins, vasodilator-stimulated phosphoprotein (VASP), cortactin, coronin 또는 tropomyosin)을 조사하는 데 응용될 수 있습니다. 이러한 응용을 위해서는 단백질의 고정, 활성 및 표면 밀도에 대한 검증이 필요합니다. 또한, 이 분석법은 펄스-체이스 표지 전략에 적용 가능합니다. 광전환 또는 광활성 액틴, 혹은 표지된 Arp2/3 하위 단위체를 도입하면 성장하는 네트워크 내에서 필라멘트의 턴오버 및 분지 해리 속도를 측정할 수 있을 것입니다25. 전반적으로, 이 분석법은 막 관련 모터, 액틴 필라멘트 및 액틴 결합 단백질 간의 분자적 상호작용을 조사하고, 모터와 액틴 결합 단백질이 막 유사 계면에서 네트워크 리모델링과 힘 생성을 어떻게 조절하는지 탐구할 수 있는 다목적 플랫폼을 제공합니다14,15,26,27,28,29,30,31,32,33,34. 더 넓게는, 대칭성 붕괴, 자기 조직화, 기계화학적 피드백 및 활성 액토마이오신 네트워크의 기타 창발적 행동과 같이 모터에 의해 구동되는 비평형 역학의 물리적 원리를 조사하기 위한 최소한의 조정 가능한 활성 물질 플랫폼 역할을 하며, 이는 활성 물질 물리학 및 재료 공학 분야와도 관련될 가능성이 있습니다18,19,20,21,22,23,35,36.
프로토콜
This protocol was developed by incorporating myosin-I into the well-established actin comet-tail bead motility system14,15,16,17 to mimic and investigate the role of myosin-I in modulating branched actin assembly and force generation at the leading edge. It is intended to complement the original primary research article (Xu et al.18) by providing the experimental details, analysis workflow, troubleshooting strategies, and limitations required to reproduce and adapt the assay. This protocol uses full-length biotinylated Drosophila Myo1d because it functions optimally at 20°C–22°C37,38, the temperature commonly used in most in vitro reconstitution assays. A detailed description of the myosin biotinylation and purification procedures can be found in previous studies18,38,39,40.
1. Buffer preparation
- Prepare X buffer for neutravidin and NPF coating of beads with 10 mM 4-(2-hydroxyethyl)-1-piperazineethanesulfonic acid (HEPES; pH 7.5), 100 mM KCl, 1 mM MgCl₂, 100 µM CaCl₂, and 1 mM adenosine triphosphate (ATP).
- Prepare M buffer for myosin coating of beads with 20 mM HEPES (pH 7.5), 100 mM KCl, 1 mM MgCl₂, 1 mM ethylene glycol-bis(β-aminoethyl ether)-N,N,N′,N′-tetraacetic acid (EGTA), and 2 mM ATP.
- To prepare X buffer or M buffer, first prepare a HEPES stock solution adjusted to pH 7.5 at room temperature. Add KCl, MgCl₂, CaCl₂ (for X buffer) or EGTA (for M buffer), followed by ATP, and then bring the buffer to the final volume with double-distilled water.
- Filter the buffer through a 0.22 µm syringe filter before use. Degassing is not required for routine bead-coating experiments. Keep the filtered buffer on ice until use.
NOTE: Always prepare buffers containing ATP or dithiothreitol (DTT) fresh for optimal results. Store freshly prepared X buffer and M buffer on ice for up to 3–4 days.
- Prepare a 100 mg/mL bovine serum albumin (BSA) stock solution in double-distilled water for blocking. Filter the solution through a 0.22 µm syringe filter, aliquot 50 µL per tube, and store the aliquots at −80°C. Use aliquots within 3–6 months and avoid repeated freeze-thaw cycles.
- Prepare the bead storage buffers.
- Prepare the control bead storage buffer by diluting the 100 mg/mL BSA stock solution 100-fold with X buffer to obtain 1 mg/mL BSA in X buffer.
- Prepare the myosin bead storage buffer by diluting the 100 mg/mL BSA stock solution 100-fold with M buffer to obtain 1 mg/mL BSA in M buffer.
- Prepare 2× motility buffer containing 40 mM HEPES (pH 7.5), 200 mM KCl, 2 mM MgCl₂, 2 mM EGTA, and 0.4% methylcellulose (viscosity: 1500 cP). Store the buffer at 4°C for up to 1 month. Mix gently before use to ensure homogeneity and avoid introducing bubbles.
CAUTION: Handle all chemicals according to institutional laboratory safety procedures. Wear appropriate personal protective equipment during buffer preparation.
2. Bead preparation
NOTE: Coat carboxylate polystyrene beads (2.0-µm diameter) with NPFs and neutravidin following previously published protocols14,15,16,17, with modifications for myosin coating18. Use glutathione S-transferase (GST)-tagged WCA domain from human neuronal Wiskott–Aldrich syndrome protein (N-WASP) as the NPF (GST-VCA). The protocol below is designed to prepare 50 µL of bead slurry and can be scaled to 100–200 µL as required.
- Neutravidin and NPF coating
- Prepare a 50 µL NPF and neutravidin coating mixture by mixing 5 µL of GST-VCA (1 mg/mL), 10 µL of neutravidin at the desired concentration, and 35 µL of X buffer. Mix gently by pipetting up and down 5–10 times while avoiding bubble formation.
NOTE: Use the following reference neutravidin concentrations to obtain different myosin-to-NPF coating ratios18: 8.3 µM (0.5 mg/mL) for a myosin:NPF molar ratio of 0.28:1; 16.7 µM (1 mg/mL) for a myosin:NPF molar ratio of 0.35:1; 33.3 µM (2 mg/mL) for a myosin:NPF molar ratio of 0.43:1; and 83.3 µM (5 mg/mL) for a myosin:NPF molar ratio of 0.80:1. Select the neutravidin concentration according to the desired myosin-to-NPF coating ratio. For standard comet-tail motility experiments, use the 0.43:1 myosin-to-NPF ratio, which provides robust myosin coating while maintaining sufficient NPF density for Arp2/3-dependent actin assembly. Lower ratios (0.28:1 or 0.35:1) can be used to evaluate lower myosin surface densities, whereas the 0.80:1 ratio can be used to examine higher myosin loading. Because increasing the neutravidin concentration can alter both myosin recruitment and the effective NPF surface density, validate the coating ratio by sodium dodecyl sulfate–polyacrylamide gel electrophoresis (SDS-PAGE) (See section 2.3) or fluorescence-based surface-density measurements when adapting the assay to new protein preparations or experimental conditions. - Transfer 5 µL of bead slurry to a microcentrifuge tube. Wash the beads with 10 µL of X buffer by pipetting at least five times. Pellet the beads by centrifugation at 16,000 × g for 2 min at 4°C. Carefully remove the supernatant by tilting the tube and aspirating from the side opposite the bead pellet.
- Resuspend the washed beads in 50 µL of the coating mixture. Mix the suspension by gentle pipetting and leave a small air bubble in the suspension to facilitate mixing during incubation. Incubate the beads on a benchtop rotator at 20 rpm for 2 h at 4°C. Pellet the beads by centrifugation at 16,000 × g for 2 min at 4°C and carefully remove the supernatant containing excess neutravidin and GST-VCA.
- Resuspend the coated beads in 200–400 µL of 10 mg/mL BSA prepared by diluting the 100 mg/mL BSA stock solution in X buffer. Incubate the suspension on ice for 30 min to block unoccupied binding sites on the bead surface. Pellet the beads by centrifugation at 16,000 × g for 2 min at 4°C and carefully remove the supernatant.
- Resuspend the beads in 50 µL of 1 mg/mL BSA prepared in X buffer. Pellet the beads by centrifugation at 16,000 × g for 2 min at 4°C, carefully remove the supernatant, and repeat the wash twice.
NOTE: After the coating reaction, gently resuspend the beads by pipetting up and down 5–7 times while avoiding bubble formation. The bead suspension should appear well dispersed, with no visible aggregates or clumps. Do not use bead preparations showing extensive aggregation, poor resuspension, or obvious bead loss, as these conditions can result in uneven coating and reduced assay reproducibility. - Store the coated beads in 1 mg/mL BSA prepared in X buffer on ice. Use the coated beads within one week.
NOTE: Store the coated beads on ice in 1 mg/mL BSA prepared in X buffer for up to one week before proceeding to fluorescent labeling or myosin decoration. Before use, gently resuspend the beads by pipetting and visually inspect the suspension for aggregation, poor resuspension, or obvious bead loss. Do not use bead preparations showing extensive aggregation or poor recovery after storage.
- Prepare a 50 µL NPF and neutravidin coating mixture by mixing 5 µL of GST-VCA (1 mg/mL), 10 µL of neutravidin at the desired concentration, and 35 µL of X buffer. Mix gently by pipetting up and down 5–10 times while avoiding bubble formation.
- Fluorescent labeling and biotinylated myosin decoration
- Exchange the storage X buffer with M buffer before myosin coating.
- Divide 50 µL of neutravidin-NPF-coated beads equally into two microcentrifuge tubes (25 µL per tube).
- Pellet the beads by centrifugation at 16,000 × g for 2 min at 4°C and carefully remove the supernatant. Wash the beads with 25 µL of 1 mg/mL BSA prepared in M buffer. Pellet the beads by centrifugation at 16,000 × g for 2 min at 4°C, carefully remove the supernatant, and repeat the wash twice.
- Resuspend the control beads in 25 µL of 1 µM biotin-CF640 fluorescent dye diluted from the stock solution in M buffer.
- Resuspend the myosin beads in 25 µL of 500 nM – 1 µM biotinylated myosin supplemented with 1–5 µM calmodulin.
- Cover the tubes with aluminum foil and incubate the bead suspensions on ice for at least 30 min. Pellet the beads by centrifugation at 16,000 × g for 2 min at 4°C and carefully remove the supernatant containing excess biotinylated myosin or fluorescent dye.
- Wash the decorated beads with 25 µL of 1 mg/mL BSA prepared in M buffer. Pellet the beads by centrifugation at 16,000 × g for 2 min at 4°C, carefully remove the supernatant, and repeat the wash twice.
- Store the far-red fluorescent dye decorated beads or myosin-decorated beads in 1 mg/mL BSA prepared in M buffer on ice. Supplement the myosin-decorated beads with 1–5 µM calmodulin and protect all decorated beads from light by covering the tubes with aluminum foil. Use the far-red fluorescent dye–decorated beads within one week and the myosin-decorated beads within 2–3 days.
NOTE: Use 500 nM – 1 µM biotinylated myosin for bead decoration. Select the working concentration according to the desired myosin surface ratio and the activity of the myosin preparation. For standard bead motility experiments, use 1 µM biotinylated myosin to promote robust myosin decoration under the coating conditions described above. Lower concentrations, such as 500 nM, may be used when reducing myosin surface density or when testing new protein preparations. Verify the final myosin surface density by SDS-PAGE (See section 2.3), fluorescence-based measurements, or comparison with previously calibrated coating conditions when adapting the assay. Include calmodulin in molar excess over myosin to maintain myosin-I lever-arm occupancy during bead decoration. For standard experiments, use 1–5 µM calmodulin together with 500 nM – 1 µM myosin. Use the higher end of this range when using higher myosin concentrations. The optimal calmodulin concentration may need to be adjusted for different myosin-I isoforms or protein preparations. The usable storage time of myosin-decorated beads may vary depending on the retained activity of the immobilized myosin molecules. Best performance is usually obtained when the beads are used immediately after coating. Store decorated beads on ice, protected from light, until use. Before using stored decorated beads, gently resuspend the bead suspension by pipetting up and down 5–7 times and inspect a small aliquot by light or fluorescence microscopy. Suitable bead preparations should remain well dispersed, show minimal aggregation, and retain detectable, relatively uniform fluorescence when fluorescent labels are present. Small clusters containing three to five beads are acceptable; however, preparations showing extensive aggregation, poor resuspension, weak fluorescence, obvious bead loss, or excessive bead adhesion to the tube should not be used. For myosin-decorated beads, verify assay performance by comparison with a previously validated bead preparation because storage can reduce the activity of immobilized myosin molecules. Bead preparations that no longer show the expected differences between myosin-coated and control beads should not be used.
- Exchange the storage X buffer with M buffer before myosin coating.
- Determination of myosin-to-NPF coating ratio
- Transfer 20 µL of bead slurry from each bead type (control and myosin beads) into separate microcentrifuge tubes. Pellet the beads by centrifugation at 16,000 × g for 2 min at 4°C and carefully remove the supernatant. Wash the beads with 25 µL of M buffer. Pellet the beads by centrifugation at 16,000 × g for 2 min at 4°C, carefully remove the supernatant, and repeat the wash once to remove BSA from the storage buffer.
NOTE: Adequate removal of BSA is achieved by performing two sequential washes with M buffer and carefully removing the supernatant after each centrifugation step without disturbing the bead pellet. If residual BSA contamination is suspected, perform an additional M buffer wash before adding SDS sample buffer. Avoid bead preparations with poor pellet recovery or excessive bead loss, as inconsistent bead recovery can affect the accuracy of the myosin coating ratio determined by SDS-PAGE. - Resuspend the washed beads in 20 µL of 1× Laemmli sample buffer. Boil the samples for 5 min. Pellet the beads by centrifugation for 15 s in a benchtop microcentrifuge. Store the samples at −20°C until gel electrophoresis.
NOTE: Store the prepared bead samples at −20°C until ready for electrophoresis. - Prepare the BSA standard series by mixing 5 µL of 2 mg/mL BSA standard with 5 µL of 2× sample buffer. Boil the mixture for 5 min. Dilute the mixture 20-fold with 1× sample buffer to obtain a final concentration of 50 ng/µL.
- Load 1 µL of the diluted BSA standard to obtain 50 ng of total protein.
- Load 2 µL of the diluted BSA standard to obtain 100 ng of total protein.
- Load 5 µL of the diluted BSA standard to obtain 250 ng of total protein.
- Load 10 µL of the diluted BSA standard to obtain 500 ng of total protein.
- Load 20 µL of the diluted BSA standard to obtain 1,000 ng of total protein.
- Prepare the neutravidin, GST-VCA, and myosin standards by mixing 5 µL of each 1 mg/mL protein solution with 5 µL of 2× sample buffer to obtain a final concentration of 0.5 mg/mL. Boil the samples for 5 min and load 2 µL of each sample to obtain 1 µg of protein per lane.
- Load the samples onto a 4%–20% gradient polyacrylamide gel.
- Load 5 µL of the prestained protein ladder.
- Load 2 µL of the 0.5 mg/mL neutravidin standard.
- Load 2 µL of the 0.5 mg/mL GST-VCA standard.
- Load 2 µL of the 0.5 mg/mL myosin standard.
- Load 20 µL of each bead sample into separate lanes.
- Load the BSA standards prepared in Steps 2.3.3.1–2.3.3.5.
- Run the gel in 1× SDS-PAGE running buffer at 110 V for 30 min.
CAUTION: Methanol and acetic acid used in the destaining solution are flammable and corrosive. Handle these reagents using appropriate personal protective equipment and institutional laboratory safety procedures. - Stain the gel with Coomassie Brilliant Blue for 10 min with gentle rocking. Destain the gel overnight in a solution containing 10% methanol and 7.5% acetic acid. Acquire gel images using a gel imaging system.
NOTE: For densitometric analysis, acquire images using exposure settings that keep all protein bands within the linear detection range. Avoid overexposed images in which the myosin, NPF, or standard protein bands appear saturated. When possible, use an automatic exposure mode optimized to avoid saturation, or acquire multiple exposure times and use the shortest exposure that clearly resolves all relevant bands without saturated pixels. Use the same imaging settings for all gels that will be quantitatively compared. - Quantify band intensities using image analysis software (Fiji/ImageJ) and the Gel Analysis tool.
- Open the gel image in Fiji. If necessary, convert the image to 8-bit grayscale by selecting Image > Type > 8-bit.
- If necessary, invert the image so that protein bands appear as peaks by selecting Edit > Invert.
- Use the rectangular selection tool to draw a region of interest (ROI) around the first lane, ensuring that the ROI includes the full vertical region containing the relevant bands. Select Analyze > Gels > Select First Lane.
- Move the same rectangular ROI to the next lane and select Analyze > Gels > Select Next Lane. Repeat this procedure for all BSA standards, purified protein standards, and bead samples using the same ROI size.
- After all lanes have been selected, generate intensity profiles by selecting Analyze > Gels > Plot Lanes.
- Use the straight-line tool to define the baseline for each peak, then use the wand tool to select the peak area corresponding to each band of interest. Record the integrated peak area for each band.
- Perform background correction by drawing the baseline consistently for each lane using the local background immediately adjacent to the peak while avoiding neighboring bands or uneven gel regions. Apply the same baseline and peak-selection criteria to all standards and bead samples.
- Generate a standard curve using the BSA standards corresponding to 50, 100, 250, 500, and 1,000 ng of total protein per lane.
- Plot the background-corrected integrated peak area versus total BSA mass and perform linear regression using spreadsheet or graphing software.
- Verify that the standard curve shows strong linearity (R2 > 0.98) without obvious saturation or plateauing of the highest-intensity bands.
- If the standard curve is nonlinear or if any quantified bands are saturated, reacquire the gel image using a shorter exposure or repeat the gel using a lower sample load.
- Use the calibration curve to determine the myosin-to-NPF coating ratio.
- Determine the total protein amount in the bead samples and purified protein standards by interpolation within the linear range of detection.
- Calculate the corresponding myosin-to-NPF coating ratio for each bead type.
- When establishing new coating conditions or modifying the protocol, perform measurements using replicate bead preparations or replicate gels.
- For routine experiments, compare the measured coating ratio with previously validated preparations.
- Repeat the coating or quantification if the measured ratio falls outside the expected range or if replicate measurements are inconsistent.
- Transfer 20 µL of bead slurry from each bead type (control and myosin beads) into separate microcentrifuge tubes. Pellet the beads by centrifugation at 16,000 × g for 2 min at 4°C and carefully remove the supernatant. Wash the beads with 25 µL of M buffer. Pellet the beads by centrifugation at 16,000 × g for 2 min at 4°C, carefully remove the supernatant, and repeat the wash once to remove BSA from the storage buffer.
3. Actin comet-tail bead motility assay
- Standard bead motility assay
- Prepare actin from rabbit skeletal muscle acetone powder according to the published purification protocol41. Purify monomeric globular actin (G-actin) by size-exclusion chromatography using a Sephacryl S-300 column equilibrated with G-buffer containing 2 mM Tris-HCl (pH 8.0), 0.2 mM ATP, 0.1 mM CaCl₂, 1 mM NaN₃, and 0.5 mM DTT. Store the purified G-actin on ice at 4°C and use it within 2–3 weeks.
- Purify the Arp2/3 complex from bovine brain according to the published protocol42. Divide the purified protein into single-use aliquots, flash-freeze the aliquots, and store at −80°C.
- Express and purify human CapZ according to the published protocol43. Divide the purified protein into single-use aliquots, flash-freeze the aliquots, and store at −80°C.
- Purify calmodulin according to the published protocol44. Aliquot the purified protein and store the aliquots at −20°C.
NOTE: Assess the quality of purified Arp2/3 complex, CP (CapZ), and calmodulin before use. Evaluate protein purity by Coomassie-stained SDS-PAGE. Acceptable preparations should exhibit the expected major protein bands with minimal degradation or contaminating bands. Determine protein concentration by measuring the absorbance at 280 nm or by using a standard colorimetric protein assay (e.g., Bradford assay) with freshly thawed aliquots. Do not use protein aliquots showing visible precipitation, repeated freeze–thaw cycles, or substantial degradation on SDS-PAGE. For activity assessment, Arp2/3 complex activity can be verified by its ability to promote NPF-dependent actin assembly in a pyrene-actin polymerization assay or by robust branched actin comet-tail formation in the bead motility assay. CapZ activity can be assessed by its ability to modulate actin filament growth and comet-tail morphology in the bead assay, or by a barbed-end capping assay when needed. Calmodulin quality is assessed by SDS-PAGE and by its ability to support myosin-I activity in motility assays. When using a new protein preparation, compare assay performance with a previously validated preparation before using it for quantitative experiments. - Prepare a 50 µL motility mixture containing 4 µM G-actin (including 5%–10% fluorescently labeled G-actin), 200 nM Arp2/3 complex, 6.5–200 nM CP, 2 µM calmodulin, and 3 µL bead slurry (1.5 µL myosin-coated beads and 1.5 µL control beads) in a final buffer containing 20 mM HEPES (pH 7.5), 100 mM KCl, 1 mM MgCl₂, 1 mM EGTA, 1 mM MgATP, 40 mM DTT, 10 mg/mL BSA, and 0.2% methylcellulose.
- Add 25 µL of 2× motility buffer.
- Add 6 µL of double-distilled water.
- Add 2 µL of 1 M DTT.
- Add 1 µL of 50 mM ATP.
- Add 1 µL of 50 mM MgCl₂.
- Add 5 µL of 100 mg/mL BSA.
- Add 1 µL of 100 µM calmodulin.
- Add 1 µL of 10 µM Arp2/3 complex.
- Add 1 µL of 325 nM–10 µM CP.
- Add 3 µL of bead slurry containing 1.5 µL myosin-coated beads and 1.5 µL control beads.
NOTE: Mix the motility mixture gently by slowly pipetting up and down 3–5 times. Avoid vortexing, rapid pipetting, or introducing bubbles, as these can disrupt protein complexes and affect actin polymerization. - Initiate the reaction by adding 4 µL of 50 µM G-actin containing 5%–10% fluorescently labeled G-actin. Mix immediately and designate this time point as t = 0.
NOTE: After G-actin addition and mixing, load the reaction chamber and begin image acquisition as quickly as possible. For reproducible kinetic measurements, start imaging within 1–2 min after t = 0 and no later than 3 min after reaction initiation. Record the actual delay between G-actin addition and the start of imaging and account for this delay when plotting time-dependent comet-tail growth.
- Chamber preparation
- Clean glass slides and coverslips with 70% ethanol followed by deionized water. Plasma-clean the glass surfaces with ambient air plasma for 10 min.
- Immediately after preparing the motility mixture, apply 2.3 µL of the reaction mixture to a glass slide. Place a 22 mm × 22 mm coverslip over the sample to form a squeeze chamber with an approximate chamber height of 4.3 µm. Seal the chamber with vacuum grease and begin imaging immediately.
NOTE: Chamber height is controlled by using a fixed sample volume and a 22 mm × 22 mm coverslip, which produce a reproducible thin chamber when the sample spreads evenly across the coverslip area. The approximate chamber height can be estimated from the sample volume divided by the coverslip area and may also be verified empirically by measuring the z-distance between the slide and coverslip surfaces using fluorescent beads or surface-bound fluorescent markers. Use the same sample volume, coverslip size, and chamber assembly procedure for all experiments to maintain consistent chamber geometry. Before imaging, inspect the chamber visually and under the microscope. The sample should fill the central imaging region evenly without large air bubbles, incomplete spreading, or obvious leakage. Do not image regions near air bubbles, vacuum grease edges, or areas where the coverslip appears unevenly seated. Prepare a new chamber if the sample does not spread evenly, contains large air bubbles, or shows substantial drift caused by leakage or poor sealing.
CAUTION: Handle plasma-cleaning equipment according to institutional laboratory safety procedures. Follow appropriate precautions when handling glass slides and coverslips to minimize the risk of injury.
- Bead motility assay with disrupted myosin power stroke
- Pre-incubate G-actin stored in G-buffer containing 2 mM Tris-Cl (pH 8.0), 0.2 mM ATP, 0.5 mM DTT, 0.1 mM CaCl₂, and 1 mM NaN₃ with 200 µM EGTA and 50 µM MgCl₂ for 5 min on ice to convert G-actin to Mg-G-actin before use.
- Prepare a 50 µL motility mixture for calcium experiments by replacing calmodulin with 1.1 mM CaCl₂ to disrupt the myosin power stroke.
- Add 25 µL of 2× motility buffer.
- Add 6 µL of double-distilled water.
- Add 2 µL of 1 M DTT.
- Add 1 µL of 50 mM ATP.
- Add 1 µL of 50 mM MgCl₂.
- Add 5 µL of 100 mg/mL BSA.
- Add 1 µL of 55 mM CaCl₂.
- Add 1 µL of 10 µM Arp2/3 complex.
- Add 1 µL of 325 nM–10 µM CP.
- Add 3 µL of bead slurry containing 1.5 µL myosin-coated beads and 1.5 µL control beads.
NOTE: Mix the reaction gently until all components are evenly distributed before initiating actin polymerization.
NOTE: The final reaction contains 1.1 mM total CaCl2 and approximately 1.0 mM EGTA, yielding an estimated free Ca2+ concentration on the order of 10−4 M. Based on the excess CaCl2 over EGTA, the free Ca2+ concentration is approximately 100 µM. More precise calcium-buffer calculations using MaxChelator or a similar tool that accounts for EGTA, Mg2+, ATP, pH, and temperature estimate the free Ca2+ concentration to be approximately 80–100 µM. - Initiate the reaction by adding 4 µL of 50 µM Mg-G-actin containing 5–10% fluorescently labeled G-actin. Mix immediately and designate this time point as t = 0.
- Prepare the imaging chamber as described in Step 3.1.6.
- Microscope imaging
- Acquire fluorescence images at 25°C using an epifluorescence microscope equipped with a 100× oil-immersion objective (numerical aperture 1.4), an external metal-halide light source, a charge-coupled device (CCD) camera, and image acquisition software.
- Image fluorescent actin using a rhodamine/TRITC filter set and image far-red fluorescent dye–labeled beads using a Cy5/far-red fluorescence filter set.
- Acquire images in 16-bit mode using 1 × 1 or 2 × 2 camera binning. Keep the camera gain, illumination intensity, exposure time, and filter set identical for all samples that will be quantitatively compared.
NOTE: Before collecting quantitative data, adjust the illumination intensity and exposure time using a representative field of view so that the actin comet-tail signal is clearly detectable but not saturated. Check the image histogram to confirm that the maximum pixel intensity remains below the saturation limit of the camera. Use the lowest illumination intensity and shortest exposure time that provide a sufficient signal-to-noise ratio. Do not compare fluorescence intensities across samples acquired with different exposure times, camera gain, binning, or illumination settings.
- Begin image acquisition immediately after reaction initiation. Acquire time-lapse image sequences from fields containing both myosin-coated and control beads. Identify the control beads using the far-red fluorescence channel.
- Acquire images every 5–15 s for 20 min using an exposure time of 100–200 ms per frame. Compare the comet-tail growth kinetics of myosin-coated and control beads within the same field of view.
NOTE: In most experiments, comet tails elongate at an approximately constant velocity during the first ~10 min after symmetry breaking. Elongation slows as reagents become depleted and typically ceases approximately 30 min after reaction initiation18. - To assess comet-tail morphology independently of early growth dynamics, incubate the motility mixture in a microcentrifuge tube for 15–20 min at room temperature to allow comet tails to develop.
- Apply 2.3 µL of the reaction mixture to a glass slide and assemble a squeeze chamber as described in Step 3.1.6. Image the entire chamber area and acquire representative images containing both myosin-coated and control beads. Identify the control beads using the far-red fluorescence channel and compare comet-tail morphology within the same field of view.
NOTE: For direct comparison, select imaging fields that contain both myosin-coated and control beads, are evenly illuminated, in focus, and are located away from chamber edges, vacuum grease, large air bubbles, or regions with incomplete filling. Exclude beads that are aggregated, overlap with neighboring beads, lie partially outside the field of view, or cannot be reliably segmented because of imaging artifacts or poor focus. Use the same acquisition settings for all fields within an experiment. Before sampling, gently stir the reaction mixture with a clean pipette tip 5–7 times to maintain an even bead distribution. Do not mix by pipetting because vigorous aspiration and dispensing may disrupt the actin comet-tail network or detach the bead from the comet tail. If stabilization of the actin network is required, add phalloidin before sampling15,18. For reactions containing 4 µM actin, add phalloidin to a final concentration of 4 µM, corresponding to an approximately equimolar ratio with actin. Incubate the reaction on ice for 3–5 min, protected from light, before sampling.
- Acquire fluorescence images at 25°C using an epifluorescence microscope equipped with a 100× oil-immersion objective (numerical aperture 1.4), an external metal-halide light source, a charge-coupled device (CCD) camera, and image acquisition software.
4. Quantification analysis of actin comet-tail growth kinetics and network density
NOTE: Analyze and quantify all images using Fiji, an open-source image processing platform based on ImageJ (version 2.16.0/1.54p; https://imagej.net/software/fiji/)45.
- Actin comet-tail growth rate
- Measure the actin comet-tail length at each time point using the Segmented Line tool in Fiji. Manually trace the comet tail from the distal end of the tail to the center of the bead for each image and convert the measured length to micrometers.
- Plot comet-tail length as a function of time. Fit the first 7–10 time points, corresponding to the initial linear growth phase, using linear regression. Determine the comet-tail growth rate from the slope of the fitted line and report the value in µm/s or µm/min.
NOTE: Select the regression window from the early phase in which comet-tail length increases approximately linearly with time. In most experiments, this corresponds to the first 7–10 time points after symmetry breaking or after clear comet-tail elongation begins. Use the same selection criterion for all beads within the same experiment. If growth begins at slightly different times for different beads, define the first point of the regression window as the first time point at which a polarized comet tail is clearly visible and elongating. Include only consecutive time points that show monotonic or near-monotonic tail extension and fit the data by linear regression. The selected regression window should show strong linearity, with no obvious plateau, stall, or abrupt change in growth behavior. Exclude beads from growth-rate analysis if they do not form a clear polarized comet tail, exhibit stalled or highly non-linear growth during the initial measurement window, detach from the comet tail, leave the field of view, overlap with neighboring beads or comet tails, or are affected by poor focus or saturated fluorescence.
- Actin comet-tail network density
- Define the comet-tail ROI using the actin fluorescence channel in Fiji. Apply an intensity threshold that separates comet-tail fluorescence from the local background using Image > Adjust > Threshold. Apply the same thresholding criteria to all control and myosin-coated beads acquired within the same field of view using identical imaging settings. Inspect the thresholded ROI manually and exclude beads for which the comet-tail boundary cannot be clearly distinguished from the background. Measure the mean fluorescence intensity within the comet-tail ROI and designate this value as Icomet.
- Reposition the same ROI to a nearby region lacking comet-tail fluorescence. Measure the mean background intensity and designate this value as Ibackground.
- Calculate the corrected comet-tail intensity (Icorr,comet) using:

- Use Icorr,comet as a proxy for actin network density.
NOTE: Because the comet tail grows and changes shape over time, the comet-tail ROI does not need to have identical dimensions at each time point. Define the ROI using the same thresholding method throughout each experiment, such as the Triangle or Yen auto-threshold method or a manually selected threshold range. For background subtraction, reposition an identical copy of the comet-tail ROI to a nearby region lacking comet-tail fluorescence while avoiding neighboring beads, actin networks, air bubbles, or uneven illumination. Apply the same thresholding method, ROI selection procedure, and background-selection criteria consistently to all samples acquired under identical imaging conditions.
- Actin comet fluorescent assembly rate
- Measure the total integrated fluorescence intensity of the comet-tail ROI at each time point using the same ROI selection procedure described in Step 4.2. Perform background subtraction using an adjacent region lacking comet-tail fluorescence.
- Plot the corrected total integrated fluorescence intensity as a function of time. Fit the first 7–10 time points using linear regression and use the initial slope as the actin fluorescent assembly rate.
NOTE: Under the imaging conditions described above, noticeable photobleaching is typically not observed during time-lapse acquisition, and no photobleaching correction is routinely applied. However, if substantial photobleaching is observed, estimate the bleaching rate from a stable fluorescent reference region or control sample acquired under the same imaging conditions. Normalize the comet-tail fluorescence intensity using the reference decay curve before fitting the initial actin fluorescence assembly rate.
- Actin comet growth efficiency
- Calculate the actin comet growth efficiency by dividing the comet-tail growth rate by the actin fluorescent assembly rate:

- Use this parameter to estimate the distance traveled by the bead per unit of actin assembly as an indicator of how efficiently actin assembly is converted into bead advancement.
NOTE: Calculate growth efficiency for each bead individually before averaging across beads. For each bead, determine the tail growth rate and fluorescence assembly rate from the same initial linear growth window, then calculate the growth efficiency for that bead. Average the individual bead values within each experimental condition, such as control beads and myosin-coated beads. For paired comparisons, compare control and myosin-coated beads acquired within the same field of view because they experience identical reaction and imaging conditions, thereby minimizing field-to-field variability. For quantitative analysis, analyze at least 10–20 beads per condition from each independent experiment when sufficient analyzable beads are available. Repeat the assay using at least three independent bead preparations or experimental days when establishing or comparing assay conditions. Perform image measurements using identical image analysis settings, thresholding criteria, ROI selection procedures, and background-subtraction methods throughout each experiment. The analyses described in Steps 4.1–4.4 were performed manually using the standard image analysis tools without custom macros.
- Calculate the actin comet growth efficiency by dividing the comet-tail growth rate by the actin fluorescent assembly rate:
결과
세포 선단부(cell leading edge)에서 Arp2/3 복합체 매개 가지형 액틴 조립에 미치는 myosin-I 활성의 영향을 조사하기 위해 액틴 혜성-꼬리 비드 운동성 분석(actin comet-tail bead motility assay)이 사용되었으며, 이는 막 결합 myosin-I이 액틴 중합과 협력하여 막 돌출을 유도하는 시나리오를 재현한 것입니다7,8,9,10,11,12,13. 막-액틴 계면에서 myosin-I과 NPF의 공동 국소화를 모사하기 위해, 두 단백질을 마이크로 규모 비드 표면에 공동 코팅하여 조절된 in vitro 시스템에서 이들의 공간적 근접성을 재구성하였습니다(그림 1A,B).
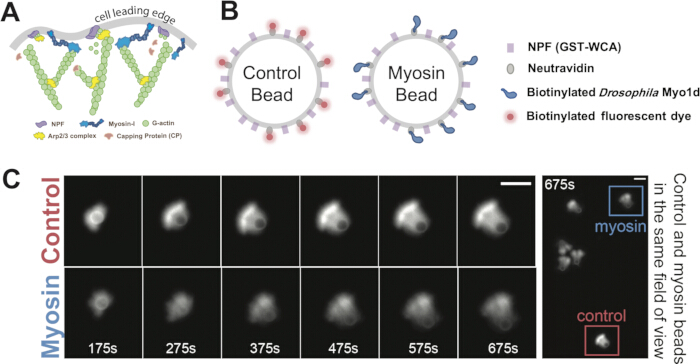
그림 1마이크로 스케일 비드 상에서의 myosin-I 매개 분지형 액틴 조립의 재구성. (A) 세포 전면부(leading edge)에서 myosin-I, 핵 형성 촉진 인자(NPFs), actin-related protein 2/3 (Arp2/3) 복합체, 캡핑 단백질(CP) 및 구상 액틴(G-actin) 간의 상호작용을 보여주는 모식도. (B) 비드 기능화 모식도. 대조군 비드와 미오신 코팅 비드는 NPF 및 뉴트라비딘(neutravidin)으로 코팅되었다. 뉴트라비딘은 대조군 비드의 경우 비오틴화된 원적외선 형광 염료에, 또는 비오틴화된 초파리 마이오신 코팅 비드를 위한 Myo1d.C) 대조군 비드와 미오신이 코팅된 비드에서 대칭 붕괴부터 극성 혜성 꼬리 형성까지의 액틴 혜성 꼬리 성장을 보여주는 대표적 시계열 이미지. 마지막 패널은 동일한 시야 내의 두 비드를 보여준다. 스케일 바, 5 µm패널 B와 C는 Xu 등의 연구에서 재현/수정되었습니다. 사이언스 어드밴시스(Science Advances), DOI: 10.1126/sciadv.ado5788 (2024), AAAS, 허가 하에 사용. 이 그림의 더 큰 버전을 보려면 여기를 클릭하십시오.
액틴 조립에 대한 myosin-I의 특정한 기여도를 더 정확하게 평가하기 위해, 이에 대응하는 대조군 비드를 함께 제작하였다. 대조군 비드는 myosin-I 대신 neutravidin이 접합된 biotinylated far-red 형광 염료를 사용했다는 점을 제외하고는 myosin이 코팅된 비드와 동일하였다(그림 1B). 두 종류의 비드를 동일한 반응 챔버 내에서 혼합하고 동일한 시야에서 이미징함으로써, 동일한 실험 조건 하에서 myosin-I의 존재 및 부재 시 가지형 액틴 조립을 직접적으로 비교할 수 있었다(그림 1C). 또한, 비드 표면의 myosin 대 NPF 비율을 변화시킴으로써, 서로 다른 표면 밀도에 따른 myosin-I의 효과를 체계적으로 조사할 수 있었다(그림 2A,B). 아울러, CP의 농도를 조절하여 액틴 네트워크 밀도를 조정함으로써, 조밀하게 채워져 대칭 붕괴에 저항하는 구조부터 느슨하게 구성되어 파손되기 쉬운 구조까지 다양한 네트워크를 생성하였다15,19,24. 이러한 접근 방식을 통해 밀도와 구조적 무결성이 서로 다른 네트워크 전반에서 myosin-I가 가지형 액틴 조립에 어떻게 영향을 미치는지 연구할 수 있었다(그림 2A,B).
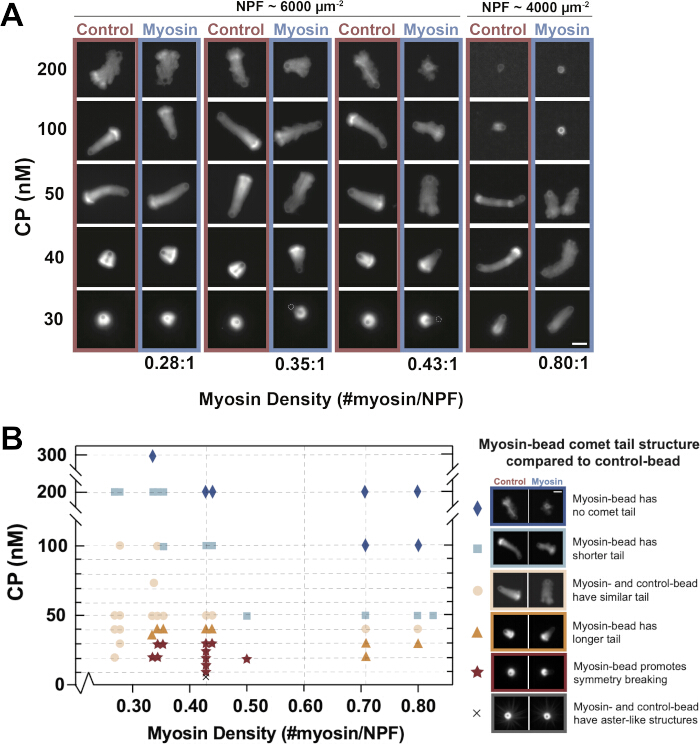
그림 2. 액틴 혜성-꼬리 형태(Actin comet-tail morphology) 마이오신 표면 밀도 및 캡핑 단백질 농도 전반에 걸쳐. (A) 2-의 대표 형광 이미지µm서로 다른 마이오신 표면 밀도로 코팅되고 30~200 nM의 캡핑 단백질(CP)이 포함된 반응액에서 조립된 직경의 비드, 4 µM 5% 로다민 표지 액틴과 200 nM Arp2/3가 포함된 액틴 복합체. 각 조건에 대해, 대조군 비드와 미오신 코팅 비드를 동일한 시야에서 촬영하였다. 미오신 및 핵 형성 촉진 인자(NPF)의 표면 밀도는 단계 2.3에서 설명한 대로 도데실 황산나트륨-폴리아크릴아미드 겔 전기영동을 통해 결정하였다. 이미지는 반응 시작 후 20~35분 후에 획득하였다. 밝기와 대비는 각 대조군-미오신 비드 쌍 내에서 선형적으로 동일하게 조정되었으나, 시각화를 위해 조건 간에는 독립적으로 스케일을 조정하였다. 스케일 바, 5 µm. (B) CP 농도 및 myosin 표면 밀도에 따른 comet-tail 결과물을 요약한 정성적 분석 맵. 각 데이터 포인트는 표시된 조건 하에서의 대조군-myosin 비드 쌍을 나타낸다. 기호는 대칭 붕괴를 촉진하는 myosin 코팅 비드, 더 긴 꼬리, 유사한 꼬리, 더 짧은 꼬리, comet-tail 미형성 또는 aster 유사 구조를 포함하여 관찰된 결과물을 나타낸다. 데이터는 20회 이상의 독립적인 실험에서 수집되었으며, 각 조건당 10쌍 이상의 비드 쌍을 분석하였다. 이 그림은 Xu et al.에서 재현/수정되었다. Science Advances, DOI: 10.1126/sciadv.ado5788 (2024), AAAS, 허가 하에 사용. 이 그림의 더 큰 버전을 보시려면 여기를 클릭하십시오.
분석 성분들을 혼합하면, 표면에 결합된 NPFs가 비드 표면 주변에서 Arp2/3 복합체 매개 분지형 액틴 조립을 촉진했습니다. 전형적인 성공적인 반응에서는 액틴이 먼저 비드를 둘러싸는 희소한 껍질(shell) 형태로 나타났습니다. 중합이 진행됨에 따라 껍질이 확장되었고 네트워크는 더 조밀하게 얽히게 되었습니다. 비드 표면에서 액틴 조립이 지속되면서 네트워크의 외부 성장이 유도되었으며, 이는 대칭성 붕괴와 극성 혜성 꼬리(comet tail)의 형성으로 이어질 수 있었습니다. 혜성 꼬리가 형성되면, 비드 표면에서 지속적인 액틴 핵 형성 및 중합이 일어나 비드의 지속적인 이동을 뒷받침했습니다(그림 1C). 이러한 액틴 껍질 형성, 대칭성 붕괴, 혜성 꼬리 확장 및 비드 추진으로 이어지는 순차적 특징들은 분석이 적절하게 작동하고 있음을 보여주는 시각적 지표가 되었습니다.
당사의 기존 연구18에서 보고하고 그림 2A,B에서 보여준 바와 같이, 코멧 꼬리(comet-tail) 형태는 CP 농도와 미오신 표면 밀도 모두에 민감하게 반응했습니다. 표준 분석 조건(200 nM Arp2/3 complex, 50 nM CP, myosin:NPF 비율 = 0.43:1)에서 미오신이 코팅된 비드는 일반적으로 대조군 비드보다 더 희소하거나 확산된 액틴 코멧 꼬리를 형성했습니다(그림 2A). 낮은 CP 농도(<30 nM)에서는 액틴이 조밀하고 파손에 강한 껍질 형태로 조립되었습니다. 이러한 조건에서 대조군 비드는 종종 캡슐화된 상태로 남아 대칭 붕괴(symmetry breaking)가 일어나지 않은 반면, 미오신 코팅 비드는 대칭을 붕괴시키고 주변 액틴 껍질에서 탈출할 가능성이 더 높았습니다(그림 2A,B). 높은 CP 농도(>200 nM)에서는 네트워크 응집력이 감소했으며, 미오신의 존재는 액틴 네트워크를 더욱 불안정하게 만들어 액틴 탈락(shedding)을 촉진하고 안정적인 코멧 꼬리의 형성을 방해했습니다(그림 2A,B). 이러한 조건 의존적 결과는 연구자가 적절한 분석 체계를 식별하고 분석 성능의 문제를 해결하는 데 사용할 수 있는 유용한 기준을 제공합니다.
액틴 코멧 꼬리(comet-tail) 형태에 미치는 myosin-I의 영향은 꼬리의 평균 형광 강도를 측정하여 평가할 수 있습니다. 단계 4.2에서 설명한 대로 강도 임계값을 사용하여 코멧 꼬리 영역을 정의한 다음, 이 영역 내의 평균 형광 강도를 측정하였습니다(그림 3A). 대조군 및 myosin 코팅 비드를 동일한 시야에서 촬영한 동일 이미지 조건 하에서, 이 값은 액틴 네트워크 밀도를 나타내는 상대적이고 보정되지 않은 대리 지표로 사용되었으며, 평균 강도가 낮을수록 네트워크가 더 희소함을 나타냅니다. 표준 분석 조건에서 myosin 코팅 비드는 일반적으로 대조군 비드보다 평균 형광 강도가 낮은 코멧 꼬리를 생성하였으며, 이는 겉보기 네트워크 밀도가 감소한 것과 일치합니다(그림 3C).
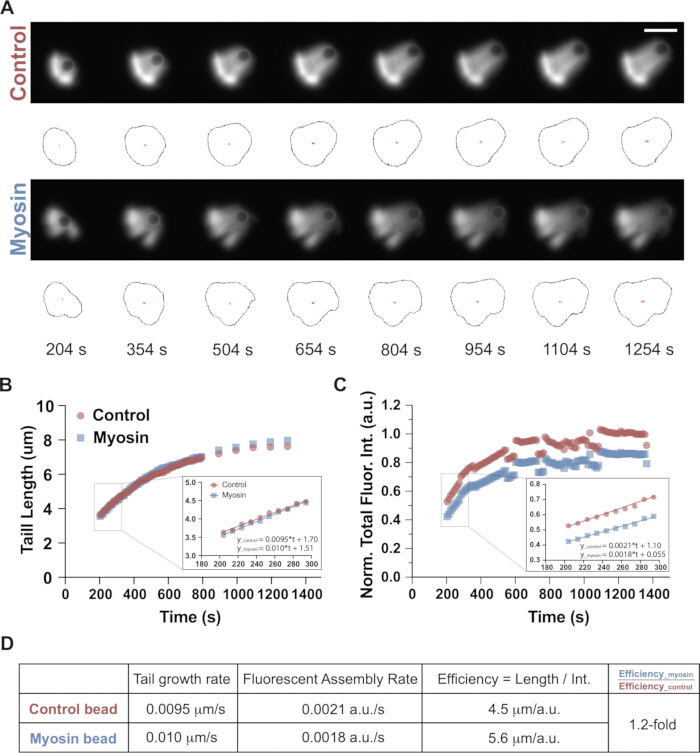
그림 3액틴 코멧-테일(comet-tail) 성장 kinetics 및 조립 효율의 정량화 워크플로. (A) 50 nM capping protein(CP) 존재 하에서 대조군 비드와 0.43:1 마이오신 코팅 비드의 코멧 꼬리 성장을 나타내는 대표적 시계열 이미지. 검은색 외곽선은 형광 강도 측정을 위해 Fiji를 사용하여 설정한 코멧 꼬리 관심 영역(ROI)을 나타냄. 반응 조건: 4 µM 5% 로다민 표지 액틴이 포함된 액틴, 200 nM 액틴 관련 단백질 2/3 (Arp2/3) 복합체 및 50 nM CP. 스케일 바, 5 µm. (B(A) 패널에 표시된 대표적인 대조군-미오신 비드 쌍에 대해 시간에 따른 혜성 꼬리 길이를 도식화한 그래프. 삽입도는 선형 회귀 분석에 사용된 시간 범위를 보여주며, 꼬리 성장률은 적합된 직선의 기울기로부터 결정되었다.C) 패널 (A)에 제시된 대표적인 대조군-미오신 비드 쌍에 대해 시간에 따른 정규화된 총 꼬리 형광 강도를 도식화한 그래프이다. 대조군 및 미오신 비드는 1100초에서 1300초 사이의 대조군 비드 평균 형광 강도로 정규화되었다. 삽입도는 선형 피팅에 사용된 시간 범위를 나타내며, 형광 조립 속도는 피팅된 직선의 기울기로부터 계산되었다. (D(A) 패널에 표시된 대표적인 대조군-마이오신 비드 쌍의 꼬리 성장률, 형광 조립 속도 및 성장 효율을 나타낸 요약 표. 이 그림의 확대 버전을 보시려면 여기를 클릭하십시오.
comet-tail 성장 역학에 미치는 myosin-I의 효과는 시간에 따른 comet-tail 신장과 actin 형광 축적을 모두 측정하여 정량화할 수 있다. 대부분의 실험에서 comet tail은 대칭성 붕괴 후 처음 ~10분 동안 거의 일정한 속도로 성장했다. 중합 성분이 고갈됨에 따라 신장 속도는 점차 느려졌으며, 일반적으로 반응 시작 후 약 30분 뒤에 정지했다. 성장 역학을 정량화하기 위해 comet-tail 길이와 총 형광 강도를 시간의 함수로 도식화했다(Figure 3B,C). 초기 선형 단계에 해당하는 처음 7–10개의 데이터 포인트는 선형 회귀를 사용하여 피팅했다(Figure 3B,C, 삽입도). 이 피팅의 기울기는 각각 초기 tail 성장 속도와 actin 형광 조립 속도를 나타낸다. 성장 효율은 comet-tail 성장 속도를 actin 형광 조립 속도로 나눈 값으로 정의하며, 이는 actin 중합이 생산적인 비드 변위로 얼마나 효과적으로 전환되었는지를 정량화한 것이다(Figure 3D). Figure 3A–D에 제시된 대표적인 예에서 myosin이 코팅된 비드는 0.60 µm/min (0.010 µm/s)의 tail 성장 속도를 보였으며, 이는 대조군 비드의 0.57 µm/min (0.0095 µm/s)과 대비된다(Figure 3B,D). 이에 해당하는 성장 효율은 각각 5.6 및 4.5 µm/intensity unit였으며, myosin 코팅 비드가 약 1.2배 더 높은 값을 나타냈다(Figure 3D). 표준 조건에서 myosin 코팅 비드는 일반적으로 대조군 비드와 유사한 성장 속도를 보였으며(myosin: 0.69 ± 0.10 µm/min; control: 0.66 ± 0.20 µm/min), 더 낮은 actin 형광 조립 속도(대조군의 약 0.76배)와 약 1.4배 더 높은 성장 효율을 보였는데, 이는 이전의 원본 연구18에서 보고된 바와 같다. 이 값들은 5회의 독립적인 실험을 통해 조건당 11쌍의 비드로부터 얻은 평균 ± SD로 보고되었다. 통계 분석은 원본 연구18에 기술된 대로 양측 paired t-test를 사용하여 수행되었다.
마이오신 파워 스트로크(power stroke)의 기여도를 평가하고 관찰된 효과가 마이오신 표면 점유로 인한 입체 장애(steric hindrance)에서 비롯되었을 가능성을 배제하기 위해, 마이오신-I 파워 스트로크 활성을 저해하는 조건에서 비드 운동성 분석(bead motility assay)을 수행할 수 있습니다. 본 프로토콜에서는 반응 혼합물에 1.1 mM Ca2+를 첨가하여 마이오신-I 모터 활성을 억제하였습니다. 상승된 Ca2+ 농도는 마이오신-I 레버 암(lever arm)에서 칼모듈린(calmodulin)의 해리를 촉진하여 레버 암의 강성을 감소시키고 힘 생성 능력을 저하시켰습니다46,47,48. 이러한 조건에서 마이오신-I는 액틴과 동적으로 결합된 상태를 유지했으나 액틴 글라이딩(actin gliding)은 지원하지 않았으며(그림 4A,B), 이는 모터 활성 의존적 효과를 평가하기 위한 유용한 대조군이 됩니다18.
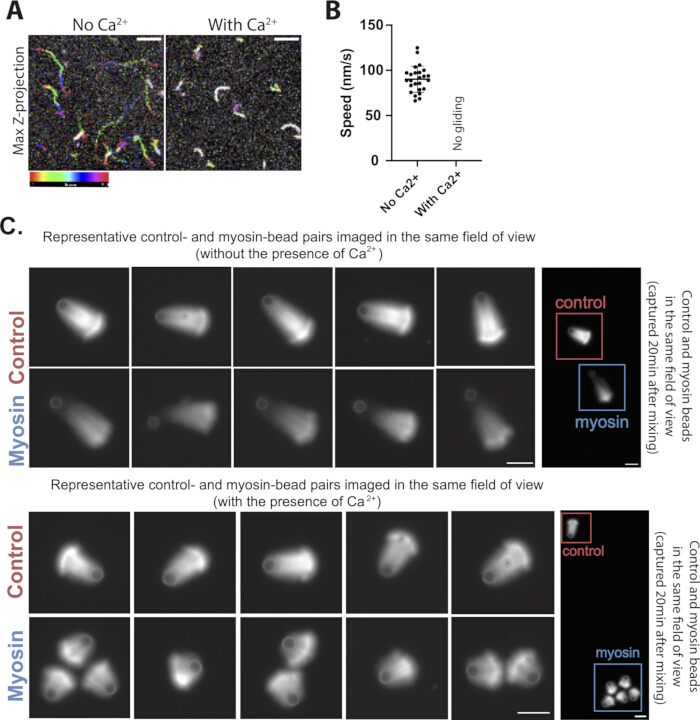
그림 4비드 운동성 분석에서 Myo1d 모터 활성을 평가하기 위한 칼슘 기반 대조군. (A) 칼슘 농도가 높지 않을 때 Myo1d가 코팅된 표면 위에서 이동하는 액틴 필라멘트와, 칼슘 농도가 높을 때 비생산적인 소용돌이 패턴을 형성하는 액틴 필라멘트의 시간 압축 이미지 100 µM 유리 칼슘. 무지개색 컬러바는 5초 간격으로 획득한 61프레임 동안의 시간 경과를 나타냅니다. 스케일 바, 5 µm. (B) actin gliding 속도의 정량화: [물질명] 부재 시 및 존재 시 100 µM 유리 칼슘 (N = 2회 독립 실험; n = 25개 필라멘트). ~가 존재할 때는 생산적인 액틴 글라이딩이 관찰되지 않았다. 100 µM 이 조건에서의 유리 칼슘. 오차 막대는 표준편차(SD)를 나타냄. (C) ~의 존재 하 또는 부재 하에 조립된 대표적인 대조군 및 미오신 코팅 비드 쌍 100 µM 유리 칼슘. 각 조건에 대해 5개의 대표적인 비드 쌍을 보여준다. 각 쌍 내에서 대조군 비드와 미오신 코팅 비드를 동일한 시야에서 촬영하였다. 이미지는 반응 시작 후 약 15~20분 후에 획득하였다. 밝기와 대비는 각 대조군-미오신 비드 쌍 내에서 선형적으로 동일하게 조정되었으나, 조건 간에는 독립적으로 조정되었다. 반응 조건: 4 µM 5% 로다민 표지 액틴이 포함된 액틴, 200 nM 액틴 관련 단백질 2/3 (Arp2/3) 복합체 및 50 nM 캡핑 단백질 (CP). 스케일 바, 5 µm패널 A와 B는 Xu 등의 문헌에서 재현/수정되었습니다. 사이언스 어드밴시스(Science Advances), DOI: 10.1126/sciadv.ado5788 (2024), AAAS, 허가 하에 사용됨. 이 그림의 더 큰 버전을 보시려면 여기를 클릭하십시오.
분석이 정확하게 수행되었을 때, 고농도 Ca2+ 조건에서 분석된 myosin 코팅 비드는 대조군 비드와 유사한 네트워크 밀도를 가지면서 더 짧은 actin 코멧 꼬리를 형성하였다(그림 4C). 두 번의 독립적인 실험에서 얻은 다섯 쌍의 대표적인 대조군 및 myosin 코팅 비드가 제시되어 있다. 이러한 정성적 결과는 반복적인 분석 준비 과정에서 일관되게 관찰되었으며, 기존 연구18에서 보고된 정량적 분석에 의해 뒷받침된다. 이러한 예상 결과는 표준 조건에서 관찰된 네트워크 차이가 단순한 myosin 표면 점유도가 아니라 활성 myosin 파워 스트로크(power stroke)에 의존함을 나타낸다. 따라서 고농도 Ca2+ 조건은 분지형 actin 네트워크 조직의 변화가 myosin 모터 활성으로 인해 발생하는지 평가하는 핵심 대조군 역할을 한다.
토론
액틴 꼬리-비드 운동성 분석(actin comet-tail bead motility assay)은 Arp2/3 복합체 매개 분지형 액틴 조립과 돌출력 생성에서의 역할을 연구하기 위해 잘 확립된 in vitro 재구성 시스템입니다14,15,16,17. 이 시스템은 분지형 액틴 조립의 생화학적 조절14,15,26,27,31,49,50,51 및 힘 생성20,21,22,23,52을 분석하는 데 널리 적용되어 왔으며, 액틴 네트워크의 창발적 활성 물질 특성에 대한 정량적 연구를 위한 틀을 제공해 왔습니다19,35,36,53. 이 재구성 시스템에 마이오신, 특히 myosin-I18을 통합함으로써, 수정된 분석법을 통해 마이오신-액틴 결합이 막 계면에서의 액틴 조립 및 힘 생성에 어떻게 영향을 미치는지 조사할 수 있으며, 이는 상대적으로 연구가 부족한 분야입니다. 특히, 이 시스템에서 myosin-I은 다른 마이오신 모터로 쉽게 교체될 수 있어 액틴 네트워크 리모델링 및 힘 생성에서 각각의 역할을 조사할 수 있습니다. 예를 들어, myosin V (화물 운송)54, myosin VI (엔도사이토시스 수송 및 막 역학)55,56, myosin VII 및 XV (부동모 및 미세융모 조직화)57,58,59, myosin X (사상위족 형성)60,61, 그리고 myosin XIX (미토콘드리아 역학)62을 도입하여 서로 다른 클래스의 마이오신이 액틴 조직화와 관련 생리적 과정에 어떻게 기여하는지 연구할 수 있습니다.
몇 가지 핵심 파라미터를 세심하게 제어한다면 본 분석법은 매우 높은 재현성을 보입니다. 첫째, 강력한 꼬리(comet-tail) 형성을 위해서는 고품질의 단량체 G-actin이 필수적입니다. 확립된 프로토콜41을 사용하여 토끼 골격근 아세톤 분말로부터 G-actin을 정제할 것을 권장합니다. 2~3일간의 투석 후, 단량체 액틴은 G-buffer(2 mM Tris-HCl, pH 8.0; 0.2 mM ATP; 0.1 mM CaCl2; 1 mM NaN3; 및 0.5 mM DTT) 내의 Sephacryl S-300 겔 여과를 통해 추가로 정제되어야 합니다. 용출 피크 직후에 수집된 분획을 사용해야 합니다. 정제된 G-actin은 4°C 얼음 위에서 보관할 때 일반적으로 2~3주 동안 강력한 중합 활성을 유지하며 4주 차까지 사용 가능할 수 있으나, 그 이후에는 일반적으로 성능이 저하됩니다. 희소하고 부서지기 쉬운 액틴 네트워크와 일관성 없는 꼬리 성장을 특징으로 하는 꼬리 강도의 저하는 흔히 액틴 품질의 저하를 나타냅니다. 둘째, NPF 활성은 꼬리 형성 여부를 결정짓는 결정적인 요소입니다. 인간 신경계 Wiskott–Aldrich 증후군 단백질(N-WASP) 유래 상용 GST-태그 WCA 도메인(GST-VCA)은 강력하고 지속적인 핵 생성 활성을 제공하며, GST 이량체화는 이러한 활성을 더욱 향상시킵니다63. 비드 코팅 전에 pyrene-actin 중합 분석법을 사용하여 모든 NPF 구성물의 활성을 검증할 것을 권장합니다. 상용 GST-VCA의 활성을 참조 표준으로 사용할 수 있습니다. 특히, 여기서 사용된 상용 GST-VCA는 polyproline 영역이 없어 profilin–actin 복합체와 상호작용하지 않습니다26. 셋째, 꼬리 성장의 신뢰성 있는 시각화를 위해서는 슬라이드와 커버슬립의 세심한 준비가 필요합니다. 슬라이드와 커버슬립을 물과 에탄올로 철저히 세척한 후, 사용 직전에 플라스마 세척을 수행할 것을 권장합니다. 가능하다면 비특이적 단백질 흡착을 최소화하고 재현성을 높여주는 polyethylene glycol–silanized 커버슬립26을 사용하는 것이 좋습니다. 이동성 혼합액에 적절한 농도의 BSA를 포함하면 비특이적 표면 상호작용을 더욱 줄이고 일관된 분석 성능을 촉진할 수 있습니다. 넷째, 챔버에 투입하는 시료의 부피는 신뢰할 수 있는 측정에 매우 중요합니다15,16,17. 시료 부피가 너무 많으면 비드가 표류하여 꼬리 신장을 정확하게 추적할 수 없습니다. 반대로 시료 부피가 부족하면 슬라이드와 커버슬립 사이에 비드가 압착되어 마찰이 증가하고 비드가 고정됩니다. 이러한 기계적 제약은 꼬리의 형태를 왜곡하고 측정된 성장 역학을 변화시킬 수 있습니다. 따라서 재현성 있는 결과를 얻기 위해서는 챔버 높이와 시료 부피를 모두 최적화하는 것이 필수적입니다. 각 실험 설정에 맞게 시료 부피를 경험적으로 최적화할 것을 권장합니다. 본 설명과 같이 22 mm × 22 mm 커버슬립을 사용할 때, 2.1–2.3 µL의 이동성 혼합액을 투입하면 챔버 높이가 약 4.3 µm가 되어, 과도한 표류나 압착 없이 2.0-µm-diameter 비드가 안정적으로 배치됩니다. 다른 크기의 커버슬립을 사용하는 경우, 균일한 챔버 채움, 안정적인 비드 배치 및 최소한의 시료 표류를 달성하기 위해 시료 부피를 그에 맞게 조정해야 합니다.
코멧 꼬리(comet tails)가 형성되지 않는 경우, 액틴 중합 능력과 NPF 활성을 확인하십시오. 대칭 붕괴가 일어나지 않는 경우, CP 농도를 조절하여 네트워크 밀도를 조정하십시오. 네트워크 밀도가 지나치게 높으면 파괴에 저항하며, 너무 낮으면 구조적 무결성이 부족해집니다. 마이오신 코팅 비드가 대조군 비드와 차이가 없는 경우, 마이오신의 표면 밀도와 모터 활성을 확인하십시오. 품질 관리를 위한 수락 기준은 절대적인 수치 컷오프가 아닌 기능적 기준을 따릅니다. 다음과 같은 경우 새로운 조제물이 적합한 것으로 간주합니다. 이는 이전에 검증된 조제물에서 관찰된 혜성 꼬리 형성 및 성장을 재현합니다(다음에 나타난 바와 같이). 그림 3). 또한, 마이오신(myosin), Arp2/3 복합체, NPF, CapZ 또는 액틴(actin)의 각 새로운 제제는 사용 전 적절한 품질 관리 분석법을 통해 평가되어야 하며, 정량적 실험 전반의 일관성을 보장하기 위해 이전에 검증된 제제와 비교되어야 합니다(참조 프로토콜 섹션 3.1).
결과를 해석할 때 이 분석법의 몇 가지 제한 사항을 고려해야 합니다. 첫째, 형광 강도는 액틴 네트워크 밀도를 나타내는 상대적이고 보정되지 않은 대리 지표로 사용됩니다. 따라서 동일한 획득 설정으로 이미징하고 동일한 임계값 설정 워크플로우를 사용하여 분석한 샘플 간에만 비교를 수행해야 합니다. 둘째, 비드 운동성, 코멧 꼬리(comet-tail) 성장 및 성장 효율은 힘을 생성하는 네트워크 동작에 대한 간접적인 판독값을 제공하지만, 힘의 직접적인 측정값은 아닙니다. 네트워크에 의해 생성되는 힘을 정량화하려면 광학 트래핑(optical trapping)이나 힘-보정된 막 변형 분석64,65과 같은 직접적인 기계적 측정이 필요합니다. 셋째, 이 분석법은 필라멘트 방향, 분지 밀도 또는 국소 마이오신(myosin) 구성과 같은 액틴 네트워크의 초미세 구조를 직접적으로 분해하지 못합니다. 나노스케일 구조 특성 분석을 위해서는 전자 현미경이나 초고해상도 이미징과 같은 상보적인 접근 방식이 필요할 수 있습니다. 마지막으로, 강성인 마이크론 크기의 비드를 사용하는 것은 단순하고 실험적으로 다루기 쉬운 인터페이스를 제공하지만, 세포막의 변형 가능성, 곡률의 불균질성, 지질 유동성 또는 분자적 복잡성을 모두 포착하지는 못합니다. 따라서 세포 선단부(leading edge)에서 세포골격 성분들이 어떻게 협동하는지 조사하기 위해서는 생리학적으로 더 관련성 높은 인터페이스의 향후 개발이 중요할 것입니다.
전반적으로, 이러한 재구성 접근 방식은 단백질 조성과 농도를 정밀하게 제어할 수 있게 하여, 세포 시스템에서는 달성하기 어려운 방식으로 개별 구성 요소들을 기계론적으로 분석할 수 있게 합니다. 이는 분자 모터가 분지형 액틴 네트워크를 어떻게 재구성하고 막 유사 인터페이스에서 힘 생성을 어떻게 형성하는지 연구하기 위한 다각적인 플랫폼을 제공합니다. 적절한 검증을 거치면, 이 분석법은 서로 다른 마이오신 클래스, 돌연변이 또는 질환 관련 모터 변이체, 그리고 힘-민감성 액틴 결합 단백질이 동적인 액틴 네트워크 내에서 기계적 피드백을 어떻게 조절하는지 조사하는 데까지 확장될 수 있습니다. 더 넓게는, 이 시스템은 분자 규모의 모터 활성을 중간 규모의 세포골격 구조 및 기계적 기능과 연결하는 데 도움을 주며, 이는 세포 이동성, 내세포작용 및 막 재구성에 시사하는 바가 큽니다.
공개 사항
저자들은 경쟁 관계에 있는 재정적 이해관계나 이해상충이 없음을 밝힙니다.
감사의 글
단백질 정제 과정에서 훌륭한 기술적 지원을 제공해주신 Daniel Safer 박사와 Rick Wike 님께 감사드립니다. Arp2/3 복합체와 CapZ 단백질을 너그럽게 제공해주신 Roberto Dominguez 박사, 특히 Malgorzata Boczkowska 박사와 Grzegorz Rebowski 박사님께 감사드립니다. 또한 프로젝트 전반에 걸쳐 귀중한 의견을 주신 Luther Pollard 박사, Faviolla A. Báez-Cruz 박사, 그리고 Ostap 및 Dominguez 연구실의 모든 구성원분께 감사드립니다. 본 연구는 국립보건원(National Institutes of Health) 연구비 R37 GM057247 (E.M.O. 수혜)의 지원을 받았습니다. E.M.O.와 M.X.는 국립과학재단(National Science Foundation, CMMI-1548571)의 부분적인 지원을 받았습니다. 원고 수정 과정에서 언어 교정을 위해 ChatGPT가 사용되었습니다. 저자들은 AI가 보조한 모든 내용을 검토 및 수정하였으며, 최종 원고에 대해 모든 책임을 집니다.
재료
| 이름 | 회사 | 카탈로그 번호 | 댓글 |
|---|---|---|---|
| 아데노신 5'-삼인산 (Adenosine 5'-triphosphate)′-삼인산 이나트륨염 수화물 | 시그마 | A26209 | ATP 함유 완충액 조제에 사용하며, 소분하여 다음 조건에서 보관하십시오. −20°C. |
| Arp2/3 복합체 | 자체 제작됨 | 제공된 텍스트가 없습니다. 번역할 내용을 입력해 주세요. | 분지형 액틴 네트워크의 핵형성을 위해 사용됨; 문헌 42에 따라 정제됨. |
| Biotin-CF640 형광 염료 | Biotium | 80032 | 대조군 비드의 형광 표지에 사용함; 차광하여 다음 온도에서 보관할 것 −80°C. |
| 비오틴화된 Myo1d | 자체 제작됨 | 제공된 텍스트가 없습니다. 번역할 내용을 입력해 주세요. | myosin이 코팅된 비드에 부착하는 데 사용된 모터 단백질; 문헌 18 및 38에 기술된 방법으로 준비함–40. |
| 소 혈청 알부민 | 시그마 | A7906 | 비드 블로킹 및 비드 보관 버퍼로 사용하며, 필터링된 스톡 솔루션을 준비하십시오. |
| 염화칼슘 | 시그마 | C7902 | X 버퍼 및 칼슘 파괴 실험에 사용된 버퍼 성분. |
| 칼모듈린 | 자체 제작 | 제공된 텍스트가 없습니다. 번역할 내용을 입력해 주세요. | myosin 함유 반응액 및 비드 보관 버퍼에 첨가됨; 문헌 44에 따라 정제됨. |
| 카복실화 폴리스티렌 비드 (2.0 µm 지름) | Polysciences | 18327-10 | NPF, NeutrAvidin, 형광 염료 및 미오신 코팅을 위한 고체 지지체로 사용하며, 다음 조건에서 보관하십시오. 4°C. |
| CCD 카메라 | Teledyne | 01-RET-R6-R-M-14-C-OC | 타임랩스 현미경 관찰 중 형광 이미지 획득에 사용됩니다. |
| Coomassie Brilliant Blue 염색 | 시그마 | B7920 | 밀도 분석(densitometric analysis) 전 SDS-PAGE 겔을 염색하는 데 사용됩니다. |
| 커버슬립, 22 mm × 22 mm, #1.5 | 글로브 | 1404-15 | 현미경 슬라이드와 함께 사용하여 압착 챔버(squeeze chamber)를 구성하는 데 사용됩니다. |
| 디티오트레이톨 (DTT) | GoldBio | DTT10 | 완충액 및 운동성 혼합물에 사용되는 환원제; 보관 온도 −20°C. |
| 건식 스크롤 진공 펌프 | Agilent Technologies | IDP3B01 | 플라스마 세척 시스템을 작동하는 데 사용됩니다. |
| EGTA | GoldBio | E-217-100 | M 버퍼, 운동성 버퍼 및 액틴 전처리에 사용되는 칼슘 킬레이트제. |
| 외부 광원 | Leica | EL6000 | 형광 현미경용 금속 할라이드 광원. |
| Fiji (ImageJ) | 오픈 소스 | 제공된 텍스트가 없습니다. 번역할 내용을 입력해 주세요. | 코멧 꼬리 길이, 형광 강도 및 네트워크 밀도 분석에 사용됨 (버전 2.16.0/1.54p). |
| 형광 현미경 | Leica | DMIRB | 액틴 꼬리(actin comet tails) 영상을 촬영하는 데 사용된 도립 에피형광 현미경. |
| 빙초산 | Fisher Chemical | BP2401-212 | SDS-PAGE 겔 탈색 용액의 성분; 부식성 물질이므로 적절한 주의 사항을 준수하여 취급하십시오. |
| GST-VCA | 세포골격 | VCG03-A | Arp2/3 매개 액틴 조립에 사용되는 핵형성 촉진 인자; 소분하여 다음 온도에서 보관하십시오. −80°C. |
| HEPES | GoldBio | H-400-1 | X 버퍼, M 버퍼 및 운동성 버퍼(motility buffer)에 사용되는 완충제. |
| 인간 CapZ | 자체 제작함 | 제공된 텍스트가 없습니다. 번역할 내용을 입력해 주세요. | 액틴 네트워크 밀도를 조절하는 데 사용된 캡핑 단백질(Capping protein); 문헌 43에 따라 정제함. |
| 염화마그네슘 | Spectrum Chemical | M1035 | 반응 버퍼 및 액틴 전처리에 사용되는 버퍼 성분. |
| MetaMorph 이미징 소프트웨어 | Molecular Devices | 제공된 소스 텍스트가 없습니다. 번역할 내용을 입력해 주시기 바랍니다. | 현미경 제어 및 이미지 획득에 사용되었습니다 (버전 7.10.4.459). |
| 메탄올 | 시그마 | MX0485-3 | SDS-PAGE 겔 탈색 용액의 성분; 가연성 물질이므로 기관의 안전 절차에 따라 취급하십시오. |
| 메틸셀룰로오스 | 시그마 | M0387 | 용액의 점도(1500 cP)를 높이기 위해 운동성 완충액(motility buffer)에 첨가됨. |
| 현미경 슬라이드 | Corning | 2947-75X25 | 현미경 관찰용 스퀴즈 챔버(squeeze chamber) 조립에 사용됩니다. |
| NeutrAvidin 단백질 | Thermo Fisher Scientific | 31000 | 비오틴화된 단백질을 비드 표면에 고정하는 데 사용됩니다. 소분하여 다음 조건에서 보관하십시오. −80°C. |
| PageRuler Plus Prestained Protein Ladder | Thermo Scientific | 26619 | SDS-PAGE 분석에 사용되는 분자량 마커; 보관 온도: −20°C. |
| 플라즈마 세척기 | Harrick Plasma | PDC-32G | 챔버 조립 전 현미경 슬라이드와 커버글라스를 플라스마 세척하는 데 사용됩니다. |
| 폴리에테르설폰 시린지 필터, 0.22 µm | 시그마 | SLGPR33RS | 분주 전 소혈청알부민(bovine serum albumin) 스톡 용액을 여과하는 데 사용됨. |
| 염화칼륨 | Fisher BioReagents | BP366-1 | 분석 버퍼의 이온 강도를 유지하는 데 사용되는 염. |
| 토끼 골격근 액틴 | 자체 제작됨 | 제시된 텍스트가 없습니다. 번역할 내용을 입력해 주시기 바랍니다. | 참고문헌 41에 따라 정제하였으며, 액틴 꼬리 조립 분석(actin comet-tail assembly assays)을 위한 G-actin으로 사용하였다. |
| 냉장 마이크로원심분리기 | Eppendorf | EP-5415R | 비드 준비 및 세척 단계에서 비드 침전물(pellet)을 형성하는 데 사용됩니다. |
| 회전 튜브 믹서 (벤치탑 로테이터) | Cole-Parmer | EW-04397-40 | 비드 현탁액 상태를 유지하기 위해 비드 코팅 배양 중에 사용됩니다. |
| Tris/Glycine/SDS 전기영동 버퍼 (10×) | Bio-Rad | 1610732 | 1로 희석하십시오.× SDS-PAGE 전기영동 전. |
| 진공 그리스 | 고진공 장비 보관소 | 408524 | 형광 이미징 전 스퀴즈 챔버를 밀봉하는 데 사용됩니다. |
| 4%–20% 구배 SDS-폴리아크릴아마이드 겔 | Thermo Fisher Scientific | XP04205BOX | 비드 결합 단백질의 SDS-PAGE 분석에 사용됨; 보관 온도: 4°C. |
참고문헌
- Blanchoin L, Boujemaa-Paterski R, Sykes C, Plastino J. Actin dynamics, architecture, and mechanics in cell motility. Physiol Rev. 2014;94(1):235-63.
- Svitkina T. The actin cytoskeleton and actin-based motility. Cold Spring Harb Perspect Biol. 2018;10(1).
- Papalazarou V, Machesky LM. The cell pushes back: The Arp2/3 complex is a key orchestrator of cellular responses to environmental forces. Curr Opin Cell Biol. 2021;68:37-44.
- Krendel M, Gauthier NC. Building the phagocytic cup on an actin scaffold. Curr Opin Cell Biol. 2022;77:102112.
- Yang C, et al. Actin polymerization promotes invagination of flat clathrin-coated lattices in mammalian cells by pushing at lattice edges. Nat Commun. 2022;13(1):6127.
- Clarke DN, Martin AC. Actin-based force generation and cell adhesion in tissue morphogenesis. Curr Biol. 2021;31(10):R667-R80.
- McConnell RE, Tyska MJ. Leveraging the membrane-cytoskeleton interface with myosin-1. Trends Cell Biol. 2010;20(7):418-26.
- Almeida CG, et al. Myosin 1b promotes the formation of post-Golgi carriers by regulating actin assembly and membrane remodelling at the trans-Golgi network. Nat Cell Biol. 2011;13(7):779-89.
- McIntosh BB, Ostap EM. Myosin-I molecular motors at a glance. J Cell Sci. 2016;129(14):2689-95.
- Pedersen RTA, Drubin DG. Type I myosins anchor actin assembly to the plasma membrane during clathrin-mediated endocytosis. J Cell Biol. 2019;218(4):1138-47.
- Barger SR, et al. Membrane-cytoskeletal crosstalk mediated by myosin-I regulates adhesion turnover during phagocytosis. Nat Commun. 2019;10(1):1249.
- Manenschijn HE, et al. Type-I myosins promote actin polymerization to drive membrane bending in endocytosis. eLife. 2019;8.
- Smith SL, et al. Class-I myosin responds to changes in membrane tension during clathrin-mediated endocytosis in human induced pluripotent stem cells. Proc Natl Acad Sci U S A. 2026;123(9):e2532817123.
- Loisel TP, Boujemaa R, Pantaloni D, Carlier MF. Reconstitution of actin-based motility of Listeria and Shigella using pure proteins. Nature. 1999;401(6753):613-6.
- Akin O, Mullins RD. Capping protein increases the rate of actin-based motility by promoting filament nucleation by the Arp2/3 complex. Cell. 2008;133(5):841-51.
- Boujemaa-Paterski R, et al. Directed actin assembly and motility. Methods Enzymol. 2014;540:283-300.
- Sykes C, Plastino J. Reconstitution of actin-based motility with commercially available proteins. J Vis Exp. 2022;(188).
- Xu M, et al. Myosin-I synergizes with Arp2/3 complex to enhance the pushing forces of branched actin networks. Sci Adv. 2024;10(37):eado5788.
- Kawska A, et al. How actin network dynamics control the onset of actin-based motility. Proc Natl Acad Sci U S A. 2012;109(36):14440-5.
- Cameron LA, Footer MJ, van Oudenaarden A, Theriot JA. Motility of ActA protein-coated microspheres driven by actin polymerization. Proc Natl Acad Sci U S A. 1999;96(9):4908-13.
- Bernheim-Groswasser A, et al. The dynamics of actin-based motility depend on surface parameters. Nature. 2002;417(6886):308-11.
- van der Gucht J, Paluch E, Plastino J, Sykes C. Stress release drives symmetry breaking for actin-based movement. Proc Natl Acad Sci U S A. 2005;102(22):7847-52.
- Achard V, et al. A "primer"-based mechanism underlies branched actin filament network formation and motility. Curr Biol. 2010;20(5):423-8.
- Noireaux V, et al. Growing an actin gel on spherical surfaces. Biophys J. 2000;78(3):1643-54.
- Theriot JA, Mitchison TJ, Tilney LG, Portnoy DA. The rate of actin-based motility of intracellular Listeria monocytogenes equals the rate of actin polymerization. Nature. 1992;357(6375):257-60.
- Bieling P, et al. WH2 and proline-rich domains of WASP-family proteins collaborate to accelerate actin filament elongation. EMBO J. 2018;37(1):102-21.
- Funk J, et al. A barbed end interference mechanism reveals how capping protein promotes nucleation in branched actin networks. Nat Commun. 2021;12(1):5329.
- Gautreau AM, Fregoso FE, Simanov G, Dominguez R. Nucleation, stabilization, and disassembly of branched actin networks. Trends Cell Biol. 2022;32(5):421-32.
- Nakamura F, Osborn E, Janmey PA, Stossel TP. Comparison of filamin A-induced cross-linking and Arp2/3 complex-mediated branching on the mechanics of actin filaments. J Biol Chem. 2002;277(11):9148-54.
- Colin A, et al. Friction patterns guide actin network contraction. Proc Natl Acad Sci U S A. 2023;120(39):e2300416120.
- Colin A, et al. Recycling of the actin monomer pool limits the lifetime of network turnover. EMBO J. 2023;42(9):e112717.
- Suarez C, et al. Reconstitution of the transition from a lamellipodia- to filopodia-like actin network with purified proteins. Eur J Cell Biol. 2023;102(4):151367.
- Pollard LW, Boczkowska M, Dominguez R, Ostap EM. Myosin-1C differentially displaces tropomyosin isoforms altering their inhibition of motility. J Biol Chem. 2024;300(8):107539.
- Thompson CP, et al. Non-muscle tropomyosins inhibit myosin-19 and dynamically localize to mitochondrially associated actin filaments. J Biol Chem. 2026;302(5):111377.
- Bussonnier M, et al. Mechanical detection of a long-range actin network emanating from a biomimetic cortex. Biophys J. 2014;107(4):854-62.
- Paluch E, van der Gucht J, Joanny JF, Sykes C. Deformations in actin comets from rocketing beads. Biophys J. 2006;91(8):3113-22.
- Lewis JH, Lin T, Hokanson DE, Ostap EM. Temperature dependence of nucleotide association and kinetic characterization of Myo1b. Biochemistry. 2006;45(38):11589-97.
- Baez-Cruz FA, Ostap EM. Drosophila class-I myosins that can impact left-right asymmetry have distinct ATPase kinetics. J Biol Chem. 2023;299(8):104961.
- Lin T, Tang N, Ostap EM. Biochemical and motile properties of Myo1b splice isoforms. J Biol Chem. 2005;280(50):41562-7.
- Lebreton G, et al. Molecular to organismal chirality is induced by the conserved myosin 1D. Science. 2018;362(6417):949-52.
- Spudich JA, Watt S. The regulation of rabbit skeletal muscle contraction. I. Biochemical studies of the interaction of the tropomyosin-troponin complex with actin and the proteolytic fragments of myosin. J Biol Chem. 1971;246(15):4866-71.
- Boczkowska M, et al. X-ray scattering study of activated Arp2/3 complex with bound actin-WCA. Structure. 2008;16(5):695-704.
- Rao JN, Madasu Y, Dominguez R. Mechanism of actin filament pointed-end capping by tropomodulin. Science. 2014;345(6195):463-7.
- Putkey JA, Slaughter GR, Means AR. Bacterial expression and characterization of proteins derived from the chicken calmodulin cDNA and a calmodulin processed gene. J Biol Chem. 1985;260(8):4704-12.
- Schindelin J, et al. Fiji: an open-source platform for biological-image analysis. Nat Methods. 2012;9(7):676-82.
- Greenberg MJ, Ostap EM. Regulation and control of myosin-I by the motor and light chain-binding domains. Trends Cell Biol. 2013;23(2):81-9.
- Lewis JH, et al. Calcium regulation of myosin-I tension sensing. Biophys J. 2012;102(12):2799-807.
- Manceva S, et al. Calcium regulation of calmodulin binding to and dissociation from the Myo1c regulatory domain. Biochemistry. 2007;46(42):11718-26.
- Mullins RD, Bieling P, Fletcher DA. From solution to surface to filament: actin flux into branched networks. Biophys Rev. 2018;10(6):1537-51.
- Mooren OL, et al. Reconstitution of Arp2/3-nucleated actin assembly with proteins CP, V-1, and CARMIL. Curr Biol. 2024;34(22):5173-86.e4.
- Pollard LW, et al. Genetically inspired in vitro reconstitution of Saccharomyces cerevisiae actin cables from seven purified proteins. Mol Biol Cell. 2020;31(5):335-47.
- Marcy Y, Prost J, Carlier MF, Sykes C. Forces generated during actin-based propulsion: a direct measurement by micromanipulation. Proc Natl Acad Sci U S A. 2004;101(16):5992-7.
- Dayel MJ, et al. In silico reconstitution of actin-based symmetry breaking and motility. PLoS Biol. 2009;7(9):e1000201.
- Hammer JA 3rd, Sellers JR. Walking to work: roles for class V myosins as cargo transporters. Nat Rev Mol Cell Biol. 2011;13(1):13-26.
- Buss F, Kendrick-Jones J. How are the cellular functions of myosin VI regulated within the cell. Biochem Biophys Res Commun. 2008;369(1):165-75.
- Spudich JA, Sivaramakrishnan S. Myosin VI: an innovative motor that challenged the swinging lever arm hypothesis. Nat Rev Mol Cell Biol. 2010;11(2):128-37.
- Self T, et al. Shaker-1 mutations reveal roles for myosin VIIA in both development and function of cochlear hair cells. Development. 1998;125(4):557-66.
- Crawley SW, et al. Intestinal brush border assembly driven by protocadherin-based intermicrovillar adhesion. Cell. 2014;157(2):433-46.
- Houdusse A, Titus MA. The many roles of myosins in filopodia, microvilli and stereocilia. Curr Biol. 2021;31(10):R586-R602.
- Bohil AB, Robertson BW, Cheney RE. Myosin-X is a molecular motor that functions in filopodia formation. Proc Natl Acad Sci U S A. 2006;103(33):12411-6.
- Fitz GN, et al. Protrusion growth driven by myosin-generated force. Dev Cell. 2023;58(1):18-33.
- Quintero OA, et al. Human Myo19 is a novel myosin that associates with mitochondria. Curr Biol. 2009;19(23):2008-13.
- Zimmet A, et al. Cryo-EM structure of NPF-bound human Arp2/3 complex and activation mechanism. Sci Adv. 2020;6(23):eaaz7651.
- Giardini PA, Fletcher DA, Theriot JA. Compression forces generated by actin comet tails on lipid vesicles. Proc Natl Acad Sci U S A. 2003;100(11):6493-8.
- Upadhyaya A, Chabot JR, Andreeva A, Samadani A, van Oudenaarden A. Probing polymerization forces by using actin-propelled lipid vesicles. Proc Natl Acad Sci U S A. 2003;100(8):4521-6.
재인쇄 및 허가
이 논문이 게재되었습니다
동영상 곧 제공