본 연구는 세 가지 훈련 조건에 걸쳐 공간적 현존감, 팀 협응력, 학습 참여도, 인지 부하, 안전성 및 단기 학습 성과를 비교함으로써, 대규모 공간의 동일 위치 협업 가상현실 훈련 프로토콜을 평가합니다.
이 논문에서
요약
초록
대규모 공간 공동 배치 협업 가상현실(Large-space co-located collaborative virtual reality)은 참가자들이 공유된 몰입형 공간 내에서 이동하고 소통하며 행동을 조정할 수 있는 훈련 환경을 제공합니다. 그러나 이러한 구성이 데스크톱 기반 협업이나 분산형 룸 스케일 가상현실보다 공간적 현존감, 팀 조정 및 학습 참여도를 향상시키는지에 대한 근거는 여전히 제한적입니다. 본 연구에서는 42개의 3인 1조 팀으로 배정된 126명의 참가자를 대상으로 단일 센터, 3군 실험 프로토콜을 평가하였습니다. 각 팀은 데스크톱 협업 시뮬레이션, 룸 스케일 분산형 협업 가상현실, 또는 대규모 공간 공동 배치 협업 가상현실 군으로 무작위 배정되었습니다. 모든 팀은 8분간의 오리엔테이션, 20분간의 협업 응급 물류 및 공간 탐색 과제, 교육 직후 평가, 그리고 2주 후 유지 테스트를 수행하였습니다. 주요 결과 지표는 공간적 현존감, 자기 평가 팀 조정도, 관찰자 평가 팀 조정도 및 학습 참여도였습니다. 이차 결과 지표에는 지식 점수, 인지 부하, 시뮬레이터 불편감 및 과제 프로세스 지표가 포함되었습니다. 대규모 공간 공동 배치 협업 가상현실 군은 대조군들에 비해 더 높은 공간적 현존감, 팀 조정도 및 학습 참여도를 보였습니다. 지식 습득량은 대규모 공간 조건에서 더 높게 나타났으나, 보정된 교육 후 지식 및 2주 후 유지 지식은 조건 간에 유의미한 차이가 없었습니다. 인지 부하는 유의하게 증가하지 않았으며, 시뮬레이터 불편감은 평균적으로 가벼운 수준을 유지했습니다. 이러한 결과는 대규모 공간 공동 배치 협업 가상현실이 단순한 단기 지식 습득보다는 공간적 방향 감각, 역할 기반 조정 및 능동적인 팀 참여가 필요한 훈련 과제에 가장 유용할 수 있음을 시사합니다.
서론
몰입형 가상현실은 시각적 주의력과 신체 움직임을 상황별 실습과 연결함으로써, 평소에는 위험하거나 접근하기 어려운 환경에서의 시뮬레이션 기반 교육을 촉진합니다1. 최근의 연구들은 단순한 기술 시연을 넘어 증거 기반의 구현 단계로 나아가고 있으나2, 어떤 하드웨어 및 공간 구성이 협력적 학습 행동을 가장 잘 지원하는지에 대해서는 여전히 중요한 과제로 남아 있습니다. 공간적 존재감은 주의력과 체화에 영향을 미치는 반면3,4, 주관적인 몰입감만으로는 복잡한 팀 기반 작업을 수행하기에 불충분할 수 있습니다. 생산적인 협업을 위해서는 공유된 목표, 과업 상호 의존성 및 상호 실시간 모니터링이 필요합니다5.
최근의 연구들은 팀워크를 지원하는 공동 위치 가상 현실 및 체화된 협업에 대한 이해를 증진시켜 왔습니다. 하지만 서로 다른 공간 구조가 교육적 효과에 미치는 영향에 관한 실증적 근거는 여전히 일관되지 않은 상태입니다6. 본 연구의 주요 기여는 기능적으로 서로 다른 세 가지 협업 환경, 즉 데스크톱 협업 시뮬레이션, 룸 스케일 분산 가상 현실, 그리고 대규모 공간 공동 위치 협업 가상 현실을 체계적으로 평가한 것입니다. 이러한 조건들은 팀 기반 시뮬레이션의 서로 다른 구성을 나타내며, 협업 훈련 환경 전반에 걸쳐 시각적 몰입감과 공유된 물리적 이동성을 비교할 수 있게 합니다. 세 가지 구성의 물리적 배치는 그림 1에 예시되어 있습니다.
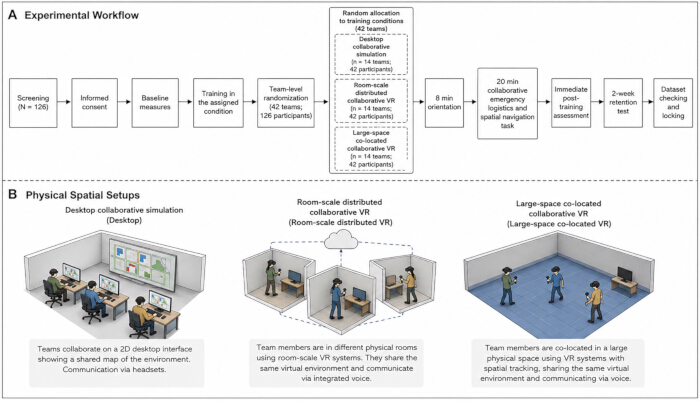
그림 1: 세 가지 협동 훈련 조건의 실험 워크플로우 및 물리적 공간 설정. (A) 참가자 선별 및 팀 단위 무작위 배정(N = 126명; 42팀)부터 2주 후 유지 테스트까지의 실험 워크플로우 개요. (B) 세 가지 훈련 환경의 도식적 설명. 왼쪽: 데스크톱 협동 시뮬레이션으로, 팀원들이 개별 워크스테이션을 사용하여 탐색하며 몰입형 시각적 노출 없이 지정된 오디오 채널을 통해 소통함. 중앙: 룸 스케일 분산 협동 가상 현실로, 참가자들이 각각 분리된 3 m × 3 m 물리적 트래킹 영역 내에 머물면서 시각적 몰입과 실시간 팀 소통을 경험함. 오른쪽: 대형 공간 공동 위치 협동 가상 현실로, 팀원들이 장애물이 없는 8 m × 8 m 공간을 공유함으로써 동기화된 물리적 이동, 체화된 공간 참조 및 실시간 공동 탐색이 가능함. 여기를 클릭하여 이 그림의 더 큰 버전을 확인하십시오.
훈련 프로토콜에는 협력적 응급 물류 및 공간 탐색 시나리오가 사용되었습니다. 개별적인 절차 교육과 달리, 이 시나리오는 공유된 물리적 방향 설정, 실시간 구두 조정 및 체화된 공간적 행동을 필요로 합니다. 이러한 특성은 대형 공간에 공동 배치된 협력적 가상현실의 어포던스를 평가하기 위한 구조화된 환경을 제공합니다. 그림 2는 가상현실 및 데스크톱 조건에서 사용된 인터페이스와 상호작용 모드를 보여줍니다. 체화된 학습 이론에 따르면 공간적 조작은 과업 요구 사항과 일치할 때 행위 주체성을 지원할 수 있으며7, 인지 부하 이론에 따르면 효과적인 그룹 작업은 불필요한 조정 부담을 가중시키지 않으면서 인지적 요구 사항을 분산시키는 것에 달려 있습니다8.
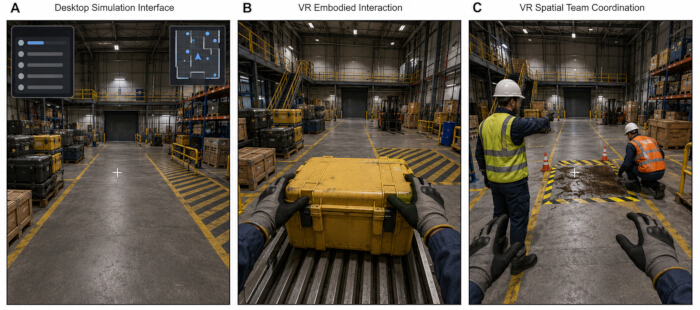
그림 2: 훈련 조건에 따른 인터페이스 비교 및 작업 수행 패러다임. 협력 긴급 물류 및 공간 탐색 시나리오는 모든 그룹에서 표준화되었으며, 상호작용 방식이 주요 차이점입니다. (A) 데스크톱 협력 시뮬레이션 인터페이스, 1인칭 시점. 참가자는 키보드와 마우스 입력을 사용하여 산업 환경을 탐색하며, 중앙 십자선과 미니맵 및 작업 목록을 포함한 2차원 그래픽 사용자 인터페이스 요소를 통해 공간 방향을 파악합니다. (B) 몰입형 가상현실 체화된 상호작용. 몰입형 조건에서 참가자는 마우스 클릭 대신 추적된 손 제스처를 이용한 직접적인 물리적 조작을 통해 자원 수집 및 취급을 포함한 작업을 수행합니다. (C) 대규모 공간 내 공동 배치 협력 가상현실 조건에서의 공간적 팀 조정. 팀원들은 실시간 아바타 가시성, 공간 지시 제스처, 위험 구역 주변의 공유된 물리적 방향성을 통해 내비게이터, 자원 관리자, 안전 점검자의 역할별 행동을 조정합니다. 이 그림의 더 큰 버전을 보려면 여기를 클릭하십시오.
따라서 세 가지 훈련 구성의 효과를 공간적 현장감, 팀 협응력 및 학습 몰입도를 중심으로 평가하였습니다. 몰입형 환경은 강한 주관적 참여를 유도할 수 있으므로9, 즉각적인 몰입과 유지된 학습을 구분하기 위해 이러한 결과들을 훈련 후 지식 습득 및 단기 기억 유지 정도와 함께 고려하였습니다. 또한 이동 및 몰입형 노출은 신체적 요구 사항을 수반하므로, 시뮬레이터로 인한 불편함을 구현 결과로서 모니터링하였습니다10.
프로토콜
This study involving human participants was conducted in accordance with the Declaration of Helsinki and institutional requirements for behavioral and educational research. The study protocol was approved by the Human Research Ethics Committee of Shenyang City University (Approval No. SU1992837; Approval Date: January 18, 2025). All participants provided written informed consent before enrollment. Participants were informed that the study involved immersive virtual reality exposure, team-based task performance, questionnaire completion, behavioral observation, and short-term follow-up testing. Participation was voluntary, and withdrawal was permitted at any time without academic, employment, or institutional penalty. All study records were de-identified before analysis. Each participant was assigned a numerical participant code, and each team was assigned a separate team code. No names, student numbers, phone numbers, facial images, or directly identifiable audio recordings were included in the analytical dataset. Equipment categories, software versions, and associated replication resources are listed in the Table of Materials.
1. Study design and setting
This completed study used a single-center, three-arm, parallel-group experimental design to examine whether large-space co-located collaborative virtual reality was associated with stronger spatial presence, team coordination, and learning engagement during immersive training. The three training conditions were desktop collaborative simulation, room-scale distributed collaborative virtual reality, and large-space co-located collaborative virtual reality.
The conditions were designed as functional comparators rather than as a full factorial decomposition of immersion, collaboration, and walking space. The desktop condition represented collaboration without exposure to an immersive head-mounted display. The room-scale distributed collaborative virtual reality condition represented immersive team collaboration in separate small tracking areas. The large-space co-located collaborative virtual reality condition combined an immersive visual experience, shared physical movement, and real-time embodied team interaction within a single tracked training space. Group differences were therefore interpreted as differences among the complete training configurations rather than as effects attributable to any single component. This structure was selected because research on immersive learning treats spatial presence, agency, and engagement as mechanisms by which virtual environments may influence learning behavior11.
The study was conducted in the Immersive Learning and Human-Computer Interaction Laboratory at the participating institution from March 3, 2025–July 18, 2025. Recruitment and baseline testing were conducted from March 3–April 25, 2025. Intervention sessions were conducted from March 10–May 30, 2025. The 2-week retention assessments were completed between March 24–June 16, 2025. Data checking, observer scoring, and dataset locking were completed by July 18, 2025.
All sessions were conducted in the same laboratory complex to control lighting, temperature, internet connectivity, task instructions, and researcher supervision. The large-space co-located collaborative virtual reality condition used an unobstructed tracking area of 8 m × 8 m. The room-scale distributed collaborative virtual reality condition used three separated 3 m × 3 m marked areas. The desktop collaborative simulation condition used individual computer workstations separated by acoustic partitions so that participants could communicate only through the assigned communication channel.
Participants were assigned to three-person teams before randomization. The team was used as the training unit because the task required distributed role execution, verbal coordination, shared situational awareness, and joint problem-solving. Randomization was conducted at the team level to avoid contamination between participants within the same session. The overall study workflow and physical configuration of the three conditions are shown in Figure 1.
2. Participants and eligibility screening
Participants were recruited from undergraduate and postgraduate programs at the participating institution. Recruitment notices described the study as an immersive training study involving virtual reality, team coordination, and learning assessment. The notices did not state the expected superiority of any training condition. Interested participants completed an online screening form before laboratory scheduling.
Participants were eligible if they were 18–35 years old, had normal or corrected-to-normal vision, could understand the training language, had no prior participation in the same virtual training scenario, and could stand and move safely for at least 30 min. Participants were excluded if they reported severe motion sickness, uncontrolled epilepsy, recent musculoskeletal injury affecting walking or balance, uncorrected visual impairment, severe vertigo, severe uncorrected hearing impairment, current acute illness, or any medical condition that made immersive virtual reality exposure unsafe. Participants were also excluded if they had extensive prior experience with the exact training scenario or had previously participated in pilot testing of the same system.
Eligibility was verified in two steps. A research assistant first reviewed the online screening form. The session researcher then confirmed eligibility verbally on the day of testing before consent. Participants reporting mild prior motion discomfort were not automatically excluded but were monitored more closely and reminded that participation could be stopped immediately if discomfort occurred. The complete screening form, eligibility items, baseline questionnaire, response formats, and coding rules are provided in Supplementary File 1.
An a priori power calculation was conducted using G-Power software to determine the required sample size for the experimental design. Assuming a medium expected effect size of f = 0.25 based on previous immersive collaborative learning literature, an alpha level of 0.05, and statistical power of 0.80 for a three-group analysis, a minimum of 111 participants was required. To accommodate the three-person team structure and maintain balanced group allocation across conditions, the final sample was expanded to 126 participants comprising 42 independent teams. Because the intervention was delivered at the team level, team identifiers were retained for clustering adjustment, observer-rated coordination scoring, and sensitivity checks.
3. Randomization, allocation concealment, and blinding
After all members of a three-person team had completed eligibility confirmation, the team was randomly assigned to one of the three training conditions using a computer-generated block-randomization list with a fixed block size of six teams. The allocation sequence was generated before data collection using a randomization package in the statistical computing environment, with a reproducible seed of 20250301.
Allocation concealment was maintained using sequentially numbered, opaque, tamper-evident envelopes prepared by a researcher independent of participant recruitment and intervention delivery. The randomization file was stored in a password-protected spreadsheet and was not accessible to the outcome assessors.
Allocation was revealed only after completion of the baseline questionnaire and pre-training knowledge test. The session researcher opened the next sealed allocation envelope immediately before equipment setup. Blinding of participants to the physical training format was not possible because the three conditions were visibly different. Participants were not informed which condition was expected to perform better.
Two observers rated team coordination from standardized screen recordings. The observers were blinded to the study hypotheses, training condition labels, and questionnaire results and were not involved in training delivery. Video files were renamed using neutral team codes before scoring. Condition-identifying interface labels were cropped or masked where possible before observer scoring.
4. Training scenario and task structure
The training scenario was designed as a collaborative emergency logistics and spatial navigation task in a simulated industrial training environment. Each three-person team was required to locate virtual resources, interpret spatial cues, communicate route information, coordinate role-specific actions, and complete a sequence of mission steps within a fixed time window.
Each participant held one of three roles: navigator, resource manager, or safety checker. The navigator interpreted the route direction and destination sequence. The resource manager identified and collected task-relevant virtual items. The safety checker monitored hazards, confirmed procedural order, and prompted the team before final submission.
The scenario contained four zones: orientation zone, resource zone, hazard zone, and completion zone. Each team completed eight required subtasks: identifying the target location, selecting three correct resources from six possible resources, avoiding two incorrect route branches, responding to three hazard prompts, transferring information between team members, and submitting the final task sequence. The maximum task time was 20 min. Teams that did not complete all required subtasks within 20 min were stopped at the time limit, and the number of completed subtasks was recorded.
Before the main task, all participants completed a standardized 8 min orientation. The first 3 min introduced the study rules and safety procedures. The next 3 min introduced the interface controls. The final 2 min allowed participants to practice movement, selection, and communication in a neutral practice environment that did not contain objects, routes, hazards, or answers used in the main scenario. No performance data from the practice environment were analyzed.
The same learning content, task sequence, target answers, route structure, hazard prompts, and scoring criteria were used across all three conditions. The conditions differed in interaction modality, degree of immersion, physical movement, and spatial configuration. The immersive environments were developed using a commercial real-time three-dimensional development platform. Multiplayer networking and spatial state synchronization were implemented using a dedicated multiplayer synchronization framework operating over a local gigabit Ethernet architecture. Participants assigned to the immersive virtual reality conditions used high-resolution head-mounted displays with integrated headphones and microphones. Spatial tracking used an infrared laser-based tracking system with four base stations. Avatar implementation used inverse kinematics algorithms to map real-time head and hand controller telemetry to articulated worker avatars.
5. Pre-study procedure checking and measurement refinement
Before formal data collection, all questionnaire items, knowledge test items, observer-rating rules, and task procedures were reviewed by two researchers with experience in immersive learning and one researcher with experience in educational measurement. The review focused on item clarity, role-task alignment, scoring consistency, safety wording, and construct alignment.
A pilot procedure check was conducted from February 17–February 21, 2025, with six participants who met the same eligibility criteria as the formal sample. The pilot examined task timing, headset comfort, movement safety, instruction clarity, questionnaire completion time, data export accuracy, and observer-rating feasibility. Pilot data were used only to refine wording, setup timing, safety instructions, and log-export procedures. These participants were not included in the final sample, and their data were not included in formal analysis.
6. Desktop collaborative simulation condition
In the desktop collaborative simulation condition, each participant used an individual workstation connected to a 24-inch 1080p monitor. Input devices consisted of a computer mouse and keyboard, and audio communication was provided through a USB headset and microphone. Participants were seated at separate workstations and were instructed not to communicate outside the system.
The desktop simulation used the same virtual environment, task objects, route sequence, hazard prompts, and scoring logic as the virtual reality conditions. The camera view was first-person. As illustrated in Figure 2A, participants in the desktop group navigated using keyboard inputs and interacted with virtual resources using mouse clicks through a fixed two-dimensional monitor field of view. Field of view, movement speed, interaction distance, and audio settings were fixed before data collection and were not changed between sessions. One researcher monitored technical stability during each session but did not provide task advice after the main scenario began.
7. Room-scale distributed collaborative virtual reality condition
In the room-scale distributed collaborative virtual reality condition, the three participants entered the same virtual scenario from separate 3 m × 3 m marked tracking areas. Each participant used a head-mounted display and handheld controllers. Team members communicated through the assigned voice channel and completed the same role-based team task but could not physically co-navigate in a shared large tracking space.
Before the main task, headset fit, interpupillary distance, the boundary system, and controller straps were adjusted. Participants were instructed to stop immediately if dizziness, nausea, eye strain, headache, loss of balance, or anxiety occurred. A researcher remained within 2 m of each active tracking area throughout the session and monitored safety without providing task guidance.
If a participant crossed the marked boundary, the session was paused, and the participant was repositioned. If moderate discomfort occurred, defined as a self-rated discomfort score of 5 or higher on any 0–10 discomfort item, the session was paused and the participant was seated for recovery. If any discomfort item reached 7 or higher, the session was stopped.
8. Large-space co-located collaborative virtual reality condition
In the large-space co-located collaborative virtual reality condition, each three-person team entered the same 8 m × 8 m tracked training area. Each participant wore a head-mounted display, held two controllers, and was represented by a role-specific avatar visible to the other team members. Team members communicated verbally in real time while physically moving through the shared training space. The system synchronized participant location, hand movement, object selection, and task-state changes. As shown in Figure 2B and Figure 2C, participants in the immersive conditions executed tasks using three-dimensional spatial hand gestures with tracked controllers and physical head rotation for a 360° field of view.
The large-space condition used the same task content and 20 min time limit as the other conditions. Physical movement was calibrated so that the virtual route remained within the marked safety area. A safety boundary appeared in the headset when participants approached the edge of the tracking zone. Before the main task, floor clearance, cable-free movement, headset fit, tracking stability, audio input, and controller response were checked. Participants were instructed to use natural physical walking rather than artificial locomotion techniques to navigate the virtual environment. Physical contact between team members was prohibited. If two participants approached within 0.5 m of each other, a neutral safety reminder was provided without task information.
Each large-space session was supervised by two researchers. One researcher monitored the system dashboard and recording status. The second researcher stood outside the active tracking area and monitored participant safety. The task was paused if tracking was lost for more than 10 s, if a participant reported discomfort, or if a participant crossed the safety boundary. If the interruption lasted less than 2 min and the participant wished to continue, the task resumed from the last saved state. If the interruption exceeded 2 min, the session was recorded as incomplete and retained in the intention-to-treat dataset.
9. Outcome measures and assessment timing
Assessments were completed at baseline, immediately after training, and 2 weeks after training. Baseline measures included demographics, prior virtual reality and team-training experience, gaming familiarity, and a 30-point knowledge pretest. Immediate post-training measures included spatial presence, self-rated and observer-rated team coordination, learning engagement, cognitive load, simulator discomfort, post-training knowledge, and task-performance indicators. The 2-week follow-up used the same 30-point knowledge test with reordered items and minor wording variation. The assessment schedule is shown in Table 1.
Table 1: Summary of primary and secondary measures. This table summarizes the variables, measurement scales, assessment timing, and data sources for the primary outcomes, secondary learning outcomes, and safety and process measures evaluated throughout the experimental protocol. Please click here to download this Table.
Spatial presence was measured immediately after training using an 8-item, 7-point scale adapted from established presence dimensions12. Scores were averaged when at least 80% of items were completed; otherwise, the score was coded as missing. Full items and scoring rules are provided in Supplementary File 1.
Self-rated team coordination was measured using a customized six-item, 7-point scale covering communication clarity, role awareness, mutual monitoring, assistance timing, shared task comprehension, and error recovery. Pilot testing with 20 participants assessed item clarity and structure, and exploratory factor analysis identified a single dominant factor. Internal consistency in the main sample was Cronbach’s α = 0.88. Participant scores were calculated as the mean of completed items, and team-level scores as the mean of the three participant scores. Full items and scoring criteria are provided in Supplementary File 1.
Observer-rated team coordination was assessed using a customized rubric covering communication timing, role execution, mutual support, spatial coordination, and error recovery. Each domain was scored from 0–20, yielding a total score from 0–100. The rubric underwent expert review, and two observers completed 10 h of training before formal scoring. Inter-rater reliability was evaluated using a two-way random-effects intraclass correlation coefficient (ICC) for absolute agreement, with ICC ≥ 0.75 required before final scoring. Total-score differences greater than 12 points were resolved by consensus; otherwise, the mean of the two scores was used. The complete rubric and reconciliation procedure are provided in Supplementary File 1.
Learning engagement was measured immediately after training using a 12-item, 7-point short-form scale13. Scores were averaged across completed items, with higher values indicating stronger engagement. Internal consistency was assessed using Cronbach’s alpha. Cognitive load was assessed using five 1–7 ratings of mental demand, physical demand, time pressure, effort, and frustration14. Full items and scoring rules are provided in Supplementary File 1.
Knowledge acquisition was assessed using a 30-point test comprising 20 single-best-answer items and five short scenario judgment items. The same blueprint was used for pretest, post-test, and 2-week retention testing, with reordered items and equivalent wording changes. A gain of at least 3 points from pretest to post-test was defined as a practically meaningful descriptive improvement. The test blueprint, scoring rules, and judgment rubric are provided in Supplementary File 1.
Simulator discomfort was assessed before exposure, after orientation, and after the main task using five 0–10 symptom ratings. The mean of the five items formed the discomfort index. Sessions were stopped if any item reached 7 or higher. Post-task indices above 6 required at least 15 min of monitoring, and indices of 5 or higher required 24 h follow-up. Full safety-scoring rules are provided in Supplementary File 1.
Task-performance indicators included completion status, completion time, correct resources selected, hazard prompts correctly handled, route errors, and safety interruptions. Incomplete teams were assigned 1,200 s for completion time. Outcome definitions, timing, score ranges, data sources, and analysis levels are summarized in Table 1 and detailed in Supplementary File 1.
10. Data collection procedure
Each session followed the same sequence. Participants arrived 15 min before the scheduled training time. Identity was confirmed using the appointment list, eligibility was checked again, the consent form was explained, and procedural questions were answered. Participants then signed the consent form and received participant codes. The expected superiority of any condition was not discussed.
Participants completed the baseline questionnaire and pre-training knowledge test on a laboratory tablet. The baseline phase lasted approximately 12 min. After baseline completion, team allocation was revealed, and the assigned training setup was prepared. Equipment preparation lasted approximately 5 min for the desktop condition, 8 min for the room-scale distributed collaborative virtual reality condition, and 10 min for the large-space co-located collaborative virtual reality condition. Equipment preparation was not counted as training exposure.
All participants then completed the standardized 8 min orientation. The main task started immediately after orientation and lasted up to 20 min. No teaching, hints, or corrective feedback were provided during the main task. Technical assistance was limited to restoring system function, adjusting headset fit, repositioning participants within the safety boundary, or repeating previously stated safety instructions. After the task, participants removed the equipment and completed the post-training questionnaire and post-training knowledge test at individual stations. The post-training assessment lasted approximately 15 min.
The 2-week retention test was administered online 14 days after the training session, with an acceptable completion window from day 13–day 16. Participants received one reminder 24 h before the due time and one reminder on day 15 if the test had not been completed. Responses submitted after day 16 were retained in the raw dataset but excluded from the primary retention analysis. The actual number of days between training and follow-up was recorded for sensitivity analysis.
11. Data quality control
Electronic questionnaires included range checks for key outcomes, while demographic items could be skipped. Submission times were recorded, and questionnaires completed in less than one-third of the median completion time were flagged for review. System logs were exported after each session and matched against session records within 48 h; discrepancies were resolved using timestamped recordings.
Observer-rated coordination scores were entered independently by two observers. Total-score differences greater than 12 points were flagged for consensus review, and final scores were locked before group-level analysis. Multi-item scale scores were calculated when at least 80% of items were completed; otherwise, scores were coded as missing. Unanswered single-best-answer knowledge items were scored as 0. Short scenario judgment items were scored independently by two raters, with disagreements greater than 1 point reviewed by a third rater.
The final dataset was locked after verification of eligibility records, participant and team codes, questionnaire ranges, knowledge scores, observer ratings, system logs, retention-test validity, data merges, and missingness. Detailed rules for scoring, cleaning, and dataset locking are provided in Supplementary File 1.
12. Safety monitoring and stopping criteria
Safety monitoring was conducted throughout all training sessions. Before exposure, participants were reminded that discomfort could occur during virtual reality training and that withdrawal was allowed at any time. During the task, posture, balance, movement speed, and verbal signs of discomfort were monitored. The task was stopped immediately if a participant reported severe dizziness, nausea, visual discomfort, headache, anxiety, loss of balance, or a wish to stop.
Predefined stopping criteria were applied consistently. The session was stopped if any discomfort item reached 7 or higher on the 0–10 scale, if a participant crossed the safety boundary twice in one session, if tracking loss lasted more than 2 min, if equipment malfunction prevented normal interaction, or if continued participation was judged to create a safety risk. Stopped sessions were documented using a session interruption form. Participants were seated after stopping and monitored until symptoms returned to a mild level, defined as all discomfort items below 3. No participant was allowed to leave the laboratory while reporting moderate or severe discomfort.
13. Data management and confidentiality
All data were stored in a de-identified project folder on an encrypted institutional drive. The linkage file connecting participant identities to participant codes was stored separately and was accessible only to the principal investigator. Questionnaire data, task logs, observer ratings, and knowledge test scores were merged using participant and team codes only, and the analytical dataset contained no personal identifiers.
Data were organized at participant and team levels. Participant-level files contained identifiers, condition assignment, demographic variables, questionnaire outcomes, knowledge outcomes, and task-related variables. Team-level files contained team identifiers, condition assignment, observer-rated coordination, task completion, completion time, resource selection, hazard handling, route errors, and safety interruptions. Raw observer scores were retained separately before averaging or consensus resolution. Variable definitions, coding ranges, and dataset structure are provided in Supplementary File 1.
14. Statistical analysis
Primary outcomes were spatial presence, self-rated team coordination, observer-rated team coordination, and learning engagement. Secondary outcomes included post-training knowledge, 2-week retention, cognitive load, simulator discomfort, task completion, completion time, and task-process indicators. Training conditions comprised desktop collaborative simulation, room-scale distributed collaborative virtual reality, and large-space co-located collaborative virtual reality.
Participant- and team-level variables were summarized using appropriate descriptive statistics. Baseline characteristics included age, gender, prior virtual reality experience, gaming familiarity, prior team-based training experience, and pre-training knowledge. Because randomization occurred at the team level, intraclass correlation coefficients were calculated to assess within-team dependence. Participant-level primary outcomes were analyzed using linear mixed-effects models with training condition as a fixed effect and team identifier as a random intercept. Models used restricted maximum likelihood estimation and included available data under the missing-at-random assumption. No imputation was applied to primary questionnaire outcomes. Estimated marginal means were compared using Tukey-adjusted pairwise contrasts. Observer-rated coordination was analyzed at the team level.
The Benjamini-Hochberg false discovery rate procedure was applied across the four primary outcomes as a sensitivity analysis. All randomized teams and participants were analyzed according to original allocation. Multi-item scale scores were calculated when at least 80% of items were completed; otherwise, scores were coded as missing. Residual normality was assessed using Q-Q plots and Shapiro-Wilk tests, and homogeneity of variance was assessed using Levene’s test. Strongly non-normal distributions were examined using the Kruskal-Wallis test as a sensitivity analysis.
Effect sizes were reported with p values. Analysis of variance results included eta squared and partial eta squared; pairwise comparisons included Cohen’s d with 95% confidence intervals; and mixed-effects models reported estimated mean differences with 95% confidence intervals. Statistical significance was defined as two-sided p < 0.05. Associations among spatial presence, team coordination, learning engagement, and knowledge outcomes were examined using Pearson or Spearman correlations, as appropriate. Statistical syntax for descriptive analyses, mixed-effects models, team-level coordination analysis, multiple-outcome adjustment, assumption checks, knowledge analyses, and correlation analyses is provided in Supplementary File 1.
결과
Participant flow and analysis populations
A total of 126 participants were enrolled and assigned to 42 three-person teams. Fourteen teams were allocated to each training condition, resulting in 42 participants in the desktop collaborative simulation group, 42 in the room-scale distributed collaborative virtual reality group, and 42 in the large-space co-located collaborative virtual reality group. All teams completed the assigned training session and were retained in the intention-to-treat dataset.
Missingness was low and was not concentrated in any condition. Spatial presence scores were available for 124 participants, including 41 in the desktop group, 42 in the room-scale group, and 41 in the large-space group. Self-rated team coordination scores were available for 123 participants, with 41 participants in each group. Learning engagement scores were available for 122 participants, including 40 in the desktop group, 41 in the room-scale group, and 41 in the large-space group. Simulator discomfort scores were available for 124 participants, including 42 in the desktop group, 41 in the room-scale group, and 41 in the large-space group. Valid 2-week retention knowledge scores were available for 122 participants, including 40 in the desktop group, 41 in the room-scale group, and 41 in the large-space group. Observer-rated team coordination was available for all 42 teams. Participant flow, allocation, immediate assessment, and follow-up completion are summarized in Figure 3.
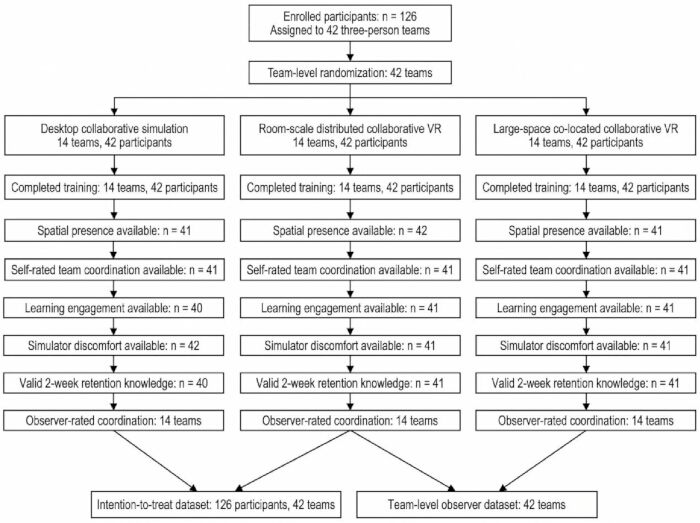
Figure 3: Participant flow and analysis populations. The flow diagram shows enrollment, allocation of 126 participants into 42 three-person teams, training completion, immediate assessment, observer-rated coordination scoring, and valid 2-week follow-up data across the three training conditions. Please click here to view a larger version of this figure.
Baseline characteristics
Baseline demographic and training-related characteristics were broadly comparable across the three conditions. The final sample consisted of young adult undergraduate and postgraduate participants. The three groups were similar in age, prior virtual reality exposure, familiarity with gaming or simulation, prior team-based training experience, and prior emergency logistics, navigation, or industrial safety training.
Pre-training knowledge scores were also comparable across groups. Mean pre-training knowledge scores were 16.17 ± 3.09 in the desktop collaborative simulation group, 16.10 ± 3.61 in the room-scale distributed collaborative virtual reality group, and 15.55 ± 3.23 in the large-space co-located collaborative virtual reality group. The unadjusted between-group comparison was not statistically significant, F(2, 123) = 0.44, p = 0.647, η2 = 0.007.
Baseline characteristics and pre-training measures are shown in Table 2. Before inferential hypothesis testing, diagnostic evaluations indicated that the primary continuous variables met the assumptions of residual normality and homogeneity of variance. Internal consistency was high across the psychometric instruments, with Cronbach’s alpha coefficients of 0.86 for spatial presence, 0.88 for self-rated team coordination, and 0.91 for learning engagement. All statistically significant group differences across the primary outcomes remained significant after Benjamini-Hochberg false discovery rate adjustment.
Table 2: Baseline characteristics and pre-training measures. This table reports participant demographics, prior virtual reality and training experience, gaming or simulation familiarity, prior related training history, and pre-training knowledge scores across the three experimental conditions. Please click here to download this Table.
Spatial presence
Spatial presence was analyzed using a linear mixed-effects model with training condition as a fixed effect and team code as a random intercept. Mixed-effects model tests used Satterthwaite-adjusted degrees of freedom. The model showed a significant effect of training condition on spatial presence, F(2, 39) = 23.91, p < 0.001. Estimated marginal means were 4.13 for the desktop collaborative simulation group, 5.00 for the room-scale distributed collaborative virtual reality group, and 5.42 for the large-space co-located collaborative virtual reality group.
Tukey-adjusted pairwise comparisons showed that spatial presence was higher in the large-space group than in the desktop group, estimated mean difference = 1.29, 95% CI: 0.86 – 1.72, p < 0.001. Spatial presence was also higher in the large-space group than in the room-scale group, estimated mean difference = 0.42, 95% CI: 0.04 – 0.80, p = 0.027. The room-scale group scored higher than the desktop group, estimated mean difference = 0.87, 95% CI: 0.45 – 1.29, p < 0.001.
For descriptive comparison, the unadjusted mean ± standard deviation (SD) scores were 4.13 ± 0.91 in the desktop group, 5.00 ± 0.79 in the room-scale group, and 5.42 ± 0.80 in the large-space group. The unadjusted analysis of variance (ANOVA) showed the same pattern, F(2, 121) = 25.68, p < 0.001, η2 = 0.298. Primary outcome distributions are shown in Figure 4, and the corresponding mixed-effects and descriptive statistics are summarized in Table 3.
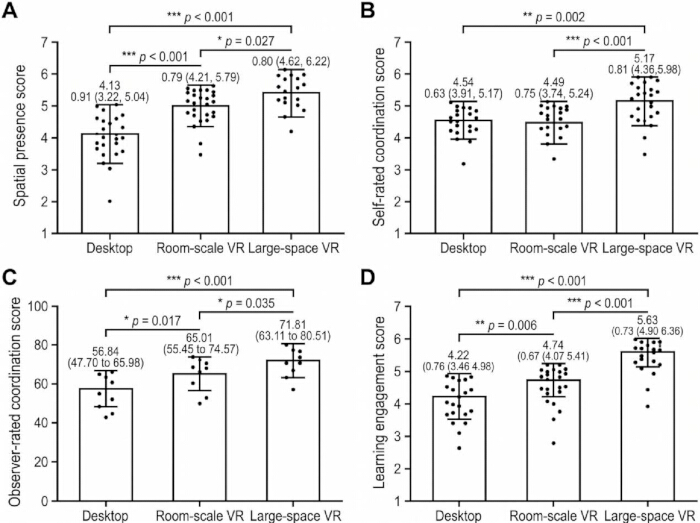
Figure 4: Primary outcomes across training conditions. (A) Spatial presence. (B) Self-rated team coordination. (C) Observer-rated team coordination. (D) Learning engagement. Spatial presence, self-rated team coordination, and learning engagement were participant-level outcomes; observer-rated team coordination was analyzed at the team level. Error bars indicate standard deviation. Please click here to view a larger version of this figure.
Table 3: Primary outcomes. This table summarizes spatial presence, self-rated team coordination, observer-rated team coordination, and learning engagement across the three training conditions. Corresponding inferential statistical models and false discovery rate sensitivity checks are also presented. Please click here to download this Table.
Team coordination
Self-rated team coordination was analyzed at the participant level using a linear mixed-effects model with training condition as a fixed effect and team code as a random intercept. The model showed a significant effect of training condition, F(2, 39) = 9.96, p < 0.001. Estimated marginal means were 4.54 in the desktop group, 4.49 in the room-scale group, and 5.17 in the large-space group.
Tukey-adjusted comparisons showed that self-rated team coordination was higher in the large-space group than in the desktop group, estimated mean difference = 0.63, 95% CI: 0.25 – 1.01, p = 0.002. The large-space group also scored higher than the room-scale group, estimated mean difference = 0.68, 95% CI: 0.29 – 1.07, p < 0.001. The desktop and room-scale groups did not differ significantly, estimated mean difference = 0.05, 95% CI: −0.33 – 0.43, p = 0.942. For descriptive comparison, the unadjusted mean ± SD scores were 4.54 ± 0.63 in the desktop group, 4.49 ± 0.75 in the room-scale group, and 5.17 ± 0.81 in the large-space group. The unadjusted ANOVA produced the same directional pattern, F(2, 120) = 10.84, p < 0.001, η2 = 0.153.
Observer-rated team coordination was analyzed at the team level, as prespecified. Inter-rater reliability exceeded the predefined threshold, with a two-way random-effects intraclass correlation coefficient of ICC = 0.84. Three team recordings had observer total-score differences greater than 12 points and were resolved through consensus review. Observer-rated coordination differed significantly across conditions, F(2, 39) = 10.92, p < 0.001, η2 = 0.359. Mean team-level scores were 56.84 ± 9.14 in the desktop group, 65.01 ± 9.56 in the room-scale group, and 71.81 ± 8.70 in the large-space group. Tukey-adjusted comparisons showed higher observer-rated coordination in the large-space group than in the desktop group, mean difference = 14.97, 95% CI: 7.33 – 22.61, p < 0.001. The large-space group also scored higher than the room-scale group, mean difference = 6.80, 95% CI: 0.42 – 13.18, p = 0.035. The room-scale group scored higher than the desktop group, mean difference = 8.17, 95% CI: 1.31 – 15.03, p = 0.017. Self-rated and observer-rated coordination showed the same group ordering, with the large-space group having the highest coordination scores on both measures.
Learning engagement
Learning engagement was analyzed using a linear mixed-effects model with training condition as a fixed effect and team code as a random intercept. The model showed a significant effect of training condition, F(2, 39) = 37.46, p < 0.001. Estimated marginal means were 4.22 in the desktop group, 4.74 in the room-scale group, and 5.63 in the large-space group. Tukey-adjusted pairwise comparisons showed that engagement was higher in the large-space group than in the desktop group, estimated mean difference = 1.41, 95% CI: 1.03 – 1.79, p < 0.001. Engagement was also higher in the large-space group than in the room-scale group, estimated mean difference = 0.89, 95% CI: 0.53 – 1.25, p < 0.001. The room-scale group scored higher than the desktop group, estimated mean difference = 0.52, 95% CI: 0.15 – 0.89, p = 0.006.
For descriptive comparison, the unadjusted mean ± SD scores were 4.22 ± 0.76 in the desktop group, 4.74 ± 0.67 in the room-scale group, and 5.63 ± 0.73 in the large-space group. The unadjusted ANOVA showed the same pattern, F(2, 119) = 40.00, p < 0.001, η2 = 0.402.
False discovery rate sensitivity checks for primary outcomes
The Benjamini-Hochberg false discovery rate procedure was applied across the four prespecified primary outcomes: spatial presence, self-rated team coordination, observer-rated team coordination, and learning engagement. All four primary outcomes remained statistically significant after adjustment. The false discovery rate sensitivity check produced the same primary outcome pattern as the main analyses.
Knowledge outcomes and retention
Immediate post-training knowledge was analyzed using a mixed-effects model with training condition as a fixed effect, pre-training knowledge as a covariate, and team code as a random intercept. The adjusted model showed a non-significant group effect for post-training knowledge, F(2, 39) = 2.14, p = 0.131. Estimated marginal means were 20.12 for the desktop group, 20.96 for the room-scale group, and 21.85 for the large-space group. For descriptive comparison, mean post-training knowledge scores were 20.09 ± 4.04 in the desktop group, 21.00 ± 4.57 in the room-scale group, and 21.84 ± 3.95 in the large-space group. The unadjusted between-group comparison was not statistically significant, F(2, 123) = 1.83, p = 0.165, η2 = 0.029.
Knowledge gain from baseline to immediate post-training assessment was evaluated as a secondary exploratory inferential outcome. Mean gains were 3.93 ± 2.88 points in the desktop group, 4.91 ± 2.12 points in the room-scale group, and 6.30 ± 2.75 points in the large-space group. The unadjusted group effect was significant, F(2, 123) = 8.77, p < 0.001, η2 = 0.125. Tukey-adjusted comparisons showed greater knowledge gain in the large-space group than in the desktop group, mean difference = 2.37, 95% CI: 0.96 – 3.78, p < 0.001. The large-space group also showed greater gain than the room-scale group, mean difference = 1.39, 95% CI: 0.14 – 2.64, p = 0.026. The room-scale and desktop groups did not differ significantly, mean difference = 0.98, 95% CI: −0.31 – 2.27, p = 0.171.
At the 2-week follow-up, retention knowledge was analyzed among participants with valid retention responses within the predefined day 13–day 16 window. The adjusted mixed-effects model, controlling for pre-training knowledge and including team code as a random intercept, showed a non-significant group effect, F(2, 39) = 1.68, p = 0.199. Mean retention scores were 18.70 ± 4.55 in the desktop group, 19.62 ± 4.37 in the room-scale group, and 20.42 ± 4.38 in the large-space group. The unadjusted group comparison was also not statistically significant, F(2, 119) = 1.53, p = 0.220, η2 = 0.025. Secondary learning outcomes are summarized in Table 4.
Table 4: Secondary learning outcomes across training conditions. This table reports pre-training knowledge, immediate post-training knowledge, knowledge gain, and 2-week knowledge retention across the three training conditions. Adjusted mixed-effects models are presented for the secondary learning outcomes. Please click here to download this Table.
Cognitive load and simulator discomfort
Cognitive load was analyzed as a secondary outcome. Mean cognitive load was 4.22 ± 0.69 in the desktop group, 4.49 ± 0.62 in the room-scale group, and 4.13 ± 0.82 in the large-space group. The unadjusted group effect was F(2, 123) = 2.92, p = 0.058, η2 = 0.045. This result did not reach the predefined significance threshold.
Simulator discomfort differed across conditions. Mean post-task discomfort index was 1.37 ± 0.71 in the desktop group, 2.18 ± 0.79 in the room-scale group, and 2.42 ± 0.58 in the large-space group. The unadjusted group effect was significant, F(2, 121) = 25.72, p < 0.001, η2 = 0.298. Discomfort scores were higher in the two virtual reality groups than in the desktop group, while average values remained in the mild range. No participant met the predefined stopping criterion of any discomfort item ≥7. Seven participants had a post-task discomfort index ≥5 and received 24 h symptom-resolution contact. Among these participants, four had a post-task discomfort index >6 and were also monitored in the laboratory for at least 15 min before leaving. All seven participants reported symptom resolution without medical referral. No session was terminated because of simulator discomfort, and no adverse event requiring clinical care was recorded. Cognitive load and simulator discomfort are shown in Figure 5.
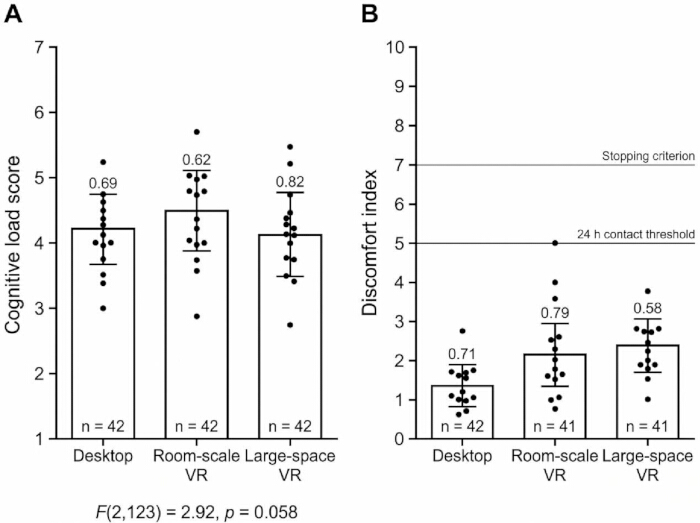
Figure 5: Cognitive load and simulator discomfort across training conditions. (A) Cognitive load, scored from 1 – 7, with higher scores indicating greater perceived workload. (B) Post-task simulator discomfort, scored from 0 – 10 and based on nausea, dizziness, eye strain, headache, and balance discomfort. Error bars indicate standard deviation. Please click here to view a larger version of this figure.
Task process indicators
Task-process indicators were used to describe team performance during the 20 min collaborative training task. Task completion was 71.4% in the desktop group, 78.6% in the room-scale group, and 85.7% in the large-space group. Mean completion time was 1,041.6 ± 162.4 s in the desktop group, 984.3 ± 151.8 s in the room-scale group, and 931.7 ± 139.6 s in the large-space group. Because incomplete teams were assigned a time limit of 1,200 s, completion time was interpreted descriptively.
The mean number of correct resources selected was 2.21 ± 0.70 in the desktop group, 2.43 ± 0.65 in the room-scale group, and 2.64 ± 0.50 in the large-space group. Mean correctly handled hazard prompts were 1.93 ± 0.83, 2.21 ± 0.70, and 2.50 ± 0.65, respectively. Mean route errors were 2.07 ± 1.14 in the desktop group, 1.50 ± 0.94 in the room-scale group, and 1.00 ± 0.78 in the large-space group. Safety interruptions were infrequent across all conditions, with means of 0.21 ± 0.43, 0.29 ± 0.47, and 0.36 ± 0.50, respectively. Task completion status, completion time, correct resource selection, hazard prompts handled correctly, route errors, and safety interruptions are summarized in Table 5.
Table 5: Task process indicators and safety events. This table summarizes objective task-performance measures, including completion rates, route navigation errors, and hazard handling. Simulator discomfort monitoring and recorded adverse clinical events are also reported. Please click here to download this Table.
Associations among presence, coordination, engagement, and learning
Participant-level psychometric responses were aggregated into team-level cluster means before integration with observer-rated coordination measures. Team-level correlation analysis showed positive associations between spatial presence and learning engagement (r = 0.57), self-rated team coordination (r = 0.26), and observer-rated coordination (r = 0.32).
The correlation pattern indicated moderate overlap among presence, coordination, and engagement, while correlations with knowledge gain were smaller. The correlation pattern indicated overlap among presence, coordination, and engagement, while associations with knowledge gain were smaller. These analyses were exploratory and do not establish causal pathways among the measured outcomes. The correlation matrix is shown in Figure 6.
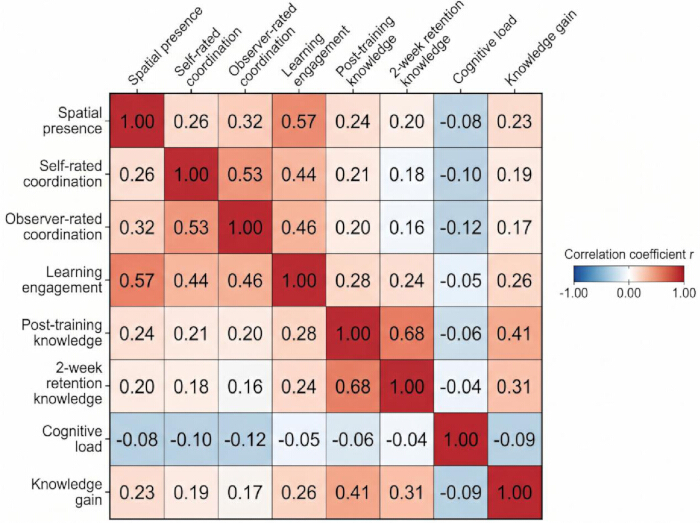
Figure 6: Correlation matrix for presence, coordination, engagement, and learning outcomes. The heatmap shows Pearson correlation coefficients among spatial presence, self-rated team coordination, observer-rated team coordination, learning engagement, post-training knowledge, 2-week retention knowledge, cognitive load, and knowledge gain. Please click here to view a larger version of this figure.
The large-space co-located collaborative virtual reality group had higher spatial presence, self-rated team coordination, observer-rated team coordination, and learning engagement than the comparison groups. These primary outcome findings remained significant after accounting for team clustering and after false discovery rate adjustment. For secondary outcomes, knowledge gain favored the large-space group, whereas adjusted post-training knowledge and 2-week retention knowledge did not differ significantly across conditions. Cognitive load did not differ significantly across groups, and simulator discomfort remained mild on average despite higher scores in the virtual reality conditions.
DATA AVAILABILITY:
The de-identified analytical dataset, data dictionary, scoring rubrics, and statistical syntax used to support reproducibility are publicly available in the Zenodo repository - https://zenodo.org/records/21991446. Additional reporting checklists, instrument blueprints, scoring rules, and dataset documentation are provided in Supplementary File 1.
Supplementary File 1: Reproducibility Materials for the Large-Space Collaborative Virtual Reality Training Study. This file contains the participant questionnaire, knowledge test blueprint, observer-rated coordination rubric, data dictionary, scoring and cleaning rules, statistical syntax outline, de-identified analytical dataset structure, and reporting checklist. Please click here to download this file.
토론
본 연구에서는 대형 공간의 공동 위치 협업 가상 현실(co-located collaborative virtual reality) 구성이 데스크톱 협업 및 룸 스케일 분산 협업 가상 현실과 비교하여 서로 다른 훈련 경험을 생성하는지 조사하였습니다. 공간적 실재감, 팀 조정 및 학습 몰입도에서 가장 강력하고 일관된 결과가 관찰되었습니다. 이러한 결과들은 서로 구별됩니다. 즉, 공간적 실재감은 참가자가 자신을 훈련 공간 내에 위치한다고 인식하는 정도를 반영하고, 조정은 정보 교환, 역할 수행 및 오류 복구를 반영하며, 몰입도는 과제에 대한 인지적 및 행동적 관여도를 반영합니다. 팀 클러스터링과 허위 발견율(false discovery rate) 보정을 거친 후, 대형 공간 조건에서 세 가지 영역 모두 더 높은 점수가 나타났습니다. 이러한 패턴은 협업 가상 현실이 단순한 디스플레이 기술뿐만 아니라, 공유된 행동, 의사소통 및 환경 구조가 결합되어 학습 행동을 형성하는 과제 생태계(task ecology)로 기능한다는 광범위한 관점과 일치합니다15.
공간적 실재감 결과가 유의미한 이유는 세 가지 훈련 조건이 움직임의 조직화 및 공동 존재 방식에서 서로 달랐기 때문입니다. 데스크톱 조건은 몰입형 신체 배치 없이 협업을 지원했습니다. 룸 스케일 분산 조건은 몰입형 시각 경험과 실시간 팀 커뮤니케이션을 제공했으나, 참가자들은 서로 분리된 작은 트래킹 영역에 머물렀습니다. 대공간 조건에서는 공유된 물리적 공동 내비게이션이 추가되어, 참가자들이 동일한 트래킹 환경 내에서 이동, 방향 설정 및 행동을 할 수 있었습니다. 따라서 관찰된 공간적 실재감의 증가는 단순히 보행 공간 때문이 아니라, 신체적 움직임, 공유된 공간 참조 및 실시간 팀 가시성이 결합된 전체 훈련 구성의 결과로 보아야 합니다. 이러한 해석은 센서리모터 우발성, 공간 업데이트 및 환경적 일관성이 매개된 환경 내에 위치한다는 느낌을 지원할 때 몰입형 시스템이 실재감을 강화할 수 있음을 보여주는 실재감 연구와 일치합니다16. 조정 결과 또한 유사한 패턴을 보였습니다. 대공간 그룹은 자기 평가 및 관찰자 평가 조정 점수 모두 더 높게 나타났습니다. 자기 평가 조정은 즐거움이나 새로움의 영향을 받았을 수 있는 반면, 관찰자 평가 조정은 가시적인 커뮤니케이션 타이밍, 역할 수행, 상호 지원, 공간적 조정 및 오류 복구 등을 기반으로 하였습니다. 따라서 공유된 공간 정보가 팀 행동을 조직화하기 위한 공통 참조 영역을 제공했을 수 있습니다. 이러한 패턴은 협업이 커뮤니케이션 채널, 공유된 표상, 과업 상호 의존성 및 팀 진행 상황 모니터링에 달려 있다는 컴퓨터 지원 협력 학습 연구와 일치합니다17.
대공간 그룹에서도 학습 참여도가 증가하였으나, 이 결과는 학습 효과와 관련하여 신중한 해석이 필요합니다. 즉각적인 지식 습득의 증가는 높았으나, 보정된 교육 후 결과 및 유지 결과에서는 유의미한 차이가 없었다는 점은 더 강력한 경험적 참여가 반드시 일관되게 더 강력한 지식 유지로 이어지지는 않았음을 나타냅니다. 따라서 단 한 번의 노출은 지식 습득의 지속적인 차이를 반드시 만들어내지 않더라도, 더 큰 몰입감과 행동적 관여를 유도할 수 있습니다. 대공간 협업 환경의 장점은 지속적인 인지적 유지보다는 공간적 조정과 능동적인 상황적 참여에서 가장 분명하게 나타났습니다. 참여는 학습을 위한 조건일 뿐, 유지를 보장하는 요소는 아닙니다. 몰입형 학습 연구 또한 실재감과 관여가 주의력과 과제 참여를 지원할 수 있지만, 지속적인 학습은 교수 설계, 피드백, 사전 지식 및 반복 연습 기회에도 영향을 받는다는 점을 시사합니다18. 해당 조건에서 요구되는 신체적 움직임과 실시간 팀 조정에도 불구하고, 대공간 그룹의 인지 부하는 유의미하게 증가하지 않았습니다. 룸 스케일 분산 조건에서 평균 인지 부하가 가장 높게 나타났으나, 그룹 간 차이는 사전 정의된 유의 수준에 도달하지 않았습니다. 분산 협업의 경우 참가자들이 서로 다른 작은 공간에서 활동하며 음성으로 조정해야 했으므로, 대공간 조건에서 가능한 공유된 물리적 참조 없이도 조정 요구 사항이 유지되었을 가능성이 있습니다. 인지 부하 이론 역시 과제 구조가 불필요한 의사소통 부담을 추가하지 않으면서 인지적 작업을 분산시킬 때 협력 학습이 가장 효과적임을 보여줍니다19.
시뮬레이터로 인한 불편감은 데스크톱 조건보다 두 가지 가상 현실 조건에서 더 높게 나타났으나, 평균 점수는 경미한 수준을 유지했다. 어떤 참가자도 7점에 도달하면 중단한다는 불편감 항목의 중단 기준을 충족하지 않았으며, 임상적 치료가 필요한 이상 반응은 발생하지 않았다. 대규모 공간의 공동 위치 협업 가상 현실은 헤드 마운트 디스플레이 노출, 신체 움직임 및 팀원 간의 근접성이 결합되어 있어 안전 고려 사항이 수반된다. 구현된 안전장치들이 불편감을 완전히 제거하지는 못했으나, 본 표본에서 증상을 관리 가능한 범위 내로 유지시켰다. 더 광범위한 기관 내 도입을 위해서는 표준화된 문제 해결 절차가 필요하다. 안구 피로를 줄이기 위해서는 헤드셋 착용 상태와 동공 간 거리 보정이 중요하다. 공간 추적 손실이나 네트워크 지연 시간 증가 시에는 즉시 시뮬레이션을 일시 중단해야 하며, 오디오 채널 오류 시에는 국소적인 하드웨어 리셋 절차가 필요하다. 공동 위치에서의 이동 안전을 위해서는 충돌 위험을 줄이기 위한 보행 전용 지침과 물리적 경계 제약이 필요하다. 이러한 절차들은 사이버 멀미와 불편감을 가상 현실 훈련에서 부수적인 이상 반응이 아니라 설계 및 모니터링 고려 사항으로 취급해야 한다는 관점과 일치한다20.
본 연구는 단순히 가상 현실과 비가상 현실을 대조하는 수준을 넘어 비교 범위를 확장했다는 점에서 방법론적 가치를 지닙니다. 데스크톱 협업, 분산형 몰입형 협업, 그리고 동일 장소 대형 공간 협업이 서로 다른 구성으로 평가되었습니다. 이러한 설계 덕분에 단순한 시각적 몰입이나 언어적 조율만이 아닌, 공간적으로 공유된 몰입형 협업과 관련된 변화를 조사할 수 있었습니다. 관찰된 차이는 실재감, 조율 및 참여도에서 가장 강하게 나타났으며, 습득 지식에서는 더 약하게 나타났습니다. 이러한 패턴은 더 크거나 더 몰입감 있는 시스템이 모든 학습 성과를 향상시킨다는 일반적인 결론을 뒷받침하지 않습니다. 따라서 대형 공간 동일 장소 협업 가상 현실은 단순한 사실 회상보다는 공간 지향성, 역할 분담, 실시간 상호 모니터링 및 조정된 움직임이 필요한 교육에 가장 적합할 수 있습니다21.
몇 가지 제한 사항을 고려해야 합니다. 본 연구는 단일 기관의 젊은 성인 학부생 및 대학원생 참여자를 대상으로 수행되었으므로, 고령의 교육생, 전문 응급 구조팀 및 기술 숙련도가 낮은 학습자에 대한 일반화에는 한계가 있습니다. 과제는 구조화된 응급 물류 및 공간 탐색을 포함하고 있으며, 공간 의존도가 낮은 영역에서는 다른 양상이 나타날 수 있습니다. 성과 평가는 주관적 설문지, 인간 관찰자 등급 및 기본 시스템 로그에 의존했습니다. 의사소통 빈도, 누적 발화 시간, 움직임 동기화 및 표적 시선 행동을 포함한 세밀한 행동 텔레메트리가 기록되지 않아 팀 상호작용의 상세 기전과 조정 효율성을 정량화하는 데 한계가 있었습니다. 향후 연구에서는 지속적인 심박 변이도 및 전기 피부 활동을 포함한 생리학적 측정치와 종합적인 공간 텔레메트리를 통합해야 합니다. 또한 대인 협업과 관련된 효과를 신체적 이동 증가와 관련된 효과와 구분하기 위해 독립적인 비협업 신체 이동 대조군이 필요합니다. 참여자 집단은 타당성 기반으로 단일 학술 기관에서 모집되었으며, 심리 측정 도구 및 관찰 루브릭은 본 몰입형 패러다임에 맞게 개발 또는 수정되었습니다. 내적 신뢰도와 구성 타당도를 평가했음에도 불구하고, 자기 보고 측정값은 여전히 새로움 효과(novelty effects)에 취약합니다. 참여자 수준의 설문 데이터와 팀 수준의 관찰자 점수를 통합하는 과정에서 구조적 복잡성이 발생했습니다. 분석 수준을 맞추기 위해 클러스터 평균 집계 및 혼합 효과 모델링을 사용했으나, 향후 연구에서는 동일한 운영 분석 단위에서 병렬적인 다중 모드 데이터 수집을 우선시해야 합니다. 2주의 추적 관찰 기간으로는 효과가 더 오랜 기간 지속되는지 또는 실제 현장 성과로 전이되는지 확인할 수 없습니다. 또한, 세 가지 훈련 구성은 완전 요인 설계의 구성 요소가 아니라 총체적인 환경 비교군이었습니다. 따라서 시각적 몰입, 신체적 이동, 신체 인식 및 공유된 물리적 공동 위치가 서로 혼재되어 있어, 관찰된 차이를 단일 구성 요소의 영향으로만 돌리는 것이 불가능했습니다. 향후 연구에서는 요인 조작을 통해 이러한 요인들을 분리하고, 반복적인 훈련 노출 및 운영 전이 과제를 포함하여 조정 능력의 향상이 임상 또는 산업 현장에서 지속되는지 확인해야 합니다22.
공개 사항
저자들은 이해 상충 관계가 없습니다.
저자 기여도:
Fu Bo는 연구를 개념화하고, 실험 프로토콜을 개발하며, 데이터 수집을 관리하고, 원고의 초안을 작성하였습니다. Meng Na는 가상 현실 시뮬레이션 플랫폼의 기술적 구현을 감독하고, 통계 프로그래밍에 기여하였으며, 핵심 지적 내용을 바탕으로 원고를 공동 수정하였습니다. 두 저자 모두 제출을 위한 최종본을 승인하였습니다.
감사의 글
저자들은 본 연구를 지원해 준 Shenyang City University의 School of Intelligence and Engineering에 감사를 표합니다. 특히 대공간 공동 배치 협업 가상 현실 실험을 수행하는 데 필요한 장비와 공간 시설을 제공해 준 Key Laboratory of Virtual- Real Interaction and Digital Twin Technology Innovation 에 깊은 감사를 드립니다. 또한 몰입형 교육 세션에 자원하여 참여한 모든 학부생 및 대학원생들에게 진심 어린 감사를 표합니다. 이들의 참여와 협조는 본 연구의 성공적인 완료에 필수적이었습니다. 본 연구는 Liaoning Applied Basic Research Program 2025 (Grant No. 2025JH2/101330049), Natural Science Foundation of Liaoning Province 2024 (Grant No. 2024-MS-255), Liaoning Provincial Department of Education의 Fundamental Research Funds for Universities 2025 (Grant No. LJ212513220006) 및 Fundamental Research Funds for Universities 2024 (Grant No. LJ212413220001)의 지원을 받아 수행되었습니다.
재료
| 이름 | 회사 | 카탈로그 번호 | 댓글 |
|---|---|---|---|
| 24시간 증상 해소 연락 양식 | 연구 개발 추적 관찰 양식 | 버전 1.0 | 작업 후 불편감 지수가 있는 참가자의 증상 완화를 기록하는 데 사용됨 ≥5 |
| 음향 파티션 패널 | 범용 실험실 가구 공급업체 | 표준 휴대용 음향 파티션, 약 160–높이 180 cm | 데스크톱 참여자를 분리하고 공식 채널 외의 소통을 방지하는 데 사용됨 |
| 무알코올 소독 티슈 | 일반 실험실 위생 용품 공급업체 | 기기 안전 소독 티슈 | 세션 간 헤드 마운트 디스플레이(HMD), 컨트롤러, 마이크, 키보드, 마우스 및 공유 표면을 세척하는 데 사용됨 |
| 분석 데이터 세트 | 연구 생성 파일 | 분석_데이터셋.csv | 참가자당 한 행으로 구성된 비식별 처리된 참가자 수준 데이터 세트 |
| 기초 설문지 | 연구 개발 설문지 | 버전 1.0, 2025년 2월 최종 확정 | 인구통계학적 정보, 가상현실 경험 유무, 게임 숙련도 및 이전의 팀 훈련 경험을 수집하는 데 사용됨 |
| 경계 표시 테이프 | 범용 실험실 안전 용품 공급업체 | 미끄럼 방지 바닥 표시 테이프 | 3m 지점을 표시하는 데 사용됨 × 3m 규모의 실내 구역 및 8m 구역 × 8m 대형 공간 훈련 구역 |
| 인지 부하 척도 | 연구 적응형 작업 부하 평가 양식 | 5문항 버전 | 훈련 직후에 사용하며, 항목은 정신적 요구도, 신체적 요구도, 시간적 압박, 노력 및 좌절감을 다룹니다. |
| 컴퓨터 마우스 | 일반 컴퓨터 장비 공급업체 | 표준 유선 또는 무선 마우스 | 데스크톱 협업 시뮬레이션 조건에서의 상호작용에 사용됨 |
| 데이터 정제 로그 | 연구 생성 파일 | 데이터_정제_로그.xlsx | 점수 수정 사항, 결측치 확인, 관찰자 간 점수 조정 및 데이터셋 잠금 결정을 기록함 |
| 데이터 사전 | 연구 생성 파일 | 버전 1.0 | 변수 이름, 레이블, 코딩 규칙, 점수 범위, 결측값 처리 규칙 및 분석 수준을 정의합니다. |
| 데스크톱 모니터 | 일반 컴퓨터 장비 공급업체 | 24인치 모니터, 최소 1,920 × 1,080 해상도 | 데스크톱 협업 시뮬레이션 조건에서 사용됨 |
| 데스크톱 워크스테이션 | 일반 컴퓨터 장비 공급업체 | 최소 사양: Intel i5 또는 동급 프로세서, 16 GB RAM, 외장 그래픽 카드, Windows 10 이상 | 데스크톱 시뮬레이션, 로컬 모니터링, 설문 조사 실시 및 데이터 처리에 사용됨 |
| 일회용 헤드셋 안면 커버 | 일반 위생 용품 공급업체 | 표준 일회용 헤드마운트 디스플레이 안면 커버 | 가상 현실 세션 중 참여자의 위생 관리를 위해 사용됨 |
| 비상 정지 체크리스트 | 연구 개발 안전 양식 | 버전 1.0 | 중단 기준, 불편 사례, 안전상의 이유로 인한 중단 및 증상 해소 추적 관찰을 기록하는 데 사용됨 |
| 암호화된 기관 저장소 | 참여 기관 | 접근 제어 암호화 프로젝트 폴더 | 비식별화된 데이터 세트, 스코어링 파일, 녹음 파일 및 구문 파일을 저장하는 데 사용됨 |
| 관찰자 평가 협응 루브릭 | 연구 개발 평가 루브릭 | 5개 영역, 100점 버전 | 두 명의 눈가림 관찰자가 의사소통 타이밍, 역할 수행, 상호 지원, 공간적 협응 및 오류 복구 능력을 평가하는 데 사용됨 |
| 관찰자 점수 데이터 세트 | 연구 생성 파일 | 관찰자_점수.csv | 평균 산출 또는 합의 검토 전의 도메인 수준 관찰자 점수를 포함함 |
| 온라인 설문조사 플랫폼 | 기관 또는 라이선스 기반 설문 조사 시스템 | 2025년 데이터 수집 기간 동안 활성화된 버전 | 스크리닝, 기초 설문지, 훈련 후 설문지 및 2주 후 유지 테스트에 사용됨 |
| 쌍별 비교 패키지 | R 패키지 | R 4.3.2 버전의 최신 emmeans 버전 | 추정 한계 평균 및 Tukey 보정 쌍별 비교에 사용됨 |
| 참가자 동의서 | 연구 승인 문서 | 윤리위원회 승인 버전 | 기초선 평가 및 무작위 배정 전 사용됨 |
| 참가자 설문지 | 연구 개발 설문지 | 버전 1.0 | 스크리닝 항목, 기초선 항목, 공간적 실재감, 자기 평가 팀 협업, 학습 참여도, 인지 부하 및 불편감 척도를 포함함 |
| 휴대용 의자 | 일반 실험실 가구 공급업체 | 표준 실험실 의자 | 동의서 작성, 설문 조사, 회복 및 과제 후 모니터링 중 피실험자의 착석을 위해 사용됨 |
| R 통계 소프트웨어 | R Foundation for Statistical Computing | R 버전 4.3.2 | 데이터 정제, 신뢰도 분석, 혼합 효과 모델, 상관 분석 및 도표 작성에 사용됨 |
| 신뢰도 분석 패키지 | R 패키지 | R 4.3.2 버전과 호환되는 psych 버전 | Cronbach 계수를 계산하는 데 사용됨’Cronbach's alpha 및 급내상관계수 |
| 룸 스케일 트래킹 구역 | 참여 기관 실험실 | 분리된 3개의 3 m × 3m 간격의 표시 구역 | 룸 스케일 분산 협업 가상 현실 조건에 사용됨 |
| 안전 모니터링 양식 | 연구 개발 양식 | 버전 1.0 | 불편감 점수, 경계 이탈, 추적 중단 및 회복 상태를 기록하는 데 사용됨 |
| 화면 녹화 소프트웨어 | 범용 상용 또는 오픈 소스 화면 녹화 소프트웨어 | 2025년 데이터 수집 기간 동안 활성화된 버전 | 관찰자 평가 협응력을 위한 표준화된 기록물을 생성하는 데 사용됨 |
| 세션 체크리스트 | 연구 개발 체크리스트 | 버전 1.0 | 출석 기록, 적격성 확인, 장비 설정, 안전 점검, 작업 완료 및 중단 사항을 기록하는 데 사용됨 |
| 시뮬레이터 불편감 척도 | 연구 개발 증상 체크리스트 | 5개 항목, 0–10 버전 | 노출 전, 오리엔테이션 후, 그리고 훈련 직후에 사용됨 |
| 공간 현존감 척도 | 연구 맞춤형 설문지 | 8문항 버전 | 훈련 직후에 사용됨; 반응 범위 1–7 |
| SPSS 통계 소프트웨어 | IBM Corp. | IBM SPSS Statistics 버전 29.0 | 기술 통계, ANOVA, Welch ANOVA, 카이제곱 검정 및 가정 검정에 사용됨 |
| 통계 구문 파일 | 연구 생성 파일 | R 구문 파일, 버전 1.0 | 데이터 정제, 혼합 효과 모델, 분산 분석(ANOVA), 상관 분석 및 결과물 생성을 재현하는 데 사용됨 |
| 시스템 로그 내보내기 모듈 | 연구 개발 수출 기능 | 버전 1.0, 공식 데이터 수집 전 확정됨 | 내보낸 작업 시작 시간, 작업 종료 시간, 완료 상태, 객체 선택, 위험 반응, 경로 오류 및 중단 |
| 팀 수준 데이터 세트 | 연구 생성 파일 | 팀_수준_데이터셋.csv | 팀 수준에서의 관찰자 평가 협응 점수 및 과업 프로세스 지표를 포함함 |
| 가상현실 추적 시스템 | 상용 가상현실 하드웨어 공급업체 | 선택한 헤드셋 및 컨트롤러와 호환됨 | 참가자의 위치 및 손 움직임을 추적하는 데 사용됨 |
| 가상 교육 환경 | 맞춤 제작 교육용 소프트웨어 | 버전 1.0, 공식 데이터 수집 전 확정됨 | 협력적 응급 물류 및 공간 탐색 시나리오 구현 |
| 음성 통신 모듈 | 내장형 또는 통합형 통신 모듈 | 정식 데이터 수집 전 버전 고정 | 지정된 팀 음성 통신 채널에 사용됨 |
참고문헌
- Dede C. Immersive interfaces for engagement and learning. Science. 2009;323(5910):66-69.
- Radianti J, Majchrzak TA, Fromm J, Wohlgenannt I. A systematic review of immersive virtual reality applications for higher education: Design elements, lessons learned, and research agenda. Comput Educ. 2020;147:103778. https://doi.org/10.1016/j.compedu.2019.103778
- Cummings JJ, Bailenson JN. How immersive is enough A meta-analysis of the effect of immersive technology on user presence. Media Psychol. 2016;19(2):272-309.
- Makransky G, Petersen GB. The Cognitive Affective Model of Immersive Learning (CAMIL): A theoretical research-based model of learning in immersive virtual reality. Educ Psychol Rev. 2021;33(4):937-958.
- Dillenbourg P. What do you mean by collaborative learning In: Dillenbourg P, editor. Collaborative-learning: Cognitive and computational approaches. Oxford: Elsevier; 1999. p. 1-19.
- van der Meer N, van der Werf V, Brinkman WP, Specht M. Virtual reality and collaborative learning: A systematic literature review. Front Virtual Real. 2023;4:1159905. https://doi.org/10.3389/frvir.2023.1159905
- Johnson-Glenberg MC. Immersive VR and education: Embodied design principles that include gesture and hand controls. Front Robot AI. 2018;5:81. https://doi.org/10.3389/frobt.2018.00081
- Kirschner F, Paas F, Kirschner PA. A cognitive load approach to collaborative learning: United brains for complex tasks. Educ Psychol Rev. 2009;21(1):31-42.
- Fredricks JA, Blumenfeld PC, Paris AH. School engagement: Potential of the concept, state of the evidence. Rev Educ Res. 2004;74(1):59-109.
- Kourtesis P, Linnell J, Amir R, Argelaguet F, MacPherson SE. Cybersickness in virtual reality: The role of individual differences, cognitive functions, and virtual reality locomotion. Virtual Worlds. 2024;3(1):62-93.
- Dalgarno B, Lee MJW. What are the learning affordances of 3-D virtual environments Br J Educ Technol. 2010;41(1):10-32.
- Schubert T, Friedmann F, Regenbrecht H. The experience of presence: Factor analytic insights. Presence Teleoper Virtual Environ. 2001;10(3):266-281.
- O’Brien HL, Cairns P, Hall M. A practical approach to measuring user engagement with the refined User Engagement Scale (UES) and new User Engagement Scale Short Form (UES-SF). Int J Hum-Comput Stud. 2018;112:28-39.
- Hart SG, Staveland LE. Development of NASA-TLX (Task Load Index): Results of empirical and theoretical research. In: Hancock PA, Meshkati N, editors. Human mental workload. Amsterdam: North-Holland; 1988. p. 139-183.
- De Back TT, Tinga AM, Nguyen P, Louwerse MM. Learning in immersed collaborative virtual environments: Design and implementation. Interact Learn Environ. 2023;31(8):5364-5382.
- Slater M, Sanchez-Vives MV. Enhancing our lives with immersive virtual reality. Front Robot AI. 2016;3:74. https://doi.org/10.3389/frobt.2016.00074
- Roschelle J, Teasley SD. The construction of shared knowledge in collaborative problem solving. In: O’Malley C, editor. Computer supported collaborative learning. Berlin: Springer; 1995. p. 69-97.
- Merchant Z, Goetz ET, Cifuentes L, Keeney-Kennicutt W, Davis TJ. Effectiveness of virtual reality-based instruction on students' learning outcomes in K-12 and higher education: A meta-analysis. Comput Educ. 2014;70:29-40.
- Sweller J. Cognitive load during problem solving: Effects on learning. Cogn Sci. 1988;12(2):257-285.
- Stanney KM, Kennedy RS, Drexler JM, editors. Cybersickness is not simulator sickness. Proceedings of the Human Factors and Ergonomics Society Annual Meeting; 1997.
- Lindgren R, Johnson-Glenberg M. Emboldened by embodiment: Six precepts for research on embodied learning and mixed reality. Educ Res. 2013;42(8):445-452.
- Howard MC. A meta-analysis and systematic literature review of virtual reality rehabilitation programs. Comput Hum Behav. 2017;70:317-327.