제안된 저전압 수락 자동화 플랫폼은 사물인터넷(IoT), 시각적 워크플로우 오케스트레이션, 엣지 및 클라우드 컴퓨팅, 피처 엔지니어링, 머신러닝을 통합하여 저전압(LV) 시스템 수락 테스트를 자동화합니다. 이 플랫폼은 지능형 결함 검출, 실시간 의사결정, 자동 수락, 높은 정확도, 낮은 운영 지연 시간 및 확장 가능한 배포를 가능하게 합니다.
이 콘텐츠를 보려면 JoVE 구독이 필요합니다. 로그인하거나 오늘 무료 평가판을 시작하세요.
이 논문에서
요약
초록
저전압(LV) 네트워크의 급격한 확장과 분산 에너지 자원과의 통합으로 인해 지능형 및 자동화된 관리 솔루션이 필요하게 되었습니다. 클라우드-엣지 협업 사물인터넷(IoT) 플랫폼은 실시간 모니터링, 제어 및 데이터 수집을 지원합니다. 그러나 기존 플랫폼들은 일반적으로 워크플로우 자동화, 시각적 프로세스 오케스트레이션, 사용자 가이드 기반 의사결정 지원 및 종합적인 검증 기능이 부족합니다. 결과적으로, 이러한 플랫폼들은 자동화된 LV 네트워크 인수 테스트를 위한 프로세스 중심의 솔루션을 제공하지 못하고 있습니다. 본 연구에서는 시각화된 프로세스 캔버스 기반의 저전압 인수 자동화 플랫폼의 설계 및 평가를 제시합니다. 제안된 플랫폼은 인수 워크플로우를 시각적으로 생성, 관리 및 실행하는 프로세스 중심 아키텍처를 채택합니다. 시각적 프로세스 캔버스는 실시간 워크플로우 실행, 검증 및 의사결정을 가능하게 함으로써 기존의 정적 모니터링을 동적 워크플로우 자동화로 전환합니다. 이 프레임워크는 전기 부하 동작의 실제적인 모델링을 지원하기 위해 Open LV Network & Smart Meter 데이터셋을 통합하였습니다. 워크플로우에는 IoT 기반 데이터 수집, 데이터 전처리, 특성 공학, 시각적 프로세스 캔버스를 이용한 워크플로우 오케스트레이션, 머신러닝 기반 검증 및 실시간 대시보드 시각화가 포함됩니다. 제안된 프레임워크는 98.4%의 결함 검출률, 0.968의 수신자 조작 특성 곡선 아래 면적(ROC-AUC) 및 31 ms의 운전 의사결정 지연 시간을 달성하였으며, 이는 기존의 클라우드 중심 및 IoT 기반 베이스라인 접근 방식보다 약 30%–40% 더 우수한 성능을 보였습니다.
서론
산업 4.0 (I4.0)1 여러 신흥 기술들에 의해 가능해졌으며, 그중 산업용 사물 인터넷(IIoT)은 가장 중요한 기술 중 하나입니다. IIoT는 산업 환경에서 사물 인터넷(IoT) 기술을 적용하는 것을 의미하며, 여기에서는 서로 연결된 장치와 기계들이 주로 기계 간 상호작용을 통해 통신합니다. 산업 시스템의 고장은 상당한 운영 손실을 초래할 수 있으므로, IIoT 응용 프로그램은 기존 IoT 시스템보다 훨씬 더 많은 양의 데이터를 생성하는 동시에 매우 높은 신뢰성의 통신을 필요로 합니다.2또한, 일부 연구에서는 IIoT를 산업 4.0과 밀접하게 연관된 개념으로 간주합니다.3IoT 기술은 원활한 데이터 교환이 가능한 더욱 유연한 시스템을 구현함으로써 전통적인 계층 구조의 아키텍처를 변화시키고 있습니다.4최근 다수의 연구에서 기존의 산업 사물 인터넷(IIoT) 아키텍처를 검토하고 새로운 프레임워크 설계를 제안하였습니다.5,6,7,8,9이러한 발전에도 불구하고, 두 가지 주요한 한계점이 남아 있습니다. 첫째, 이전 아키텍처의 단점을 극복하기 위해 새로운 프레임워크가 빈번하게 제안됨에 따라, 아키텍처의 다양성과 구현 복잡성을 증가시키는 대안 모델의 수가 계속해서 늘어나고 있습니다. 둘째, 제안된 많은 아키텍처와 관련된 높은 추상화 수준으로 인해 산업 현장에서의 실질적인 도입이 제한적입니다.10.
문헌에는 여러 IIoT 아키텍처가 보고되어 있습니다. OPC(Open Platform Communications) 표준 기반의 IIoT 아키텍처가 OPC 통신 관리를 위한 Python 미들웨어와 함께 제시되었습니다11. 7계층 IIoT 아키텍처가 제안되었으나, 구현 세부 사항과 검증 실험은 제공되지 않았습니다12. 5G와 IIoT 기술을 통합한 프레임워크가 대표적인 유스케이스와 함께 설명되었지만, 실험적 검증은 제한적이었습니다13. 인더스트리 4.0을 위한 감성 디자인 프레임워크가 소개되었으며, 실험적 확인 없이 그 잠재적 영향이 논의되었습니다14. 다층 IIoT 플랫폼이 통신 측면의 고려 사항에 중점을 두고 실제 테스트베드에서 평가되었습니다15. 이와 유사하게, 실내 공기질 모니터링을 위한 모듈형 IoT 프레임워크가 제시되었으며, 어린이가 있는 84가구에서 수집한 데이터를 사용하여 그 성능을 평가하였습니다16.
사물인터넷(IoT)은 전력 부문에서 응용 가능성이 매우 큰, 빠르게 진화하는 기술이 되었습니다17,18. 전력 시스템 노드에 IoT 기술을 통합하면 스마트 그리드 내 전력 흐름에 대한 지속적인 실시간 모니터링을 기반으로 자율적인 의사결정이 가능해져, 더욱 지능적이고 효율적인 발전, 송전, 배전, 운용 및 활용이 가능합니다. 결과적으로, 이러한 지능형 노드들은 전력망의 전반적인 운용 성능을 향상시킵니다19. 스마트 그리드 구현에 있어 통신 기술은 핵심적인 구성 요소인데, 이는 센서 측정값과 제어 신호라는 두 가지 주요 범주의 정보가 안정적으로 전송되어야 하기 때문입니다. 스마트 그리드 응용 분야에서는 신뢰할 수 있는 운용을 보장하기 위해 낮은 통신 지연 시간뿐만 아니라 적절한 서비스 품질(QoS)과 충분한 데이터 보안이 요구됩니다20.
스마트 그리드 애플리케이션에 적합한 통신 기술을 선택하려면 통신 간격, 데이터 전송 속도 및 통신 비용을 고려해야 합니다21. IoT 통신 네트워크는 일반적으로 소프트웨어, 보안, 서비스, 시스템 및 연결 계층으로 구성됩니다. 연결 계층 내에서 통신 프로토콜은 일반적으로 세 가지 범주로 분류됩니다. 장거리 프로토콜에는 Long Range (LoRa) 및 Narrowband-IoT (NB-IoT)가 포함되며, 중거리 프로토콜에는 Wi-Fi, 4G/LTE 및 5G가 포함되고, 단거리 프로토콜에는 Bluetooth 및 ZigBee가 포함됩니다. 전력 시장의 규제가 점차 완화됨에 따라, 기상 조건, 장비 고장, 규제 변경 및 기타 운영 요인이 전력 서비스 비용에 미치는 영향을 평가하기 위한 부하 예측이 더욱 중요해졌습니다. 결과적으로, 정확한 주거용 부하 예측은 스마트 그리드, 마이크로그리드 및 스마트 빌딩의 운영과 감독에 필수적이 되었습니다22.
저압(LV) 네트워크의 신뢰할 수 있는 운용은 높은 전력 품질을 유지하는 것에 달려 있습니다23. 전력 품질은 불평형 운전 조건 하에서 전압 조정, 전류 균형 및 기술적 교란 완화의 효과성에 의해 결정됩니다24. 이러한 요인들 중 상 평형(phase balancing)은 각 상에 걸쳐 전압과 전류의 균일한 분포를 결정하기 때문에 특히 중요합니다25. 불량한 상 평형은 도체 가열, 전압 편차 및 중성선 전류를 증가시켜 시스템 효율성과 운용 신뢰성을 저하시킬 수 있습니다26. 따라서 시스템 성능, 운용 안정성 및 장기적 신뢰성을 향상시키기 위해 설계 과정에서 상 평형을 고려해야 합니다. 그럼에도 불구하고, 이러한 측면은 기존의 미니그리드 설계 방법론에 거의 반영되지 않고 있습니다.
워크플로 오케스트레이션 시스템의 최근 발전은 산업용 IoT 환경 내에서 이벤트 기반 자동화와 시각적 프로세스 관리의 이점을 입증해 왔습니다. 그럼에도 불구하고, 배전망 검증 및 저압 수락 시험에 대한 이러한 시스템의 적용은 여전히 제한적입니다. 대부분의 기존 저압 자동화 시스템은 주로 모니터링 및 감시 제어에 집중하고 있는 반면, 워크플로 기반의 수락 관리나 자동화된 준수 여부 검증을 조사한 연구는 상대적으로 적습니다. 마찬가지로, 머신러닝 기술이 스마트 미터 이상 탐지 및 전력 품질 평가 분야에서 상당한 관심을 끌었지만, 이러한 접근 방식은 일반적으로 통합 워크플로 오케스트레이션 프레임워크의 구성 요소라기보다 독립적인 분석 모델로 개발되었습니다.
최근 몇 년 동안 스마트 빌딩 관리 및 홈 오토메이션을 위한 다양한 스마트 에너지 미터 솔루션이 제안되었습니다27. 대학 수준의 교육 개념을 스마트 미터링 기술에 통합하는 것을 입증하기 위해 참고문헌27에서 스마트 미터 프로토타입이 제시되었습니다. 개발된 스마트 미터는 에너지 관리 및 제어 분야에서 상당한 잠재력을 보여주었으며, 양방향 IoT 통신을 통해 에너지 소비를 줄임으로써 유틸리티 기업과 소비자 모두에게 이점을 제공했습니다. 이후 지능형 에너지 모니터링을 지원하기 위해 마이크로컨트롤러 기반의 스마트 플러그 시스템이 도입되었습니다28.
제안된 스마트 플러그 시스템은 Android 기반의 그래픽 사용자 인터페이스를 통해 전력 소비량을 실시간으로 표시합니다. 또한, 이 장치는 연결된 전기 제품의 존재 여부를 감지할 수 있으며, 이러한 기능을 비침습적 부하 측정(invasive load measurement)28이라고 합니다. 구현을 위해 저비용의 상용 스마트 플러그가 사용되었습니다. 향후 개선 사항으로는 실효치(RMS) 전류, 유효 전력, 무효 전력 및 전압과 전류 사이의 위상각 모니터링이 포함됩니다. 이전 연구에서 설명한 바와 같이, 부분적으로 그리드에 연결된 태양광 마이크로그리드는 ZigBee 및 LoRa 통신 프로토콜을 사용하여 스마트 미터 장치와 정보를 교환함으로써 분산 에너지 시스템을 위한 IoT 기반 통신의 가능성을 입증하였습니다29,30.
기존 배전 시스템 계획의 한계를 해결하기 위해 공학 실무와 과학 연구는 여러 상호 보완적인 방향으로 발전해 왔습니다. 한 연구 방향은 부지 선정 및 예비 자원 평가를 위한 지리 정보 시스템(GIS)을 이용한 고수준 계획에 집중해 왔습니다31,32. 또 다른 방향은 도체 선정, 최적 발전 및 에너지 저장 용량 산정, 그리고 교류(AC) 및 직류(DC) 배전 시스템의 비교 평가를 포함하여 개별 구성 요소와 하위 시스템을 개선하는 데 집중했습니다33,34,35,36. 세 번째 연구 방향은 최적화 알고리즘을 배전망 계획, 피더 경로 설정 및 네트워크 토폴로지 설계에 적용한 것입니다. 최근의 발전 사례로는 장치 배치와 네트워크 구성을 통합한 연구진의 uGrid 플랫폼과 같은 프레임워크가 있으나, 검증 및 최적화를 위한 표준 조류 계산 분석이 부족한 실정입니다. 다른 접근 방식들은 토폴로지 생성을 위해 수동 매개변수 튜닝에 의존하거나 저전력 DC 마이크로그리드와 같은 특수 응용 분야에 집중하고 있습니다37,38,39. 이러한 접근 방식들이 상당한 진전을 나타내고 있음에도 불구하고, 저압 배전 시스템의 엔드투엔드 설계를 위한 통합 방법론을 구축하기 위해서는 추가적인 연구가 필요합니다. 또한 단상, 3상 및 하이브리드 저압 시스템에 대한 종합적인 기술 경제성 평가는 여전히 제한적인 상태입니다.
인공지능(AI) 및 머신러닝의 최근 발전은 지능형 전력 시스템의 역량을 더욱 확장시켰습니다. 한 종합적인 리뷰에서는 연합 학습(Federated Learning), 생성형 AI(Generative AI), 대규모 언어 모델(Large Language Models), 지능형 사물인터넷(AIoT) 및 디지털 트윈(Digital Twins)과 같은 신흥 기술을 포함하여 스마트 그리드에서의 AI 및 머신러닝 적용 사례를 요약하여 제시하였습니다40. 해당 리뷰는 부하 예측, 예측 유지보수, 이상 징후 탐지, 수요 측면 관리 및 전기차 통합 분야의 응용 사례를 강조하는 한편, 상호 운용성, 개인정보 보호, 확장성, 강건성 및 윤리적 고려 사항과 관련된 지속적인 과제들을 역설하였습니다. 또 다른 최근 리뷰에서는 분산형 에너지 제어를 위한 머신러닝, 강화 학습 및 다중 에이전트 시스템에 초점을 맞추어, IoT-엣지-클라우드 인프라 내 분산 에너지 관리를 위한 AI 방법론을 평가하였습니다41.
종합적으로, 이전의 연구들은 저압(LV) 배전 시스템을 위한 IoT 기반 모니터링, 스마트 미터링, 클라우드-엣지 컴퓨팅, 인공지능 및 지능형 에너지 관리를 발전시켜 왔습니다. 하지만 이러한 기술들은 대부분 독립적으로 개발되었습니다. 워크플로우 오케스트레이션, 자동화된 수락 관리, 프로세스 기반 검증 및 통합 의사결정 지원은 여전히 제한적인 상황이며, 이는 통합된 워크플로우 중심 자동화 프레임워크의 필요성을 강조합니다.
따라서 본 연구에서는 시각화된 프로세스 캔버스를 기반으로 하는 저압 수전 자동화 플랫폼을 제시합니다. 제안된 프레임워크는 실제 스마트 미터 데이터를 사용하여 자동화되고 신뢰할 수 있는 LV 네트워크 수전 시험을 지원하기 위해 IoT 기반 데이터 수집, 데이터 전처리, 특성 공학, 워크플로 오케스트레이션, 머신러닝 기반 검증, 클라우드-엣지 컴퓨팅 및 실시간 시각화를 통합 아키텍처 내에 통합합니다. 그림 1은 제안된 플랫폼의 워크플로 지향 아키텍처에 대한 개요를 제공합니다. 이 워크플로는 데이터 수집, 전처리, 특성 공학, 워크플로 오케스트레이션, 지능형 의사결정 및 클라우드-엣지 통합으로 구성되어, 프로세스 지향 프레임워크를 통한 LV 배전망의 자동 검증을 가능하게 합니다. 이 플랫폼은 기존 방식과 비교하여 운영 의사결정 지연 시간과 워크플로 실행 시간을 단축하는 동시에 높은 검증 정확도를 입증했습니다.
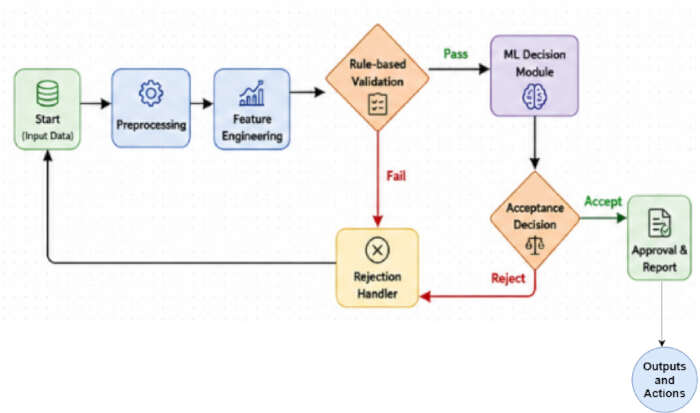
그림 1. 제안된 저압 수락 자동화 플랫폼의 워크플로우 중심 아키텍처. 제안된 프로세스 기반 저압(LV) 수락 자동화 플랫폼의 상위 수준 아키텍처. 이 프레임워크는 LV 배전망 검증을 위한 IoT 기반 데이터 수집, 데이터 전처리, 특성 공학, 워크플로우 오케스트레이션, 지능형 의사결정, 클라우드-엣지 협업 및 자동 수락의 순차적 통합을 보여줍니다. IoT = 사물 인터넷; LV = 저압; ML = 머신 러닝. 이 그림의 더 큰 버전을 보려면 여기를 클릭하십시오.
액세스가 제한되었습니다. 이 콘텐츠를 보려면 로그인하거나 체험판을 시작하세요.
프로토콜
This study did not involve human participants, animals, or identifiable personal data. The analyses were performed using a publicly available dataset (UK Power Networks Open LV Network & Smart Meter dataset) together with synthetically generated data for validation; therefore, ethics committee approval and informed consent were not required. The research tools used in the protocol are listed in the Table of Materials.
1. Data acquisition
The Low-Voltage (LV) Acceptance Automation Platform was developed using electrical measurements acquired from smart meters, IoT sensors, and the Open LV Network & Smart Meter Dataset. Electrical parameters, including voltage, current, active power, reactive power, and energy consumption, were collected through Wi-Fi-, PLC-, and RS-485-based communication protocols. Real-time measurements were used for live system monitoring, whereas historical data supported model development and validation.
The proposed framework used the Open LV Network & Smart Meter Dataset provided by UK Power Networks42. The dataset comprises household smart meter consumption, feeder-level load profiles, and feeder voltage measurements. Time-series subsets containing load consumption and voltage data were selected for model training and evaluation. In addition, a simulated smart meter dataset was generated to represent operational conditions and fault scenarios required for workflow validation and machine learning model evaluation. The simulated dataset included timestamped measurements of voltage, current, active power, reactive power, energy consumption, total harmonic distortion (THD), and voltage imbalance. Fault samples were generated by simulating undervoltage, overvoltage, excessive harmonic distortion, and voltage imbalance based on established low-voltage operational thresholds. The dataset characteristics are summarized in Table 1.
| Attribute | Description |
| Dataset Name | Open LV Network & Smart Meter Dataset |
| Simulated Smart Meter Dataset | Geneated 1000 smaples for Fault simulation and workflow validation |
| Data Type | Time-series (historical smart meter data) |
| Data Granularity | Household-level and feeder-level measurements |
| Key Features | Voltage, current, active power, reactive power, energy consumption, timestamps |
| Data Frequency | High-resolution (e.g., half-hourly / minute-level depending on subset) |
| Coverage | Residential low-voltage distribution networks |
| Usage in Proposed Work | Model training, validation, load behavior analysis, and acceptance workflow evaluation |
Table 1: Dataset description. Summary of the Open LV Network & Smart Meter dataset used for model development and performance evaluation. The table presents the dataset components, measured electrical variables, sampling characteristics, and dataset partitioning for training, validation, and testing.
Because the Open LV Network & Smart Meter Dataset does not contain predefined fault labels, a rule-based labeling strategy was applied to both the real and simulated datasets. Samples satisfying normal operating limits were assigned a label of 0 (Normal), whereas samples exceeding operational thresholds (e.g., voltage deviations greater than ±10% of the nominal voltage, THD > 5%, or voltage unbalance > 2%) were assigned a label of 1 (Fault). These labels served as the ground truth during model training, validation, and testing. The proposed rule engine also allows threshold values to be configured in accordance with regional standards or utility-specific acceptance criteria.
The dataset was partitioned into training (70%), validation (15%), and testing (15%) subsets. Missing values were addressed using linear interpolation, mean imputation, and forward-fill techniques as described in the preprocessing stage. To ensure statistical robustness and reproducibility, all experiments were repeated five times using different random seeds.
2. Data preprocessing
Raw data from the Open LV Network & Smart Meter Dataset and IoT sensor measurements were preprocessed to improve data quality prior to feature extraction and model development. Missing values, noise, and inconsistencies caused by communication interruptions and sensor malfunctions were identified and corrected using interpolation, mean imputation, and forward-fill techniques. The detailed mathematical derivations are provided in Supplementary File 1 (Section S1).
The preprocessed time-series data were segmented into representative operational intervals (S₁–S₅ and Sk). Statistical and electrical features, including average load, peak load, minimum load, standard deviation, voltage deviation, and power consumption, were extracted from each segment. The extracted features are summarized in Table 2 and served as inputs for the subsequent feature engineering stage.
| Segment ID | Mean Load (kW) | Peak Load (kW) | Min Load (kW) | Std Deviation (kW) | Voltage Deviation (p.u.) | Power Consumption (kWh) | Time Interval |
| S₁ | 2.45 | 3.8 | 1.2 | 0.65 | 0.032 | 58.4 | 00:00–01:00 |
| S₂ | 2.9 | 4.1 | 1.5 | 0.72 | 0.028 | 64.2 | 01:00–02:00 |
| S₃ | 3.25 | 4.85 | 1.8 | 0.81 | 0.035 | 71.6 | 02:00–03:00 |
| S₄ | 3.8 | 5.2 | 2.1 | 0.9 | 0.041 | 78.9 | 03:00–04:00 |
| S₅ | 4.1 | 5.75 | 2.4 | 0.95 | 0.045 | 85.3 | 04:00–05:00 |
| Sk | 3.6 | 5.1 | 2 | 0.88 | 0.038 | 76.5 | tk |
Table 2: Representative feature representation extracted from time-series segments. Representative statistical, electrical, load behavior, voltage stability, and power quality features extracted from segmented LV time-series data during feature engineering. The values illustrate the engineered feature representation and are not experimental performance results. LF = Load Factor; PAR = Peak-to-Average Ratio; VSI = Voltage Stability Index; PF = Power Factor; THD = Total Harmonic Distortion.
3. Feature engineering
Feature engineering was performed to improve the representation of the preprocessed data for workflow orchestration and intelligent decision-making. Principal Component Analysis (PCA)^43 was applied to reduce data dimensionality by removing redundant and highly correlated variables while retaining the most informative feature components. The mathematical derivations are provided in Supplementary File 1 (Section S2).
Statistical descriptors, load behavior indicators, voltage stability indices, and power quality metrics were derived from the segmented time-series data. These engineered features included Load Factor (LF), Peak-to-Average Ratio (PAR), Voltage Stability Index (VSI), Voltage Unbalance Index, Power Factor (PF), and Total Harmonic Distortion (THD). The resulting feature set was used as the input to the workflow orchestration and intelligent decision-making modules.
The feature engineering workflow is summarized in Supplementary File 1 (Supplementary Algorithm 1). The procedure consisted of segmenting the preprocessed data, extracting statistical and electrical features, calculating load behavior, voltage stability, and power quality indicators, and applying PCA to generate the final feature vector used for model training and validation.
4. Visualized process canvas design
The Visualized Process Canvas was developed as a graph-based workflow orchestration framework for automating low-voltage (LV) acceptance procedures. The workflow was represented as a directed graph, G = (N, E), where N = {n1, n2, …, nm}denotes the workflow nodes corresponding to individual processing stages (e.g., data input, preprocessing, validation, and decision-making), and E = {eij}represents the directed edges defining the execution sequence between nodes. This graph-based representation enabled the creation of configurable workflows and their automated execution without manual coding.
Each workflow node performed a specific processing task by receiving input data, executing predefined operations, and forwarding the processed output to subsequent nodes. Acceptance criteria, including voltage and load thresholds, were implemented as configurable validation rules that could be updated without modifying the workflow structure. The workflow supported both sequential and parallel execution to improve computational efficiency. Machine learning models were integrated into designated workflow nodes to perform anomaly detection and automated acceptance validation (Figure 2).
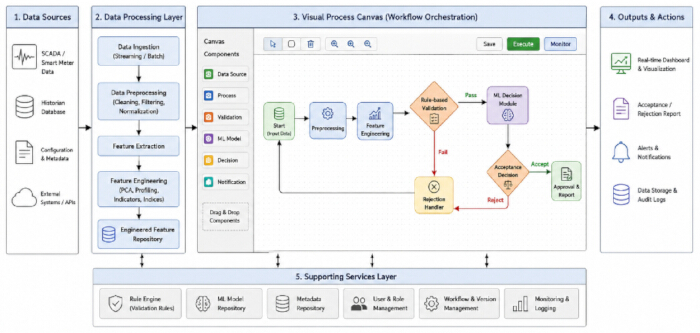
Figure 2: Visualized process canvas architecture for LV acceptance automation. Overview of the visual workflow orchestration framework used for LV acceptance automation. The process canvas illustrates the graphical organization of workflow nodes for data processing, feature engineering, rule-based validation, intelligent decision-making, and output generation to support workflow design, execution, and monitoring. Please click here to view a larger version of this figure.
The mathematical formulation describing information flow through the workflow graph is provided in Supplementary File 1 (Section S3). Supplementary File 1 (Supplementary Algorithm 2) describes the workflow orchestration procedure, including workflow traversal, node execution, rule validation, decision generation, and output aggregation.
The Visualized Process Canvas was implemented using a microservice-oriented software architecture to support scalability and modular deployment. The graphical workflow interface was developed using React.js to provide drag-and-drop workflow configuration. Backend orchestration services were implemented using Flask/FastAPI, while Eclipse Mosquitto served as the MQTT message broker for communication between workflow modules. EdgeX Foundry provided edge device management and IoT integration. Machine learning services were implemented with Scikit-learn, TensorFlow, and PyTorch, and containerized with Docker and Kubernetes.
5. Workflow orchestration engine
The workflow orchestration engine coordinated execution of the configured acceptance workflow. A detailed description is provided in Supplementary File 1 (Section S4), and the execution sequence is summarized in Supplementary Figure 1.
The workflow execution process consisted of validating the workflow definition, initializing the execution environment, scheduling workflow nodes according to their dependencies, executing nodes sequentially or in parallel, applying rule-based validation, aggregating intermediate outputs, and generating the final acceptance or rejection decision based on rule-based and machine learning evaluation. Execution results were published through dashboards, reports, application programming interfaces (APIs), and data storage services. The overall workflow orchestration process is illustrated in Figure 3.
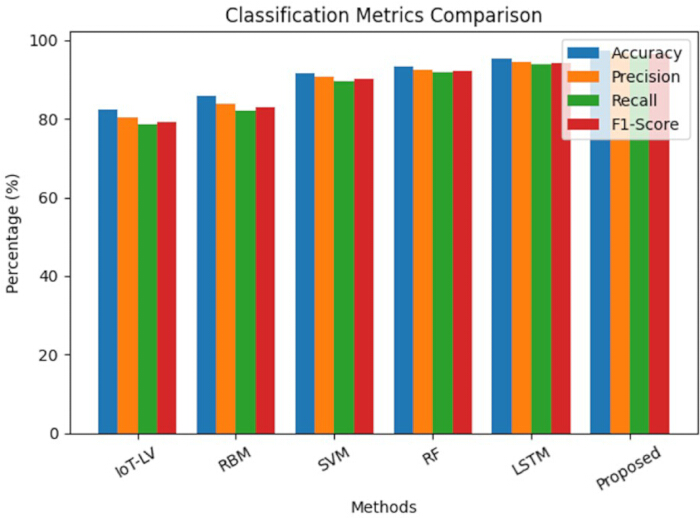
Figure 3: Comparison of classification performance metrics across different methods. Comparison of the classification performance of IoT-LV, RBM, Support Vector Machine (SVM), Random Forest (RF), Long Short-Term Memory (LSTM), and the proposed framework using the Open LV Network & Smart Meter dataset. Performance is evaluated using Accuracy, Precision, Recall, and F1-score. Results are presented as mean ± standard deviation (SD) from five independent experimental runs using a 70%/15%/15% training/validation/testing split. Error bars represent one standard deviation. Please click here to view a larger version of this figure.
6. Intelligent decision module
The Intelligent Decision Module was developed to automate low-voltage (LV) acceptance decisions using supervised machine learning models. Classification and regression algorithms were applied to the engineered feature vectors to support operational decision-making. Classification models identified normal and abnormal operating conditions, whereas regression models estimated future energy consumption and operational trends.
The input feature vector, X ∈ ℝd, comprised the statistical, voltage stability, load behavior, and power quality features extracted during the feature engineering stage. Standalone Support Vector Machine (SVM)44, Random Forest (RF)45, and Long Short-Term Memory (LSTM)46 models were implemented as baseline classifiers for comparative evaluation. The mathematical formulation of the learning models is provided in Supplementary File 1 (Section S5).
For classification, the output variable y ∈ {0,1} represented normal (0) and abnormal (1) operating conditions. When abnormal operating conditions or overload events were detected, the workflow generated a fault notification and flagged the acceptance process as invalid; otherwise, the process was classified as accepted.
The workflow orchestration engine integrated machine-learning predictions with rule-based validation, using a priority-based conflict-resolution strategy. Safety-critical operational rules and regulatory acceptance criteria were treated as hard constraints and therefore took precedence over machine-learning predictions when conflicts occurred. Final acceptance decisions were generated using the combined outputs of the rule-based validation and intelligent decision modules.
7. Cloud–edge integration and visualization dashboard
A cloud-edge computing architecture was implemented to support scalable data processing, storage, and visualization for the LV acceptance automation platform. Smart meters, SCADA systems, and IoT devices continuously collect electrical measurements, which are processed at the edge layer via filtering, normalization, feature extraction, and real-time inference to reduce communication overhead and enable low-latency decision-making. The mathematical derivations are provided in Supplementary File 1 (Section S6).
Processed data were transmitted to the cloud layer for long-term storage, advanced analytics, feature engineering, model training, and model management. Interactive dashboards provided real-time system monitoring, alerts, reporting, and operational decision support. The cloud-edge architecture is illustrated in Supplementary Figure 2, and the implementation details are summarized in Table 3.
| Layer | Component | Hardware / Software | Specification / Version | Purpose / Description |
| Edge Layer | Edge Device | Raspberry Pi 4 / NVIDIA Jetson Nano | Quad-core CPU, 4–8 GB RAM | Real-time data acquisition and local processing |
| IoT Gateway | Industrial IoT Gateway | MQTT / Modbus / OPC-UA support | Communication between sensors and edge/cloud | |
| Sensors / Smart Meters | Digital Smart Meters | Voltage, Current, Power Measurement | Data collection from LV network | |
| Edge Software | Python, EdgeX Foundry, MQTT Broker | Python 3.x | Data preprocessing, filtering, local inference | |
| Communication Protocols | Wi-Fi / PLC / RS-485 | Standard protocols | Data transmission to cloud layer | |
| Cloud Layer | Cloud Platform | AWS / Microsoft Azure / Google Cloud | Scalable cloud services | Data storage, analytics, and model training |
| Storage | AWS S3 / Azure Blob / InfluxDB | Time-series database | Storing historical and real-time data | |
| Compute & ML | Python, TensorFlow, PyTorch, Scikit-learn | ML libraries (latest versions) | Model training, evaluation, deployment | |
| Containerization | Docker, Kubernetes | Latest stable versions | Workflow orchestration and scalability | |
| Data Processing | Apache Spark / Pandas | Distributed processing | Large-scale data analytics | |
| Visualization Layer | Dashboard Tools | Grafana / Apache Superset / Plotly Dash | Web-based tools | Real-time monitoring and visualization |
| Web Framework | React.js / Angular / Flask / FastAPI | Modern web stack | UI development and API integration | |
| Notification System | Email / SMS Gateway / Push Notifications | Twilio / Firebase | Alert generation and communication | |
| API Services | REST APIs | JSON-based communication | Integration between modules |
Table 3: System implementation details. Summary of the hardware configuration, software environment, communication protocols, and cloud–edge computing components used for implementing the proposed LV acceptance automation platform.
액세스가 제한되었습니다. 이 콘텐츠를 보려면 로그인하거나 체험판을 시작하세요.
결과
The performance of the proposed Low-Voltage (LV) Acceptance Automation Platform was evaluated using the Open LV Network & Smart Meter Dataset together with a synthetic smart meter dataset generated to represent additional operating conditions and fault scenarios. The synthetic dataset enabled controlled evaluation of workflow orchestration, intelligent decision-making, and fault detection under abnormal operating conditions. The Open LV Network & Smart Meter Dataset comprised household smart meter measurements, f...
액세스가 제한되었습니다. 이 콘텐츠를 보려면 로그인하거나 체험판을 시작하세요.
토론
실험적 평가 결과, 제안된 워크플로우 지향적 저압(LV) 수락 자동화 플랫폼이 분류, 예측, 결함 검출, 운영 결정 지연 시간 및 확장성 측면에서 벤치마크 방식보다 일관되게 우수한 성능을 보였다. 이러한 성능 향상은 단일 머신러닝 모델의 사용보다는 고급 특성 공학, 워크플로우 오케스트레이션, 클라우드-엣지 협업, 그리고 규칙 기반과 머신러닝이 결합된 하이브리드 의사결정의 통합에서 비롯되었다. 이러한 결과는 워크플로우 지향적 자동화와 지능형 IoT 아키텍처가 산업 및 스마트 그리드 응용 분야에서 운영 효율성, 상호 운용성 및 의사결정 지원을 개선한다는 이전 연구 결과들과 일치한다2,3,9,10,18.
액세스가 제한되었습니다. 이 콘텐츠를 보려면 로그인하거나 체험판을 시작하세요.
공개 사항
저자들은 경쟁 관계에 있는 재정적 또는 비재정적 이해관계가 없음을 선언합니다.
감사의 글
The authors thank the UK Power Networks Open Data Portal for providing the publicly available Open LV Network & Smart Meter dataset used in this study. This research received no external funding.
액세스가 제한되었습니다. 이 콘텐츠를 보려면 로그인하거나 체험판을 시작하세요.
재료
| 이름 | 회사 | 카탈로그 번호 | 댓글 |
|---|---|---|---|
| Apache Spark | Apache Software Foundation | Version 3.4+ | 대규모 데이터 분석 |
| Apache Superset | Apache Software Foundation | Version 3.x | 분석 대시보드 |
| Docker Engine | Docker Inc. | Version 24.x | 애플리케이션 배포 |
| Eclipse Mosquitto MQTT Broker | Eclipse Foundation | Version 2.x | 데이터 교환 |
| EdgeX Foundry (Jakarta Release or later) | LF Edge (Linux Foundation) | Version Jakarta / Geneva | 에지 장치 관리 |
| Flask / FastAPI | Pallets Projects / Sebastián Ramírez | Flask 2.3+ / FastAPI 0.100+ | 백엔드 API 통합 |
| Grafana | Grafana Labs | Version 10.x | 시각화 및 모니터링 |
| Industrial IoT Gateway | Advantech / Siemens | ECU-1251 / SIMATIC IOT2040 | 센서-클라우드 통신 |
| IoT Sensors (Voltage/Current Sensors) | Texas Instruments / Analog Devices | INA219 / ACS712 | 실시간 네트워크 모니터링 |
| Jetson Nano Developer Kit | NVIDIA Corporation | 945-13450-0000-100 | 에지 AI 추론 |
| Kubernetes | Cloud Native Computing Foundation (CNCF) | Version 1.27+ | 워크플로우 확장성 |
| LSTM Model (Keras/TensorFlow) | Google (TensorFlow/Keras) | Included in TF 2.12+ | 부하 예측 및 전망 |
| PLC (Power Line Communication) Module | STMicroelectronics | ST7580 | 스마트 그리드 통신 |
| Plotly Dash | Plotly Inc. | Version 2.x | 대화형 시각화 |
| Python 3.10 | Python Software Foundation | Version 3.10.x | 데이터 처리 및 분석 |
| PyTorch | Meta AI | Version 2.0+ | 딥러닝 구현 |
| Random Forest Algorithm | Scikit-learn | Included in v1.3+ | 결함 분류 |
| Raspberry Pi 4 Model B (4GB RAM) | Raspberry Pi Foundation | RPI4-MODBP-4GB | 에지 프로세싱 |
| React.js / Angular | Meta / Google | React 18.x / Angular 16+ | 사용자 인터페이스 개발 |
| RS-485 Transceiver Module | Maxim Integrated (Analog Devices) | MAX485 | 산업용 장치 연결성 |
| Scikit-learn | Scikit-learn Developers | Version 1.3+ | 머신러닝 모델 |
| Support Vector Machine (SVM) | Scikit-learn | Included in v1.3+ | 분류 및 검증 |
| TensorFlow | Google LLC | Version 2.12+ | 모델 학습 |
| Twilio / Firebase Cloud Messaging | Twilio Inc. / Google | 해당 없음 | 경고 및 알림 |
| Wi-Fi Module | Espressif Systems | ESP8266 / ESP32 | 데이터 전송 |
| XGBoost | DMLC (Distributed ML Community) | Version 1.7+ | 지능형 의사결정 지원 |
참고문헌
- Tong L, Zhou J, Li J. IoT-based low-voltage power distribution system management and control platform. Front Energy Res. 2022;10:902715. https://doi.org/10.3389/fenrg.2022.902715
- Babayigit B, Abubaker M. Industrial Internet of Things: A review of improvements over traditional SCADA systems for industrial automation. IEEE Syst J. 2023;18:120–133.
- Nakagawa EY, et al. Industry 4.0 reference architectures: State of the art and future trends. Comput Ind Eng. 2021;156:107241. https://doi.org/10.1016/j.cie.2021.107241
- Ladegourdie M, Kua J. Performance analysis of OPC UA for industrial interoperability towards Industry 4.0. Internet Things. 2022;3:507–525.
- Bader SR, Maleshkova M, Lohmann S. Structuring reference architectures for the industrial Internet of Things. Future Internet. 2019;11:151. https://doi.org/10.3390/fi11070151
- Fun TS, Samsudin A. Recent technologies, security countermeasure and ongoing challenges of industrial Internet of Things (IIoT): A survey. Sensors (Basel). 2021;21:6647. https://doi.org/10.3390/s21196647
- Mirani AA, et al. Key challenges and emerging technologies in industrial IoT architectures: A review. Sensors (Basel). 2022;22:5836. https://doi.org/10.3390/s22155836
- Fraile F, et al. Reference models for digital manufacturing platforms. Appl Sci. 2019;9:4433. https://doi.org/10.3390/app9204433
- Serôdio C, et al. Software and architecture orchestration for process control in Industry 4.0 enabled by cyber-physical systems technologies. Appl Sci. 2024;14:2160. https://doi.org/10.3390/app14052160
- Ungurean I, Gaitan NC. A software architecture for the industrial Internet of Things—A conceptual model. Sensors (Basel). 2020;20:5603. https://doi.org/10.3390/s20195603
- Hsiao CH, Lee WP. OPIIoT: Design and implementation of an open communication protocol platform for industrial Internet of Things. Internet Things. 2021;16:100441. https://doi.org/10.1016/j.iot.2021.100441
- Domínguez-Bolaño T, et al. An overview of IoT architectures, technologies, and existing open-source projects. Internet Things. 2022;20:100626. https://doi.org/10.1016/j.iot.2022.100626
- Sasiain J, et al. Towards flexible integration of 5G and IIoT technologies in Industry 4.0: A practical use case. Appl Sci. 2020;10:7670. https://doi.org/10.3390/app10217670
- Cañas H, et al. A conceptual framework for smart production planning and control in Industry 4.0. Comput Ind Eng. 2022;173:108659. https://doi.org/10.1016/j.cie.2022.108659
- Cabrini FH, et al. Enabling the industrial Internet of Things to cloud continuum in a real city environment. Sensors (Basel). 2021;21:7707. https://doi.org/10.3390/s21227707
- Gabriel MF, et al. Implementation of an IoT architecture for promoting healthy air quality in 84 homes of families with children. Build Environ. 2024;266:112040. https://doi.org/10.1016/j.buildenv.2024.112040
- Silva BN, Khan M, Han K. Internet of Things: A comprehensive review of enabling technologies, architecture, and challenges. IETE Tech Rev. 2018;35:205–220.
- Dhaou ISB, et al. Internet of Things technologies for smart grid. In: Research Anthology on Smart Grid and Microgrid Development. IGI Global; Hershey; 2022. p. 805–832.
- Kondoro A, et al. A low latency secure communication architecture for microgrid control. Energies. 2021;14:6262. https://doi.org/10.3390/en14196262
- Tightiz L, Yang H. A comprehensive review on IoT protocols' features in smart grid communication. Energies. 2020;13:2762. https://doi.org/10.3390/en13112762
- Kondoro A, et al. Real-time performance analysis of secure IoT protocols for microgrid communication. Future Gener Comput Syst. 2021;116:1–12.
- Rodrigues R, et al. A review of solid-state circuit breakers. IEEE Trans Power Electron. 2020;36:364–377.
- IEEE. IEEE Std 1159-2019: IEEE recommended practice for monitoring electric power quality. IEEE; Piscataway (NJ); 2019. https://doi.org/10.1109/IEEESTD.2019.8800097
- Otcenasova A, et al. The influence of power quality indices on active power losses in a local distribution grid. Energies. 2019;12:1389. https://doi.org/10.3390/en12071389
- Ma K, et al. Review of distribution network phase unbalance: Scale, causes, consequences, solutions, and future research direction. CSEE J Power Energy Syst. 2020;6:479–488.
- Peppanen J, et al. Modeling power electronic equipment to improve distribution feeder current and voltage balance [Presentation]. Presented at: IEEE PES Transmission and Distribution Conference and Exposition (T&D); Denver, CO; 2018. Available from: https://ieeexplore.ieee.org/ https://doi.org/10.1109/TDC.2018.8440261
- Sayed S, et al. Design and realization of an open-source and modular smart meter. Energy Sci Eng. 2019;7:1405–1422.
- Satapathy LM, et al. Arduino based home automation using Internet of Things (IoT). Int J Pure Appl Math. 2018;118:769–778.
- Shaban M, et al. Design of a partially grid-connected photovoltaic microgrid using IoT technology. Appl Sci. 2021;11:11651. https://doi.org/10.3390/app112411651
- Shaban M, Dhaou IB. Design of an IoT-enabled microgrid architecture for a partial grid-connected mode [Presentation]. Presented at: 18th International Multi-Conference on Systems, Signals and Devices (SSD); Virtual; 2021. Available from: https://ieeexplore.ieee.org/ https://doi.org/10.1109/SSD52085.2021.9429443
- Taye BZ, et al. Rural electrification planning using geographic information system (GIS). Cogent Eng. 2020;7:1836730. https://doi.org/10.1080/23311916.2020.1836730
- Huld T, et al. Geospatial analysis of photovoltaic mini-grid system performance. Energies. 2017;10:218. https://doi.org/10.3390/en10020218
- Domínguez J, et al. IntiGIS-Local: A geospatial approach to assessing rural electrification alternatives for sustainable socio-economic development in isolated communities—A case study of Guasasa, Cuba. Energies. 2024;17:3835. https://doi.org/10.3390/en17153835
- Tafula JE, et al. Multicriteria decision-making approach for optimum site selection for off-grid solar photovoltaic microgrids in Mozambique. Energies. 2023;16:2894. https://doi.org/10.3390/en16062894
- Isihak S, et al. Evolution of GIS-based rural electrification planning models and an application of OnSSET in Nigeria. Renew Sustain Energy Transit. 2022;2:100019. https://doi.org/10.1016/j.rset.2022.100019
- Korkovelos A, et al. The role of open access data in geospatial electrification planning and the achievement of SDG7: An OnSSET-based case study for Malawi. Energies. 2019;12:1395. https://doi.org/10.3390/en12071395
- Cicilio P, et al. uGrid: Reliable minigrid design and planning toolset for rural electrification. IEEE Access. 2019;7:163988–163999.
- Nasir M, et al. Optimal planning and design of low-voltage low-power solar DC microgrids. IEEE Trans Power Syst. 2018;33:2919–2928.
- Vai V, et al. Optimal low-voltage distribution topology with integration of PV and storage for rural electrification in developing countries: A case study of Cambodia. J Mod Power Syst Clean Energy. 2020;8:531–539.
- Banad Y, Sharif S, Rezaei Z. Artificial intelligence and machine learning for smart grids: from foundational paradigms to emerging technologies with digital twin and large language model-driven intelligence. Energy Convers Manag X. 2025;28:101329. https://doi.org/10.1016/j.ecmx.2025.101329
- Álvarez-López C, González-Briones A, Li T. Explainable AI and multi-agent systems for energy management in IoT-edge environments: a state-of-the-art review. Electronics. 2026;15(2):385. https://doi.org/10.3390/electronics15020385
- UK Power Networks. Open data portal [Online]. Available from: https://www.ukpowernetworks.co.uk/our-company/open-data-portal (Accessed June 2026).
- Jolliffe IT. Principal Component Analysis. 2nd ed. Springer; New York; 2002. https://doi.org/10.1007/b98835
- Cortes C, Vapnik V. Support-vector networks. Mach Learn. 1995;20:273–297.
- Breiman L. Random forests. Mach Learn. 2001;45:5–32.
- Hochreiter S, Schmidhuber J. Long short-term memory. Neural Comput. 1997;9:1735–1780.
- Fawcett T. An introduction to ROC analysis. Pattern Recognit Lett. 2006;27:861–874.
- Montgomery DC, Runger GC. Applied Statistics and Probability for Engineers. 8th ed. John Wiley & Sons; Hoboken (NJ); 2020.
- Montgomery DC. Design and Analysis of Experiments. 10th ed. John Wiley & Sons; Hoboken (NJ); 2020.
액세스가 제한되었습니다. 이 콘텐츠를 보려면 로그인하거나 체험판을 시작하세요.