A Bayesian framework is presented for predicting future order statistics from the Lomax distribution, providing predictive inference and uncertainty quantification for Type-II censored lifetime data.
연구 논문
Bayesian Predictive Inference for Future Order Statistics from the Two-Parameter Lomax Distribution under Type-II Censoring
이 논문에서
요약
초록
This study develops Bayesian predictive procedures for future order statistics from the two-parameter Lomax distribution under Type-II censored sampling schemes. The proposed framework combines predictive likelihood inference with Bayesian prediction based on independent gamma priors and Markov Chain Monte Carlo (MCMC) simulation using the Metropolis–Hastings algorithm. Bayesian point predictors are derived under the squared error, LINEX, and general entropy loss functions, and predictive intervals are constructed from posterior predictive samples. A detailed Monte Carlo simulation study compares the proposed methods with the classical predictive maximum-likelihood approach across varying sample sizes and censoring levels. For the small-sample scenario (n = 20, r = 14), the Bayesian-LINEX predictor reduced the mean squared prediction error (MSPE) from 0.1542–0.1182, decreased the average predictive interval width (APIW) from 2.4512–2.1985, and increased the coverage probability (CP) from 0.938–0.952 compared with the predictive maximum likelihood method. Overall, the Bayesian methods consistently outperformed the classical approach across all simulation settings, with the Bayesian-LINEX predictor achieving the best predictive performance. These findings demonstrate that the proposed Bayesian framework provides a more accurate and consistent approach for predicting future order statistics from the Lomax distribution while accounting for parameter uncertainty.
서론
The Lomax distribution, also known as the Pareto Type II distribution, is widely used to model lifetime data because of its flexibility in capturing heavy-tailed behavior and its applicability to a broad range of reliability and survival phenomena. Owing to its desirable mathematical properties and practical utility, it has been applied extensively in engineering, economics, actuarial science, and risk analysis. Considerable efforts have therefore been devoted to extending the classical Lomax distribution to improve its flexibility and accommodate different hazard-rate behaviors. Several extensions have been proposed, including the extended Lomax distribution, the weighted Lomax distribution, and a generalized Lomax model capable of representing increasing, decreasing, and constant hazard-rate functions1,2,3. Subsequent developments introduced the inverse-power Lomax distribution, investigated inference under progressive first-failure censoring, proposed the Nadarajah–Haghighi Lomax distribution, and demonstrated the application of the Marshall–Olkin extended Lomax distribution to censored lifetime data4,5,6,7. Collectively, these studies illustrate the versatility of the Lomax family for modeling lifetime data arising from diverse reliability scenarios.
Beyond parameter estimation, prediction of future observations has become an important area of research in reliability engineering, maintenance planning, survival analysis, and quality control. Bayesian prediction has received increasing attention because it incorporates prior information together with observed data, allowing uncertainty to be quantified naturally through posterior predictive distributions. Bayesian estimation and prediction procedures have been developed for exponentiated Gumbel Type-II progressively censored data and Burr Type III distributions under unified progressive hybrid censoring schemes8,9. Similar approaches have also been reported for other lifetime distributions under different censoring mechanisms, further demonstrating the value of Bayesian predictive inference in reliability studies10,11.
Because Bayesian inference often yields analytically intractable posterior distributions, computational methods have become indispensable. Markov Chain Monte Carlo (MCMC) methods are widely recognized as efficient simulation-based techniques for approximating posterior distributions and Bayesian estimators12,13,14. These methods have become fundamental computational tools for solving complex Bayesian problems for which closed-form solutions are unavailable. Recent developments have further strengthened the theoretical foundations of Bayesian predictive inference by providing coherent probabilistic prediction under uncertainty15,16,17,18. Prediction of future order statistics has likewise attracted considerable attention because of its direct applications in reliability engineering, life testing, maintenance scheduling, and risk assessment. Efficient prediction procedures for future order statistics, together with classical prediction methods for location-scale families, provide an important theoretical basis for predictive lifetime analysis and future failure prediction19,20.
Continuous advances in MCMC methodology have substantially improved Bayesian computation and predictive inference. Improved sampling strategies and computational algorithms have enhanced posterior approximation and model selection for increasingly complex statistical problems21,22,23,24. Bayesian predictive inference has also been extended to generalized order statistics, covariate-shift problems, and lifetime distributions25,26,27. Among simulation-based computational methods, the Metropolis–Hastings algorithm remains one of the most widely used MCMC techniques because of its flexibility and computational efficiency. Its theoretical foundations, computational properties, and practical implementations have been extensively documented28,29,30,31. These developments have established the Metropolis–Hastings algorithm as a consistent computational tool for Bayesian estimation and prediction.
Bayesian prediction has become an integral component of modern reliability analysis, in which uncertainty quantification is essential for evaluating system performance and supporting engineering decisions. Detailed treatments of reliability analysis, Bayesian estimation, lifetime data analysis, and stochastic lifetime regression models have further strengthened the methodological foundations of predictive inference32,33,34,35,36,37,38,39. Despite these advances in Lomax distributions, Bayesian predictive inference, MCMC methodology, and reliability analysis, relatively few studies have integrated these components into a unified framework for predicting future order statistics from the Lomax distribution under Type-II censoring.
Most existing studies have focused either on parameter estimation or on Bayesian prediction for alternative lifetime distributions, whereas detailed Bayesian prediction of future order statistics for the Lomax distribution remains limited. In addition, comparative investigations under different Bayesian loss functions remain relatively scarce. Motivated by these gaps, the present study develops Bayesian predictive procedures for future order statistics from the Lomax distribution under Type-II censoring. The proposed framework considers both predictive maximum likelihood and Bayesian prediction under the squared-error, LINEX, and general-entropy loss functions. Bayesian computation is performed using the Metropolis–Hastings algorithm to obtain posterior predictive estimates and predictive intervals. Extensive Monte Carlo simulations are conducted to evaluate predictive performance using multiple prediction accuracy measures. The resulting framework provides a detailed comparison of classical and Bayesian prediction methods for future order statistics in reliability and lifetime-data applications.
프로토콜
No human participants, animal experiments, clinical data, or biological specimens were involved in this study. Therefore, ethical approval and informed consent were not required. The research tools used in this protocol are listed in the Table of Materials.
1. Model description and preliminaries
This study developed a Bayesian framework for predicting future order statistics from Type-II censored samples assumed to follow the two-parameter Lomax distribution. The analytical workflow comprised derivation of the predictive likelihood, specification of Bayesian prior distributions, posterior inference using the Markov Chain Monte Carlo (MCMC) Metropolis–Hastings algorithm, and evaluation of predictive performance through Monte Carlo simulation. The overall analytical workflow is summarized in Figure 1.
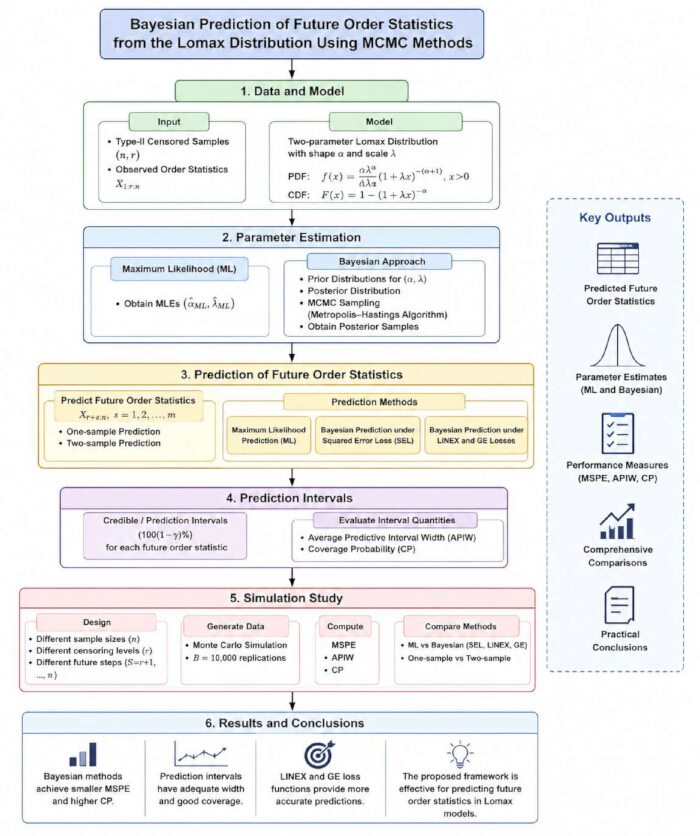
Figure 1: Analytical workflow for Bayesian prediction of future order statistics under Type-II censoring. Flowchart illustrating the analytical procedure used in this study. The workflow includes the generation of Type-II censored samples from the two-parameter Lomax distribution, construction of the predictive likelihood, parameter estimation using predictive maximum likelihood and Bayesian approaches, posterior sampling with the Metropolis–Hastings algorithm, the computation of Bayesian point predictors and predictive intervals under different loss functions, and the evaluation of predictive performance using Monte Carlo simulation. Please click here to view a larger version of this figure.
2. Lomax distribution
The two-parameter Lomax (Pareto Type II) distribution was used to model lifetime data because of its flexibility in representing heavy-tailed behavior. A random variable X was assumed to follow a Lomax distribution with a shape parameter ν > 0 and scale parameter β > 0, denoted by X ~ Lomax(ν, β), if its cumulative distribution function (CDF) is given1,7 :
 . (1)
The corresponding probability density function (PDF) was given by4˒6
 . (2)
Here, ν represented the shape parameter controlling the tail behavior of the distribution, whereas β represented the scale parameter.
3. Order statistics and censoring scheme
A random sample of size n was assumed to be drawn from the two-parameter Lomax distribution. The corresponding order statistics were denoted by19˒20:
 . (3)
Under the Type-II censoring scheme, only the first r ordered observations were assumed to be observed, where r < n. The observed sample was therefore expressed as26˒27
 . (4)
The remaining order statistics were treated as future observations to be predicted.19˒20
4. Prediction framework
Two prediction scenarios were considered19˒27.
5. One-sample prediction
The first r order statistics, x(1:n) < x(2:n) < ⋯ < x(r:n), were assumed to be observed, and the remaining future order statistics, x(r+1:n), x(r+2:n), …, x(n:n), were predicted from the same sample. This scenario is commonly encountered in Type-II censored life-testing experiments11.
6. Two-sample prediction
The second prediction scenario considered future order statistics from an independent sample drawn from the same Lomax distribution. Specifically, the objective was to predict the first m order statistics of the future sample using information from the observed Type-II censored sample10˒11˒19˒27.
7. Prediction intervals
A 100(1 − α)% prediction interval for a future random variable Y was defined as26˒36

where L(X) and U(X) denote the lower and upper prediction limits, respectively.
8. Maximum likelihood prediction for future order statistics
Predictive maximum likelihood estimation was used as the classical prediction method. Let X(1:n), X(2:n), …, X(r:n) denote the observed order statistics from a sample of size n, and let X(s:n), where r < s ≤ n, denote the future order statistic to be predicted. The predictive likelihood function was defined as19˒27
 (6)
where
 .
and x1 < x2 < ⋯ < xr < xs.
Substituting the Lomax probability density and cumulative distribution functions into Equation (6) yielded the predictive likelihood function1˒7
 . (8)
The corresponding log-predictive likelihood was then obtained as9˒19
 . (9)
The predictive maximum likelihood estimates of β, ν, and the future order statistic xs were obtained by solving
 . (10)
The expanded estimating equations are given in Equation (11).
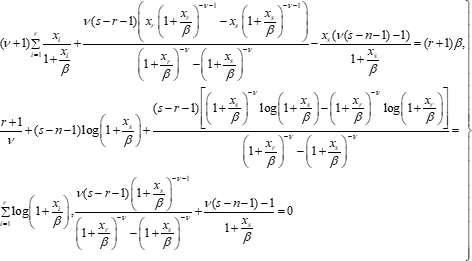 (11)
Because this system has no closed-form solution, the predictive maximum likelihood estimates  were obtained numerically.
9. Numerical implementation and algorithm
Because the nonlinear system in Equation (10) has no closed-form solution, the predictive maximum likelihood estimates (PMLEs) were obtained numerically12˒14. The system was solved using the FindRoot function with initial values β(0), ν(0), and xs(0). Iterations continued until the convergence criterion

was satisfied.
- Asymptotic inference
The asymptotic variance–covariance matrix of the PMLEs was obtained from the observed information matrix32˒38
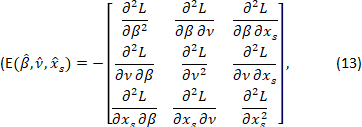
evaluated at the PMLEs. The variance–covariance matrix was then computed as

- Asymptotic predictive confidence intervals
Under standard regularity conditions, the PMLEs were assumed to follow an asymptotic multivariate normal distribution.36˒38 Approximate predictive confidence intervals were therefore computed as

where zα/2 denotes the upper α/2 quantile of the standard normal distribution.
10. Bayesian prediction for future order statistics
A Bayesian framework was developed to predict the future order statistic X(s:n) based on the observed sample x = (x(1:n), …, x(r:n)). Independent Gamma prior distributions were assigned to the positive parameters β and ν.10˒27
 . (16)
 . (17)
Weakly informative hyperparameters were specified as ζ1 = ω1 = 0.35 and ζ2 = ω2 = 0.45, allowing the observed data to dominate the posterior inference while preserving parameter positivity. The resulting joint prior distribution was
 . (18)
The future order statistic xs was treated as a future random variable rather than an unknown model parameter; therefore, no prior distribution was assigned to xs. Combining the joint prior with the predictive likelihood yielded the posterior distribution15˒18.
 . (19)
Substituting the explicit forms, the normalized posterior density becomes
 . (20)
Where
 . (21)
The Bayesian predictive density of the future order statistic was then obtained by integrating over the posterior distribution26˒16
 . (22)
11. Bayesian point prediction
The Bayesian point predictor of X(s:n) was obtained by minimizing the posterior expected loss under the posterior predictive distribution. Because the predictive density involved intractable integrals, posterior expectations were approximated using Markov Chain Monte Carlo (MCMC) samples generated after discarding the burn-in period14˒28.
Let Xs(j), j = 1, …, M, denote the retained MCMC samples.
12. Squared error loss (SEL)
Under the squared error loss (SEL) function, the Bayesian point predictor was given by the posterior mean10˒36.
 . (23)
13. LINEX Loss
Under the LINEX loss function, the Bayesian point predictor was computed as10
 . (24)
14. General entropy loss
Under the general entropy (GE) loss function, the Bayesian point predictor was computed as11˒27
 . (25)
15. Bayesian predictive intervals
A 100(1 − γ)% Bayesian predictive interval was obtained from the posterior predictive distribution.26˒16 The interval limits satisfied
 . (26)
The lower and upper prediction limits were estimated from the corresponding posterior predictive quantiles of the retained MCMC samples.
16. Comparison criteria
Predictive performance was evaluated using three criteria: mean squared prediction error (MSPE), average predictive interval width (APIW), and coverage probability (CP)32˒33˒38.
- Mean Squared Prediction Error (MSPE)
The MSPE was calculated as
 . (27)
- Average Predictive Interval Width (APIW)
The APIW was calculated as32˒38
 .(28)
17. Coverage probability (CP)
Coverage probability was calculated as33˒38
 . (29)
where I(·) denotes the indicator function.
18. Simulation algorithm and numerical procedures
A Monte Carlo simulation study was conducted to compare the Bayesian and predictive maximum likelihood methods under different sample sizes and Type-II censoring schemes. Random samples were generated from the two-parameter Lomax distribution using the inverse transformation method, and Type-II censoring was applied to obtain the observed order statistics. Future order statistics were then predicted using the predictive maximum likelihood method and the Bayesian approaches under the squared error (SEL), LINEX, and general entropy (GE) loss functions14˒24.
Predictive maximum likelihood estimates were obtained by numerically solving the nonlinear equations described in Section 6. Bayesian inference was performed using the Metropolis–Hastings MCMC algorithm14˒28. The Markov chain was initialized with β(0) = 1.0 and ν(0) = 1.5, using independent normal random-walk proposal distributions, β* ~ N(β(k), σβ2), ν* ~ N(ν(k), σν2),
with proposal standard deviations σβ = 0.25 and σν = 0.30.29
For each simulation scenario, M = 11,000 MCMC iterations were generated, with the first M0 = 1,000 discarded as burn-in. Convergence was assessed using a tolerance of 10−6 together with visual inspection of trace plots. Acceptance rates ranged from 27% to 34%, indicating satisfactory mixing of the Markov chains. Posterior samples obtained after burn-in were used to compute Bayesian point predictors and predictive intervals.
Each simulation scenario was replicated 10,000 times. Predictive performance was evaluated using the MSPE, APIW, and CP criteria33˒38. The numerical results are presented in Tables 1–4.
| Method | Eβ | Eν | Predicted Future Values (xs) | MSPE | APIW | CP | |||||
| S=15 | S=16 | S=17 | S=18 | S=19 | S=20 | ||||||
| ML | 2.1245 | 1.621 | 2.4102 | 2.5321 | 2.6841 | 2.851 | 3.0542 | 3.312 | 0.1542 | 2.4512 | 0.938 |
| Bay-SEL | 2.0582 | 1.5642 | 2.3851 | 2.5184 | 2.6512 | 2.8105 | 2.9981 | 3.2541 | 0.1251 | 2.2154 | 0.951 |
| Bay-LINEX | 2.0315 | 1.5381 | 2.371 | 2.5052 | 2.6391 | 2.7984 | 2.9812 | 3.2215 | 0.1182 | 2.1985 | 0.952 |
| Bay-GE | 2.0422 | 1.5495 | 2.3792 | 2.511 | 2.645 | 2.8012 | 2.9895 | 3.2381 | 0.1204 | 2.201 | 0.953 |
Table 1: Predictive performance of maximum likelihood and Bayesian methods for future order statistics under the Type-II censoring scheme (n = 20, r = 14). Parameter estimates, predicted future order statistics, mean squared prediction error (MSPE), average predictive interval width (APIW), and coverage probability (CP) obtained using predictive maximum likelihood (ML) and Bayesian methods under squared error loss (SEL), LINEX loss, and general entropy (GE) loss.Abbreviations: ML, predictive maximum likelihood; SEL, squared error loss; LINEX, linear exponential loss; GE, general entropy loss; MSPE, mean squared prediction error; APIW, average predictive interval width; CP, coverage probability.
| Method | Eβ | Eν | Predicted Future Values (xs) | MSPE | APIW | CP | ||||
| S=46 | S=47 | S=48 | S=49 | S=50 | ||||||
| ML | 2.0412 | 1.5482 | 3.4215 | 3.551 | 3.7124 | 3.9215 | 4.215 | 0.0498 | 1.8214 | 0.949 |
| Bay-SEL | 2.0185 | 1.5212 | 3.4152 | 3.5381 | 3.6952 | 3.8991 | 4.1952 | 0.0382 | 1.7102 | 0.958 |
| Bay-LINEX | 2.0092 | 1.5085 | 3.4091 | 3.5302 | 3.6881 | 3.8812 | 4.1881 | 0.0351 | 1.6952 | 0.959 |
| Bay-GE | 2.0134 | 1.5142 | 3.4123 | 3.5345 | 3.691 | 3.8904 | 4.191 | 0.0368 | 1.7015 | 0.96 |
Table 2: Predictive performance of maximum likelihood and Bayesian methods for future order statistics under the Type-II censoring scheme (n = 50,r = 45). Comparison of parameter estimates, predicted future order statistics, MSPE, APIW, and CP for predictive maximum likelihood and Bayesian prediction methods under the moderate-sample simulation scenario.
| Method | Eβ | Eν | Predicted Future Values (xs) | MSPE | APIW | CP | ||||
| S=96 | S=97 | S=98 | S=99 | S=100 | ||||||
| ML | 2.0214 | 1.5225 | 4.2581 | 4.3812 | 4.5912 | 4.881 | 5.4215 | 0.0285 | 1.5214 | 0.952 |
| Bay-SEL | 2.0091 | 1.5112 | 4.2514 | 4.3705 | 4.5801 | 4.8652 | 5.4012 | 0.0215 | 1.4521 | 0.96 |
| Bay-LINEX | 2.0042 | 1.5052 | 4.2482 | 4.3651 | 4.5752 | 4.8581 | 5.3952 | 0.0198 | 1.4402 | 0.962 |
| Bay-GE | 2.0061 | 1.5085 | 4.2505 | 4.3682 | 4.5781 | 4.861 | 5.3985 | 0.0205 | 1.4485 | 0.961 |
Table 3: Predictive performance of maximum likelihood and Bayesian methods for future order statistics under the Type-II censoring scheme (n = 100, r = 95). Comparison of parameter estimates, predicted future order statistics, MSPE, APIW, and CP for predictive maximum likelihood and Bayesian prediction methods under the large-sample simulation scenario.
| Estimation Method | Estimates | Order (s) | Actual (xs) | Pred. xs | 95% Pred. Interval | Width (W) | Error (ER) | CP (%) | ||
| β | ν | Lower | Upper | |||||||
| ML Estimation | 1.245 | 0.8921 | s = 16 | 4.5 | 4.5125 | 3.211 | 5.814 | 2.603 | 0.0125 | 0.941 |
| s = 17 | 4.7 | 4.7215 | 3.421 | 6.022 | 2.601 | 0.0215 | 0.942 | |||
| s = 18 | 5 | 5.0488 | 3.5852 | 6.3172 | 2.732 | 0.0488 | 0.944 | |||
| s = 19 | 5.2 | 5.2159 | 3.7501 | 6.6181 | 2.868 | 0.0159 | 0.941 | |||
| s = 20 | 5.5 | 5.6712 | 4.1205 | 7.2219 | 3.1014 | 0.1712 | 0.935 | |||
| Bayesian (SEL) | 1.3102 | 0.9155 | s = 16 | 4.5 | 4.5824 | 3.3215 | 5.8433 | 2.5218 | 0.0824 | 0.951 |
| s = 17 | 4.7 | 4.8104 | 3.5512 | 6.0696 | 2.5184 | 0.1104 | 0.952 | |||
| s = 18 | 5 | 5.0612 | 3.7251 | 6.3973 | 2.6722 | 0.0612 | 0.954 | |||
| s = 19 | 5.2 | 5.3125 | 3.911 | 6.714 | 2.803 | 0.1125 | 0.955 | |||
| s = 20 | 5.5 | 5.8124 | 4.3501 | 7.4105 | 3.0604 | 0.3124 | 0.948 | |||
| Bayesian (LINEX) | 1.308 | 0.9132 | s = 16 | 4.5 | 4.571 | 3.3104 | 5.8318 | 2.5214 | 0.071 | 0.954 |
| s = 17 | 4.7 | 4.7952 | 3.541 | 6.0494 | 2.5084 | 0.0952 | 0.955 | |||
| s = 18 | 5 | 5.041 | 3.7142 | 6.3678 | 2.6536 | 0.041 | 0.958 | |||
| s = 19 | 5.2 | 5.2912 | 3.9002 | 6.6822 | 2.782 | 0.0912 | 0.959 | |||
| s = 20 | 5.5 | 5.7412 | 4.3412 | 7.3982 | 3.057 | 0.2412 | 0.952 | |||
| Bayesian (GE) | 1.3115 | 0.9168 | s = 16 | 4.5 | 4.5912 | 3.3284 | 5.854 | 2.5256 | 0.0912 | 0.952 |
| s = 17 | 4.7 | 4.8051 | 3.5482 | 6.062 | 2.5138 | 0.1051 | 0.953 | |||
| s = 18 | 5 | 5.0552 | 3.7201 | 6.3903 | 2.6702 | 0.0552 | 0.956 | |||
| s = 19 | 5.2 | 5.3051 | 3.9054 | 6.7048 | 2.7994 | 0.1051 | 0.957 | |||
| s = 20 | 5.5 | 5.7985 | 4.345 | 7.401 | 3.056 | 0.2985 | 0.951 | |||
Table 4: Comparison of predictive estimates and 95% prediction intervals for future order statistics under the Type-II censoring scheme (n = 20,r = 15). Comparison of predictive maximum likelihood and Bayesian methods based on parameter estimates, predicted future order statistics, 95% prediction intervals, interval widths, prediction errors, and coverage probabilities for an additional Type-II censoring scenario.
19. Data generation
Random samples were generated from the two-parameter Lomax distribution using the inverse transformation method.1˒7˒38˒39 Uniform random variables U1, U2, …, Un ~ U(0,1) were transformed according to Xi = β[(1 − Ui)−1/ν − 1], i = 1, 2, …, n,
where ν and β denote the shape and scale parameters, respectively. The generated observations were sorted to obtain the order statistics X(1:n) < X(2:n) < ⋯ < X(n:n).
The first r order statistics were retained as the observed Type-II censored sample, and the s-the order statistic (r < s ≤ n) was treated as the future observation to be predicted.
20. Evaluation metrics
For each simulation replication, Bayesian and predictive maximum likelihood predictors, together with their prediction intervals, were computed. Predictive performance was evaluated using the mean squared prediction error (MSPE), average predictive interval width (APIW), and coverage probability (CP), as defined in Equations (27)–(29).
21. Computational implementation
All numerical computations and simulation procedures were performed using Wolfram Mathematica.
결과
A Monte Carlo simulation study was conducted to compare the predictive performance of the Bayesian and predictive maximum likelihood (PML) methods for future order statistics from the two-parameter Lomax distribution under different sample sizes and Type-II censoring schemes. Predictive performance was evaluated using the mean squared prediction error (MSPE), average predictive interval width (APIW), and coverage probability (CP). Tables 1–4 summarize the parameter estimates, predicted future order statistics, and corresponding predictive performance measures.
Figure 2 presents representative trace plots of the Metropolis–Hastings Markov chains for the shape parameter α (panel A) and the scale parameter β (panel B), respectively. In both panels, the vertical dashed line indicates the burn-in period, and the horizontal dashed line denotes the true parameter value. After burn-in, the chains fluctuated around the true parameter values without apparent trends, indicating stable mixing and satisfactory convergence. Acceptance rates ranging from 27% to 34% further supported the efficiency of the sampling algorithm.
For the small-sample scenario (n = 20, r = 14), Table 1 shows that the Bayesian-LINEX predictor achieved the lowest MSPE (0.1182), representing an improvement of approximately 23.3% over the PML method (0.1542). The Bayesian methods also produced narrower predictive intervals and slightly higher coverage probabilities than the PML approach.
For the moderate sample size (n = 50, r = 45), Table 2 showed a similar pattern. The Bayesian-LINEX predictor yielded the lowest MSPE (0.0351), corresponding to an improvement of approximately 29.5% over the PML method, while maintaining narrower predictive intervals and higher coverage probabilities. The Bayesian-GE method also demonstrated competitive predictive performance.
For the large-sample scenario (n = 100, r = 95), Table 3 demonstrated improved predictive accuracy for all methods. The Bayesian-LINEX predictor again achieved the lowest MSPE (0.0198), representing an improvement of approximately 30.5% over the PML method. Bayesian predictors also produced narrower predictive intervals with slightly higher coverage probabilities.
Table 4 presents an additional simulation scenario (n = 20, r = 15). The Bayesian prediction methods consistently produced lower prediction errors, narrower predictive intervals, and higher coverage probabilities than the predictive maximum likelihood approach under this censoring configuration.
Overall, the simulation results demonstrated that the Bayesian prediction methods consistently outperformed the predictive maximum likelihood approach across all investigated scenarios. Among the Bayesian methods, the LINEX loss function generally achieved the lowest MSPE, whereas the Bayesian predictors as a whole provided narrower predictive intervals while maintaining satisfactory coverage probabilities.
Data availability:
The raw Monte Carlo simulation data underlying the results reported in Tables 1–4 are provided as Supplementary File 1 (ZIP archive), which contains the Microsoft Excel (.xlsx) source data files for each simulation scenario.
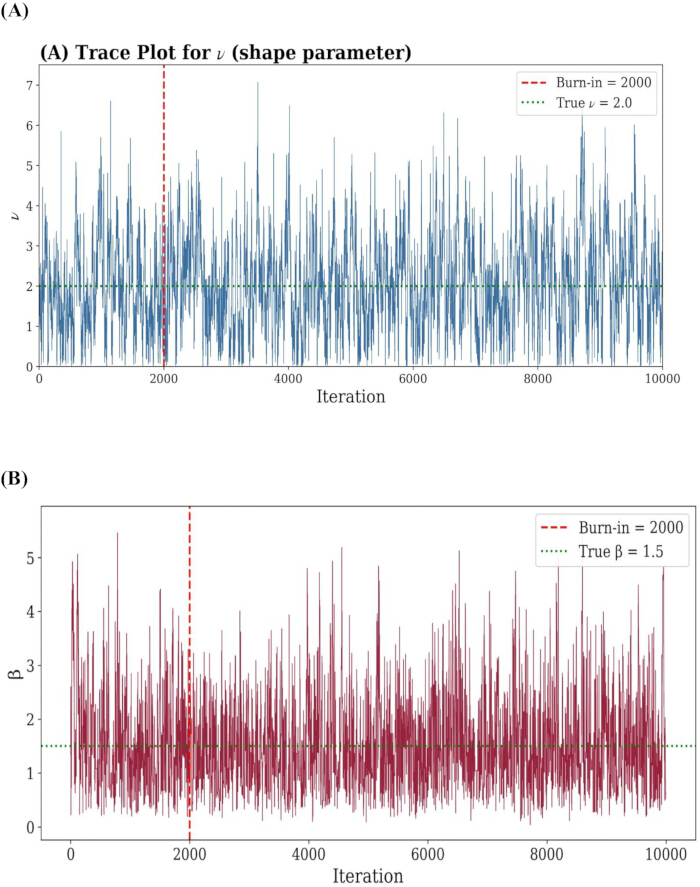
Figure 2: Representative Metropolis–Hastings trace plots for Bayesian estimation of the Lomax distribution parameters. (A) Trace plot for the shape parameter α. (B) Trace plot for the scale parameter β. The vertical dashed line indicates the burn-in period, and the horizontal dashed line denotes the true parameter value used in the simulation. The post-burn-in samples fluctuate around the true parameter values without noticeable trends, indicating satisfactory mixing and convergence of the Markov chains. Please click here to view a larger version of this figure.
Supplementary File 1: Raw Monte Carlo simulation data supporting Tables 1–4.Please click here to download this file.
토론
In conclusion, this study developed a Bayesian predictive framework for future order statistics from the two-parameter Lomax distribution under Type-II censoring by integrating Bayesian predictive inference with the Metropolis–Hastings Markov Chain Monte Carlo (MCMC) algorithm. The proposed methodology was investigated under the squared error (SEL), LINEX, and general entropy (GE) loss functions and compared with the predictive maximum likelihood approach. The simulation study demonstrated that the Bayesian predictive procedures provided competitive predictive performance across different sample sizes and censoring configurations, while the LINEX and general entropy loss functions frequently yielded lower prediction errors together with satisfactory predictive interval characteristics. The findings highlight the practical importance of incorporating parameter uncertainty into predictive inference for censored lifetime data. Unlike classical predictive maximum likelihood methods, the Bayesian framework provides complete posterior predictive distributions, allowing both point prediction and uncertainty quantification within a unified probabilistic framework. The observed improvements in prediction accuracy, interval width, and coverage probability across all investigated scenarios indicate that the proposed approach offers a reliable alternative for predicting future order statistics, particularly in situations where censored observations and relatively small sample sizes are encountered. From an application perspective, the proposed methodology has potential relevance in reliability engineering, life-testing experiments, maintenance planning, survival analysis, actuarial science, and risk assessment, where accurate prediction of future failure times is essential for decision-making. The flexibility of the Bayesian framework also allows prior information to be incorporated whenever such information is available, making the approach suitable for practical reliability studies in which historical knowledge or expert opinion may complement observed data. By explicitly accounting for parameter uncertainty, the proposed framework provides a unified approach for Bayesian prediction of future order statistics and extends the existing literature on predictive inference for censored lifetime data. The proposed methodology may serve as a useful framework for reliability and lifetime data analysis in applications where uncertainty quantification is of practical importance. Although the Metropolis–Hastings algorithm provided satisfactory convergence and stable predictive performance, alternative Bayesian computational strategies, including Gibbs sampling, Hamiltonian Monte Carlo, Sequential Monte Carlo methods, or variational Bayesian approaches, may provide computational advantages for more complex predictive models or higher-dimensional parameter spaces. Comparative investigations of these approaches would further clarify their relative efficiency and predictive performance. Although the present study is limited to the two-parameter Lomax distribution under Type-II censoring and simulation-based evaluation, it provides a solid foundation for further methodological developments. Future research will focus on extending the proposed framework to more general lifetime distributions, alternative censoring schemes, real-world datasets, different prior specifications, and more advanced Bayesian computational techniques, as well as conducting broader comparative studies with alternative Bayesian computational approaches.
공개 사항
The authors declare that they have no competing interests.
감사의 글
The authors extend their appreciation to the Deanship of Research and Graduate Studies at King Khalid University for funding this work through Large Research Groups Program under grant number RGP2/329/47.
재료
| 이름 | 회사 | 카탈로그 번호 | 댓글 |
|---|---|---|---|
| Computational software (Bayesian estimation and MCMC simulations) | Wolfram Research, Inc. | Mathematica Version 12.0 | Used for parameter estimation, MCMC implementation, posterior sampling, and numerical computations. |
| Computational software (symbolic derivations) | Wolfram Research, Inc. | Mathematica Version 12.0 | Used for symbolic manipulations and derivation of predictive formulas. |
| Equation editor | Microsoft Corporation | Microsoft Word Equation Editor | Used for preparation and formatting of mathematical expressions and equations. |
| Personal computer/workstation | HP Inc. | N/A | Used to perform numerical calculations and Monte Carlo simulation experiments. |
| Simulated Type-II censored datasets | Generated in this study | N/A | Artificial datasets generated according to the two-parameter Lomax distribution for simulation experiments. |
참고문헌
- Lemonte AJ, Cordeiro GM. An extended Lomax distribution. Statistics. 2013;47(4):800–16. doi:10.1080/02331888.2011.568119.
- Kilany NM. Weighted Lomax distribution. SpringerPlus. 2016;5:1862. doi:10.1186/s40064-016-3489-2.
- Oguntunde PE, et al. A new generalization of the Lomax distribution with increasing, decreasing, and constant failure rate. Model Simul Eng. 2017;2017:6043169. doi:10.1155/2017/6043169.
- Hassan AS, Abd-Allah M. On the inverse power Lomax distribution. Ann Data Sci. 2019;6(2):259–78. doi:10.1007/s40745-018-0183-y.
- Shi X, Shi Y. Inference for inverse power Lomax distribution with progressive first-failure censoring. Entropy. 2021;23(9):1099. doi:10.3390/e23091099.
- Nagarjuna VBV, Vardhan RV, Chesneau C. Nadarajah-Haghighi Lomax distribution and its applications. Math Comput Appl. 2022;27(2):30. doi:10.3390/mca27020030.
- Ghitany ME, Al-Awadhi FA, Alkhalfan LA. Marshall-Olkin extended Lomax distribution and its application to censored data. Commun Stat Theory Methods. 2007;36(10):1855–66. doi:10.1080/03610920601126571.
- Maiti K, Kayal S. Estimation, prediction and life testing plan for the exponentiated Gumbel Type-II progressive censored data. REVSTAT Stat J. 2023;21(4):509–33. doi:10.57805/revstat.v21i4.440.
- Dutta S, Kayal S. Estimation and prediction for Burr type III distribution based on unified progressive hybrid censoring scheme. J Appl Stat. 2024;51(1):1–33. doi:10.1080/02664763.2022.2113865.
- Singh S, Mani Tripathi Y, Wu SJ. Bayesian estimation and prediction based on lognormal record values. J Appl Stat. 2017;44(5):916–40. doi:10.1080/02664763.2016.1189520.
- Dey S, Singh S, Tripathi YM, Asgharzadeh A. Estimation and prediction for a progressively censored generalized inverted exponential distribution. Stat Methodol. 2016;32:185–202. doi:10.1016/j.stamet.2016.05.007.
- Karandikar RE. On the Markov Chain Monte Carlo method. Sadhana. 2006;31(2):81–104. doi:10.1007/BF02719775.
- Zobitz JM, Desai AR, Moore DJP, Chadwick MA. A primer for data assimilation with ecological models using Markov Chain Monte Carlo. Oecologia. 2011;167(3):599–611. doi:10.1007/s00442-011-2107-9.
- Brooks SP. Markov Chain Monte Carlo method and its application. J R Stat Soc D. 1998;47(1):69–100. doi:10.1111/1467-9884.00117.
- Berti P, Dreassi E, Pratelli L, Rigo P. A class of models for Bayesian predictive inference. Bernoulli. 2021;27(1):702–26. doi:10.3150/20-BEJ1255.
- Berti P, et al. Bayesian predictive inference without a prior. Stat Sin. 2023;33(4):2405–29. doi:10.5705/ss.202021.0238.
- Coolen FPA. Low structure imprecise predictive inference for Bayes’ problem. Stat Probab Lett. 1998;36(4):349–57. doi:10.1016/S0167-7152(97)00081-3.
- Chen MH, Ibrahim JG. Bayesian predictive inference for time series count data. Biometrics. 2000;56(3):678–85. doi:10.1111/j.0006-341X.2000.00678.x.
- Barakat HM, Khaled OM, Ghonem HA. New method for prediction of future order statistics. Qual Technol Quant Manag. 2021;18(1):101–16. doi:10.1080/16843703.2020.1782087.
- Kaminsky KS, Nelson PI. Best linear unbiased prediction of order statistics in location and scale families. J Am Stat Assoc. 1975;70(349):145–50. doi:10.1080/01621459.1975.10480275.
- Gallagher K, et al. Markov Chain Monte Carlo sampling methods to determine optimal models, model resolution and model choice for Earth science problems. Mar Pet Geol. 2009;26(4):525–35. doi:10.1016/j.marpetgeo.2009.01.003.
- Neal RM. Probabilistic inference using Markov Chain Monte Carlo methods. Technical Report CRG-TR-93-1. Department of Computer Science, University of Toronto; Toronto, Canada; 1993. Available from: https://www.cs.utoronto.ca/pub/radford/review.pdf.
- Walsh B, Visscher PM, Lynch M. Markov Chain Monte Carlo and Gibbs sampling. In: Genetics and Analysis of Quantitative Traits. Oxford University Press; Oxford; 2025. p. 937–56. doi:10.1093/oso/9780192898180.005.0008.
- Hamra G, MacLehose R, Richardson D. Markov Chain Monte Carlo: an introduction for epidemiologists. Int J Epidemiol. 2013;42(2):627–34. doi:10.1093/ije/dyt043.
- Shimodaira H. Improving predictive inference under covariate shift by weighting the log-likelihood function. J Stat Plan Inference. 2000;90(2):227–44. doi:10.1016/S0378-3758(00)00115-4.
- Al-Hussaini EK, Ahmad AEBA. On Bayesian predictive distributions of generalized order statistics. Metrika. 2003;57(2):165–76. doi:10.1007/s001840200207.
- Kundu D, Raqab MZ. Bayesian inference and prediction of order statistics for a Type-II censored Weibull distribution. J Stat Plan Inference. 2012;142(1):41–7. doi:10.1016/j.jspi.2011.06.019.
- Chib S, Greenberg E. Understanding the Metropolis-Hastings algorithm. Am Stat. 1995;49(4):327–35. doi:10.1080/00031305.1995.10476177.
- Hitchcock DB. A history of the Metropolis-Hastings algorithm. Am Stat. 2003;57(4):254–7. doi:10.1198/0003130032413.
- Ramachandran KM, Tsokos CP. Stochastic Differential Games: Theory and Applications. Atlantis Press; Paris; 2012. Available from: https://link.springer.com/book/10.2991/978-94-91216-89-3.
- Robert CP, Casella G. Metropolis-Hastings algorithms. In: Introducing Monte Carlo Methods with R. Springer; New York; 2010. p. 167–97. doi:10.1007/978-1-4419-1576-4_6.
- George D, Mallery P. Reliability analysis. In: IBM SPSS Statistics 25 Step by Step. Routledge; New York; 2020. p. 249–60. doi:10.4324/9781351033909-25.
- Rigdon SE, Zacks S. Introduction to Reliability Analysis: Probability Models and Statistical Methods. Springer; New York; 1991. doi:10.1007/978-1-4612-1312-8.
- Rackwitz R. Reliability analysis: a review and some perspectives. Struct Saf. 2001;23(4):365–95. doi:10.1016/S0167-4730(02)00009-7.
- Haug AJ. A tutorial on Bayesian estimation and tracking techniques applicable to nonlinear and non-Gaussian processes. MITRE Technical Report MTR 05W0000004. The MITRE Corporation; McLean, VA; 2005. Available from: https://www.mitre.org/sites/default/files/pdf/05_0211.pdf.
- Geisser S. Bayesian estimation in multivariate analysis. Ann Math Stat. 1965;36(1):150-9. doi:10.1214/aoms/1177700279.
- Sorenson HW, Alspach DL. Recursive Bayesian estimation using Gaussian sums. Automatica. 1971;7(4):465–79. doi:10.1016/0005-1098(71)90097-5.
- Lawless JF. Statistical Models and Methods for Lifetime Data. 2nd ed. Wiley; Hoboken, NJ; 2003. doi:10.1002/9781118033005.
- Caroni C. First Hitting Time Regression Models: Lifetime Data Analysis Based on Underlying Stochastic Processes. Vol. 4. ISTE; London; Wiley; Hoboken, NJ; 2017. doi:10.1002/9781119437260