본 연구는 Qiming Granule(QMG)이 장-망막 축을 조절함으로써 당뇨병성 망막병증(DR)을 개선한다는 것을 입증합니다. QMG는 장내 미생물 군집을 재구성하고 전신 염증을 억제하며, CMKLR1 중심의 조절 네트워크를 복원함으로써 망막의 조직병리학적 손상을 되돌렸습니다. 이러한 결과는 QMG가 DR을 위한 유망한 장-망막 치료 전략이 될 수 있음을 보여줍니다.
연구 논문
당뇨망막병증에서 장-망막 축을 통한 Qiming Granule과 CMKLR1 중심 네트워크 및 전신 염증의 상관관계 분석
이 논문에서
요약
초록
당뇨망막병증(DR)은 만성 고혈당과 전신 염증으로 인해 발생하는 신경혈관 합병증이며, 최근 장-망막 축(gut-retina axis)이 중요하지만 충분히 활용되지 않은 치료 표적으로 주목받고 있습니다. 본 연구는 Qiming Granule(QMG)이 장-망막 축을 조절함으로써 DR에 대해 보호 효능을 발휘하는지 조사하였습니다. C57BL/6 마우스를 실험군으로 무작위 배정하고 서로 다른 중재법을 적용하였습니다. 망막의 조직병리학적 변화는 Hematoxylin-Eosin(HE) 염색으로 평가하였습니다. 혈청 내 염증성 사이토카인(IL-1β, IL-6, TNF-α) 수치는 효소결합면역흡착측정법(ELISA)으로 측정하였습니다. 망막 및 결장 조직 내 주요 조절 단백질(CMKLR1, Wnt5a, PPAR-γ, AP-1, TP53)의 발현은 Western blot(WB)으로 검출하였습니다. 장내 미생물 군집의 구성과 다양성은 전체 길이 16S rDNA 시퀀싱을 통해 분석하였습니다. 장내 미생물과 염증 인자 또는 주요 단백질 간의 관계를 평가하기 위해 상관 분석을 수행하였습니다. QMG 처리는 망막 층 구조의 회복, 망막 신경절 세포 수의 부분적 회복(P < 0.001), 그리고 망막 박층화의 역전(P < 0.01)을 통해 망막의 조직병리학적 이상을 개선하였습니다. 또한, QMG는 혈청 IL-1β, IL-6 및 TNF-α 수치를 현저히 감소시켰습니다(P < 0.0001). 장-망막 축을 따라, QMG는 주요 조절 단백질, 특히 CMKLR1 중심 네트워크(Wnt5a, PPAR-γ, AP-1, TP53)의 비정상적인 발현을 역전시켰습니다. 나아가, QMG는 장내 미생물 군집의 구성, 다양성 및 기능을 회복시켰으며, 상관 분석 결과 QMG가 전신 염증을 이러한 조절 단백질과 결합하여 장-망막 축을 조절한다는 것이 밝혀졌습니다. 본 연구는 QMG가 장-망막 축을 통해 CMKLR1 중심 조절 네트워크(Wnt5a, PPAR-γ, AP-1, TP53 포함)와 전신 염증을 결합함으로써 DR을 개선한다는 예비 약리학적 근거를 제공하며, QMG가 DR을 위한 유망한 장-망막 치료 전략이 될 수 있음을 시사합니다.
서론
당뇨병성 망막병증(DR)은 당뇨병(DM)의 가장 흔한 미세혈관 합병증 중 하나로, 전 세계 경제활동 연령대 성인들의 주요 실명 원인이 됩니다1. 전 세계적으로 DR은 당뇨병 환자 인구의 약 20~30%에 영향을 미칩니다2. 만성 고혈당은 신경혈관 결합 장애, 염증 반응 강화 및 산화 스트레스를 포함한 일련의 병리적 사건을 유발함으로써 DR의 병인 형성을 촉진합니다3. 최근 망막병증을 동반한 당뇨병 환자에서 그렇지 않은 환자에 비해 장내 미생물 군집의 다양성과 구성에 변화가 있음이 관찰되었습니다4,5. 이에 따라 장내 항상성과 망막 건강을 연결하는 양방향 통신 네트워크인 장-망막 축(gut-retina axis)이 DR 진행의 새로운 요인으로 부상했습니다. 그러나 장-망막 신호를 망막 병증으로 전환하는 구체적인 분자 매개체는 여전히 상당 부분 규명되지 않은 상태이며, 이는 신뢰할 수 있는 바이오마커 및 치료 표적의 발굴을 제한하고 있습니다.
장-망막 축은 장내 미생물군 및 그 대사물질과 망막 조직 사이의 면역학적, 대사적, 신경내분비적 및 혈관 경로를 통한 복잡한 양방향 통신 네트워크를 정의하며, 이를 통해 이들의 항상성 균형을 조절합니다6. 분자 수준에서 장-망막 축은 주요 스트레스 반응 및 세포 운명 결정 단백질, 특히 AP-1 및 TP53의 조절 장애로 특징지어집니다7,8,9. 또한, 주요 케모카인 수용체인 CMKLR1은 혈관 내피 기능 장애와 대사 조절 장애의 핵심 매개체로 나타나며, 장내 미생물군의 변화와 당뇨망막병증의 발병 기전 사이의 중요한 연결 고리를 형성합니다10. 중요한 점은, Wnt 신호 전달이 망막 혈관 항상성과 장 상피 장벽 기능을 유지하는 데 이중적인 조절 역할을 수행하며11, PPAR 신호 전달은 안구 및 장 조직 모두에서 염증 반응과 대사 과정의 마스터 조절기로 작용한다는 것입니다12,13. 이러한 분자적 요소들은 집합적으로 장-망막 축 내의 상호 연결된 신호 네트워크를 구성하며, 당뇨병 관련 합병증에 대한 새로운 기전적 통찰과 치료 기회를 제시합니다. 따라서 이 축을 따라 발생하는 구조적 및 기능적 변화를 표적으로 하는 것은 DR을 관리하는 유망한 전략이 됩니다.
중국의 전통 의학(TCM)은 역사적으로 증후 분별(syndrome differentiation)에 기반한 치료 결정을 통해 당뇨병 및 관련 망막병증 치료에 중요한 역할을 해왔습니다14. Astragalus membranaceus, Pueraria lobata, Rehmannia glutinosa, Lycium barbarum, Senna obtusifolia, Leonurus japonicus, Typha angustifolia, 및 Whitmania pigra로 구성된 Qiming Granule(QMG)은 당뇨망막병증(DR) 치료에 널리 적용됩니다. 중국 국가약품감독관리국(승인 번호 Z20090036)의 승인을 받은 QMG는 임상 시험을 성공적으로 마치고 시판 허가를 받았습니다. QMG는 망막 모세혈관의 기저막 증식을 방지하고, 주세포(pericyte)와 망막 미세혈관의 손상을 줄이며, 눈의 국소 병리적 형태를 유지함으로써15 보호 효과를 나타내며, 이는 DR을 해결하기 위한 유망한 치료법이 됩니다. QMG의 활성 성분은 주요 단백질과 염증 인자를 표적으로 하여 항염증, 항산화 및 항세포사멸 효과를 발휘하며, 이는 장-망막 축(gut-retina axis) 조절의 기전적 근거를 제공합니다 16. 이러한 특성들은 QMG가 장-망막 축을 조절할 가능성에 대한 기전적 근거가 되지만, 이 연결 고리를 탐구한 연구는 거의 없습니다. 따라서 본 연구는 QMG가 장-망막 축을 조절하는 효능을 검증하여, DR에 대한 치료 잠재력의 실험적 증거를 제공하는 것을 목표로 합니다.
본 연구는 이론적 예측과 in vivo 실험 데이터를 연결하여 장-망막 축(gut–retina axis)을 조절하는 QMG의 효능을 검증하였습니다. 이러한 결과는 QMG가 장-망막 축을 통해 전신 염증과 CMKLR1 중심의 조절 네트워크(Wnt5a, PPAR-γ, AP-1 및 TP53 포함)를 결합함으로써 당뇨망막병증(DR)을 개선한다는 것을 입증하며, QMG를 DR을 위한 유망한 장-망막 표적 치료 전략으로 제시합니다. 그래픽 초록은 그림 1에 제시되어 있습니다.
프로토콜
모든 동물 실험은 ARRIVE 가이드라인을 준수하여 수행되었습니다. 본 연구는 Sichuan Scientist Biotechnology Co., Ltd.의 윤리심의위원회(IACUC ISSUE SYST-2024-011)로부터 승인을 받았습니다. 연구 설계를 요약한 상세한 실험 일정표가 다음에서 제공됩니다. 보충 그림 1.
동물 준비 및 처리
마우스는 2% isoflurane 흡입 마취로 깊게 마취되었습니다. 깊은 마취 상태에서 안와하 정맥 채혈을 통해 혈액을 수집하였습니다. 채혈 직후, 망막 조직을 채취하기 위해 안구를 적출하였습니다. 이어서, 안락사를 확실히 하기 위해 깊은 마취 하에 경추 탈구를 시행하였습니다. 그 후 즉시 결장 조직을 적출하였습니다. 부작용을 보이는 동물은 즉시 연구에서 제외하고 적절한 수의학적 처치를 제공하였습니다.
무작위 배정과 눈가림
체중 20~30g, 5주령의 수컷 C57BL/6 마우스를 온도와 습도가 엄격히 조절된 환경에서 사육하였습니다. 1주일의 적응 기간을 거친 후, 컴퓨터로 생성된 난수 시퀀스를 사용하여 C57BL/6 마우스를 세 그룹(대조군, 모델군, 중재군)으로 무작위 배정하였습니다. 무작위 배정 시퀀스는 동물 핸들링이나 결과 평가에 참여하지 않은 연구자에 의해 생성되었습니다.
눈가림을 보장하기 위해, 모든 동물 관리, 약물 투여 및 데이터 수집은 그룹 배정 내용을 알지 못하는 연구자들에 의해 수행되었습니다. 코드화된 그룹 배정 결과는 모든 실험과 통계 분석이 완료된 후에만 공개되었습니다. 눈가림은 다음 대상에 적용되었습니다: 경구 투여를 수행하는 기술자, 망막 조직학을 평가하는 병리학자, 그리고 Western blot (WB) 밴드를 정량화하는 분석자.
표본 크기 계산
동일한 실험 조건 하에서 망막 신경절 세포(RGC) 수를 평가한 예비 실험을 바탕으로 표본 크기를 결정하였습니다. 양측 유의 수준(α) 0.05와 통계적 검정력(1-β) 0.80을 가정했을 때, 모델군과 처치군 간의 RGC 수에서 임상적으로 유의미한 차이를 검출하기 위해서는 그룹당 최소 5마리의 마우스가 필요했습니다. 약 20%의 잠재적 탈락률을 고려하여, 각 그룹의 마우스 수를 6마리로 설정하였습니다.
당뇨 동물 모델 구축
대조군에는 표준 식단을 제공한 반면, 중재군과 모델군에는 4주 동안 고지방 고당분 식단(HFHSD)을 투여하였습니다. 이 식이 기간 이후, 중재군과 모델군에는 1% Streptozotocin (STZ) 용액을 35 mg/kg 용량으로 복강 내 투여하였습니다17,18,19,20. 투여 72시간 후, 공복 전 혈당 수치가 16.7 mmol/L를 초과하는 마우스를 DM 모델이 성공적으로 유도된 것으로 간주하여 후속 실험 대상으로 선정하였습니다. DM 동물들은 이후 4개월 동안 고지방 고당분 식단을 계속 유지하였으며, 대조군은 표준 식단을 유지하였습니다.
분류학적 검증 및 품질 평가
QMG에 포함된 8가지 성분은 현대화된 식물명 검색(MPNS, http://mpns.kew.org/mpns-portal/)을 통해 분류학적으로 검증되었습니다. QMG의 조성 보고 품질은 ConPhYMP 툴을 사용하여 평가되었습니다.
투여 방법
중재군 동물에게는 QMG를 경구 투여하였다. QMG는 Zhejiang Sansheng Mandi Pharmaceutical Co., Ltd.에서 구입하였다(중국 국가 의약품 승인 번호 Z20090036). QMG 현탁액은 QMG를 증류수와 균일하게 혼합하여 준비하였다. 중재군 마우스에는 모델군 및 공백군과 동일한 부피의 현탁액을 경구 투여(oral gavage)하였다. 투여 용량은 FDA 및 Reagan-Shaw21가 권장하는 체표면적(BSA) 표준화 방법을 사용하여, 성인 60 kg당 4.5 g의 임상 단회 치료 용량(시판 제제의 표준 단위 용량)을 기준으로 계산하였다. 성인 인간(Km = 37)과 마우스(Km = 3) 간의 환산 계수는 12.33이었으며, 이에 따라 마우스 투여 용량은 체중 1 kg당 0.9 g으로 산출되었다. 모델군과 공백군에는 동일한 부피의 생리식염수를 경구 투여하였다. 투여는 3개월 동안 매일 오전 9시에서 11시 사이에 실시하였다.
관찰 및 테스트 지표
일반 활력 징후 모니터링
치료적 개입을 종합적으로 평가하고 잠재적인 합병증을 감지하기 위해 체중, 혈당 수치, 물 및 사료 섭취량, 소변 배출량, 활동 수준 및 행동, 체온뿐만 아니라 털과 피부 상태를 포함한 일반적인 활력 징후와 생리학적 지표를 체계적으로 관찰하고 기록하였습니다.
HE 염색 분석을 통한 망막의 형태학적 변화 관찰
모든 시료는 고정 후 일련의 에탄올 및 자일렌 용액을 사용하는 자동 탈수기를 통해 처리되었으며, 이어서 파라핀에 매립되었습니다. 그 후, 4 µm 두께의 파라핀 절편을 제작하여 HE 염색을 실시하고 중성 검(neutral gum)으로 마운팅하였습니다. 망막 이미지는 3DHISTECH Pannoramic SCAN 스캐너를 사용하여 스캔하였습니다. 이미지 분석 및 데이터 측정은 Image-Pro Plus를 사용하여 수행되었습니다.
ELISA 분석을 통한 혈청 IL-6, TNF-α 및 IL-1β 검출
안와하 혈관 적출술을 통해 혈액 샘플을 수집하였다. 혈청은 4 °C에서 1,000 × g 으로 15분간 원심분리하여 분리한 후, 분석 전까지 -80 °C에 보관하였다. IL‑1β, IL‑6 및 TNF‑α의 혈청 수치는 시약 평형화, 샘플 첨가, 배양, 세척, 접합체 및 기질 첨가, 반응 정지, 광학 밀도 측정 및 표준 곡선을 이용한 농도 계산을 포함한 표준 절차에 따라 측정하였다. 광학 밀도는 마이크로플레이트 리더를 사용하여 450 nm에서 측정하였으며, 사이토카인 농도는 표준 곡선을 기준으로 계산하였다.
WB 분석을 통한 망막 및 결장 내 주요 조절 단백질의 검출
단일 멤브레인에서 세 번의 독립적인 생물학적 반복 실험을 수행하고, 표적 단백질에 대해 순차적으로 프로빙하였습니다. 모든 반복 실험은 동시에 희생된 단일 동물 코호트에서 유래되었습니다. 표적 단백질의 분자량이 GAPDH의 분자량과 너무 가까울 경우(<(5 kDa 차이), 신호 중첩을 방지하기 위해 각각 독립된 막에서 분석하였습니다. 정확한 정량을 위해 각 막에서는 표적 단백질 또는 GAPDH 중 하나만을 탐지하였습니다. 다음의 1차 항체를 사용하였습니다: GAPDH 다클론성 항체 (1:5000), CMKLR1 다클론 항체 (1:1000), Wnt5a 다클론 항체 (1:1000), TP53 다클론 항체 (1:1000), AP-1 단클론 항체 (1:5000), 그리고 PPAR gamma (PPAR-γ) 다클론 항체 (1:1000). 세포 용해 후 원심분리를 통해 총 단백질을 얻었습니다. 단백질 농도는 다음과 같이 측정되었습니다. BCA 분석법을 사용하여 측정하였다. 추출된 단백질은 12% 분리 젤을 이용한 SDS-PAGE로 분리한 후 멤브레인으로 전이시켰다. 멤브레인을 5% 탈지분유가 포함된 TBST로 블로킹한 뒤, 적절한 1차 항체와 함께 하룻밤 동안 다음 온도에서 배양하였다. 4 °C세척 후, 멤브레인을 1:10,000으로 희석한 HRP 접합 항-토끼 또는 항-마우스 2차 항체와 함께 배양하였다. 마지막으로, 화학 발광 이미징을 통해 단백질 밴드를 시각화하고 분석하였다. 시각화 및 데이터 처리 과정에서, 무관한 분자량 영역을 제거하기 위해 블롯을 수평으로 크롭하였으며, 레인 사이의 영역을 제거하지 않고 모든 샘플 레인을 유지하였다. 무관한 겔 영역을 제거하기 위한 크롭 과정에서 약간의 가장자리 왜곡이 발생할 수 있다.
16S rDNA 시퀀싱 분석을 통한 장내 미생물군집 검출
최종 절차를 수행하기 전, 각 마우스로부터 신선한 분변 샘플을 수집하였다. 마우스를 멸균 케이지에 개별적으로 10–15분 동안 배치하여 자연 배변을 유도하였다. 분변 펠렛을 멸균 핀셋으로 즉시 수집하여 멸균된 1.5 mL 튜브로 옮긴 후, 액체 질소로 급속 냉동하여 DNA 추출 전까지 -80 °C에서 보관하였다. 교차 오염을 최소화하기 위해 모든 절차는 멸균 조건하에 수행되었다. 미생물의 무결성을 보장하기 위해 배변 후 냉동까지의 간격을 10분 이내로 유지하였다. 분변 게놈 DNA(gDNA) 샘플은 Fecal gDNA extraction kit를 사용하여 정제하였으며, 이후 범용 프라이머인 8F (5’-AGAGTTTGATCATGGCTCAG-3’)와 1492R (5’-CGGTTACCTTGTTACGACTT-3’)를 이용한 중합효소 연쇄 반응(PCR)을 통해 전체 길이의 16S rDNA 유전자를 증폭하였다. PCR 산물은 이후 아가로스 겔 전기영동으로 분석하고, 정제 및 정량하여 후속 응용 분석에 사용하였다. 고처리량 시퀀싱은 Nanopore GridION 시퀀서로 수행하였다. 데이터 분석 과정에는 베이스콜링, 데이터 품질 관리, 종 주석 달기, 계통수 작성, 커뮤니티 분석, 알파 및 베타 다양성 분석, 그리고 상대적 풍부도가 차이나는 종 분석 및 커뮤니티 기능 예측이 포함되었다. 분석 과정에서는 NanoFilt, Usearch, R 프로그래밍 언어, Python 및 SILVA 데이터베이스와 같은 다양한 도구와 데이터베이스가 활용되었다.
장-망막 축과 전신 염증 및 다층적 장내 미생물군집의 상관관계 분석
다양한 수준의 장내 미생물군집과 혈청 염증성 사이토카인 및 주요 조절 단백질 간의 잠재적 연관성을 탐색하기 위해, Luoning Bio-Cloud 플랫폼을 이용하여 상관관계 분석을 수행하였습니다. 먼저, 시퀀싱 결과로부터 계(Kingdom), 문(Phylum), 강(Class), 목(Order), 과(Family), 속(Genus) 및 종(Species) 수준의 종 풍도 데이터를 추출하였습니다. 혈청 염증성 사이토카인과 단백질 발현 수준을 포함한 물리화학적 요인들을 환경 요인 파일로 작성하였습니다. 상관관계의 신뢰성과 시각화를 보장하기 위해, 미생물 풍도와 임상 측정 단위 간의 척도 차이를 제거하는 데이터 정규화 과정을 거쳤습니다. 상관 계수(R-값)와 그에 해당하는 유의 수준(P-값)을 계산하였습니다. 결과는 상관관계 히트맵을 통해 시각화하였으며, 여기서 색상 그라데이션은 상관관계의 강도와 방향을 나타내고(빨간색은 양의 상관관계, 파란색은 음의 상관관계), 별표(**)는 통계적 유의성(P < 0.01)을 나타냅니다.
통계 방법
모든 통계 분석 및 시각화는 GraphPad Prism을 사용하여 수행되었습니다. 정규 분포를 따르는 데이터의 경우 평균 비교를 위해 t-test를 이용하였습니다. 데이터가 정규성을 벗어난 경우에는 Kruskal-Wallis test를 사용하였습니다. 변수 간의 관계에 대해서는 Spearman 또는 Pearson 상관 분석을 실시하였습니다. 모든 통계 검정은 양측 검정으로 수행되었으며, 통계적 유의 수준은 0.05로 설정하였습니다.
결과
General situation of experimental animals
Blood glucose levels were significantly elevated in the model group (27.21 ± 6.03 mmol/L) compared with the blank group (P < 0.001), indicating the successful induction of the DM model. During the study period, the experimental animals showed stable body weight, continuous water and food intake, normal urine output, body temperature, healthy fur and skin condition, and normal behavior during the experiment.
Composition and validation of QMG
QMG, a proprietary Chinese medicine that passed Phase III clinical trials, encompasses Astragalus membranaceus (Fisch.) Bunge [Fabaceae, Astragali radix], Pueraria lobata (Willd.) Ohwi [Fabaceae, Puerariae lobatae radix], Rehmannia glutinosa (Gaertn.) Libosch. Ex Fisch. & C.A. Mey. [Orobanchaceae; Rehmanniae radix], Lycium barbarum L. [Solanaceae; Lycii fructus], Senna obtusifolia (L.) H.S. Irwin & Barneby [Fabaceae; Cassiae semen], Leonurus japonicus Houtt. [Lamiaceae, Leonuri herba], Typha angustifolia L. [Typhaceae; Typhae pollen], Whitmania pigra Whitman [Hirudinidae; Hirudo]15. The detailed information, including the Chinese name, scientific name by MPNS validation, species, family, part used, representative bioactive compounds, was summarized in Table 1, which defined the QMG and provided a transparent, scientifically grounded basis for the formulas under investigation.
| No. | Chinese name | Scientific name by MPNS validation | Species | Family | Part Used | Representative bioactive compounds | |||||||
| 1 | HuangQi | Astragalus membranaceus (Fisch.) Bunge [Fabaceae, Astragali radix] | Astragalus mongholicus (Fisch.) Bunge | Fabaceae | Radix | Astragaloside IV, Calycosin | |||||||
| 2 | GeGen | Pueraria lobata (Willd.) Ohwi [Fabaceae, Puerariae lobatae radix] | Pueraria lobata (Willd.) | Fabaceae | Radix | Puerarin, Daidzin | |||||||
| 3 | DiHuang | Rehmannia glutinosa (Gaertn.) Libosch. Ex Fisch. & C.A. Mey. [Orobanchaceae; Rehmanniae radix] | Rehmannia glutinosa (Gaertn.) Libosch. Ex Fisch. & C.A. Mey. | Orobanchaceae | Radix | Catalpol, Rehmannioside D | |||||||
| 4 | GouQiZi | Lycium barbarum L. [Solanaceae; Lycii fructus] | Lycium barbarum L. | Solanaceae | Fructus | Lycium barbarum polysaccharides, Betaine | |||||||
| 5 | JueMingZi | Senna obtusifolia (L.) H.S. Irwin & Barneby [Fabaceae; Cassiae semen] | Senna obtusifolia (L.) H.S. Irwin & Barneby | Fabaceae | Semen | Aurantio-obtusin, Emodin | |||||||
| 6 | Chong WeiZi | Leonurus japonicus Houtt. [Lamiaceae, Leonuri fructus] | Leonurus japonicus Houtt. | Lamiaceae | Fructus | Stachydrine, Leonurine | |||||||
| 7 | PuHuang | Typha angustifolia L. [Typhaceae; Typhae pollen] | Typha angustifolia L. | Typhaceae | Pollen | Isorhamnetin, Kaempferol | |||||||
| 8 | ShuiZhi | Whitmania pigra Whitman [Hirudinidae; Hirudo] | Whitmania pigra Whitman | Hirudinidae | Body | Hirudin, Calin | |||||||
Table 1: The composition and quality information of QMG ingredients. Detailed information on the composition and quality information of QMG ingredients, including the Chinese name, scientific name by MPNS validation, species, family, part used, and representative bioactive compounds.
QMG ameliorates the retinal morphology
As depicted in Figure 2A, the retina of the blank group exhibited a well-organized structure. The cellular arrangement was dense and orderly across all layers, with no evidence of structural disruption, exudation, or inflammatory infiltration. Compared with the blank group, retinal sections from the model group (Figure 2B) exhibited marked structural disorganization, characterized by disordered cellular arrangement, a significant reduction in RGC counts (P < 0.0001, Table 2, Figure 3A), and pronounced thinning of the total retinal thickness (P < 0.0001, Figure 3B). Notably, neovascular tufts penetrating the inner limiting membrane were observed (indicated by a red arrow), confirming successful establishment of the DR model. In contrast, the intervention group (Figure 2C) demonstrated significant attenuation of histopathological abnormalities relative to the model group, as evidenced by restoration of retinal laminar architecture, partial recovery of RGC numbers (P < 0.001, Table 2, Figure 3A), and reversal of retinal thinning (P < 0.01, Table 2, Figure 3B). These data provide strong evidence for QMG as an effective intervention for DR.
QMG attenuates systemic inflammatory response in DR
Compared with the blank group, the expression levels of IL-1β, IL-6, and TNF-α were significantly upregulated in the model group (P < 0.0001), confirming that the modeling procedure successfully induced a marked inflammatory response. Conversely, compared with the model group, the expression levels of IL-1β, IL-6, and TNF-α were significantly downregulated in the intervention group (p < 0.0001), indicating a potent inhibitory effect of QMG on systemic inflammation. The serum concentrations of IL-1β, IL-6, and TNF-α across the three groups are summarized in Table 3 and illustrated in Figure 4A–C.
QMG modulates the CMKLR1-centered regulatory network along the gut–retina axis
As shown in Figure 5, Figure 6, Figure 7, and Supplementary Figure 2, the results of this study showed that in DR model mice, the expression levels of five key regulatory proteins—AP-1, Wnt5a, CMKLR1, TP53, and PPAR-γ—exhibited a consistent downward trend in both colonic and retinal tissues. Following QMG intervention, the expression of these proteins showed varying degrees of recovery, with some proteins reaching statistical significance. Specifically, after QMG intervention, the expression of AP-1, Wnt5a, and CMKLR1 in colonic tissue was significantly higher than that in the model group (P < 0.05), while in retinal tissue, the expression of CMKLR1 and TP53 was significantly higher than that in the model group (P < 0.01). These findings may suggest that AP-1 and Wnt5a are more sensitive responders in the colon, whereas TP53, as an apoptosis regulator, plays a more critical role in retinal neuroprotection. Notably, CMKLR1 was the only protein that achieved significant recovery in both tissues, indicating that QMG may facilitate bidirectional communication along the gut–retina axis through systemic regulation of CMKLR1 expression.
The consistent directionality of expression changes for these five proteins in both colonic and retinal tissues holds important biological significance. As the primary habitat of the gut microbiota, changes in colonic protein expression reflect the state of the intestinal microenvironment, while the retina is the effector organ of DR. The consistency of expression patterns between these two tissues strongly supports the gut–retina axis as an important participant in the pathophysiological processes of DR.
QMG restores and improves the composition, diversity, and function of gut microbiota
The results of the community composition
Hierarchical clustering analysis revealed distinct shifts in gut microbial composition and clustering at multiple taxonomic levels following QMG intervention. At the phylum level (Figure 8A), the model group exhibited a marked reduction in Firmicutes abundance and a significant enrichment of Bacteroidetes compared with the blank group, indicating a diabetes-driven shift in the Firmicutes/Bacteroidetes ratio; notably, the intervention restored the proportions of both Firmicutes and Bacteroidetes to levels approaching those of the blank group, accompanied by an elevated relative abundance of Proteobacteria. At the class level (Figure 8B), the model group manifested an elevation in Bacteroidia and Clostridia and a lessening in Bacilli and Erysipelotrichia compared with the blank group; in contrast, the intervention group showed restoration in Bacteroidia and Erysipelotrichia to levels approaching those of the blank group, accompanied by elevated relative abundance of Clostridia and Alphaproteobacteria. At the order level (Figure 8C), the model group demonstrated an elevated proportion of Bacteroidales, and a decreased proportion of Erysipelotrichales and Lactobacillales compared with the blank group; conversely, the intervention group restored the proportions of Bacteroidales and Erysipelotrichales to levels approaching those of the blank group, accompanied by an elevated relative abundance of Clostridiales. At the family level (Figure 8D), the model group presented a growth in Odoribacteraceae, Peptostreptococcaceae, Rikenellaceae, and Tannerellaceae, and a decrease in Erysipelotrichaceae, Lactobacillaceae, Muribaculaceae, and Ruminococcaceae compared with the blank group; in contrast, the intervention group downregulated the proportions of Odoribacteraceae and Peptostreptococcaceae compared with the model group; restored the proportions of Erysipelotrichaceae and Ruminococcaceae to levels approaching those of the blank group, accompanied by an elevated relative abundance of Lachnospiraceae. At the genus level (Figure 8E), the model group exhibited an upward trend in Odoribacter, Paeniclostridium, Alistipes, Parabacteroides, and Clostridioides, and a decrease trend in Lactobacillus, Faecalibaculum, Ruminococcus, Bacteroides, and Muribaculum compared with the blank group; notably, the intervention group downregulated the proportions of Odoribacter, Clostridioides, and Paeniclostridium compared with the model group; restored the proportions of Faecalibaculum and Ruminococcus to levels approaching those of the blank group; and increased the relative abundance of Lachnoclostridium, Sphingomonas, Flavonifractor, and Blautia. At the species level (Figure 8F), the model group showed an increase in Odoribacter splanchnicus, Clostridioides difficile, and Paeniclostridium sordellii, and a decrease in Faecalibaculum rodentium, Bacteroides salanitronis, Muribaculum intestinale compared with the blank group; in contrast, the intervention group downregulated the proportion of Odoribacter splanchnicus and Clostridioides difficile compared with the model group; restored the proportions of Faecalibaculum rodentium, and Muribaculum intestinale, accompanied by elevated relative abundance of Lachnoclostridium phocaeense, and Flavonifractor plautii. Collectively, these findings indicate that QMG restored gut microbial composition across multiple taxonomic levels, shifting the community structure toward a homeostatic state.
The results of the Alpha diversity and Beta diversity
As indicated by the Alpha diversity results (Figure 9A), the intervention group exhibited the highest Chao1, PD, Simpson, and Shannon indices, while the model group displayed the lowest, with the blank group showing intermediate levels. These findings underscore the detrimental impact of DR on gut microbiota diversity and demonstrate that QMG intervention effectively restores and enhances microbial richness and evenness in DR mice.
As indicated by the Beta diversity representative results (Figure 9B,C), the principal coordinates analysis (PCoA) plots revealed a distinct separation of microbial communities across the three groups, which was statistically supported by the Permutational Multivariate Analysis of Variance (PERMANOVA). Specifically, the Bray-Curtis-based analysis indicated a significant structural divergence (PERMANOVA: R2 = 0.67, P < 0.001), suggesting that the DR model and QMG intervention accounted for a substantial proportion of the variation in microbial community composition. Consistent with this, the analysis based on Weighted unique fraction (UniFrac) distance, which incorporates phylogenetic relationships between taxa, further confirmed the significant community shift (PERMANOVA: R2 = 0.58, P < 0.01).
As displayed by the Beta diversity results (Figure 9D), the non-metric multidimensional scaling (NMDS) ordination plot demonstrated a clear spatial clustering of samples according to the respective groups, with a stress value of 0.04. Given that a stress value below 0.05 is generally considered to represent an excellent representation of the community structure in a reduced-dimensional space, these results collectively suggest that the QMG intervention significantly altered the global composition of the gut microbiota.
The results of the differential abundance analysis
According to the linear discriminant analysis effect size (LEfSe) analysis (Figure 9E), the results revealed that Clostridia, Clostridiales, Lachnospiraceae, and Lachnoclostridium were remarkably enriched in the intervention group, whereas Odoribacteraceae, Odoribacter, Peptostreptococcaceae, and Paeniclostridium were notably enriched in the model group. Therefore, the above gut microbiota might be the primary differential microbiota responsible for the intergroup differences between the model and intervention groups.
The results of community function prediction
The predicted functional profiles at Level 2 and Level 3 showed distinct clustering patterns across the three groups (Figure 9F,G). Specifically, compared with the blank group, the model group exhibited a significant deviation in the relative abundance of metabolic pathways. Notably, this functional perturbation in the model group was largely ameliorated in the intervention group. The functional composition of the intervention group showed a substantial shift back towards the profile observed in the blank group, indicating that the QMG intervention effectively modulated the gut microbial functional structure. These results suggest that the intervention not only reshaped the taxonomic composition and structure of the gut microbiota but also restored its functional metabolic capacity toward a homeostatic state.
QMG modulates the gut–retina axis by coupling systemic inflammation and key regulatory proteins
Associations at global levels
At the kingdom level (Figure 10A–C), QMG improved the CMKLR1-centered network mainly by modulating Bacteria along the gut-retina axis. Specifically, Bacteria positively correlated with retinal PPAR-γ in the blank group (P < 0.01), but this association was not observed in the model group. Following QMG intervention, bacterial abundance positively correlated with retinal CMKLR1 and Wnt5a yet negatively correlated with colonic TP53 and PPAR-γ (P < 0.01).
At the phylum level (Figure 10D–F), QMG improved the CMKLR1-centered network mainly by modulating Candidatus and Bacteroidetes along the gut-retina axis. Specifically, the positive correlation between Candidatus and colonic CMKLR1 observed in the blank group was lost following DR induction, but was restored by QMG intervention, which was accompanied by a negative correlation with serum IL-1β and TNF-α, while positively correlated with retinal PPAR-γ, AP-1, TP53, colonic AP-1, and serum IL-6 (P < 0.01). Proteobacteria in the model group negatively correlated with colonic CMKLR1 (P < 0.01), a trend that persisted following QMG intervention. Meanwhile, Firmicutes were positively correlated with retinal CMKLR1 in the model group, whereas Bacteroidetes and Tenericutes were negatively correlated with retinal CMKLR1 (P < 0.01). Following QMG intervention, Bacteroidetes shifted to positive correlations with retinal PPAR-γ, AP-1, TP53, and colonic CMKLR1 (P < 0.01). Additionally, Actinobacteria positively correlated with retinal CMKLR1 and Wnt5a (P < 0.01).
At the class level (Figure 10G–I), QMG improved the CMKLR1-centered network mainly by regulating Cytophagia and Bacteroidia along the gut-retina axis. Specifically, Cytophagia and Chitinophagia negatively correlated with retinal CMKLR1 in the blank group (P < 0.01). In the model group, Cytophagia, Bacteroidia, and Mollicutes negatively correlated with retinal CMKLR1, while colonic CMKLR1 positively correlated with Flavobacteriia and Epsilonproteobacteria, yet negatively with Tissierellia, Alphaproteobacteria, Clostridia, and Bacilli (P < 0.01). Following QMG intervention, Bacteroidia and Cytophagia positively correlated with colonic CMKLR1, retinal PPAR-γ, AP-1, TP53, colonic AP-1 and serum IL-6, whereas Mollicutes, Deltaproteobacteria, Alphaproteobacteria, and Gammaproteobacteria showed the opposite pattern (P < 0.01). Moreover, Chlamydiia, Actinobacteria, Tissierellia, Bacilli, and Negativicute negatively correlated with retinal CMKLR1 and Wnt5a, while Coriobacteriia exhibited the reverse correlation (P < 0.01).
At the order level (Figure 10J–L), QMG improved the CMKLR1-centered network mainly by modulating Bacteroidales, Bacillales, and Clostridiales along the gut–retina axis. Specifically, Cytophagales and Chitinophagales negatively correlated with retinal CMKLR1, whereas Marinilabiliales positively correlated with colonic CMKLR1 in the blank group (P < 0.01). In the model group, Mycoplasmatales, Cytophagales, Bacteroidales, and Marinilabiliales negatively correlated with retinal CMKLR1, while colonic CMKLR1 positively correlated with Flavobacteriales and Campylobacterales, yet negatively with Tissierellales, Bacillales, Sphingomonadales, Clostridiales, and Lactobacillales (P < 0.01). Following QMG intervention, Bacteroidales and Clostridiales positively correlated with colonic CMKLR1, AP-1, retinal PPAR-γ, AP-1, TP53, and serum IL-6, whereas Desulfovibrionales, Rhizobiales, Sphingomonadales, and Enterobacterales showed the opposite pattern (P < 0.01). Moreover, Eggerthellales and Coriobacteriales positively correlated with retinal CMKLR1 and Wnt5a, yet negatively with colonic TP53 and PPAR-γ, whereas Chlamydiales, Thermoanaerobacterales, Corynebacteriales, Tissierellales, and Bacillales exhibited the reverse correlation (P < 0.01).
Associations at Fine levels
At the family level (Figure 11A–C), QMG improved the CMKLR1-centered network primarily by modulating Lachnospiraceae, Bacteroidaceae, and Lactobacillaceae along the gut–retina axis. Specifically, Ruminococcaceae negatively correlated with retinal CMKLR1, whereas Lachnospiraceae positively correlated with retinal CMKLR1 in the blank group (P < 0.01). In the model group, Peptostreptococcaceae positively correlated with retinal CMKLR1, while Tannerellaceae, Bacteroidaceae, Odoribacteraceae, and Lachnospiraceae showed the opposite pattern (P < 0.01). Meanwhile, colonic CMKLR1 positively correlated with Marinilabiliaceae, Rikenellaceae, and Flavobacteriaceae, yet negatively with Lachnospiraceae and Lactobacillaceae (P < 0.01). Following QMG intervention, Enterobacteriaceae, Sphingomonadaceae, and Oscillospiraceae negatively correlated with colonic CMKLR1, AP-1, and serum IL-6, as well as retinal PPAR-γ, AP-1, and TP53, while positively correlating with serum IL-1β and TNF-α, whereas Peptococcaceae, Bacteroidaceae, Muribaculaceae, and Rikenellaceae showed the opposite pattern (P < 0.01). Moreover, Veillonellaceae, Peptostreptococcaceae, Lactobacillaceae, and Ruminococcaceae negatively correlated with retinal CMKLR1 and Wnt5a, yet positively with colonic TP53 and PPAR-γ, whereas Eggerthellaceae, Lachnospiraceae, and Hungateiclostridiaceae exhibited the reverse correlation (P < 0.01).
At the genus level (Figure 11D–F), QMG improved the CMKLR1-centered network primarily by modulating Lachnoclostridium, Clostridioides, and Bacteroides along the gut–retina axis. Specifically, Ruminococcus negatively correlated with retinal CMKLR1, whereas Lachnoclostridium showed the opposite pattern in the blank group (P < 0.01). In the model group, Lactobacillus and Sphingomonas negatively correlated with colonic CMKLR1, while Alistipes and Croceibacter positively correlated with colonic CMKLR1 (P < 0.01). Meanwhile, retinal CMKLR1 positively correlated with Paeniclostridium and Clostridioides, yet negatively with Mucinivorans, Intestinimonas, Flavonifractor, Parabacteroides, Bacteroides, Odoribacter, and Lachnoclostridium (P < 0.01). Following QMG intervention, Sphingomonas and Oscillibacter negatively correlated with colonic CMKLR1, AP-1, and serum IL-6, as well as retinal PPAR-γ, AP-1, and TP53, while positively correlating with serum IL-1β and TNF-α, whereas Bacteroides, Muribaculum, and Alistipes showed the opposite pattern (P < 0.01). Moreover, Dialister, Flavonifractor, Clostridioides, Ruminococcus, and Paeniclostridium negatively correlated with retinal CMKLR1 and Wnt5a, yet positively with colonic TP53 and PPAR-γ, whereas Pseudoclostridium, Lachnoclostridium, and Blautia exhibited the reverse correlation (P < 0.01).
At the species level (Figure 11G–I), QMG improved the CMKLR1-centered network primarily by modulating Clostridioides difficile, Alistipes shahii, and Paeniclostridium sordellii along the gut–retina axis. Specifically, Ruminococcus bicirculans and endosymbiont 'TC1' of Trimyema compressum negatively correlated with retinal CMKLR1, whereas Lactobacillus fermentum and Lactobacillus helveticus displayed the opposite pattern in the blank group (P < 0.01). In the model group, Croceibacter atlanticus, Alkalitalea saponilacus, Alistipes finegoldii, and Alistipes shahii positively correlated with colonic CMKLR1, while Sphingomonas panacis, Paeniclostridium sordellii, Clostridioides difficile, and Lactobacillus murinus positively correlated with retinal CMKLR1, yet Odoribacter splanchnicus, Mucinivorans hirudinis, Lachnoclostridium phocaense, Flavonifractor plautii, and Intestinimonas butyriciproducens showed the opposite pattern (P < 0.01). Following QMG intervention, Alistipes shahii and Muribaculum intestinale positively correlated with colonic CMKLR1, AP-1, and serum IL-6, as well as retinal PPAR-γ, AP-1, and TP53, while negatively correlating with serum IL-1β and TNF-α, whereas Sphingomonas panacis, Oscillibacter sp. PEA192, and Oscillibacter valericigenes exhibited the reverse pattern (P < 0.01). Moreover, Pseudoclostridium thermosuccinogenes, Lachnoclostridium phocaense, Bacteroides salanitronis, and Blautia sp. N6H1-15 positively correlated with retinal CMKLR1 and Wnt5a, yet negatively with colonic TP53 and PPAR-γ, whereas Paeniclostridium sordellii, Flavonifractor plautii, endosymbiont 'TC1' of Trimyema compressum, Clostridioides difficile, and Dialister pneumosintes showed the reverse correlation (P < 0.01). The detailed correlation results at kingdom, phylum, class, order, family, genus, and species levels are presented in Supplementary File 1.
DATA AVAILABILITY:
The 16S rDNA sequencing datasets generated and analyzed during the current study are available in the National Center for Biotechnology Information (NCBI) Sequence Read Archive (SRA) repository under the BioProject accession number: PRJNA1281561. All other data generated or analyzed during this study are included in this article.
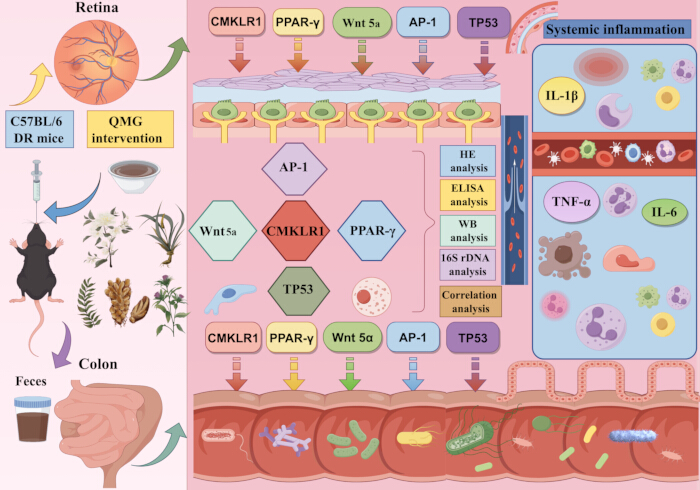
Figure 1: Graphical abstract. The graphical abstract shows the process of this study. Please click here to view a larger version of this figure.
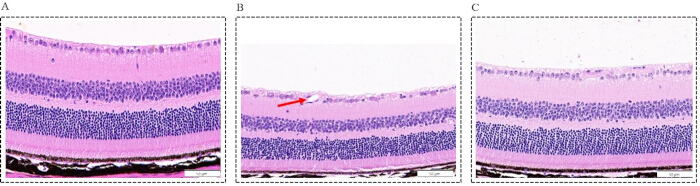
Figure 2: Morphological changes in the retina across the three groups (Scale bar = 50 µm, Magnification: ×400). (A) Blank group: representative photomicrographs of hematoxylin-eosin (HE)-stained retinal sections, showing an intact, well-organized retinal architecture with neatly arranged cellular layers; (B) Model group: representative photomicrographs of HE-stained retinal sections, showing marked structural disorganization, characterized by disordered cellular arrangement, a significant reduction in retinal ganglion cell (RGC) counts (P < 0.0001), pronounced thinning of the retinal thickness (P < 0.0001), and neovascular tufts penetrating the inner limiting membrane (indicated by a red arrow); (C) Intervention group: representative photomicrographs of HE-stained retinal sections, showing significant attenuation of histopathological abnormalities relative to the model group, as evidenced by restoration of retinal laminar architecture, partial recovery of RGC numbers (P < 0.001), and restoration of retinal thinning (P < 0.01). Please click here to view a larger version of this figure.
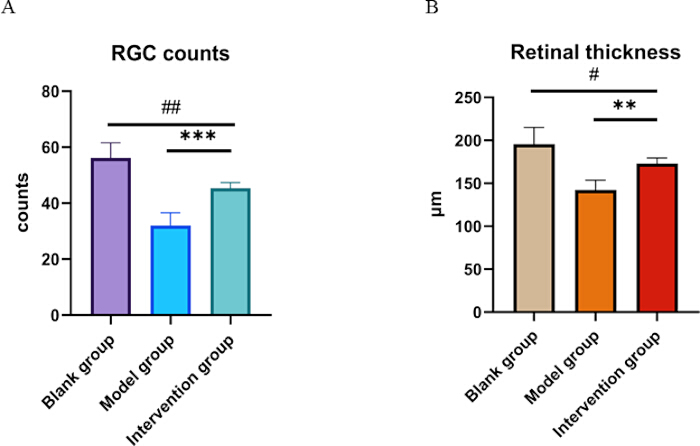
Figure 3: Histological quantification of RGC counts and retinal thickness. (A) Quantification of RGC counts in the ganglion cell layer. (B) Measurement of total retinal thickness (µm). Data are shown as mean ± SD (n = 6 per group). Compared with the blank group: #P <0.05, ##P <0.01; compared with the model group: **P <0.01, ***P <0.001. Please click here to view a larger version of this figure.
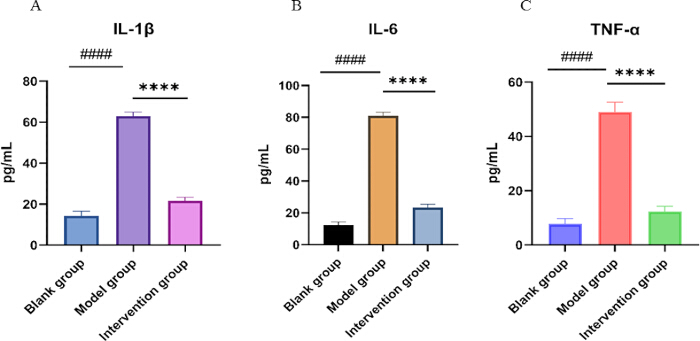
Figure 4: Serum concentrations of inflammatory cytokines in the three groups. Bar charts showing ELISA‑based quantification of serum IL‑1β (A), IL‑6 (B), and TNF‑α (C) levels in the blank control, model group, and intervention groups. Data are expressed as mean ± SD (n = 6 per group). Compared with the blank group: ####P < 0.0001; compared with the model group: ****P < 0.0001. Please click here to view a larger version of this figure.
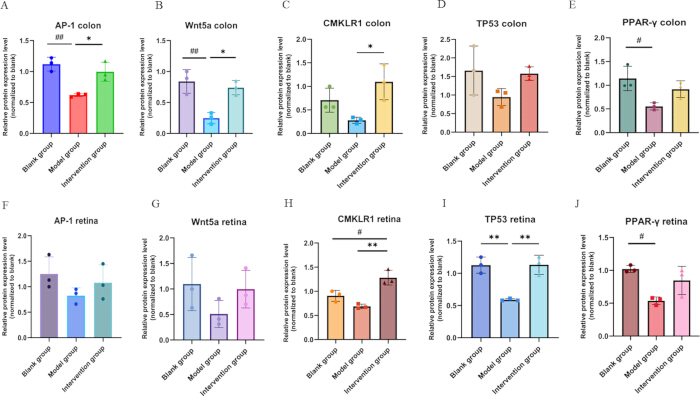
Figure 5: Bar chart of the expression levels of key regulatory proteins in the retina and colon. (A) Relative protein expression level (normalized to blank) of AP-1 in the colon (n = 3); (B) Relative protein expression level (normalized to blank) of Wnt5a in the colon (n = 3); (C) Relative protein expression level (normalized to blank) of CMKLR1 in the colon (n = 3); (D) Relative protein expression level (normalized to blank) of TP53 in the colon (n = 3); (E) Relative protein expression level (normalized to blank) of PPAR-γ in the colon (n = 3); (F) Relative protein expression level (normalized to blank) of AP-1 in the retina (n = 3); (G) Relative protein expression level (normalized to blank) of Wnt5a in the retina (n = 3); (H) Relative protein expression level (normalized to blank) of CMKLR1 in the retina (n = 3); (I) Relative protein expression level (normalized to blank) of TP53 in the retina (n = 3); (J) Relative protein expression level (normalized to blank) of PPAR-γ in the retina (n = 3). Compared with the blank group: #P < 0.05, ##P < 0.01; compared with the model group: *P < 0.05, **P < 0.01. Please click here to view a larger version of this figure.
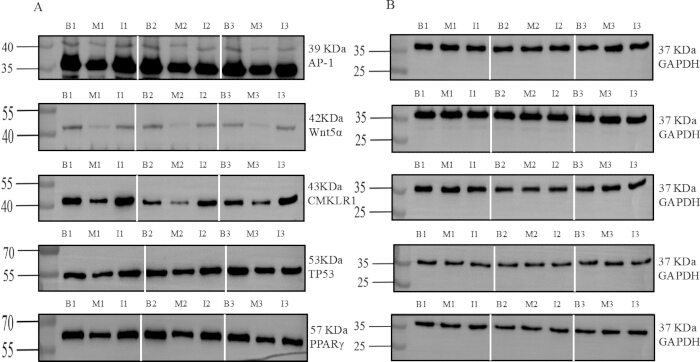
Figure 6: Representative WB grayscale blots of key regulatory proteins in the colon. (A) Target protein expression: AP-1, Wnt5a, CMKLR1, TP53, and PPAR-γ; (B) Loading control: GAPDH. Vertical white lines separate replicate sets (Rep1, Rep2, Rep3); Molecular weight markers (kDa) are indicated on the left, and protein names with corresponding kDa are shown on the right. Lanes are labeled as: B1 (Blank group 1), M1 (Model group 1), I1 (Intervention group 1); B2 (Blank group 2), M2 (Model group 2), I2 (Intervention group 2); B3 (Blank group 3), M3 (Model group 3), I3 (Intervention group 3). Full-length, uncropped Western blot (WB) images with visible molecular weight markers have been provided as Supplementary Figure 2. Please click here to view a larger version of this figure.
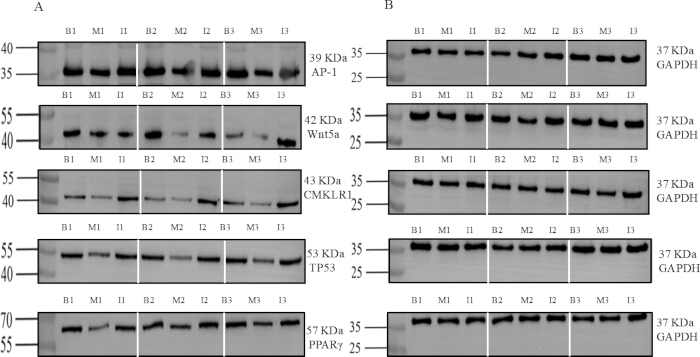
Figure 7: Representative WB grayscale blots of key regulatory proteins in the retina. (A) Target protein expression: AP-1, Wnt5a, CMKLR1, TP53, and PPAR-γ; (B) Loading control: GAPDH. Vertical white lines separate replicate sets (Rep1, Rep2, Rep3); Molecular weight markers (kDa) are indicated on the left, and protein names with corresponding kDa are shown on the right. Lanes are labeled as: B1 (Blank group 1), M1 (Model group 1), I1 (Intervention group 1); B2 (Blank group 2), M2 (Model group 2), I2 (Intervention group 2); B3 (Blank group 3), M3 (Model group 3), I3 (Intervention group 3). Full-length, uncropped WB images with visible molecular weight markers have been provided as Supplementary Figure 2. Please click here to view a larger version of this figure.
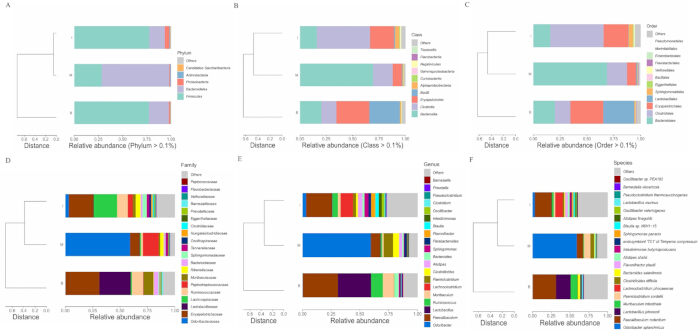
Figure 8: Hierarchical clustering of gut microbiota composition at different levels. Hierarchical clustering dendrogram based on Bray-Curtis dissimilarity among the blank control (B), model group(M), and intervention group (I). The branch length represents the degree of structural divergence. Stacked bar chart depicting the relative abundances of dominant phyla across the three groups. Phyla falling below the threshold are aggregated as “Others”. (A) Qiming granule (QMG) rebalances the gut microbiota composition at the phylum level; (B) QMG rebalances the gut microbiota composition at the class level; (C) QMG rebalances the gut microbiota composition at the order level; (D) QMG rebalances the gut microbiota composition at the family level; (E) QMG rebalances the gut microbiota composition at the genus level; (F) QMG rebalances the gut microbiota composition at the species level. Abbreviation: B, blank group; M, model group; I, intervention group. Please click here to view a larger version of this figure.
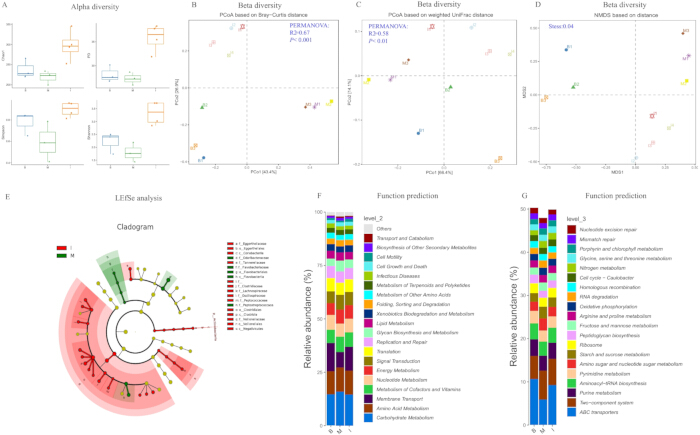
Figure 9: Analysis of gut microbiota diversity, differential abundance, and predicted functional pathways. (A) Alpha diversity analysis assessed by Chao1, PD, Simpson, and Shannon indices revealed that the intervention group exhibited higher microbial diversity than the model group, indicating that QMG treatment effectively restores gut microbial richness and evenness. (B) Beta diversity analysis assessed by principal coordinates analysis (PCoA) based on Bray-Curtis distance revealed significant differences among groups (PERMANOVA: R2=0.67, P < 0.001), indicating that the DR model and QMG intervention accounted for a substantial proportion of the variation in microbial community composition. (C) Beta diversity analysis assessed by PCoA based on weighted unique fraction (UniFrac) distance further confirmed the significant community shift (PERMANOVA: R2= 0.58, P < 0.01). (D) Beta diversity analysis assessed by non-metric multidimensional scaling (NMDS) ordination demonstrated a stress value of 0.04, suggesting that the QMG intervention significantly altered the global composition of the gut microbiota. (E) Cladogram of differential abundance analysis assessed by linear discriminant analysis effect size (LEfSe) revealed the primary differential microbiota between the model and intervention groups. Functional prediction of the gut microbiota at KEGG Level 2 (F) and KEGG Level 3 (G) suggested that the intervention not only reshaped the taxonomic composition and structure of the gut microbiota but also restored its functional metabolic capacity toward a homeostatic state. Please click here to view a larger version of this figure.
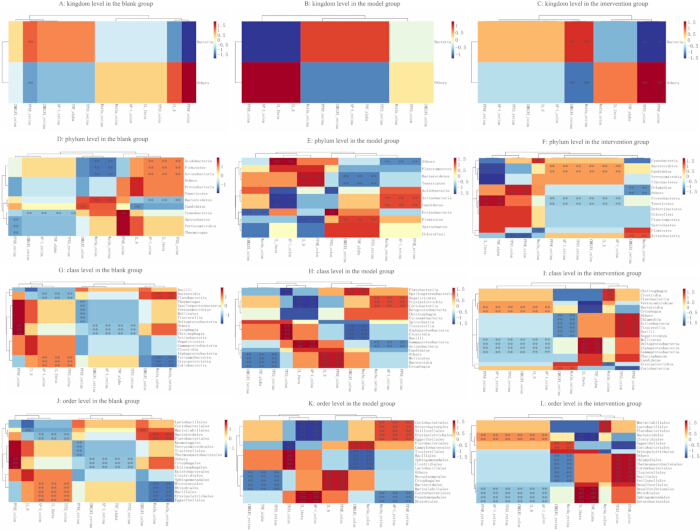
Figure 10: Global association of gut microbiota with inflammatory and regulatory factors. (A) Association of gut microbiota at kingdom level in the blank group; (B) Association of gut microbiota at kingdom level in the model group; (C) Association of gut microbiota at kingdom level in the intervention group; (D) Association of gut microbiota at phylum level in the blank group; (E) Association of gut microbiota at phylum level in the model group; (F) Association of gut microbiota at phylum level in the intervention group; (G) Association of gut microbiota at class level in the blank group; (H) Association of gut microbiota at class level in the model group; (I) Association of gut microbiota at class level in the intervention group; (J) Association of gut microbiota at order level in the blank group; (K) Association of gut microbiota at order level in the model group; (L) Association of gut microbiota at order level in the intervention group. Please click here to view a larger version of this figure.
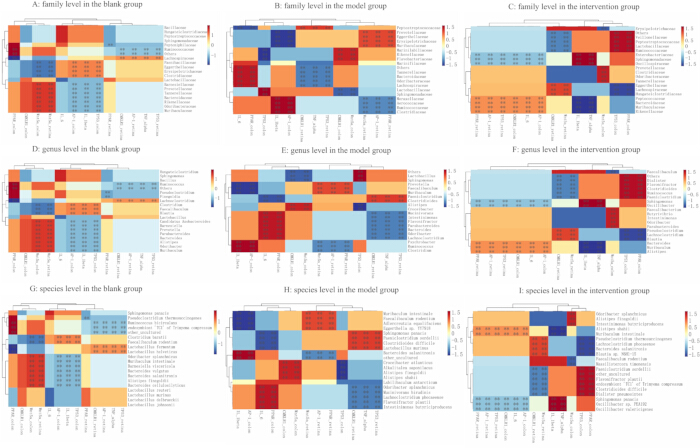
Figure 11: Fine association of gut microbiota with inflammatory and regulatory factors. (A) Association of gut microbiota at the family level in the blank group; (B) Association of gut microbiota at the family level in the model group. (C) Association of gut microbiota at family level in the intervention group; (D) Association of gut microbiota at genus level in the blank group; (E) Association of gut microbiota at genus level in the model group; (F) Association of gut microbiota at genus level in the intervention group; (G) Association of gut microbiota at species level in the blank group; (H) Association of gut microbiota at species level in the model group;(I) Association of gut microbiota at species level in the intervention group. Please click here to view a larger version of this figure.
| Groups (n = 6) | RGCs counts | Retinal thickness |
| Blank group | 56.17 ± 5.382 | 195.50 ± 19.54 μm |
| Model group | 32.00 ± 4.561#### | 142.30 ± 11.34 μm#### |
| Intervention group | 45.33 ± 2.066 ##*** | 173.00 ± 6.575 μm#** |
| p | <0.0001 | <0.0001 |
Table 2: Quantitative analysis of RGC counts and retinal thickness in the three experimental groups. Data are presented as Mean ± SD (n = 6 per group). Compared with the blank group: #P <0.05, ##P <0.01, ####P <0.0001; compared with the model group: **P <0.01, ***P <0.001.
| Groups (n = 6) | IL-1β | IL-6 | TNF-α |
| Blank group | 14.31 ± 2.28 | 12.48 ± 1.774 | 7.728 ± 2.048 |
| Model group | 62.88 ± 2.01#### | 80.95 ± 2.247#### | 49.00 ± 3.647#### |
| Intervention group | 21.7 ± 1.654**** | 23.27 ± 2.074**** | 12.35 ± 1.891**** |
| P | <0.0001 | <0.0001 | <0.0001 |
Table 3: Serum expression levels of IL-1β, IL-6, and TNF-α in the three experimental groups. Data are presented as Mean ± SD (n = 6 per group). Cytokine concentrations were determined by enzyme‑linked immunosorbent assay (ELISA) and are reported in pg/mL. Compared with the blank group: ####P < 0.0001; compared with the model group: ****P < 0.0001.
Supplementary Figure 1: Experimental Design and Study Timeline. Schematic overview of the experimental design.Please click here to download this file.
Supplementary Figure 2: Original, full-length, uncropped WB images corresponding to Figure 6 and Figure 7. Raw images without modification contain all molecular weight markers in colon and retina blots for AP-1, Wnt5a, TP53, CMKLR1, PPAR-γ, and loading control GAPDH. Molecular weight markers (kDa) are indicated. Lanes are labeled: B1 (Blank group 1), M1 (Model group 1), I1 (Intervention group 1); B2 (Blank group 2), M2(Model group 2), I2 (Intervention group 2); B3 (Blank group 3), M3 (Model group 3), I3 (Intervention group 3). The original blots were not subjected to high-contrast adjustments.Please click here to download this file.
Supplementary File 1: Detailed correlation analyses of gut microbiota with inflammatory and regulatory factors.Please click here to download this file.
토론
당뇨망막병증(DR)은 만성 고혈당, 염증 및 대사 조절 장애로 인해 발생하는 복잡한 신경혈관 합병증입니다22. 미국 안과학회는 DR을 비증식성 DR과 신생혈관 형성의 시작으로 특징지어지는 증식성 DR로 분류합니다23. 현재의 치료 전략이 가진 한계로 인해, 새로운 메커니즘을 탐구하는 것이 DR 해결을 위한 유망한 방향으로 떠오르고 있습니다. 특히, 최근의 획기적인 연구들을 통해 장-망막 축(gut–retina axis)이 DR의 중요하지만 아직 충분히 활용되지 않은 치료 표적으로 확인되었습니다. 2017년 Sheldon Rowan에 의해 처음 소개되고 설명된 장-망막 축은6 안과 질환의 병태생리학적 과정에서 주목받고 있습니다. 하지만 DR의 발병 및 진행 과정에서 장-망막 축이 하는 역할의 구체적인 분자적 메커니즘은 여전히 불분명하며, 이는 이 축을 표적으로 하는 치료 전략의 개발 및 임상 적용을 저해하고 있습니다.
본 연구에서 우리는 DR에 대한 QMG의 효능과 잠재적 메커니즘을 체계적으로 평가하였습니다. 이러한 결과는 QMG가 망막의 조직병리학적 손상을 완화하고, 전신 염증을 억제하며, 장내 미생물 총의 항상성을 회복시키고, 결장과 망막 모두에서 주요 조절 단백질(CMKLR1 중심의 조절 네트워크)을 양방향으로 조절함으로써 QMG가 장-망막 축의 잠재적 조절제임을 입증하는 예비 근거를 제공합니다. 만성적인 저등급 전신 염증은 DM의 특징이며 망막 미세혈관 손상 및 DR 진행의 주요 원인입니다24. ELISA 결과, DR 모델 마우스에서 IL-1β, IL-6 및 TNF-α의 혈청 수치가 유의하게 상승하였으며(P < 0.0001), 이는 DR 상태에서 강력한 전신 염증 반응이 존재함을 확인시켜 줍니다. 이러한 사이토카인의 무분별한 방출은 혈액-망막 장벽을 파괴하고 RGC 세포사멸을 촉진하며 병리적 신생혈관 형성을 유도할 수 있습니다. QMG 투여 후, 이러한 사이토카인의 수치는 유의하게 감소하였고(P < 0.0001), 망막의 구조적 무결성이 회복되었으며, RGC 생존율이 증가하고 망막 두께가 유지되었습니다. 이러한 결과는 QMG의 망막 보호 효과가 강력한 전신 항염증 활성과 밀접하게 연관되어 있음을 나타냅니다. 특히, 이러한 전신 항염증 효과는 단독으로 발생하는 것이 아니라 QMG 매개 장내 미생물 총 조절 및 결장 내 주요 조절 단백질의 회복과 결합되어 나타나며, 이는 QMG가 “장-전신 염증-망막” 축을 통해 치료 효과를 발휘할 수 있음을 시사합니다.
QMG가 장-망막 축(gut–retina axis)을 통해 항-DR 효과를 나타내는 분자적 기전을 더욱 명확히 하기 위해, 결장 및 망막 조직 모두에서 CMKLR1 중심의 조절 네트워크(CMKLR1, Wnt5a, TP53, AP-1, PPAR-γ 포함)의 단백질 발현을 조사하였습니다. 결과적으로 DR 모델 유도 후, 결장과 망막 모두에서 5가지 단백질 모두가 일관되게 감소하는 경향을 보였으며, 이는 DR 조건 하에서 장과 망막 사이의 신호 전달이 전신적으로 차단되었을 가능성을 시사합니다. QMG 투여 후, 결장과 망막 모두에서 CMKLR1 의 발현이 유의하게 상향 조절되었으며(P < 0.05 및 P < 0.01), 이는 QMG가 CMKLR1의 전신적 활성화를 통해 장-망막 축을 따라 양방향 소통을 복원할 수 있음을 나타냅니다. 또한, QMG는 결장에서 AP-1과 Wnt5a의 발현을, 그리고 망막에서 TP53의 발현을 유의하게 복원시켰는데, 이는 서로 다른 단백질들이 해당 축을 따라 조직 특이적인 기능적 역할을 수행할 수 있음을 시사합니다. 즉, 결장에서는 AP-1과 Wnt5a가 QMG에 더 민감하게 반응하는 반면, 세포 사멸 조절자인 TP53은 망막 신경 보호에서 더 결정적인 역할을 합니다. 추가적인 상관관계 분석 결과, 결장의 AP-1, CMKLR1, PPAR-γ 및 Wnt5a 발현은 전신 염증성 사이토카인 수치(IL-1β, IL-6, TNF-α)와 유의하게 음의 상관관계를 보인 반면(P < 0.05 ~ P < 0.001), 혈청 사이토카인과 망막 단백질 발현 사이에는 직접적인 상관관계가 관찰되지 않았습니다. 이러한 차이는 중요한 기전적 함의를 갖습니다. QMG는 일차적으로 결장의 주요 조절 단백질 발현을 복원하여 장 미세환경에 작용함으로써 전신 염증을 억제할 수 있으며, 이와 대조적으로 망막 단백질의 회복은 전신 염증 인자에 의해 직접 매개되기보다는 장내 미생물 유래 대사물이 혈류로 전이되어 원격으로 망막 신호 전달 폭포(signaling cascades)를 조절하는 것과 같은 간접적인 경로를 통해 이루어질 수 있습니다. 이 발견은 “장-전신 염증-망막” 축 조절 모델을 뒷받침하며, 장-망막 축을 통한 QMG의 DR 치료 효과에 대한 핵심적인 기전적 근거를 제공합니다. 조사된 타겟 중 CMKLR1은 망막과 결장 조직 모두에서 유의미한 변화를 보여, 장-망막 축을 연결하는 잠재적인 일차 바이오마커로 나타났습니다. CMKLR1은 이전 연구들25,26,27,28,29,30에서 당지질 대사, DR 중증도 및 장내 미생물 조절과 관련이 있는 것으로 보고되었으며, 이는 장-망막 축을 따른 CMKLR1의 차등 발현이 여러 병리적 과정에 관여하고 있음을 반영하는 것일 수 있습니다. 이러한 결과는 CMKLR1을 DR 진단 및 치료적 개입을 위한 유망한 후보 바이오마커로 자리매김하게 하며, 이에 대한 추가적인 기전적 검증이 필요함을 시사합니다.
CMKLR1이 장-망막 축(gut–retina axis)의 중심 노드 역할을 하는 반면, QMG의 치료 효과는 Wnt5a, TP53, AP-1 및 PPAR-γ가 필수적인 시너지 지원을 제공하는 다차원적 조절 네트워크를 통해 달성됩니다. Wnt 신호 전달은 상피 무결성, 염증 조절 및 미생물 매개 점막 보호에서의 역할을 포함하여 장 상피 항상성과 결장 건강에 매우 중요합니다31,32,33,34. PPAR-γ는 염증 반응을 조절하며, DR에서 지질 활성 phagocytes를 억제하고 미세아교세포 조절을 통해 광수용체 생존을 촉진하는 것으로 나타났습니다35,36,37. AP-1은 deoxycholic acid와 같은 장내 미생물 대사물이 염증 및 면역 항상성에 영향을 미치는 전사 인자로 작용합니다38,39,40,41. TP53은 고혈당 조건 하에서 자가포식, 세포 사멸 및 망막 신경 손상에 관여합니다42,43,44,45. 종합적으로, 이러한 신호 노드들은 장내 미생물 동태를 망막 병증과 연결하는 상호 연결된 네트워크를 형성하며, 이는 우리가 QMG가 장-망막 축을 따라 이 네트워크를 조절하는지 조사하도록 유도했습니다.
전신 염증이 조절되는 핵심 메커니즘 중 하나는 장내 생태계에서 비롯됩니다. 16S rDNA 시퀀싱 분석 결과, 모델군에서는 당뇨로 인한 구조적로 불균형(dysbiosis)이 나타났으며, 이는 Firmicutes/Bacteroidetes 비율의 유의미한 불균형, 잠재적 병원성 분류군(예: Odoribacter 및 Clostridioides)의 증가, 그리고 유익한 분류군(예: Lactobacillus 및 Faecalibaculum)의 감소를 특징으로 합니다. 주목할 점은 QMG 치료가 다음과 같은 작용을 통해 이러한 병리적 변화를 되돌리는 미생물군 회복제로 작용했다는 것입니다: (i) 미생물 항상성 복구: 주요 과(family) 및 속(genus) (Faecalibaculum, Ruminococcus, Erysipelotrichaceae)의 비율을 대조군 수준으로 정상화함; (ii) 병원성 공생균(pathobionts)의 표적 조절: 당뇨와 관련된 Odoribacter splanchnicus 및 Clostridioides difficile의 과증식을 억제함; (iii) 유익한 군집 형성 촉진: Lachnoclostridium, Blautia, Flavonifractor plautii와 같은 항염증성 또는 대사물질 생성 분류군의 증식을 유도함. 또한, 다수준 다양성 분석 및 Spearman 상관관계 분석 결과, QMG 중재가 장-망막 축(gut–retina axis)을 따라 숙주-미생물 간의 보호적 상호작용에 유리한 방식으로 핵심 다수준 조성을 효과적으로 재균형화한다는 것이 나타났습니다. 이 결과는 장내 미생물군에 대한 QMG의 조절 효과를 확인시켜 줄 뿐만 아니라, QMG가 미생물군 리모델링을 주요 조절 단백질(예: IL-6, TP53)의 활성과 연계하여 전신 염증을 공동으로 억제함으로써 당뇨병성 망막병증을 완화하는 잠재적 치료 전략을 제시합니다.
최근 연구들 에 따르면 TCM은 미생물군-대사-면역 축에 대해 다중 표적 조절을 수행하며, 이는 단일 표적 의약품과 구별되는 특징입니다46. 축적된 증거들은 DR 및 관련 안과 질환에서 QMG의 치료 잠재력을 입증해 왔습니다. 다기관 무작위 대조 시험 결과, QMG는 DR 환자의 망막 동정맥 순환 시간을 유의미하게 단축시켜 망막 혈류 개선 및 저산소증 완화를 시사했습니다47. 메타 분석을 통해 QMG와 기존 치료의 병용 요법이 당뇨병성 황반부종에서 중심 황반 두께, 시력 및 전반적인 유효율을 유의미하게 개선하며48, 안구건조증 환자의 눈물막 파열 시간을 연장하고 눈물 분비량을 증가시킨다는 것이 추가로 확인되었습니다49. NPDR 관련 신경 손상 환자에서 QMG는 망막 신경섬유층 두께와 중심와 무혈관 구역 면적을 보존하는 데 있어 calcium dobesilate 대비 비열등성을 보였습니다50. 기전 연구 결과, QMG는 P2X7R/NLRP3 경로를 통한 Müller 세포의 파이롭토시스(pyroptosis) 및 면역 염증 억제51, PI3K/Akt 신호 경로 활성화를 통한 세포 사멸 감소, 그리고 밀착 연접 단백질 조절을 통한 혈액-망막 장벽의 무결성 유지 등 다각적인 경로를 통해 망막 손상을 보호하는 것으로 밝혀졌습니다52. 네트워크 약리학 분석에서는 QMG 내의 여러 생성 활성 화합물이 DR 관련 표적에 시너지 효과를 내는 것으로 확인되었으며16, 임상 연구에서는 심각한 이상 반응이 보고되지 않아 양호한 안전성 프로파일을 나타냈습니다50. QMG의 치료 효능은 quercetin, kaempferol, isorhamnetin, formononetin, β‑sitosterol을 포함한 활성 성분들의 시너지 작용에 기인하며, 이들은 IL‑6, TNF‑α, TP53, AP‑1을 표적으로 하여 종합적인 항염증, 항산화 및 항세포사멸 효과를 나타냅니다53,54,55,56,57,58,59. 본 연구는 QMG의 보호 효과가 장-망막 축의 조절, 특히 장내 미생물군 항상성 회복 및 CMKLR1 중심의 분자 네트워크 조절을 통해 전신 염증을 억제하고 망막 손상을 완화함으로써 매개된다는 것을 입증하여 이러한 지식을 확장하고자 합니다.
본 연구의 몇 가지 한계점을 유념해야 하며, 이는 향후 연구에서 추가적인 조사가 필요합니다. 첫째, 장내 미생물 변화와 망막 기능 개선 사이의 인과 관계에 대한 추가 검증이 필요합니다. QMG로 유도된 미생물 군집 재구성(microbiota remodeling)과 망막 보호 표현형 사이에 강한 상관관계가 관찰되었으나, 향후 연구에서 분변 미생물 이식, 무균 동물 모델 또는 항생제 유도 미생물 고갈과 같은 직접적인 인과 추론 실험을 통해 이 관계를 확인하는 것이 가치 있을 것입니다. 둘째, 미생물 조성을 분석하기 위해 16S rDNA 시퀀싱을 이용하였는데, 이는 속(genus) 수준 이상의 분류학적 해상도는 충분히 제공하지만, 균주 수준의 기능적 정보나 정밀한 대사 잠재력을 파악하는 능력에는 한계가 있습니다. 따라서 후속 연구에서는 metagenomic 시퀀싱이나 대사체 분석을 통해 QMG에 의해 조절되는 주요 미생물 기능 경로를 식별할 예정입니다. 셋째, 미생물 변화를 실험 종료 시점에만 평가하였기 때문에, QMG 개입 기간 동안의 미생물 군집 재구성의 시간적 진화를 동적으로 추적하지 못했습니다. 향후 연구에서 종단적 샘플링을 수행한다면 QMG 주도의 미생물 군집 재구성 역학과 그것이 망막 보호와 갖는 시간적 관계를 규명하는 데 도움이 될 것입니다. 넷째, 조직병리학적 분석을 통해 망막 박층화, RGC 소실 및 신생혈관 뭉치(neovascular tufts)를 관찰하였으나, 향후 연구에서는 다회 투여 STZ 주사 프로토콜과 유전적 당뇨 모델을 탐색하고 DR 표현형에 대한 보다 종합적인 특성 분석을 제공해야 합니다.
요약하자면, 본 연구는 QMG가 장-망막 축을 통해 CMKLR1 중심의 분자 네트워크를 전신 염증과 결합함으로써 당뇨망막병증(DR)을 개선한다는 것을 입증합니다. QMG의 작용 기전은 세 가지 수준에서 나타납니다. 미생물 수준에서 QMG는 당뇨로 유발된 장내 미생물 불균형을 역전시키며(예: Firmicutes/Bacteroidetes 비율 복구, Odoribacter 및 Clostridioides 억제, Faecalibaculum과 같은 유익균 촉진), 분자 수준에서 QMG는 CMKLR1/Wnt5a/PPAR-γ/AP-1/TP53 경로를 조절하고 전신 염증을 완화하며, 조직 수준에서 QMG는 망막 형태를 보호합니다. 이러한 결과는 QMG가 DR을 위한 유망한 장-망막 치료 전략임을 뒷받침하며, 당뇨 합병증 치료에 있어 전통 중의학(TCM) 적용의 기전적 근거를 제공합니다.
공개 사항
저자들은 본 논문에 보고된 연구에 영향을 미칠 수 있는 알려진 재정적 이해관계나 개인적 관계가 없음을 밝힙니다.
감사의 글
저자는 이 연구를 완수할 수 있도록 많은 지원과 도움을 준 모든 팀원들에게 감사를 표하고자 합니다 .
본 연구는 중국 국가 자연과학 재단(Grant Number: 82474580)과 청두 중의약대학교 병원의 병원 재단 자유 탐구 프로젝트(No. 23ZYTS1601)의 지원을 받았습니다.
재료
| 이름 | 회사 | 카탈로그 번호 | 댓글 |
|---|---|---|---|
| AP-1 단클론 항체 | Proteintech | 66313-1-IG | 1:5000 |
| CMKLR1 다클론 항체 | Affinity | AF5291 | 1:1000 |
| GAPDH 다클론 항체 | Affinity | AF7021 | 1:5000 |
| GoatAnti-Mouse IgG(H+L) HRP | MULTI SCIENCES | GAM0072 | 1:10000 |
| GoatAnti-Rabbit IgG(H+L) HRP | MULTI SCIENCES | GAR0072 | 1:10000 |
| GraphPad Prism | / | version 9.5 | |
| Image-Pro Plus | Media Cybernetics, Inc., Rockville, MD, USA | version 6.0 | |
| Luoning Bio-Cloud 플랫폼 | http://www.biomediv.cn/login.html | ||
| Mouse IL-1β(Interleukin 1 Beta) ELISA 키트 | Elabscience | E-EL-M0037 | 혈청 사이토카인 검출 |
| Mouse IL-6(Interleukin-6) ELISA 키트 | Elabscience | E-EL-M0044 | 혈청 사이토카인 검출 |
| Mouse TNF-α(Tumor Necrosis Factor Alpha) ELISA 키트 | Elabscience | E-EL-M3063 | 혈청 사이토카인 검출 |
| NanoFilt | / | version 2.7.1 | |
| Nanopore GridION 시퀀서 | Oxford Nanopore Technologies | https://store.nanoporetech.com/gridion.html | |
| Pannoramic SCAN II | 3DHISTECH Pannoramic SCAN scanner | https://www.3dhistech.com/scanners/pannoramic-scan-ii-digital-scanner/ | |
| PPAR gamma (PPAR-γ) 다클론 항체 | ImmunoWay | bs-0530R | 1:1000 |
| Python | / | version 3.7.4 | |
| Qiming Granule | Zhejiang Sansheng Mandi Pharmaceutical Co., Ltd. | Chinese National Drug Approval No. Z20090036 | 0.9 g/kg, 경구 투여 |
| R 프로그래밍 언어 | / | version 4.0.3 | |
| SILVA 데이터베이스 | / | version 138 | |
| Streptozotocin (STZ) | Sigma-Aldrich | S0130 | 35 mg/kg, i.p. |
| TP53 다클론 항체 | Abcam | ab131442 | 1:1000 |
| Usearch | / | version 10.0.240 | |
| Wnt5a 다클론 항체 | Proteintech | 55184-1-AP | 1:1000 |
| Zymo Research BIOMICS DNA Microprep 키트 | Zymo Research | D4301 | 분변 gDNA 추출 |
참고문헌
- Lei C, et al. Homocysteine and diabetic retinopathy. Exp Eye Res. 2026;262:110729.
- Owens DR, et al. IDF diabetes Atlas: A worldwide review of studies utilizing retinal photography to screen for diabetic retinopathy from 2017 to 2024 inclusive. Diabetes Res Clin Pract. 2025;226:112346.
- Zhu J, Huang J, Sun Y, Xu W, Qian H. Emerging role of extracellular vesicles in diabetic retinopathy. Theranostics. 2024;14(4):1631–1646.
- Xie L, Lin W. The role of gut microbiota dysbiosis in the inflammatory pathogenesis of diabetic retinopathy. Front Immunol. 2025;16:1604315.
- Niu J, Liu Y, Peng H, Chen J, Chen L. Early-stage diabetic retinopathy: gut-metabolic triggers, immune-neurodegeneration, and interventions. Graefes Arch Clin Exp Ophthalmol. 2025;263(10):2723–2736.
- Rowan S, et al. Involvement of a gut-retina axis in protection against dietary glycemia-induced age-related macular degeneration. Proc Natl Acad Sci U S A. 2017;114(22):E4472–E4481.
- Rzeczycki P, Pęciak O, Plust M, Droździk M. Gut Microbiota in the Regulation of Intestinal Drug Transporters: Molecular Mechanisms and Pharmacokinetic Implications. Int J Mol Sci. 2025;26(24):11897.
- Yang H, et al. Mediating role of aging and obesity in the relationship between dietary index for gut microbiota and metabolic syndrome and its potential regulatory mechanisms. Eur J Med Res. 2025;31(1):137.
- Zahavi EE, et al. Repeat-element RNAs integrate a neuronal growth circuit. Cell. 2025;188(16):4350–4365.e22.
- Dander E, et al. The chemerin/CMKLR1 axis regulates intestinal graft-versus-host disease. JCI Insight. 2023;8(5):e154440.
- Zhang J, et al. Therapeutic targets in the Wnt signaling pathway: Treating cancer with specificity. Biochem Pharmacol. 2025;236:116848.
- Liu M, Lim ST, Song W, Coffman TM, Wang X. Beyond lipids: fenofibrate in diabetic retinopathy and nephropathy. Trends Pharmacol Sci. 2026;47(3):325–341.
- Wu Y, et al. The active ingredient β-sitosterol in the anti-inflammatory agents alleviates perianal inflammation in rats by inhibiting the expression of Srebf2, activating the PPAR signaling pathway, and altering the composition of gut microbiota. Int Immunopharmacol. 2025;152:114470.
- Lin T, Chen C, Zhao LC, Zhu HY, Li W. The beneficial effects of Traditional Chinese Medicine on diabetic retinopathy: mechanisms, therapeutics, and prospects. Acupunct Herb Med 2026;6(2):188–204.
- Huo J, et al. Evaluation of individualized treatment of nonproliferative diabetic retinopathy: a multicenter, randomized, parallel-controlled study. J Tradit Chin Med. 2022;42(1):90–95.
- Huang Y, et al. Pharmacological mechanism and clinical study of Qiming granules in treating diabetic retinopathy based on network pharmacology and literature review. J Ethnopharmacol. 2023;302(Pt A):115861.
- Salma B, et al. Ameliorative Efficacy of the Cassia auriculata Root Against High-Fat-Diet + STZ-Induced Type-2 Diabetes in C57BL/6 Mice. ACS Omega. 2020;6(1):492–504.
- Srinivasan K, Viswanad B, Asrat L, Kaul CL, Ramarao P. Combination of high-fat diet-fed and low-dose streptozotocin-treated rat: a model for type 2 diabetes and pharmacological screening. Pharmacol Res. 2005;52(4):313–320.
- Liu Y, Deng J, Fan D. Ginsenoside Rk3 ameliorates high-fat-diet/streptozocin-induced type 2 diabetes mellitus in mice via the AMPK/Akt signaling pathway. Food Funct. 2019;10(5):2538–2551.
- Hu RY, et al. AFG Ameliorates Diabetic Retinopathy through AMPK-Dependent Autolysosomal Pathway: From Network Pharmacology to In Vivo and In Vitro Validation. J Agric Food Chem. 2026;74(2):2124–2139.
- Reagan-Shaw S, Nihal M, Ahmad N. Dose translation from animal to human studies revisited. FASEB J. 2008;22(3):659–661.
- Zou Q, et al. Oxidative stress in diabetic retinopathy. Clin Chim Acta. 2026;584:120871.
- Clements JN, Mesawich J, Twisdale C. Current and Emerging Pharmacologic Therapies for Diabetic Retinopathy. Pharmacotherapy. 2026;46(3):e70119.
- Rezvani Z, Khani F, Afarid M, Asadian F, Takhshid MA. Clinical values of systemic inflammatory indices in diabetic retinopathy. Clin Exp Optom. 2026;109(3):371–385.
- Zhu Z, et al. Targeting the CMKLR1-Mediated Signaling Rebalances Immunometabolism State in Middle-Age Testicular Macrophages. Adv Sci (Weinh). 2026;13(14):e15166.
- Lin Y, et al. Epithelial chemerin-CMKLR1 signaling restricts microbiota-driven colonic neutrophilia and tumorigenesis by up-regulating lactoperoxidase. Proc Natl Acad Sci U S A. 2022;119(29):e2205574119.
- Puthanmadhom Narayanan S, et al. Epigenetic Alterations Are Associated With Gastric Emptying Disturbances in Diabetes Mellitus. Clin Transl Gastroenterol. 2020;11(3):e00136.
- Wang L, et al. Chemerin/CMKLR1 Axis Promotes the Progression of Proliferative Diabetic Retinopathy. Int J Endocrinol. 2021;2021:4468625.
- Zheng C, et al. α-NETA down-regulates CMKLR1 mRNA expression in ileum and prevents body weight gains collaborating with ERK inhibitor PD98059 in turn to alleviate hepatic steatosis in HFD-induced obese mice but no impact on ileal mucosal integrity and steatohepatitis progression. BMC Endocr Disord. 2023;23(1):9.
- Dranse HJ, et al. The impact of chemerin or chemokine-like receptor 1 loss on the mouse gut microbiome. PeerJ. 2018;6:e5494.
- Flores-Hernández E, et al. Canonical and non-canonical Wnt signaling are simultaneously activated by Wnts in colon cancer cells. Cell Signal. 2020;72:109636.
- Qi Y, et al. Heat-inactivated Bifidobacterium adolescentis ameliorates colon senescence through Paneth-like-cell-mediated stem cell activation. Nat Commun. 2023;14(1):6121.
- Ou W, et al. Cooperation of Wnt/β-catenin and Dll1-mediated Notch pathway in Lgr5-positive intestinal stem cells regulates the mucosal injury and repair in DSS-induced colitis mice model. Gastroenterol Rep (Oxf). 2024;12:goae090.
- Dong Y, et al. Berberine ameliorates DSS-induced intestinal mucosal barrier dysfunction through microbiota-dependence and Wnt/β-catenin pathway. Int J Biol Sci. 2022;18(4):1381–1397.
- Escandon P, et al. The role of peroxisome proliferator-activated receptors in healthy and diseased eyes. Exp Eye Res. 2021;208:108617.
- Blot G, et al. Perilipin 2-positive mononuclear phagocytes accumulate in the diabetic retina and promote PPARγ-dependent vasodegeneration. J Clin Invest. 2023;133(19):e161348.
- Zhou W, et al. TREM2-dependent activation of microglial cell protects photoreceptor cell during retinal degeneration via PPARγ and CD36. Cell Death Dis. 2024;15(8):623.
- Bala Kumar S, et al. Gut microbial metabolites targeting JUN in renal cell carcinoma via IL-17 signaling pathway: network pharmacology approach. Mol Divers. 2026;30(1):613–632.
- Wang L, et al. Gut microbial bile acid metabolite skews macrophage polarization and contributes to high-fat diet-induced colonic inflammation. Gut Microbes. 2020;12(1):1–20.
- Hagan T, et al. Antibiotics-Driven Gut Microbiome Perturbation Alters Immunity to Vaccines in Humans. Cell. 2019;178(6):1313–1328.e13.
- Meng Y, et al. Jinlida ameliorates diabetic kidney disease via gut microbiota-dependent production of pyridoxamine targeting renal AGEs/RAGE and TGF-β pathways. Phytomedicine. 2026;150:157744.
- Zhou H, Zhang L, Ding C, Zhou Y, Li Y. Upregulation of HMOX1 associated with M2 macrophage infiltration and ferroptosis in proliferative diabetic retinopathy. Int Immunopharmacol. 2024;134:112231.
- Mohammad HMF, et al. Neuroprotective effect of levetiracetam in mouse diabetic retinopathy: Effect on glucose transporter-1 and GAP43 expression. Life Sci. 2019;232:116588.
- Peng H, et al. Autophagy and senescence of rat retinal precursor cells under high glucose. Front Endocrinol (Lausanne). 2023;13:1047642.
- Ding Y, Chen L, Xu J, Feng Y, Liu Q. APAF1 Silencing Ameliorates Diabetic Retinopathy by Suppressing Inflammation, Oxidative Stress, and Caspase-3/GSDME-Dependent Pyroptosis. Diabetes Metab Syndr Obes. 2024;17:1635–1649.
- Yang T, et al. Clinical study on the modulating effects of Jiaotaiwan on the modulating effects of microbiota–SCFAs–neurotransmitter/immune axis in patients with depression. Acupunct Herb Med 2025;5(4):456–468.
- Luo XX, et al. Effect of qiming granule on retinal blood circulation of diabetic retinopathy: a multicenter clinical trial. Chin J Integr Med. 2009;15(5):384–388.
- Hu Z, et al. Add-on effect of Qiming granule, a Chinese patent medicine, in treating diabetic macular edema: A systematic review and meta-analysis. Phytother Res. 2021;35(2):587–602.
- Yang M, et al. The Efficacy and Safety of Qiming Granule for Dry Eye Disease: A Systematic Review and Meta-Analysis. Front Pharmacol. 2020;11:580.
- Ma XF, et al. Efficacy and Safety of Qiming Granule for Nerve Injury Associated with Non-proliferative Diabetic Retinopathy: A Multicenter, Randomized, Non-inferiority, Active-Controlled Clinical Trial. Chin J Integr Med. 2026;32(3):195–203.
- Zhou Q, et al. Qiming granules regulate Müller cell pyroptosis and the P2X7R/NLRP3 immune inflammatory pathway in diabetic retinopathy. Chin Med. 2026;21(1):89.
- Zhou L, Qin T, Lv Y, Wu Z. Qiming Granules Ameliorate Diabetic Retinopathy by Regulating the PI3K/Akt Signaling Pathway. J Ocul Pharmacol Ther. 2026;42(3):202–212.
- Li HD, Li MX, Zhang WH, Zhang SW, Gong YB. Effectiveness and safety of traditional Chinese medicine for diabetic retinopathy: A systematic review and network meta-analysis of randomized clinical trials. World J Diabetes. 2023;14(9):1422–1449.
- Chen F, et al. Isorhamnetin promotes functional recovery in rats with spinal cord injury by abating oxidative stress and modulating M2 macrophages/microglia polarization. Eur J Pharmacol. 2021;895:173878.
- Naudhani M, Thakur K, Ni ZJ, Zhang JG, Wei ZJ. Formononetin reshapes the gut microbiota, prevents progression of obesity and improves host metabolism. Food Funct. 2021;12(24):12303–12324.
- Qu Y, et al. Kaempferol Alleviates Murine Experimental Colitis by Restoring Gut Microbiota and Inhibiting the LPS-TLR4-NF-κB Axis. Front Immunol. 2021;12:679897.
- Saikia L, et al. Therapeutic Potential of Quercetin in Diabetic Neuropathy and Retinopathy: Exploring Molecular Mechanisms. Curr Top Med Chem. 2024;24(27):2351–2361.
- Yao H, et al. Kaempferol Protects Blood Vessels From Damage Induced by Oxidative Stress and Inflammation in Association With the Nrf2/HO-1 Signaling Pathway. Front Pharmacol. 2020;11:1118.
- Zhang HX, Li YY, Liu ZJ, Wang JF. Quercetin effectively improves LPS-induced intestinal inflammation, pyroptosis, and disruption of the barrier function through the TLR4/NF-κB/NLRP3 signaling pathway in vivo and in vitro. Food Nutr Res. 2022;66:10.