This study examines the piRNA-annotated small RNA hsa_piR_016984 in relation to TGF-β1 mRNA stability and matrix staining in cultured human scleral fibroblasts exposed to cyclic stretch. The findings are limited to cellular responses under this defined loading regimen and do not establish mechanosensitivity as an intrinsic property of hsa_piR_016984.
연구 논문
piRNA-Annotated hsa_piR_016984 Regulates Extracellular Matrix Homeostasis in Human Scleral Fibroblasts by Modulating TGF-β1 mRNA Stability
* These authors contributed equally
이 논문에서
요약
초록
Scleral extracellular matrix (ECM) remodeling is a pathological feature of axial myopia. The relationship between small-RNA-associated regulation and cellular responses to mechanical loading remains incompletely understood. This study examines hsa_piR_016984-associated regulation in human scleral fibroblasts under a defined cyclic-stretch regimen. Text mining and bioinformatics identified myopia-associated hub genes. Fibroblasts underwent cyclic stretch (10% elongation, 1 Hz, 48 h) in vitro. Gene expression was evaluated by quantitative polymerase chain reaction (qPCR), and matrix-associated staining was assessed using toluidine blue. Sequencing dataset analysis and aqueous humor qPCR screened differentially expressed piRNA-annotated small RNAs. RNA pull-down, dual-luciferase reporter assays, and transcript time-course measurements examined their relationship with target messenger RNAs (mRNAs). Eight hub genes, including transforming growth factor beta 1 (TGF-β1) and various matrix metalloproteinases (MMPs), were identified via bioinformatic mining. In vitro, mechanical stretch reduced toluidine blue staining intensity, alongside increased MMP expression and decreased TGF-β1 expression, accompanied by a more pronounced decline in TGF-β1 qPCR signals relative to 0 h after actinomycin D addition. The piRNA-annotated small RNA hsa_piR_016984 was significantly downregulated in myopic aqueous humor. RNA pull-down showed TGFB1 mRNA co-enrichment with biotin-labeled hsa_piR_016984 relative to the negative-control probe. Separately, hsa_piR_016984 manipulation was associated with changes in TGFB1 qPCR signals over time and attenuation of the stretch-induced reduction in matrix staining intensity. Co-enrichment does not itself demonstrate direct RNA–RNA base pairing. Exogenous TGF-β1 increased hsa_piR_016984 expression, whereas BI-4659 decreased its expression under the tested in vitro conditions. These changes do not establish direct SMAD-mediated transcriptional regulation or a positive-feedback loop. Conclusions: The findings describe hsa_piR_016984-associated changes in TGF-β1 transcript signals and matrix staining in cultured human scleral fibroblasts under the tested conditions. They do not establish intrinsic mechanosensitivity or effects on myopia progression in vivo. The descriptive time courses, including post-washout measurements, do not establish mRNA half-life differences.
서론
Myopia is the most common refractive error globally, characterized by the anterior focus of light rays on the retina when the eye's refractive system is relaxed1,2. The rapidly increasing prevalence of myopia, together with its association with vision-threatening disorders including retinal detachment, macular degeneration, and glaucoma, has made the condition a major global public health concern. According to epidemiological projections by Holden et al.3, the global population with myopia will reach 4.758 billion (49.8% of the world's total population) by 2050, with an estimated 938 million individuals (9.8%) progressing to high myopia.
Currently, the primary clinical interventions for myopia rely on optical corrections, such as frame glasses, orthokeratology (Ortho-K), and refractive surgeries4,5. However, these modalities primarily address the refractive symptom rather than halting the underlying anatomical progression. Furthermore, Ortho-K carries risks of corneal infections and allergies, while refractive surgeries may introduce postoperative complications like dry eye syndrome. Although low-concentration atropine eye drops have demonstrated efficacy in decelerating myopia progression, their long-term use is often accompanied by adverse effects, including mydriasis and photophobia6. Consequently, identifying the precise molecular pathogenesis of myopia to develop targeted, fundamental interventions remains imperative.
The etiology of myopia is complex, involving intricate interactions between genetic predispositions and environmental factors7,8,9,10,11,12,13. While strong heritability is evident—demonstrated by significantly higher myopia prevalence in children with myopic parents14,15,16,17—the recent, unprecedented global surge in myopia points to the profound impact of environmental cues (e.g., intensive near work, limited outdoor activity, and retinal defocus)18,19. Regardless of the trigger, the fundamental structural hallmark of myopia, particularly axial myopia, is the pathological elongation of the sclera20. Structurally, the sclera contains relatively few resident fibroblasts embedded in an ECM dominated by collagens I, III, and IV. Mammalian ocular studies indicate that axial elongation is driven by accelerated scleral ECM remodeling, characterized by collagen disassembly, downregulation of glycosaminoglycans, and progressive scleral thinning, rather than mere accelerated tissue growth21.
During the continuous expansion of the myopic eye, the sclera is subjected to abnormal mechanical stretch, which drastically alters the microenvironment of scleral fibroblasts. As the primary effector cells, these fibroblasts respond to mechanical stimuli by modulating the synthesis and degradation of ECM components. Non-coding RNAs are candidates for investigating post-transcriptional regulation in this setting. Whether a piRNA-annotated small RNA such as hsa_piR_016984 is itself responsive to mechanical loading, and whether its manipulation alters fibroblast responses under stretch, are distinct questions that require different evidence.
Traditional approaches for discovering novel therapeutic targets are time-consuming. In recent years, data mining techniques applied to vast biomedical datasets have emerged as powerful tools for unveiling previously unknown molecular interactions and identifying core hub genes associated with specific pathologies22,23,24. Therefore, in the present study, the authors first utilized an integrative text-mining and bioinformatics strategy to identify core hub genes associated with myopia and scleral ECM remodeling. Subsequently, they exposed cultured human scleral fibroblasts to a defined cyclic-stretch regimen (10% elongation, 1 Hz, 48 h) and examined gene-expression and matrix-staining responses. The researchers also investigated hsa_piR_016984-associated changes in TGF-β1 mRNA abundance and matrix staining. This design examines cellular responses under a specified loading condition; it does not establish that hsa_piR_016984 is intrinsically mechanosensitive or that the loading regimen reproduces myopic scleral expansion in vivo.
프로토콜
This study combined secondary analysis of publicly available data with experimental validation using human aqueous humor samples. The human aqueous humor study was approved by the Ethics Committee of Taizhou Hospital (approval no. K20231207). Written informed consent was obtained from all participants prior to enrollment and sample collection. The human study was conducted in accordance with the Declaration of Helsinki. The public-data component comprised literature/database mining and reanalysis of the GEO dataset GSE142359; it was distinct from the human aqueous humor validation study.
Human aqueous humor participants and clinical characteristics
Human aqueous humor samples used for qPCR validation were obtained from 15 myopic participants and 15 non-myopic control participants (n = 15 per group; one eye per participant, yielding 15 independent samples per group). The myopic group was defined by a spherical equivalent (SE) of ≤ −0.50 D, consistent with the refractive threshold proposed by the International Myopia Institute (IMI), together with an axial length (AL) of > 24.0 mm as an additional study-specific inclusion criterion. Non-myopic control status was defined as an SE between −0.50 D and +0.50 D with an AL of ≤ 24.0 mm. Inclusion criteria were age ≥ 18 years and scheduled phacoemulsification for age-related cataract; exclusion criteria were any other ocular disease (including glaucoma, uveitis, keratopathy, retinal detachment, or diabetic retinopathy), previous intraocular surgery or ocular trauma, systemic diseases with ocular involvement (e.g., diabetes mellitus), and recent use of topical or systemic medications known to affect the eye. Aqueous humor samples in both groups were obtained at the beginning of phacoemulsification cataract surgery, before any intraocular manipulation or irrigation.
There were no significant differences between the myopic and control groups in age or sex distribution (both p > 0.05), whereas spherical equivalent and axial length differed significantly between the two groups by study design (both p < 0.05). Refraction was assessed by manifest refraction with an autorefractometer, and axial length was measured by partial coherence interferometry (IOLMaster), both performed within one week before surgery.
Aqueous humor collection and processing
Aqueous humor was collected at the start of surgery through a clear corneal paracentesis using a 1-mL tuberculin syringe with a 30-gauge needle, before any irrigation or intraocular procedure, with 100 µL obtained per sampled eye. Samples were immediately transferred to sterile RNase-free cryotubes, snap-frozen, and stored at −80 °C until RNA extraction. All samples were analyzed individually without pooling. All reagents, equipment, software, datasets, and resources used in this protocol are listed in Table_of_Materials, provided as a protocol-related supplementary file. Figure 1 summarizes the overall experimental workflow. Analyses presented in Figure 1, Figure 2, Figure 3 and Figure 4 used the software interfaces described below and did not involve custom scripts.
Text mining for scleral ECM remodeling in myopia
Text mining was performed with pubmed2ensembl (http://pubmed2ensembl.ls.manchester.ac.uk/), an open-access resource linking approximately 150,000 Ensembl genes from 50 species to more than two million PubMed records. Gene lists were generated by querying 100,000 relevant document identifiers with the terms "Myopia," "Sclera," and "ECM remodeling." The search was restricted to the Homo sapiens (GRCh37) dataset and filtered with the option "filter on MEDLINE: PubMed ID." After duplicate removal, genes shared among the three query-derived lists were retained and designated as text-mining genes (TMGs). This screening identified genes associated with the queried biological topics; it did not select genes on the basis of a demonstrated response to mechanical loading or establish mechanosensitivity.
Biological process and pathway enrichment analysis of TMGs
An enrichment analysis of TMGs related to scleral ECM remodeling in myopia was performed using GeneCodis (http://genecodis.cnb.csic.es/), which is an online software tool that reveals the biological functions associated with large lists of genes through functional annotation25. The 77 genes identified by text mining were submitted for Gene Ontology (GO) biological process annotation. Biological process terms were screened using the unadjusted p-value column (pval). A separate 66-gene input list was used for Kyoto Encyclopedia of Genes and Genomes (KEGG) pathway enrichment. The original screening criterion was unadjusted p < 1.00 × 10⁻⁷ for both GO and KEGG. The corresponding GeneCodis-adjusted p-values (pval_adj) are reported separately; the screening cutoff must not be interpreted as an adjusted p-value threshold. A separate 41-gene input list was used for subsequent protein-protein interaction analysis.
Protein-protein interaction (PPI) network analysis
A protein-protein interaction network was generated for the selected genes using STRING (https://string-db.org/cgi/input.pl), a database containing more than 24.6 million proteins and 3.1 billion interactions across 5,090 species26. Only interactions meeting the highest-confidence threshold (score, 0.900) were retained, and isolated nodes were omitted. Network genes were ranked separately using the maximal clique centrality (MCC), maximum neighborhood component (MNC), and Degree algorithms in cytoHubba. The top 10 genes from each ranking were selected, and their intersection defined the eight hub genes.
Gene Ontology and Pathway Enrichment Analysis of module genes
The GO enrichment and KEGG pathway analyses of the module genes identified by Molecular Complex Detection (MCODE) were performed using the Database for Annotation, Visualization and Integrated Discovery (DAVID) Functional Annotation Bioinformatics Microarray Analysis database (https://david.ncifcrf.gov/)26. The module and hub-gene enrichment outputs were reviewed using the original DAVID PValue and FDR columns. PValue denotes the unadjusted p-value; FDR denotes the false discovery rate reported by DAVID. In the revised interpretation, only terms with reported FDR < 0.05 are described as significant after correction. Terms with unadjusted p < 0.05 but FDR ≥ 0.05 are retained as nominal, exploratory associations. Bonferroni and Benjamini values are separate adjustment columns and are not substituted for the FDR column. This review uses the existing exported values and does not recalculate adjustments from the filtered term lists. The GO database includes three functional categories: biological processes (BP), cellular component (CC), and molecular function (MF)27. The KEGG database is a knowledge base for systematic analysis of gene function and genomic information28.
Mechanical stretch stimulation
Commercially sourced primary human scleral fibroblasts were used (see Table of Materials for product and supplier details). According to the supplier, the cells were isolated from human sclera by collagenase digestion followed by differential adhesion, and each vial contained approximately 5 × 10⁵ cells. The cells were identified by Vimentin immunofluorescence, showing a purity of over 90%, and were verified to be free of human immunodeficiency virus type 1 (HIV-1), hepatitis B virus (HBV), hepatitis C virus (HCV), mycoplasma, bacteria, yeast, fungi and other contaminants. Before experimentation, the cells were maintained in human scleral fibroblast complete medium according to the supplier's protocol; medium was replaced every 2-3 days, and cultures were passaged at a 1:2 ratio. Fibroblasts at passages 3-7 (P3-P7) were seeded onto type I collagen-coated flexible-bottom culture plates at a density of 1 × 10⁵ cells per well in 2 mL of complete medium per well. Cells were allowed to acclimate for 24 h before mechanical stretching, which was initiated at approximately 80% confluence. Cyclic mechanical stretching was applied for 48 h using a cell-stretching system with a 1-Hz sinusoidal waveform producing 10% elongation. Matched static control cultures were maintained under the same culture conditions for 48 h without mechanical stretching. This single regimen defined the in vitro loading condition; stretch-amplitude, frequency, and duration dependence were not evaluated.
Exogenous TGF-β1 treatment
When human scleral fibroblasts reached approximately 70% confluence, the culture medium was replaced with serum-free medium, and the cells were serum-starved for 12 h for synchronization. Recombinant human TGF-β1 was reconstituted in phosphate-buffered saline (PBS) and diluted in culture medium to a final concentration of 20 ng/mL. TGF-β1 was added at the onset of mechanical stretching and remained present throughout the 48-h stretching period. Matched vehicle-control cells underwent the same serum-starvation and mechanical-stretching procedures and received an equivalent volume of PBS in culture medium without TGF-β1. Product and supplier details are provided in the Table of Materials.
TGF-β1 knockdown by siRNA transfection
Human scleral fibroblasts were seeded at 1 × 10⁵ cells per well on day 0 and cultured overnight to reach 60–80% confluence. On day 1, cells were transfected with TGF-β1-targeting siRNA (iTGFβ1) or negative-control siRNA (siNC). The iTGFβ1 sequences were 5′-TGGTGGAAACCCACAACGATT-3′ (sense) and 5′-TCGTTGTGGGTTTCCACCATT-3′ (antisense). The siNC sequences were 5′-AAGTCCGATACACGCAGGATT-3′ (sense) and 5′-TCCTGCGTGTATCGGACTTTT-3′ (antisense). For each well, 25 pmol of siRNA was diluted in reduced-serum medium to a total volume of 50 µL. Separately, 1.5 µL of a lipid-based transfection reagent was diluted in the same medium to a total volume of 50 µL. Both solutions were incubated separately for 5 min, combined, and incubated at room temperature for 20 min to allow complex formation. The resulting 100-µL mixture was added dropwise to cells in 400 µL of culture medium, yielding a final volume of 500 µL and a final siRNA concentration of 50 nM. Negative-control cells received siNC under identical transfection conditions. On day 4, approximately 72 h after transfection, total RNA was extracted, and TGFB1 mRNA expression was measured by qPCR to assess knockdown efficiency relative to the siNC group. Product and supplier details for the transfection reagent, reduced-serum medium, and siRNAs are provided in the Table of Materials.
BI-4659 treatment
Human scleral fibroblasts were seeded at 1 × 10⁵ cells per well and cultured overnight until they reached 70–80% confluence. BI-4659 was dissolved in dimethyl sulfoxide (DMSO) to prepare a 10 mM stock solution. Cells were pretreated with 1 µM BI-4659 for 1 h before the addition of 20 ng/mL TGF-β1 and the initiation of mechanical stretching. BI-4659 was maintained in the culture medium throughout the subsequent 48-h TGF-β1 stimulation and mechanical stretching period, resulting in a total inhibitor exposure of 49 h. Corresponding vehicle-control cells received an equivalent concentration of DMSO and underwent identical pretreatment, TGF-β1 stimulation, and mechanical stretching procedures. The final DMSO concentration did not exceed 0.1% (v/v).
Quantitative polymerase chain reaction (qPCR)
RNA was isolated from scleral fibroblasts with a phenol/guanidinium-based RNA extraction reagent following the supplier's protocol. One microgram of total RNA was converted to complementary DNA (cDNA) with a 4× reverse-transcription mix with genomic DNA removal. Messenger RNA abundance was then measured with a 2× fluorescent DNA-binding dye-based qPCR master mix containing a passive reference dye on a real-time PCR system according to the manufacturer's instructions. Thermal cycling consisted of an initial 5-min step at 95 °C, followed by 40 cycles of 95 °C for 10 s and 60 °C for 30 s. Glyceraldehyde-3-phosphate dehydrogenase (GAPDH) was used as the internal reference, and the relative expression levels were calculated using the 2^(-ΔΔCt) method.
Toluidine blue staining
Cells were fixed in 4% paraformaldehyde and rinsed three times with phosphate-buffered saline (PBS). They were then incubated in 0.1% toluidine blue for 10 min. After removal of the stain, the cells underwent three 5-min PBS washes. The stained cultures were subsequently scanned for documentation. Toluidine blue staining was used to assess matrix-associated staining intensity, reflecting acidic components such as sulfated glycosaminoglycans (sGAGs). It was not used as a quantitative assay of total ECM or collagen synthesis.
piRNA expression analysis
Public small RNA-sequencing data were obtained from the Gene Expression Omnibus (GEO; accession GSE142359). Adapter sequences and low-quality reads were removed from the raw data to generate clean reads. Adapter trimming was performed using Cutadapt, and low-quality reads were filtered using Trimmomatic. Data quality was evaluated using FastQC. Reads longer than 15 nucleotides were retained for downstream analysis. Bowtie was used to map the clean reads to the human piRNA database and the reference genome. Differentially expressed piRNAs were identified in R with the edgeR package. A reconstructed R visualization script for the expression and differential-expression result tables underlying Figure 6B–C is provided as Supplementary File 1. The script reads the selected-piRNA expression table and the full differential-expression result table. It generates a heatmap using log2(x + 1) transformation, row-wise z-score standardization, Euclidean distance and complete-linkage clustering of piRNAs, with a fixed sample order. The volcano plot uses the supplied log2 fold changes and q-values, with thresholds of q < 0.05 and |log2 fold change| > 1. This script documents a reproducible visualization workflow from the exported results; it does not rerun edgeR or establish the historical heatmap settings.
Sequence identity and annotation provenance of hsa_piR_016984. The reference sequence is GenBank/ENA accession DQ593431.1, annotated as Homo sapiens piRNA piR-33543, complete sequence. The record was submitted on 12 May 2006 and first released on 13 June 2006, and cites the original report by Girard et al.35 The 32-nt sequence is 5′-CGTGCTGGGCCCATAACCCAGAGGTCGATGGA-3′ in the database DNA alphabet, corresponding to 5′-CGUGCUGGGCCCAUAACCCAGAGGUCGAUGGA-3′ in RNA notation. Sequence-derived characteristics include a GC content of 62.5% (20/32 nt), a 5′ cytidine and cytidine at position 10. In piRNAdb version 1.8.0, the sequence is recorded as hsa-piR-23519, with sequence-matched aliases DQ593431.1, hsa_piRNA_28528, hsa_piR_016984, piR-33543, piR-hsa-23679 and URS000031CF48.36 Accession version DQ593431.1, rather than similarity between numerical identifiers across databases, was used to specify sequence identity. Database records were accessed on 23 September 2026.
Genomic mapping and alternative RNA origins. piRNAdb reports nine hg38/GRCh38 alignment intervals (1-based, inclusive): chr1:153671271–153671302 (+); chr6:26286547–26286578 (+), 26313143–26313174 (−), 26330320–26330351 (−), 27333004–27333035 (−), 27592840–27592871 (−), 27777906–27777937 (+) and 27902512–27902543 (−); and chr17:82494740–82494771 (−). Each database-listed interval was checked against the UCSC hg38 reference sequence, reverse-complementing negative-strand intervals; all nine matched the complete 32-nt sequence exactly. This check verifies the listed matches but is not an exhaustive de novo genome-wide alignment. piRNAdb labels all nine intervals as overlapping tRNA-Met-i features. These annotations indicate sequence overlap with initiator methionine tRNA-related loci and preclude assigning a unique genomic source from the small-RNA sequence alone. They do not identify the expressed precursor or establish tRNA-fragment biogenesis in scleral fibroblasts. Accordingly, a unique intergenic origin and exclusion of tRNA or other noncoding-RNA sources are not claimed.
For experimental validation, total RNA was isolated from human scleral fibroblasts with the RNA extraction reagent listed in the Table of Materials. A 1 µg aliquot of total RNA was reverse-transcribed with a microRNA reverse-transcription kit. The reverse-transcription primer sequence was 5′-GCGAGCACAGAATTAATACGACTCACTATAGG-3′. The hsa_piR_016984-specific qPCR forward primer was 5′-CCATAACCCAGAGGTCGATGGA-3′. MicroRNA qPCR was carried out on a real-time PCR system using a probe-based qPCR master mix containing a passive reference dye. The program comprised 5 min at 95 °C and 40 cycles of 95 °C for 10 s followed by annealing/extension at 60 °C for 30 s. The annealing temperature of 60 °C was experimentally verified. Expression was normalized to U6 and quantified by the 2^(-ΔΔCt) method.
Actinomycin D treatment and TGF-β1 mRNA time-course analysis
Mechanical stretching and transfection with the hsa_piR_016984 mimic or inhibitor, as applicable to the experimental group, were initiated 12 h before actinomycin D addition. Actinomycin D was added at a final concentration of 5 µg/mL, and its addition defined 0 h. Cells were exposed to actinomycin D for 6 h, after which the drug was washed out. Samples were collected at 0, 2, 4, 6, 8, 10 and 12 h relative to drug addition; the 8–12 h samples were therefore collected after washout. Equal amounts of total RNA were used as input for the assay. TGF-β1 was measured by RT-qPCR. Technical-triplicate Ct values were averaged at each time point, and relative signals were calculated as 2^(-[Ct(t) - Ct(0)]) within each replicate and experimental group, with the 0 h value set to 1. This calculation assumes 100% amplification efficiency. Corresponding GAPDH Ct values were unavailable, and no GAPDH normalization was performed. Three independent biological replicates were included per group, and relative signals are presented as mean ± SD. The time courses were evaluated descriptively; only scaling to the corresponding 0 h Ct value was performed, without fitting an exponential decay model or estimating mRNA half-lives. No formal statistical comparisons between the time courses and no cell-viability assessment during actinomycin D exposure were performed.
RNA pull-down assay
The reference sense RNA sequence for hsa_piR_016984 (DQ593431.1) is 5′-CGUGCUGGGCCCAUAACCCAGAGGUCGAUGGA-3′ (32 nt). Biotin-labeled hsa_piR_016984 probes (Bio-hsa_piR_016984) and biotin-labeled negative control probes (Bio-NC) were synthesized. Scleral fibroblasts were harvested and fully lysed in an ice-cold RNA pull-down lysis buffer supplemented with an RNase inhibitor and protease inhibitors. The lysates were centrifuged at 12,000 × g for 15 min at 4 °C. The supernatants were incubated for 2 h at 4 °C with 50 nM Bio-hsa_piR_016984 or Bio-NC probe. Next, 50 µL of prewashed streptavidin-coated magnetic beads were introduced, and the mixtures were rotated gently for 1 h at 4 °C to recover biotinylated RNA complexes. The beads were collected magnetically and subjected to three washes with wash buffer. Finally, the co-precipitated RNAs bound to the beads were extracted using the RNA extraction reagent listed in the Table of Materials, and the relative enrichment level of TGF-β1 mRNA was evaluated via qPCR. This assay measures TGFB1 mRNA co-enrichment with the biotin-labeled RNA bait relative to the negative-control probe; it does not independently establish direct base pairing between the two RNAs.
Dual-luciferase reporter assay
Bioinformatic prediction identified a putative hsa_piR_016984-binding region in TGF-β1 mRNA. Sequences containing either the wild-type (WT) site or its mutated counterpart (MUT) were synthesized and inserted into a dual-luciferase reporter vector to generate the TGF-β1-WT and TGF-β1-MUT reporters. Bioinformatic prediction identified a putative hsa_piR_016984-binding region in TGFB1 mRNA (RefSeq accession NM_000660.7). The wild-type (WT) insert comprised the 31-nt region 5′-CATGGCCACCCCGCTGGAGAGGGCCCAGCAT-3′ and 50 bp of native sequence on each side, yielding a 131-bp fragment. In the mutant (MUT), only the 19 positions marked by vertical pairing bars in the predicted alignment were substituted: positions 1, 2, 3, 6, 8, 9, 10, 12, 16, and 21–30 within the 31-nt region, numbered from its first C. Substitutions followed C>G, G>C, A>T, and T>A, yielding the mutant region 5′-GTAGGGCTGGCGGCTCGAGACCCGGGTCGTT-3′. All remaining bases, including positions 19 and 31 marked by colons in the alignment, and both 50-bp flanks were unchanged. The WT and MUT fragments were synthesized and inserted into the multiple cloning site (MCS) downstream of the luc2 firefly luciferase stop codon in the pmirGLO dual-luciferase reporter vector, placing each insert within the 3′ untranslated region (3′ UTR) of the reporter transcript. Both inserts were cloned in the TGFB1 sense (5′>3′) orientation, aligned with the direction of luc2 transcription, with the 5′ end proximal to luc2 and the 3′ end distal to luc2, to generate the TGF-β1-WT and TGF-β1-MUT reporters. The complete insert sequences are listed below as DNA in the TGFB1 reference 5′>3′ orientation; added cloning adapters or restriction-site sequences are not included.
WT (131 bp; 5′>3′):
GAGGTGACCTGGCCACCATTCATGGCATGAACCGGCCTTT
CCTGCTTCTCATGGCCACCCCGCTGGAGAGGGCCCAGCATCTGCAA
AGCTCCCGGCACCGCCGAGCCCTGGACACCAACTATTGCTTCAG
MUT (131 bp; 5′>3′):
CGAGGTGACCTGGCCACCATTCATGGCATGAACCGGCCTTTCCT
GCTTCTGTAGGGCTGGCGGCTCGAGACCCGGGTCGTTCTGCAAAG
CTCCCGGCACCGCCGAGCCCTGGACACCAACTATTGCTTCAG
Scleral fibroblasts were plated in 96-well plates and allowed to reach 70-80% confluence. Using a lipid-based transfection reagent according to the manufacturer's protocol, cells were co-transfected with a TGF-β1-WT or TGF-β1-MUT reporter and either hsa_piR_016984 mimic or negative-control mimic (NC mimic). Forty-eight hours later, cell lysates were prepared and analyzed with a dual-luciferase reporter assay kit. Firefly luciferase signals were normalized to the corresponding Renilla luciferase internal control.
Statistical analysis
Statistical calculations and data visualization were conducted in R (version 4.5.3). Each in vitro experiment included three independent biological replicates, and quantitative results are reported as mean ± standard deviation (SD). Two independent groups were compared using a two-tailed unpaired Student's t-test. Multiple treatment groups in Figures 5C–D, Figure 6F, and Figure 7G were analyzed by one-way analysis of variance (ANOVA), followed by Dunnett's multiple-comparison test against the corresponding common control. In Fig. 5C–D, each gene was analyzed separately, with Control+Vehicle as the reference group. The reference groups were mimic NC in Figure 6F and Control+Vehicle in Figure 7G. Dunnett adjustment was applied to the treatment-versus-control comparisons within each analysis; it did not constitute adjustment across different genes or panels. These analyses compared treatment combinations with the common control and did not test factorial interactions. Statistical significance was defined as p < 0.05 for two-group tests and Dunnett-adjusted p < 0.05 for these multiple-comparison analyses. The actinomycin D time courses in Figures 6A and 6G–H were descriptive; no between-curve statistical tests were performed.
결과
Text-mining genes (TMGs) for Scleral ECM remodeling in myopia
Application of the text-mining workflow outlined in Figure 1 identified 374 genes linked to myopia (Supplementary Table 1), 839 linked to ECM remodeling (Supplementary Table 2), and 311 linked to the sclera (Supplementary Table 3). A total of 77 TMGs were associated with myopia-related scleral ECM remodeling (Supplementary Table 4).
Enrichment analysis
GeneCodis was used to perform GO biological process (BP) annotation and KEGG pathway enrichment and thereby identify terms related to myopic scleral remodeling. A screening cutoff of unadjusted p < 1.00 × 10⁻⁷ was used for both biological process and pathway enrichment analyses. Analysis of the 77 input TMGs identified 32 enriched GO biological process terms. The leading GO-BP terms were response to hypoxia (adjusted p = 1.78E-10), response to xenobiotic stimulus (adjusted p = 1.55E-09), negative regulation of gene expression (adjusted p = 1.55E-09), positive regulation of cell division (adjusted p = 7.19E-09), and aging (adjusted p = 7.19E-09); these terms contained 13, 14, 15, 8, and 11 query genes, respectively (Table 1).
KEGG analysis used a separate input list of 66 genes and identified 11 enriched pathways (Table 2). Enriched KEGG terms included proteoglycans in cancer (adjusted p = 5.10E-12), the AGE-RAGE signaling pathway in diabetic complications (adjusted p = 1.25E-11), the relaxin signaling pathway (adjusted p = 2.37E-10), pathways in cancer (adjusted p = 1.14E-08), rheumatoid arthritis (adjusted p = 2.38E-08), Chagas disease (adjusted p = 5.61E-08), bladder cancer (adjusted p = 3.27E-07), fluid shear stress and atherosclerosis (adjusted p = 9.49E-07), malaria (adjusted p = 1.07E-06), the hypoxia-inducible factor 1 (HIF-1) signaling pathway (adjusted p = 1.17E-06), and diabetic cardiomyopathy (adjusted p = 1.28E-06).
PPI network construction and analysis of modules
STRING analysis was next used to construct a high-confidence (score > 0.900) PPI network for the 41 input genes; the resulting sparse network comprised 34 nodes and 54 edges (Figure 2). The network was visualized in Cytoscape, and MCODE identified four key modules containing 14 genes in total (Figure 3).
Module 1 contained five genes connected by seven edges. At the BP level, it was chiefly associated with regulation of vascular endothelial cell migration, vascular smooth muscle cell proliferation, and smooth muscle cell proliferation. Its principal cellular component (CC) terms were extracellular space, extracellular region, cell surface, Golgi lumen, and extracellular matrix. For molecular function (MF), module 1 genes were mainly associated with identical protein binding, cytokine activity, and growth factor activity (Supplementary Table 5). At the BP level, module 2 was primarily associated with cellular responses to ultraviolet A (UV-A), collagen catabolism, ECM disassembly, regulation of protein-containing complex assembly, and ECM organization (Supplementary Table 6). Module 3 was chiefly related to regulation of phosphatidylinositol 3-kinase/protein kinase B signaling, DNA binding, mitotic nuclear division, peptidyl-tyrosine phosphorylation, the mitogen-activated protein kinase (MAPK) cascade, and cell migration (Supplementary Table 7). Genes in module 4 were mainly associated with regulation of guanylate cyclase activity, arginine catabolism, nitric oxide-mediated signaling and biosynthesis, blood-pressure regulation, responses to hormones, lipopolysaccharide, heat, and hypoxia, vasodilation, and regulation of potassium, calcium, and sodium ion transport (Supplementary Table 8). These summaries include nominal associations and should not be read as uniformly significant after correction. Of the retained GO terms in Supplementary Tables 5–8, respectively, 15/53, 13/14, 4/10 and 25/27 had reported FDR < 0.05; the remaining terms are exploratory.
Module-1 KEGG results included nominal associations with MAPK (unadjusted p = 0.00658, FDR = 0.13428), IL-17 (p = 0.04231, FDR = 0.29578), AGE-RAGE (p = 0.04493, FDR = 0.29578), and TGF-beta signaling (p = 0.04799, FDR = 0.29578); none met FDR < 0.05. Only proteoglycans in cancer and malaria met this threshold among the 17 retained module-1 KEGG terms (Supplementary Table 9). None of the three module-2 terms met FDR < 0.05; IL-17 signaling had unadjusted p = 0.02138 and FDR = 0.12827 (Supplementary Table 10). None of the 10 module-3 terms met FDR < 0.05, including HIF-1, FoxO and Rap1 signaling (FDR = 0.20852 for each; Supplementary Table 11). In module 4, arginine biosynthesis, arginine and proline metabolism, relaxin, apelin and calcium signaling met FDR < 0.05, whereas HIF-1 signaling (unadjusted p = 0.02451, FDR = 0.14297) and metabolic pathways did not (Supplementary Table 12). Terms failing the FDR threshold are reported only as exploratory associations.
Core Candidate Genes Identification
Network genes were ranked in cytoHubba using the maximal clique centrality (MCC), maximum neighborhood component (MNC), and Degree algorithms. Eight hub genes, matrix metalloproteinase 9 (MMP9), TGF-β1, decorin (DCN), matrix metalloproteinase 2 (MMP2), fibroblast growth factor 2 (FGF2), epidermal growth factor (EGF), matrix metalloproteinase 1 (MMP1), tissue inhibitor of metalloproteinases 1 (TIMP1), were identified by the overlap of the top 10 genes according to three ranked methods (Figure 4). At the BP level, these hub genes were chiefly associated with cellular responses to UV-A, regulation of phosphatidylinositol 3-kinase/protein kinase B signaling, collagen catabolism, ECM disassembly, regulation of vascular smooth muscle cell and cell-population proliferation, canonical Wnt signaling and its regulation, regulation of cerebellar granule-cell precursor proliferation, and ECM organization (Supplementary Table 13). Of the 61 retained hub-gene GO terms, 24 met reported FDR < 0.05; the remainder were nominal associations (Supplementary Table 13). Four of the seven retained hub-gene KEGG terms met FDR < 0.05: bladder cancer, proteoglycans in cancer, pathways in cancer and relaxin signaling. Relaxin signaling had unadjusted p = 0.000104 and FDR = 0.00190, whereas MAPK signaling had unadjusted p = 0.02153 and FDR = 0.22454 and was therefore only a nominal association (Supplementary Table 14).
Matrix staining and gene-expression responses under the tested cyclic-stretch regimen
To examine the selected hub genes under the defined in vitro loading condition, cultured human scleral fibroblasts were exposed to cyclic stretch (10% elongation, 1 Hz, 48 h) and compared with matched static controls. qPCR showed increased MMP9, MMP2, FGF2, EGF, and MMP1 transcript levels (Figure 5A), together with reduced TGF-β1, DCN, and TIMP1 expression (Figure 5B). TGF-β1 is a pivotal signaling molecule determining the balance between collagen synthesis and matrix degradation in the sclera. Following supplementation with exogenous TGF-β1, the stretch-induced upregulation of MMP9, MMP2, FGF2, EGF, and MMP1 mRNA was abolished. Furthermore, TGF-β1 alone significantly inhibited the expression of these mRNAs in scleral fibroblasts (Figure 5C). Conversely, the addition of exogenous TGF-β1 reversed the stretch-induced suppression of TGF-β1, DCN, and TIMP1 mRNA expression. Concurrently, TGF-β1 intervention significantly promoted the mRNA expression of TGF-β1, DCN, and TIMP1 in scleral fibroblasts (Figure 5D). Representative toluidine blue images showed lower matrix-associated staining intensity following mechanical stretch, whereas exogenous TGF-β1 attenuated this reduction (Figure 5E). These observations concern staining intensity and do not directly quantify total ECM or collagen synthesis.
Scleral fibroblast-derived piRNA-annotated small RNA hsa_piR_016984 is associated with changes in TGF-β1 mRNA time courses
TGF-β1 mRNA time courses were examined in mechanically stretched and static cultures to describe changes in RT-qPCR signals relative to 0 h after actinomycin D addition. Following actinomycin D addition, TGF-β1 RT-qPCR signals relative to 0 h showed a more pronounced decline in stretched cells than in static controls (Figure 6A). This observation was descriptive, without a formal between-curve statistical comparison. Non-coding RNAs (ncRNAs) represent one of the core mechanisms regulating mRNA stability. PIWI-interacting RNAs (piRNAs), a class of small non-coding RNAs, are increasingly implicated in post-transcriptional regulation in somatic cells. Comparison of aqueous-humor piRNA profiles showed that non-myopic samples had 18 downregulated and 13 upregulated piRNAs relative to myopic samples (Figures 6B–C). These candidates were subsequently examined by qPCR. The results demonstrated that 7 piRNAs were significantly upregulated and 8 piRNAs were significantly downregulated in the aqueous humor of myopic patients. Notably, the downregulation of hsa_piR_016984 was the most significant in the myopic aqueous humor samples (Figures 6D–E). To evaluate the effect of piRNAs on TGF-β1 mRNA expression, different piRNAs were respectively overexpressed in scleral fibroblasts. The results indicated that hsa_piR_016984, hsa_piR_020498, hsa_piR_020809, hsa_piR_016240, and hsa_piR_020365 could significantly promote the expression of TGF-β1 mRNA (Figure 6F). Furthermore, the TGF-β1 RT-qPCR signal time courses relative to 0 h showed a slower decline following hsa_piR_016984 mimic transfection and a faster decline following inhibitor transfection relative to the respective negative controls (Figures 6G–H). Because actinomycin D was washed out at 6 h, the subsequent measurements cannot be interpreted as mRNA decay under continuous transcriptional blockade. These descriptive observations do not establish statistically different degradation rates or half-lives.
Effects of the piRNA-annotated small RNA hsa_piR_016984 on matrix staining and its interaction with TGF-β1 mRNA
Representative toluidine blue images showed greater matrix-associated staining intensity following hsa_piR_016984 overexpression and lower staining intensity following its inhibition (Figure 7A). TGF-β1 knockdown attenuated the increase in staining associated with hsa_piR_016984 overexpression (Figure 7B). Overexpression also attenuated the reduction in staining observed under the tested cyclic-stretch regimen (10% elongation, 1 Hz, 48 h; Figure 7C). Bioinformatics analysis predicted a candidate pairing region between hsa_piR_016984 and TGFB1 mRNA (Figure 7D). RNA pull-down showed TGFB1 mRNA co-enrichment with the biotin-labeled hsa_piR_016984 bait relative to the biotin-labeled scrambled control (Figure 7E). This finding is consistent with association in the recovered material but does not distinguish direct RNA–RNA pairing from an indirect, protein-mediated association. Binding-site reporter experiments showed that hsa_piR_016984 reduced activity from the wild-type reporter but did not alter the mutant reporter (Figure 7F). Treatment with exogenous TGF-β1 increased hsa_piR_016984 expression, whereas BI-4659 treatment decreased its expression under the tested in vitro conditions (Figure 7G). These measurements document changes in RNA abundance following treatment; they do not directly measure TGF-β/SMAD pathway activation.
Under the tested cyclic-stretch regimen (10% elongation, 1 Hz, 48 h), TGF-β1 expression and matrix staining intensity were lower than in matched static cultures, and exogenous TGF-β1 attenuated the reduction in matrix staining intensity. hsa_piR_016984 abundance was lower in myopic aqueous humor samples. In fibroblasts, hsa_piR_016984 overexpression was associated with a slower decline in TGF-β1 RT-qPCR signals relative to 0 h, increased matrix staining intensity, and attenuated the stretch-induced reduction in matrix staining intensity; its inhibition was associated with a faster decline in RT-qPCR signals relative to 0 h and reduced matrix staining intensity. TGF-β1 knockdown attenuated the increase in matrix staining intensity induced by hsa_piR_016984 overexpression. RNA pull-down detected TGFB1 mRNA co-enrichment with the biotin-labeled hsa_piR_016984 bait, and hsa_piR_016984 reduced wild-type but not mutant reporter activity. TGF-β1 treatment increased hsa_piR_016984 expression, whereas BI-4659 treatment decreased it (Figures 5–7).
DATA AVAILABILITY:
The small RNA-sequencing dataset can be accessed through GEO under accession GSE142359. All raw experimental data, including qPCR Ct values, original staining images, and statistical source data, have been deposited in Zenodo (https://zenodo.org/records/22976535).
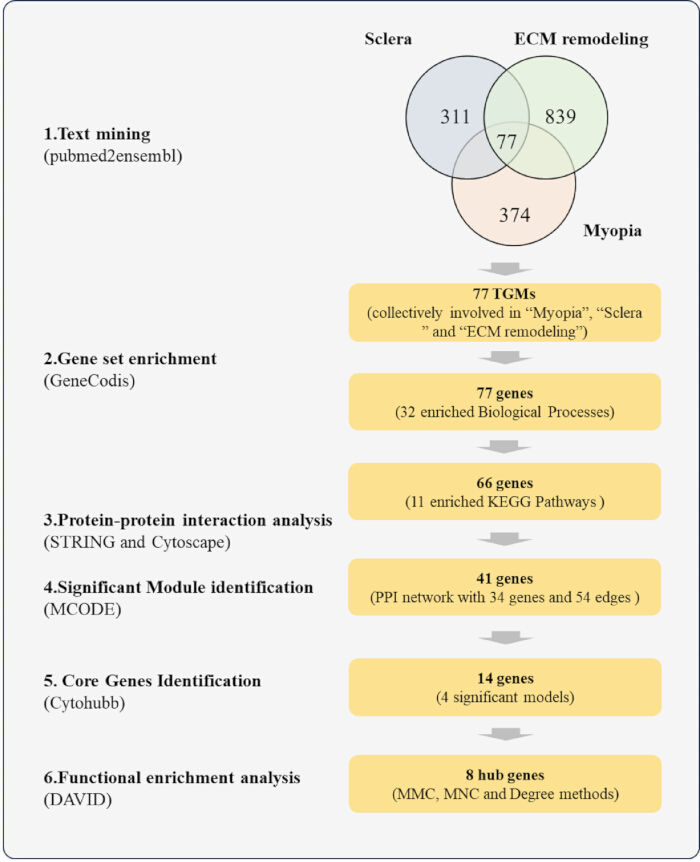
Figure 1: Bioinformatics workflow. Text mining identified 77 shared genes; GeneCodis analyses used 77 genes for GO and 66 for KEGG. STRING analysis of 41 genes yielded 34 nodes and 54 edges. MCODE identified four modules, and cytoHubba identified eight hub genes for DAVID annotation. Counts represent analysis outputs, not biological replicates. The schematic was drawn in R and arranged in Adobe Illustrator CS6. Please click here to view a larger version of this figure.
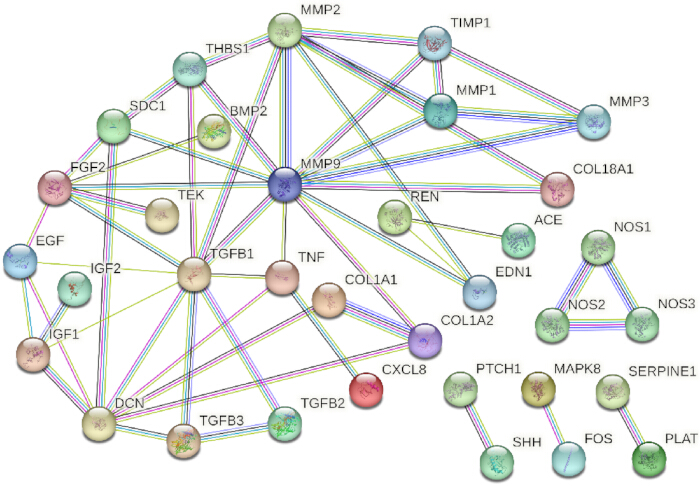
Figure 2: Protein–protein interaction network. STRING analysis of 41 text-mining genes retained associations at a confidence threshold of 0.900; isolated nodes were omitted, leaving 34 nodes and 54 edges. Nodes represent proteins, and edges represent retained associations. Biological replicate numbers, error bars, and experimental significance symbols do not apply. The network was drawn in R and arranged in Adobe Illustrator CS6. Please click here to view a larger version of this figure.
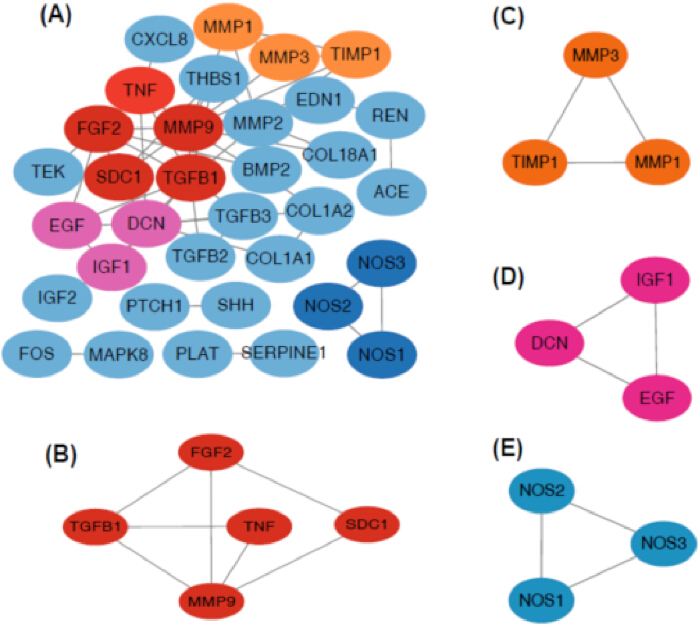
Figure 3: Network modules. (A) STRING-derived protein–protein interaction network. (B–E) Modules 1–4 identified using MCODE in Cytoscape, containing five, three, three, and three genes, respectively. Nodes represent proteins, and edges represent network associations. These are computational network diagrams; biological replicate numbers, error bars, and experimental significance symbols do not apply. Diagrams were drawn in R and assembled in Adobe Illustrator CS6. Please click here to view a larger version of this figure.
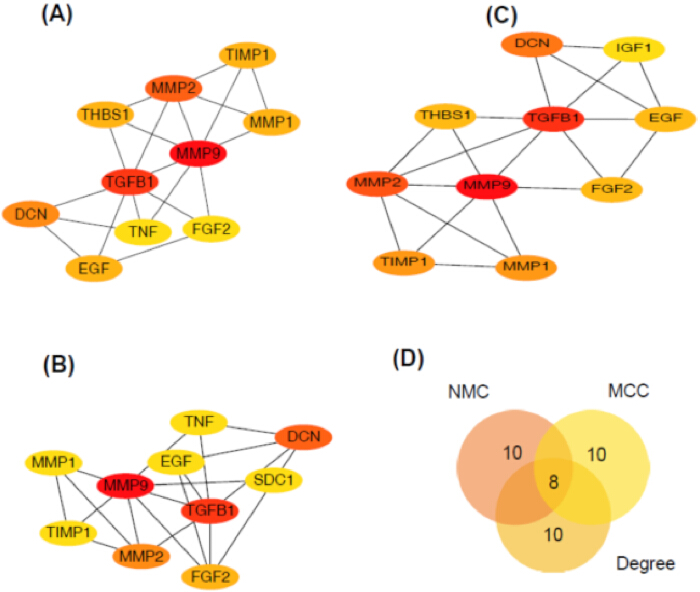
Figure 4: Hub-gene identification. (A–C) Top 10 genes ranked using the MNC, Degree, and MCC algorithms, respectively, in the Cytoscape cytoHubba plugin. (D) Venn diagram showing eight genes shared among the three rankings. Counts represent ranked or shared genes, not biological replicates; error bars and experimental significance symbols do not apply. Diagrams were drawn in R and assembled in Adobe Illustrator CS6. Please click here to view a larger version of this figure.
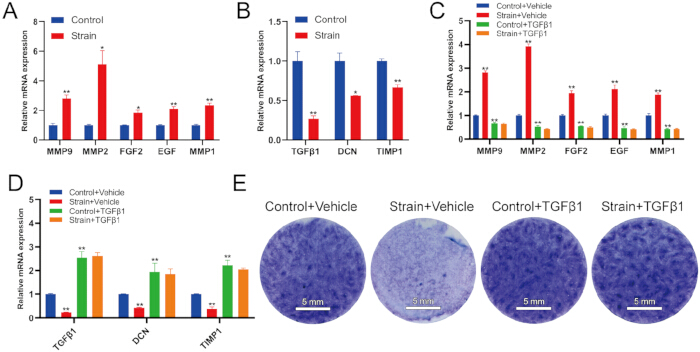
Figure 5: Stretch and TGF-β1 responses. (A–B) qPCR in static and stretched fibroblasts. (C–D) qPCR with vehicle or TGF-β1. (E) Representative whole-well toluidine blue staining; scale bars, 5 mm. Stretch: 10%, 1 Hz, 48 h; TGF-β1: 20 ng/mL. Expression was normalized to GAPDH. Data: mean ± SD; n = 3 biological replicates/group. A–B: unpaired two-tailed t-tests; C–D: gene-specific ANOVA/Dunnett comparisons against Control+Vehicle. Asterisks compare treatments with the blue control: *p < 0.05; **p < 0.01 (adjusted in C–D). Plots: R; assembly: Adobe Illustrator CS6. Please click here to view a larger version of this figure.
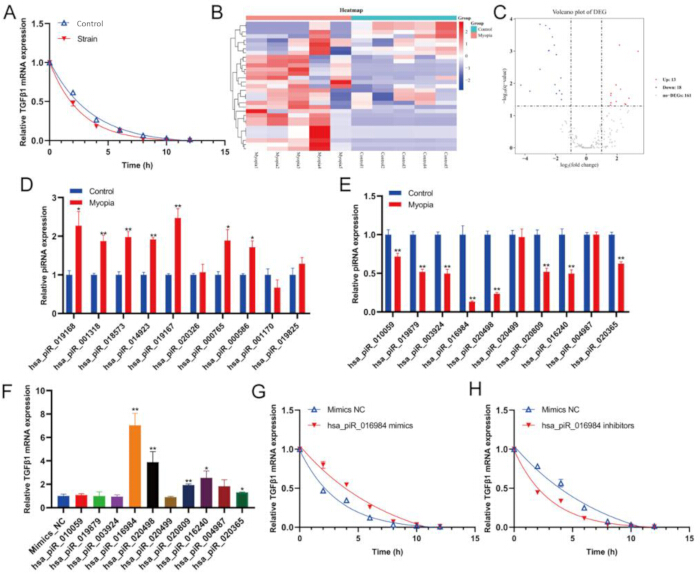
Figure 6: piRNA expression and TGFB1 time courses. (A, G–H) Relative Ct-derived signals after actinomycin D, without GAPDH normalization; washout at 6 h precludes interpreting later signals as continuous-blockade decay. (B–C) GSE142359 heatmap and volcano plot; reconstruction: Supplementary File 1. (D–E) Aqueous-humor qPCR (15 participants/group). (F) Mimic effects on TGFB1. Cellular assays: n = 3/group; qPCR data: mean ± SD. D–E: unpaired two-tailed t-tests; F: ANOVA/Dunnett versus mimic NC. *p < 0.05; **p < 0.01 versus blue controls (adjusted in F). Plots: R; assembly: Adobe Illustrator CS6. Please click here to view a larger version of this figure.
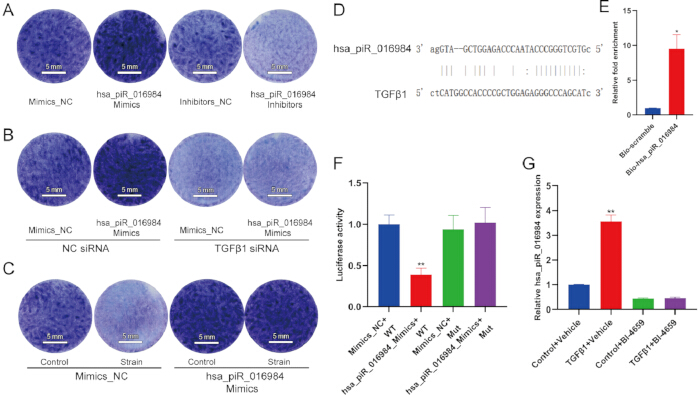
Figure 7: hsa_piR_016984-associated responses. (A–C) Representative whole-well toluidine blue staining after RNA manipulation, TGFB1 knockdown, or stretching; scale bars, 5 mm. (D) Predicted pairing, not direct-binding evidence. (E) RNA pull-down/qPCR. (F) Firefly/Renilla-normalized reporter activity. (G) U6-normalized expression after TGF-β1/BI-4659 treatment. n = 3 biological replicates/group, except D; quantitative data: mean ± SD. E–F: unpaired two-tailed t-tests; G: ANOVA/Dunnett versus Control+Vehicle. *p < 0.05; **p < 0.01 versus blue controls (adjusted in G). Plots and pairing diagram: R; assembly: Adobe Illustrator CS6. Please click here to view a larger version of this figure.
| Process | Genes in | Total genes in genome | Corrected | Genes |
| query set | hypergeometric P value | |||
| response to hypoxia | 13 | 159 | 1.78E-10 | CAT, BMP2, TGFB3, NOS1, EDN1, PLAT, ACE, MMP2, TNF, VEGFA, TGFB2, NOS2, THBS1 |
| response to xenobiotic stimulus | 14 | 253 | 1.55E-09 | CAT, COL1A1, FOS, APEX1, EDN1, PTCH1, ACE, REN, MMP2, TNF, TGFB2, SOD1, THBS1, SST |
| negative regulation of gene expression | 15 | 312 | 1.55E-09 | FGF2, MAX, BMP2, EDN1, TGFB1, SHH, ACE, CD34, TNF, VEGFA, TGFB2, NOS2, IL8, IGF1, SERPINF1 |
| positive regulation of cell division | 8 | 48 | 7.19E-09 | FGF2, CAT, IGF2, TGFB3, TGFB1, SHH, VEGFA, TGFB2 |
| aging | 11 | 145 | 7.19E-09 | FGF2, CAT, FOS, TGFB3, APEX1, ACE, CALCA, MMP2, SOD1, SERPINF1, TIMP1 |
| positive regulation of phosphatidylinositol 3-kinase signaling | 9 | 81 | 1.39E-08 | FGF2, CAT, TEK, DCN, EGF, TNF, VEGFA, TGFB2, IGF1 |
| positive regulation of gene expression | 16 | 516 | 8.12E-08 | VIM, FGF2, BMP2, TWIST1, TGFB1, SHH, EGF, NOS3, CD34, GSN, TNF, VEGFA, TNC, MAPK8, IL8, IGF1 |
| cellular response to UV-A | 5 | 11 | 1.03E-07 | MMP1, MMP9, MMP2, MMP3, TIMP1 |
| negative regulation of cell population proliferation | 15 | 463 | 1.33E-07 | FGF2, BMP2, NUDT6, IGFBP3, TGFB3, TGFB1, PTCH1, NOS3, COL18A1, TNF, TGFB2, PLG, IL8, THBS1, SST |
| regulation of blood pressure | 8 | 76 | 1.61E-07 | COL1A2, EDN1, ACE, NOS3, REN, CALCA, CD34, SOD1 |
| response to mechanical stimulus | 7 | 54 | 3.53E-07 | COL1A1, FOS, PTCH1, MMP2, TNF, MAPK8, THBS1 |
| positive regulation of MAPK cascade | 10 | 172 | 3.53E-07 | FGF2, BMP2, IGF2, TGFB3, TEK, EGF, TNF, VEGFA, IGF1, SOD1 |
| positive regulation of smooth muscle cell proliferation | 7 | 56 | 4.24E-07 | FGF2, EDN1, TGFB1, MMP2, TNF, IGF1, THBS1 |
| negative regulation of apoptotic process | 15 | 529 | 5.23E-07 | ALB, CAT, TWIST1, SHH, TEK, MMP9, MPZ, TNF, HSPA5, VEGFA, MAPK8, IGF1, SOD1, TIMP1, THBS1 |
| positive regulation of cell population proliferation | 15 | 548 | 7.85E-07 | FGF2, RPS4X, IGF2, TGFB3, EDN1, TGFB1, SHH, EGF, CNOT8, VEGFA, TGFB2, TNC, IGF1, TIMP1, THBS1 |
| wound healing | 8 | 99 | 8.46E-07 | FGF2, COL1A1, TGFB3, PLAT, TGFB2, IGF1, TIMP1, SDC1 |
| skeletal system development | 9 | 145 | 8.66E-07 | COL1A2, BMP2, COL1A1, EDN1, FBN1, MMP9, TGFB2, IGF1, VCAN |
| odontogenesis | 6 | 37 | 8.66E-07 | COL1A2, TWIST1, TGFB3, SHH, TGFB2, SDC1 |
| positive regulation of cell migration | 11 | 259 | 9.09E-07 | BMP2, COL1A1, EDN1, TGFB1, EGF, MMP9, MMP2, HSPA5, VEGFA, IGF1, THBS1 |
| angiogenesis | 11 | 261 | 9.35E-07 | FGF2, SHH, TEK, EGF, NOS3, MMP2, SERPINE1, COL18A1, VEGFA, IL8, TGFBI |
| positive regulation of angiogenesis | 9 | 162 | 1.95E-06 | FGF2, TWIST1, TEK, NOS3, CD34, SERPINE1, VEGFA, IL8, THBS1 |
| response to organic substance | 7 | 75 | 2.01E-06 | REN, MMP2, TNF, SOD1, TIMP1, TIMP2, SDC1 |
| positive regulation of miRNA transcription | 6 | 46 | 2.36E-06 | FGF2, BMP2, FOS, TGFB1, TNF, TGFB2 |
| positive regulation of MAP kinase activity | 7 | 78 | 2.36E-06 | FGF2, EDN1, TGFB1, EGF, TNF, VEGFA, THBS1 |
| response to heat | 6 | 46 | 2.36E-06 | NOS1, NOS3, CALCA, IGF1, SOD1, SST |
| extracellular matrix organization | 9 | 171 | 2.50E-06 | COL1A2, MMP1, COL1A1, MMP9, MMP2, COL18A1, TNF, MMP3, TGFBI |
| positive regulation of vascular associated smooth muscle cell proliferation | 6 | 47 | 2.50E-06 | FGF2, EDN1, MMP9, MMP2, TNF, IGF1 |
| extracellular matrix disassembly | 6 | 48 | 2.74E-06 | MMP1, MMP9, GSN, MMP2, MMP3, PLG |
| positive regulation of epithelial to mesenchymal transition | 6 | 49 | 3.01E-06 | BMP2, TWIST1, COL1A1, TGFB3, TGFB1, TGFB2 |
| positive regulation of protein kinase B signaling | 8 | 126 | 3.02E-06 | FGF2, IGF2, TGFB1, TEK, EGF, TNF, VEGFA, THBS1 |
| positive regulation of blood vessel endothelial cell migration | 6 | 50 | 3.19E-06 | FGF2, TGFB1, NOS3, VEGFA, PLG, THBS1 |
Table 1: Gene Ontology biological process enrichment of the 77 text-mining genes. GeneCodis analysis identified 32 enriched biological process terms from the 77-gene input list. The table reports term identifiers, associated genes, and enrichment statistics. In the analysis output, pval denotes the unadjusted p-value, and pval_adj denotes the adjusted p-value; input_size denotes the number of input genes recognized for the annotation category. Gene symbols are retained as gene identifiers. The listed terms were selected using unadjusted pval < 1.00 × 10⁻⁷; pval_adj reports the corresponding adjusted values and is not the selection column. Abbreviations: GO = Gene Ontology; BP = biological process; TMGs = text-mining genes.
| Process | Genes in | Total genes in genome | Corrected | Genes |
| query set | hypergeometric P value | |||
| Proteoglycans in cancer | 17 | 205 | 5.10E-12 | FGF2, COL1A2, TWIST1, COL1A1, IGF2, TGFB1, SHH, DCN, PTCH1, MMP9, MMP2, TNF, VEGFA, TGFB2, IGF1, THBS1, SDC1 |
| AGE-RAGE signaling pathway in diabetic complications | 13 | 100 | 1.25E-11 | COL1A2, COL1A1, TGFB3, EDN1, TGFB1, NOS3, MMP2, SERPINE1, TNF, VEGFA, TGFB2, MAPK8, IL8 |
| Relaxin signaling pathway | 13 | 129 | 2.37E-10 | COL1A2, MMP1, COL1A1, FOS, NOS1, EDN1, TGFB1, NOS3, MMP9, MMP2, VEGFA, MAPK8, NOS2 |
| Pathways in cancer | 20 | 531 | 1.14E-08 | FGF2, MMP1, MAX, BMP2, IGF2, FOS, TGFB3, EDN1, TGFB1, SHH, PTCH1, EGF, MMP9, MMP2, VEGFA, TGFB2, MAPK8, NOS2, IL8, IGF1 |
| Rheumatoid arthritis | 10 | 91 | 2.38E-08 | MMP1, FOS, TGFB3, TGFB1, TEK, TNF, VEGFA, MMP3, TGFB2, IL8 |
| Chagas disease | 10 | 101 | 5.61E-08 | FOS, TGFB3, TGFB1, ACE, SERPINE1, TNF, TGFB2, MAPK8, NOS2, IL8 |
| Bladder cancer | 7 | 41 | 3.27E-07 | MMP1, EGF, MMP9, MMP2, VEGFA, IL8, THBS1 |
| Fluid shear stress and atherosclerosis | 10 | 139 | 9.49E-07 | FOS, EDN1, PLAT, NOS3, MMP9, MMP2, TNF, VEGFA, MAPK8, SDC1 |
| Malaria | 7 | 50 | 1.07E-06 | TGFB3, TGFB1, TNF, TGFB2, IL8, THBS1, SDC1 |
| HIF-1 signaling pathway | 9 | 109 | 1.17E-06 | EDN1, TEK, EGF, NOS3, SERPINE1, VEGFA, NOS2, IGF1, TIMP1 |
| Diabetic cardiomyopathy | 11 | 190 | 1.28E-06 | COL1A2, COL1A1, TGFB3, TGFB1, ACE, NOS3, MMP9, REN, MMP2, TGFB2, MAPK8 |
Table 2. KEGG pathway enrichment of the 66-gene input list. GeneCodis analysis identified 11 enriched pathways from the 66-gene input list. The table reports pathway identifiers, associated genes, and enrichment statistics. In the analysis output, pval and pval_adj denote unadjusted and adjusted p-values, respectively; input_size denotes the number of input genes recognized for pathway annotation. The identifier prefix hsa denotes Homo sapiens. The listed terms were selected using unadjusted p < 1.00 × 10⁻⁷; pval_adj reports the corresponding adjusted values and is not the selection column. Abbreviations: KEGG = Kyoto Encyclopedia of Genes and Genomes; AGE = advanced glycation end product; RAGE = receptor for advanced glycation end products; HIF-1 = hypoxia-inducible factor 1.
Supplementary Table 1: Text-mining gene list associated with myopia. The 374 genes retrieved using pubmed2ensembl for myopia are listed by gene symbol. Please click here to download this file.
Supplementary Table 2: Text-mining gene list associated with extracellular matrix remodeling. The 839 genes retrieved using pubmed2ensembl for extracellular matrix remodeling are listed by gene symbol. Please click here to download this file.
Supplementary Table 3: Text-mining gene list associated with the sclera. The 311 genes retrieved using pubmed2ensembl for the sclera are listed by gene symbol. Please click here to download this file.
Supplementary Table 4: Shared text-mining genes. The 77 genes shared by the myopia, sclera, and extracellular matrix remodeling lists in Supplementary Tables 1–3 are listed by gene symbol. Please click here to download this file.
Supplementary Table 5: Gene Ontology enrichment of module 1. DAVID results for five MCODE-module genes cover biological process, cellular component, and molecular function annotations. PValue reports unadjusted p-values; 15 of 53 terms meet the reported false discovery rate (FDR) < 0.05. Remaining terms are exploratory. Please click here to download this file.
Supplementary Table 6: Gene Ontology enrichment of module 2. DAVID results for three MCODE-module genes cover biological process, cellular component, and molecular function annotations. PValue reports unadjusted p-values; 13 of 14 terms meet the reported false discovery rate (FDR) < 0.05. Remaining terms are exploratory. Please click here to download this file.
Supplementary Table 7: Gene Ontology enrichment of module 3. DAVID results for three MCODE-module genes cover biological process, cellular component, and molecular function annotations. PValue reports unadjusted p-values; 4 of 10 terms meet the reported false discovery rate (FDR) < 0.05. Remaining terms are exploratory. Please click here to download this file.
Supplementary Table 8: Gene Ontology enrichment of module 4. DAVID results for three MCODE-module genes cover biological process, cellular component, and molecular function annotations. PValue reports unadjusted p-values; 25 of 27 terms meet the reported false discovery rate (FDR) < 0.05. Remaining terms are exploratory. Please click here to download this file.
Supplementary Table 9: KEGG pathway enrichment of module 1. DAVID pathway results are reported for five MCODE-module genes. PValue reports unadjusted p-values; 2 of 17 terms meet the reported false discovery rate (FDR) < 0.05. Remaining terms are exploratory. Please click here to download this file.
Supplementary Table 10: KEGG pathway enrichment of module 2. DAVID pathway results are reported for three MCODE-module genes. PValue reports unadjusted p-values; 0 of 3 terms meet the reported false discovery rate (FDR) < 0.05. Remaining terms are exploratory. Please click here to download this file.
Supplementary Table 11: KEGG pathway enrichment of module 3. DAVID pathway results are reported for three MCODE-module genes. PValue reports unadjusted p-values; 0 of 10 terms meet the reported false discovery rate (FDR) < 0.05. Remaining terms are exploratory. Please click here to download this file.
Supplementary Table 12: KEGG pathway enrichment of module 4. DAVID pathway results are reported for three MCODE-module genes. PValue reports unadjusted p-values; 5 of 7 terms meet the reported false discovery rate (FDR) < 0.05. Remaining terms are exploratory. Please click here to download this file.
Supplementary Table 13: Gene Ontology enrichment of the eight hub genes. DAVID results cover genes shared by the top-ranked MCC, MNC, and Degree lists. PValue reports unadjusted p-values; 24 of 61 terms meet the reported false discovery rate (FDR) < 0.05. Remaining terms are exploratory. Please click here to download this file.
Supplementary Table 14: KEGG pathway enrichment of the eight hub genes. DAVID results cover genes shared by the top-ranked MCC, MNC, and Degree lists. PValue reports unadjusted p-values; 4 of 7 terms meet the reported false discovery rate (FDR) < 0.05. Remaining terms are exploratory. Please click here to download this file.
Supplementary File 1: Reconstructed R visualization code for the piRNA expression and differential-expression results underlying Figure 6B–C. The script specifies plotting parameters, checks input consistency and exports heatmap and volcano plots, plotting data and session information. It requires the selected-piRNA and full-result CSV input tables described in the script. Please click here to download this file.
토론
This protocol combines text mining, network analysis, public sequencing data and cell experiments to investigate gene-expression and matrix-staining responses in human scleral fibroblasts, including responses under a defined cyclic-stretch regimen. Scleral remodeling is associated with axial elongation, and previous studies have examined changes in scleral TGF-β1 during myopia development29,30,31,32. Here, cyclic stretching of human scleral fibroblasts reduced TGF-β1 expression and ECM staining, while manipulation of hsa_piR_016984 was associated with changes in TGF-β1 RT-qPCR signal time courses relative to 0 h and the cellular response to stretching. Together with the aqueous humor findings, these experiments identify hsa_piR_016984 and TGF-β1 as candidates for further investigation. The protocol links computational candidate selection to functional assays, while the cell-culture findings should be distinguished from evidence of a causal mechanism in human myopia. The stretch-related findings are restricted to 10% elongation at 1 Hz for 48 h. The authors do not characterize hsa_piR_016984 as a mechanosensitive RNA: effects of its manipulation on cellular responses under stretch do not by themselves establish that its expression is directly regulated by mechanical loading or that it has an intrinsic mechanosensing function. The RNA is conservatively designated a piRNA-annotated small RNA, without assuming a canonical PIWI-dependent mechanism.
Consistent cell preparation and treatment timing are central to this workflow. Complete cell attachment before mechanical treatment, uniform seeding density across experimental groups, and stable incubation at 37 °C and 5% CO₂ are important for reproducibility. Fibroblasts at passages 3–7 were seeded at 1 × 10⁵ cells per well in 2 mL of medium, allowed to acclimate for 24 h, and stretched at approximately 80% confluence using 10% elongation at 1 Hz for 48 h. Static controls were maintained under matched culture conditions. For TGF-β1 intervention, cells underwent 12 h of serum starvation after reaching approximately 70% confluence, followed by 20 ng/mL TGF-β1 throughout the stretching period. In inhibitor experiments, 1 µM BI-4659 was added 1 h before stimulation and maintained for the subsequent 48 h. Matching these schedules and the corresponding PBS or DMSO vehicle controls is necessary to distinguish treatment-associated changes from differences in culture conditions.
The main troubleshooting priorities are cell attachment, RNA preservation, and assay consistency. Excessive detachment or cell loss during stretching should prompt checks of plate coating, seeding uniformity and confluence before interpreting changes in gene expression or staining. If over-confluence contributes to cell loss, seeding density should be reduced consistently across the experimental groups. Variable qPCR results should prompt checks of RNA quality, genomic DNA removal, reverse-transcription conditions, and amplification performance. The annealing/extension temperature used here was 60 °C. RNA pull-down requires cold handling, RNase inhibition, and avoidance of repeated freeze–thaw cycles; matched negative-control probes are needed to assess nonspecific recovery. For siRNA experiments, TGFB1 mRNA was measured approximately 72 h after transfection to assess knockdown relative to the negative control. Each intervention should be interpreted alongside its matched control rather than assuming equivalent transfection or recovery across experiments.
The workflow can be adapted to other candidate RNAs or mechanical conditions, but changes in passage range, seeding density, stretch amplitude, frequency or duration require renewed assessment of cell viability and assay performance. Compared with computational screening alone, the combination of RNA manipulation, mRNA time-course measurements, RNA pull-down, and wild-type/mutant reporter assays provides complementary functional evidence. The culture system also permits controlled changes in mechanical loading and treatment timing, whereas animal models are needed to examine ocular growth and tissue-level responses. Human aqueous humor provides a clinically accessible validation sample, but its RNA composition cannot be assumed to represent expression in scleral fibroblasts. Alternative sample sources or model systems therefore address different aspects of the biological question.
Several limitations constrain interpretation. Two-dimensional fibroblast cultures do not reproduce the three-dimensional organization and multiaxial loading of the intact sclera. Cell experiments included three independent biological replicates per group, and aqueous humor validation included 15 participants per group; these sample sizes limit the assessment of biological and clinical variability. Toluidine blue staining reflects acidic matrix components, including sulfated glycosaminoglycans (sGAGs), but does not specifically quantify sGAG content or measure total ECM or collagen synthesis. Reduced staining intensity may reflect fewer cells, reduced matrix accumulation, or both; the images do not distinguish matrix production per cell from differences in cell number. Total ECM protein and collagen synthesis were not directly quantified. Consequently, the staining findings are limited to matrix-associated staining under the tested in vitro conditions. Cell-number and viability measurements, together with specific biochemical or protein-level assays, are needed to establish changes in matrix synthesis. Small non-coding RNAs can influence post-transcriptional regulation33,34, but the present assays do not establish the identity of the protein complex involved in the hsa_piR_016984-associated response. RNA pull-down detects TGFB1 mRNA co-enrichment with the labeled RNA bait and cannot distinguish direct RNA–RNA pairing from association mediated by proteins or other molecules. Labeling and exogenous bait abundance may also affect recovery. The reporter assay provides a site-dependent functional readout but does not independently establish physical base pairing or increased TGFB1 mRNA stability. Direct binding would require additional evidence, such as a protein-free RNA-binding assay with site-disrupting and compensatory mutations; these experiments are proposed for future validation, not results of the present study. The observed responses to exogenous TGF-β1 and BI-4659 treatment suggest a possible regulatory relationship requiring further validation, rather than an established positive-feedback loop.
These changes in hsa_piR_016984 abundance do not distinguish transcriptional regulation from altered RNA processing or stability and do not establish direct SMAD-mediated transcriptional activation. TGF-β1 protein abundance and SMAD2/3 phosphorylation were not assessed in this study; mRNA measurements alone cannot establish pathway activation. Protein-level measurements and direct tests of SMAD-dependent regulation are therefore needed to evaluate the proposed relationship. Mechanical loading was examined under a single regimen (10% elongation, 1 Hz, 48 h), so an amplitude-, frequency-, or duration-dependent response of hsa_piR_016984 has not been established. Potential contributions from altered cell viability, proliferation, or nonspecific RNA degradation were not systematically excluded. Functional effects of hsa_piR_016984 manipulation on matrix staining under stretch do not substitute for direct measurements of its expression after loading or for testing the interaction between RNA manipulation and loading on TGF-β1 responses. Direct expression measurements across loading conditions, appropriate viability and proliferation controls, and tests of the interaction between RNA manipulation and mechanical loading would be needed to determine whether hsa_piR_016984 is mechanosensitive. These are requirements for future validation, not findings of the present study; non-canonical small-RNA pathways also remain possible. In the actinomycin D experiment, drug exposure lasted 6 h, whereas sampling continued to 12 h. The post-washout measurements may reflect both RNA synthesis and degradation and cannot be treated as a continuous transcription-blockade decay assay. The signals were scaled to each group’s corresponding 0 h Ct value without GAPDH normalization because the corresponding GAPDH Ct values were unavailable. Equal total RNA input was used; however, this does not control for variation in reverse-transcription efficiency or changes in the proportion of TGF-β1 transcripts within total RNA. This calculation does not estimate a decay constant or half-life, and no formal between-curve comparisons were performed. Actinomycin D effects on cell viability were not assessed. Consequently, these time courses provide descriptive evidence and do not establish a statistically validated change in TGF-β1 mRNA stability. Several module and hub-gene pathway associations met only an unadjusted p-value threshold and did not survive FDR correction. These findings are hypothesis-generating and cannot independently establish pathway involvement or activation. The historical piRNA annotation of DQ593431.1 originates from the sequence record linked to Girard et al.; this provenance does not establish PIWI association in scleral fibroblasts35. The sequence matches nine database-listed hg38 loci, each annotated as overlapping tRNA-Met-i, making an alternative tRNA-related origin a specific consideration. Its 32-NT length and sequence composition alone cannot establish a canonical piRNA identity. Neither the expressed precursor nor PIWI-dependent biogenesis or function was established here, and a tRNA-derived or other non-canonical pathway cannot be excluded. The authors therefore retain the designation “piRNA-annotated small RNA” and do not claim a unique intergenic origin or exclusion of other RNA-fragment sources.
Overall, the protocol provides a framework for examining hsa_piR_016984-associated changes in TGF-β1 mRNA abundance and matrix staining in cultured human scleral fibroblasts, including experiments under a defined cyclic-stretch regimen. The current observations do not establish the mechanosensitivity of hsa_piR_016984 or demonstrate that it mediates scleral remodeling in vivo. Its future applications include testing additional candidate RNAs, comparing loading conditions and evaluating interventions in more physiologically representative models. Three-dimensional scleral models and in vivo myopia studies could examine whether the cellular findings extend to tissue mechanics and axial elongation, while additional donor-derived samples could assess reproducibility across individuals. Any proposed sclera-targeted RNA intervention would require evaluation of delivery, specificity, durability and safety. These steps would clarify the biological significance and potential applications of the hsa_piR_016984/TGF-β1 regulatory relationship.
공개 사항
The authors report no competing interests.
감사의 글
Funding was provided by the self-funded Scientific Research Project of Taizhou Hospital of Zhejiang Province, Affiliated to Wenzhou Medical University.
재료
| 이름 | 회사 | 카탈로그 번호 | 댓글 |
|---|---|---|---|
| BI-4659 | MedKoo Biosciences | 466195 | |
| BioFlex culture plates, type I collagen-coated | Flexcell International | BF-3001C | |
| Bowtie | Bowtie project | v1.3.1 | |
| Cell culture plates, 96-well | Corning | 3599 | |
| Centrifuge, refrigerated | Eppendorf | 5424 R | |
| CO2 incubator | Thermo Fisher Scientific | Heracell 150i | |
| Cutadapt | Cutadapt project | v4.4 | |
| cytoHubba | cytoHubba project | 0.1 | |
| Cytoscape | Cytoscape project | 3.9.1 | |
| DAVID | DAVID resource | DAVID 2021 release | |
| Dimethyl sulfoxide | Sigma-Aldrich | D2650 | |
| Dual-Luciferase Reporter Assay System | Promega | E1910 | |
| edgeR | Bioconductor / edgeR project | 4.0.16 | |
| EZ-press microRNA Reverse Transcription Kit PLUS | EZBioscience | EZB-miRT2-plus | |
| EZ-Probe qPCR Master Mix for microRNA (ROX1 plus) | EZBioscience | EZB-miProbe-R1 | |
| EZscript Reverse Transcription Mix II, 4×, with gDNA Remover | EZBioscience | EZB-RT2G | |
| FastQC | FastQC project | 0.12.1 | |
| Flexcell FX-5000 Tension System | Flexcell International | Model FX-5000 | |
| GeneCodis | GeneCodis resource | GeneCodis4 | |
| GSE142359 small RNA-sequencing dataset | Gene Expression Omnibus (GEO) | GSE142359 | |
| Human piRNA reference database | piRBase | v3.0 | |
| Human reference genome for read alignment | NCBI / UCSC | GRCh38.p14 | |
| Human scleral fibroblast complete medium | Procell Life Science & Technology | CM-H242 | |
| Human scleral fibroblasts | Procell Life Science & Technology | CP-H242 | |
| LightCycler 480 II Real-Time PCR System | Roche | 5015243001 | |
| Lipofectamine 2000 Transfection Reagent | Thermo Fisher Scientific | 11668030 | |
| Lipofectamine 3000 Transfection Reagent | Thermo Fisher Scientific | L3000015 | |
| Magnetic separation rack | Thermo Fisher Scientific | 12321D | |
| MCODE | MCODE project | 1.6.1 | |
| Opti-MEM reduced-serum medium | Thermo Fisher Scientific | 31985062 | |
| Paraformaldehyde | Sigma-Aldrich | P6148 | |
| Phosphate-buffered saline | Gibco | 10010023 | |
| pmirGLO luciferase vector | Promega | E1330 | |
| Protease inhibitor cocktail | Roche | 11836170001 | |
| pubmed2ensembl | pubmed2ensembl resource | Homo sapiens GRCh37 | |
| R | R Foundation for Statistical Computing | 4.5.3 | |
| Recombinant human TGF beta 1 protein | Proteintech | Ag27942 | |
| Trimmomatic | Trimmomatic project | 0.39 | |
| TRIzol Reagent | Thermo Fisher Scientific | 15596026 | |
| Trypsin-EDTA, 0.25% | Thermo Fisher Scientific | 25200056 |
참고문헌
- Flitcroft DI et al. IMI - Defining and Classifying Myopia: A Proposed Set of Standards for Clinical and Epidemiologic Studies. Invest Ophthalmol Vis Sci. 2019;60(3):M20-M30.
- Baird PN et al. Myopia. Nat Rev Dis Primers. 2020;6(1):99.
- Holden BA et al. Global Prevalence of Myopia and High Myopia and Temporal Trends from 2000 through 2050. Ophthalmology. 2016;123(5):1036-42.
- Gifford KL et al. IMI - Clinical Management Guidelines Report. Invest Ophthalmol Vis Sci. 2019;60(3):M184-M203.
- Wildsoet CF et al. IMI - Interventions Myopia Institute: Interventions for Controlling Myopia Onset and Progression Report. Invest Ophthalmol Vis Sci. 2019;60(3):M106-M31.
- Huang J et al. Efficacy Comparison of 16 Interventions for Myopia Control in Children: A Network Meta-analysis. Ophthalmology. 2016;123(4):697-708.
- Morgan IG, Ohno-Matsui K, Saw SM. Myopia. Lancet. 2012;379(9827):1739-48.
- Kim MH et al. Heritability of myopia and ocular biometrics in Koreans: the healthy twin study. Invest Ophthalmol Vis Sci. 2013;54(5):3644-9.
- Zhang D, Zeng G, Hu J, McCormick K, Shi Y, Gong B. Association of IGF1 polymorphism rs6214 with high myopia: A systematic review and meta-analysis. Ophthalmic Genet. 2017;38(5):434-9.
- Lam DS et al. The effect of parental history of myopia on children's eye size and growth: results of a longitudinal study. Invest Ophthalmol Vis Sci. 2008;49(3):873-6.
- Fan DS et al. The effect of parental history of myopia on eye size of pre-school children: a pilot study. Acta Ophthalmol Scand. 2005;83(4):492-6.
- Liang CL et al. Impact of family history of high myopia on level and onset of myopia. Invest Ophthalmol Vis Sci. 2004;45(10):3446-52.
- Hammond CJ, Snieder H, Gilbert CE, Spector TD. Genes and environment in refractive error: the twin eye study. Invest Ophthalmol Vis Sci. 2001;42(6):1232-6.
- Jones LA et al. Parental history of myopia, sports and outdoor activities, and future myopia. Invest Ophthalmol Vis Sci. 2007;48(8):3524-32.
- Jones-Jordan LA et al. Early childhood refractive error and parental history of myopia as predictors of myopia. Invest Ophthalmol Vis Sci. 2010;51(1):115-21.
- Xiang F, He M, Morgan IG. The impact of parental myopia on myopia in Chinese children: population-based evidence. Optom Vis Sci. 2012;89(10):1487-96.
- Yap M, Wu M, Liu ZM, Lee FL, Wang SH. Role of heredity in the genesis of myopia. Ophthalmic Physiol Opt. 1993;13(3):316-9.
- Morgan I, Rose K. How genetic is school myopia? Prog Retin Eye Res. 2005;24(1):1-38.
- Harb EN, Wildsoet CF. Origins of Refractive Errors: Environmental and Genetic Factors. Annu Rev Vis Sci. 2019;5:47-72.
- Rada JA, Shelton S, Norton TT. The sclera and myopia. Exp Eye Res. 2006;82(2):185-200.
- Harper AR, Summers JA. The dynamic sclera: extracellular matrix remodeling in normal ocular growth and myopia development. Exp Eye Res. 2015;133:100-11.
- Moosavinasab S et al. 'RE:fine drugs': an interactive dashboard to access drug repurposing opportunities. Database (Oxford). 2016;2016:baw083.
- Mosca E et al. Identification of functionally related genes using data mining and data integration: a breast cancer case study. BMC Bioinformatics. 2009;10 Suppl 12(Suppl 12):S8.
- Berg EL. Systems biology in drug discovery and development. Drug Discov Today. 2014;19(2):113-25.
- Carmona-Saez P, Chagoyen M, Tirado F, Carazo JM, Pascual-Montano A. GENECODIS: a web-based tool for finding significant concurrent annotations in gene lists. Genome Biol. 2007;8(1):R3.
- Szklarczyk D et al. STRING v11: protein-protein association networks with increased coverage, supporting functional discovery in genome-wide experimental datasets. Nucleic Acids Res. 2019;47(D1):D607-D13.
- Ashburner M et al. Gene ontology: tool for the unification of biology. The Gene Ontology Consortium. Nat Genet. 2000;25(1):25-9.
- Kanehisa M, Goto S. KEGG: kyoto encyclopedia of genes and genomes. Nucleic Acids Res. 2000;28(1):27-30.
- McBrien NA, Jobling AI, Gentle A. Biomechanics of the sclera in myopia: extracellular and cellular factors. Optom Vis Sci. 2009;86(1):E23-30.
- Boote C, Sigal IA, Grytz R, Hua Y, Nguyen TD, Girard MJA. Scleral structure and biomechanics. Prog Retin Eye Res. 2020;74:100773.
- Jobling AI, Nguyen M, Gentle A, McBrien NA. Isoform-specific changes in scleral transforming growth factor-beta expression and the regulation of collagen synthesis during myopia progression. J Biol Chem. 2004;279(18):18121-6.
- Li M et al. Expression of Wnt/beta-Catenin Signaling Pathway and Its Regulatory Role in Type I Collagen with TGF-beta1 in Scleral Fibroblasts from an Experimentally Induced Myopia Guinea Pig Model. J Ophthalmol. 2016;2016:5126560.
- Fabian MR, Sonenberg N, Filipowicz W. Regulation of mRNA translation and stability by microRNAs. Annu Rev Biochem. 2010;79:351-79.
- Zhang W et al. piRNA-1742 promotes renal cell carcinoma malignancy by regulating USP8 stability through binding to hnRNPU and thereby inhibiting MUC12 ubiquitination. Exp Mol Med. 2023;55(6):1258-71.
- Girard A, Sachidanandam R, Hannon GJ, Carmell MA. A germline-specific class of small RNAs binds mammalian Piwi proteins. Nature. 2006;442(7099):199-202.