This study presents an integrated network-pharmacology, bulk-transcriptomic, single-cell, molecular-docking, and in vitro workflow to nominate potential Cortex Dictamni-associated targets in atopic dermatitis.
연구 논문
Integrated Transcriptomic and Network Pharmacology Identifies IRF1, PTGS2, TNF, and IFNG as Candidate Targets of Cortex Dictamni in Atopic Dermatitis
이 논문에서
요약
초록
Cortex Dictamni has been used in traditional Chinese medicine (TCM) for inflammatory skin disorders, but its potential molecular targets in atopic dermatitis (AD) remain incompletely characterized. Active compounds and predicted targets of Cortex Dictamni were retrieved from the Traditional Chinese Medicine Systems Pharmacology Database and Analysis Platform and integrated with bulk-transcriptomic differential-expression data and single-cell RNA-sequencing data. Protein–protein interaction, functional-enrichment, gene set enrichment analysis (GSEA), and single-sample GSEA (ssGSEA)-based immune-cell and pathway analyses were performed with Benjamini–Hochberg correction for multiple testing. Molecular docking was used to predict luteolin–IFNG and β-sitosterol–PTGS2 binding poses, and candidate-gene expression was assessed in TNF-α/IFN-γ-stimulated HaCaT keratinocytes treated with low concentrations of purified dictamnine. Eighteen active components yielded 170 predicted targets; 88 overlapped with AD-related genes, and 43 of these were differentially expressed. Intersecting 366 cell-type-specific differentially expressed genes with 42 targets identified IRF1, PTGS2, TNF, and IFNG. IRF1, PTGS2, and TNF were upregulated in specific immune-cell populations, whereas IFNG was downregulated in natural killer cells. Ribosome-pathway enrichment was observed across five immune-cell types. After Benjamini–Hochberg correction, immune-signature correlations were gene-specific and bidirectional, whereas Hallmark-pathway correlations were nonsignificant. Docking predicted possible binding poses for luteolin–IFNG and β-sitosterol–PTGS2. In TNF-α/IFN-γ-stimulated HaCaT cells, 6.25 and 12.5 µM dictamnine reduced all four mRNAs, whereas 12.5 µM dictamnine alone had no significant effect. Collectively, IRF1, PTGS2, TNF, and IFNG were nominated as potential Cortex Dictamni-associated targets in AD, and low-dose purified dictamnine provided preliminary mRNA-level support. These findings do not establish crude-herb efficacy or direct target–compound interactions and require protein-level, mechanistic, in vivo, and clinical validation.
서론
AD is a chronic non-infectious inflammatory skin disease that is characterized by persistent pruritus, which may result from barrier dysfunction, altered immune response, immunoglobulin E-mediated hypersensitivity, and environmental factors1,2,3,4. Common clinical features include eczematous lesions, flexural involvement, and xerosis5. Topical corticosteroids are commonly used as first-line anti-inflammatory treatment for AD6, whereas the topical calcineurin inhibitors pimecrolimus and tacrolimus serve as steroid-sparing alternatives, particularly for sensitive skin areas or when topical corticosteroids are ineffective or unsuitable7. Although biologic agents and small-molecule inhibitors have expanded the available treatment options, treatment responses vary among patients, and their use may be limited by accessibility, cost, adverse effects, or incomplete long-term disease control8. Therefore, further characterization of AD-associated molecular pathways may help identify additional candidate targets for mechanistic investigation.
TCM emphasizes the balance of Yin and Yang in treating some refractory diseases9,10. TCM treatments are commonly selected according to syndrome differentiation; however, standardized quality control and pharmacological evaluation are required to clarify their active constituents, molecular targets, dose–response relationships, and safety profiles11,12. Cortex Dictamni, the dried root bark of Dictamnus dasycarpus, has traditionally been used to clear heat, remove dampness, dispel wind, and manage pruritic inflammatory skin disorders13. Studies have demonstrated its anti-inflammatory, antibacterial, and antipruritic properties and observed its potential inhibitory effects on epidermal hyperplasia14. It has been reported that Cortex Dictamni affects the immune response and inflammatory signaling pathways, and improves the symptoms and inflammatory degree of skin lesions of AD15.
Single-cell RNA sequencing (scRNA-seq) has been widely used to analyze genetic, epigenetic, spatial, proteomic, and lineage information at single-cell resolution, thereby enabling cell-type-specific gene expression analysis, identification of characteristic genes, and construction of regulatory networks16,17,18,19. A previous network-pharmacology study investigated the potential relationship between Cortex Dictamni and AD. The present study extends that work by integrating an independent bulk-transcriptomic dataset, cell-type-resolved single-cell analysis, GSEA, ssGSEA-based immune and pathway scoring, molecular docking, and keratinocyte-based expression validation. The working hypothesis was that AD-associated genes overlapping with predicted Cortex Dictamni targets would exhibit cell-type-specific expression patterns and immune-related pathway associations, and that selected compounds would show predicted binding to candidate proteins, with corresponding candidate-gene expression changes in cytokine-stimulated keratinocytes. Accordingly, this study aimed to nominate, rather than clinically validate, potential Cortex Dictamni-associated molecular targets in AD.
프로토콜
This study used only publicly available, de-identified transcriptomic datasets (GSE121212 and GSE180885) and an established human HaCaT keratinocyte cell line obtained from a commercial cell repository (RRID:CVCL_0038). No new human participants, identifiable private information, animals, or primary human specimens were involved. Therefore, institutional ethics committee approval and informed consent were not required. All materials, reagents, cell lines, software, and databases used in this protocol are listed in the Table of Materials.
Collection and pretreatment of data sets
The bulk-transcriptomic dataset GSE121212, comprising 38 normal-skin samples and 27 lesional samples from patients with AD, was obtained from the Gene Expression Omnibus database as a gene-level raw read-count matrix. Protein-coding genes were retained according to GENCODE annotation. The scRNA-seq dataset GSE180885, comprising three normal human skin samples and four AD samples, was obtained as a processed 10x count matrix with the gene symbols supplied by GEO. Cells were retained when 200 < nFeature_RNA < 5,000, nCount_RNA < 15,000, and percent.mt < 20%. SCTransform normalization was performed with percent.mt regressed out, followed by principal component analysis20. Sample-associated batch effects were corrected using Harmony with sample identity as the batch variable21, max.iter.harmony = 50, lambda = 0.5, and assay.use = “SCT”. The first 30 Harmony dimensions were used for FindNeighbors and UMAP, and FindClusters was performed at a resolution of 0.1. Cell types were annotated according to canonical markers compiled from CellMarker22. Cell-type-specific differential expression between AD and normal human skin was defined as |average log2 fold change| ≥ 0.5 and BH-adjusted p < 0.05.
Screening action targets of Cortex Dictamni and AD
AD-related targets were searched with AD as the keyword in the GeneCards database. After removing duplicates, AD-related target genes were identified based on GeneCards relevance score greater than the median value. The chemical components of Cortex Dictamni were retrieved from the TCMSP database23, and the potential active components of oral bioavailability ≥ 30% and drug likeness ≥ 0.18 were screened. The corresponding target genes of the chemical components were obtained, and their names were converted into generic gene names using the UniProt database. The raw read-count matrix of GSE121212 was analyzed using DESeq2 to compare AD lesional samples with normal-skin samples24. Differential expression was defined as |log2 fold change| ≥ log2(1.5) and Benjamini–Hochberg-adjusted p < 0.05. The resulting differentially expressed genes were intersected with the predicted Cortex Dictamni targets. All databases were accessed in February 2026. The active-component–target network was visualized using Cytoscape25.
Protein-protein interaction (PPI) network
The intersected genes were imported into the STRING database to construct a PPI network using a high-confidence interaction score of ≥ 0.726. The PPI network was visualized using the network-visualization software described above, and the MCC algorithm implemented in cytoHubba was used for node ranking. GO and KEGG enrichment analyses of the 42 potential targets were performed using clusterProfiler. All human genes annotated in org.Hs.eg.db were used as the background for GO analysis, whereas all human genes annotated in the KEGG pathway database were used as the background for KEGG analysis. Benjamini–Hochberg-adjusted p < 0.05 was considered statistically significant.
Gene set enrichment analysis (GSEA)
For each candidate gene, the AD samples in GSE121212 were divided into high- and low-expression groups using the median expression value. A complete ranked gene list generated from the comparison between the two groups was analyzed using the GSEA function of the R package described above. Gene sets were obtained from Gene Ontology Biological Process annotations in org.Hs.eg.db, using Entrez identifiers. The enrichment score, normalized enrichment score, nominal p value, BH-adjusted p value, and FDR q value were calculated. Gene sets with nominal p < 0.05 and FDR q < 0.25 were considered supported by GSEA and were used for inferential interpretation.
ssGSEA-based immune-cell and pathway scoring
The TPM-normalized expression matrix of the AD samples in GSE121212 was used for ssGSEA. Immune-cell signature scores and Hallmark pathway scores were calculated using the GSVA package27. The Hallmark gene sets were obtained from MSigDB file h.all.v2025.1.Hs.symbols.gmt. Spearman correlation analysis was used to evaluate associations between candidate-gene expression and the ssGSEA-derived scores. Benjamini–Hochberg correction was applied separately to the immune-cell and Hallmark correlation analyses, and adjusted p < 0.05 was considered statistically significant. These scores represent relative gene-set enrichment rather than directly measured immune-cell infiltration.
Molecular docking
Luteolin and β-sitosterol were selected because the active-component–target network linked luteolin with IFNG and β-sitosterol with PTGS2. The structures of luteolin (PubChem CID: 5280445) and β-sitosterol (PubChem CID: 222284) were downloaded from PubChem and energy-minimized using Chem3D. The structures of IFNG (PDB ID: 1EKU) and PTGS2 (PDB ID: 5F19) were obtained from the RCSB PDB database. Water molecules and original ligands were removed using PyMOL. Receptors were hydrogenated, and ligands were hydrogenated and assigned rotatable bonds using AutoDockTools. Semi-flexible docking was performed using AutoDock Vina, with exhaustiveness set to 8 and num_modes set to 9. For luteolin–IFNG, the grid center was (7.295, 33.860, 25.727), with 60 x 50 x 56 grid points and a spacing of 0.897 Å. For β-sitosterol–PTGS2, the grid center was (20.684, 37.716, 35.807), with 62 x 54 x 80 grid points and a spacing of 1.0 Å. Docking was used to predict possible binding poses and was not interpreted as verification of biological binding.
Laboratory verification
All cell-based experiments were performed using three independent biological replicates. Each biological replicate consisted of independently cultured and treated cells. Within each independent experiment, each CCK-8 concentration and each qPCR sample were measured in three technical wells, and the technical replicates were averaged to obtain one replicate-level value for statistical analysis.
Human immortalized HaCaT keratinocytes were cultured in high-glucose Dulbecco’s modified Eagle’s medium supplemented with 10% fetal bovine serum and 1% penicillin–streptomycin at 37 °C in a humidified atmosphere containing 5% CO2. Cells in the logarithmic growth phase were used for the subsequent experiments.
Purified dictamnine, a defined small-molecule constituent of Cortex Dictamni, rather than a crude Cortex Dictamni extract, was used in the cell experiments. Because dictamnine is a purified compound with a defined molecular weight, its concentrations were expressed in µM. Dictamnine was dissolved in DMSO, and the final DMSO concentration in the culture medium was maintained below 0.1%. Vehicle-control wells received an equivalent amount of DMSO. For the CCK-8 assay, HaCaT cells were seeded in 96-well plates at approximately 7 x 10³ cells per well. After cell attachment, the cells were treated with 0, 12.5, 25, 50, 100, 200, or 400 µM dictamnine for 48 h. Cell viability was determined using a CCK-8 assay by measuring absorbance at 450 nm. Each concentration was assessed using three technical wells in each of three independent biological experiments. Background absorbance was subtracted using the mean OD450 value of the blank wells, and cell viability was calculated as [(ODsample − ODblank)/(ODvehicle − ODblank)] x 100%. The half-maximal inhibitory concentration was estimated from replicate-level normalized viability values obtained from three independent biological experiments using least-squares nonlinear regression with a variable-slope log(inhibitor)-versus-normalized-response model, with the top and bottom constrained to 100% and 0%, respectively.
The qPCR experiment included five groups: vehicle control, 12.5 µM dictamnine alone, cytokine model, cytokine model plus 6.25 µM dictamnine, and cytokine model plus 12.5 µM dictamnine. HaCaT cells were seeded into 6-well plates at 5 x 10⁵ cells per well in 2 mL of complete culture medium and cultured for 24 h until approximately 70%–80% confluence before treatment. HaCaT cells in the dictamnine-treated groups were pretreated with dictamnine for 1 h and subsequently stimulated with recombinant human IFN-γ and TNF-α, each at 10 ng/mL, for 24 h28. Total RNA was independently extracted from three biological replicates consisting of separately cultured and treated cells. After treatment, the cells were washed twice with precooled sterile phosphate-buffered saline and lysed with 1 mL of a phenol–guanidinium-based RNA extraction reagent per well. Chloroform (200 µL) was added to each sample, followed by vigorous mixing for 15 s, incubation at room temperature for 3 min, and centrifugation at 12,000 x g for 15 min at 4 °C. The aqueous phase was transferred to a new RNase-free tube, mixed with an equal volume of isopropanol, and incubated at −20 °C for 30 min. RNA was collected by centrifugation at 12,000 x g for 10 min at 4 °C, washed with 1 mL of precooled 75% ethanol, and centrifuged at 7,500 x g for 5 min at 4 °C. The RNA pellet was air-dried for 5–10 min and dissolved in 30 µL of RNase-free water. RNA concentration and purity were measured using an ultra-micro spectrophotometer, and samples with an A260/A280 ratio of 1.8–2.1 were considered acceptable. Qualified total RNA was reverse-transcribed into cDNA in a total reaction volume of 20 µL. The reverse-transcription program consisted of incubation at 37 °C for 15 min followed by enzyme inactivation at 85 °C for 5 s. The resulting cDNA was stored at −20 °C until use. qPCR was performed using a SYBR Green-based master mix. Each 20 µL reaction contained 10 µL of SYBR Green qPCR mix, 0.4 µL of forward primer, 0.4 µL of reverse primer, 2 µL of diluted cDNA template, and 7.2 µL of RNase-free water. The amplification program consisted of initial denaturation at 95 °C for 3 min, followed by 40 cycles of denaturation at 95 °C for 10 s and annealing/extension at 60 °C for 30 s. Melt-curve analysis was performed at 95 °C for 15 s, 60 °C for 1 min, and 95 °C for 15 s to evaluate amplification specificity. Each biological sample was analyzed in three technical wells. The primer sequences are provided in Supplementary Table 1. GAPDH was used as the reference gene, and relative expression was calculated using the 2−ΔΔCt method. One relative-expression value from each independent biological experiment was included in the statistical analysis.
Statistical analysis
Statistical analysis was performed in R and GraphPad Prism. Spearman correlation analysis was used to evaluate associations between candidate-gene expression and ssGSEA-derived immune-cell or Hallmark scores. Benjamini–Hochberg correction was applied to transcriptomic, enrichment, GSEA, and correlation analyses. The CCK-8 dose–response curve and IC₅₀ were estimated using least-squares nonlinear regression with a variable-slope log(inhibitor)-versus-normalized-response model. The qPCR data were analyzed using ordinary two-way ANOVA with treatment group and target gene as factors, including the treatment-by-gene interaction term, followed by Tukey’s multiple-comparisons test for all pairwise comparisons among the five treatment groups within each target gene. Tukey-adjusted p values were used to determine statistical significance. For the CCK-8 and qPCR experiments, n = 3 represents three independent biological experiments. Three technical wells were included within each biological experiment and were averaged before statistical analysis; the technical wells were not treated as independent n values. A two-sided p < 0.05 was considered statistically significant.
결과
Construction of an active component-target network of Cortex Dictamni
A total of 18 active components of Cortex Dictamni were screened from the TCMSP database (Table 1). The TCMSP and UniProt databases were then used to retrieve the corresponding targets of these components, yielding 170 potential targets after removing duplicates. We obtained 1,450 AD-relevant targets from the GeneCards database. By intersecting with the two target sets, 88 overlapping targets were identified, as shown in the Venn diagram (Figure 1A). The gene expression profiles of these 88 targets were subsequently examined, and 43 DEGs were obtained, of which 14 DEGs were downregulated, and 29 DEGs were upregulated (Figure 1B). Finally, an active ingredient-target-network of Cortex Dictamni was established, comprising 43 target genes and 8 active ingredients (Figure 1C).
Construction of a PPI network
The 43 intersecting targets were submitted to the STRING database to construct a PPI network. The results showed that 42 targets had potential interactions, forming a tightly interconnected network (Figure 2A). Topology analysis and node importance ranking were performed using the MCC algorithm, which identified MMP9, CXCL8, TNF, and interleukin-related genes as central network nodes (Figure 2B). Then, KEGG pathway analysis showed that the targets were mainly enriched in TNF signaling pathway and IL-17 signaling pathway (Figure 2C). GO enrichment analysis demonstrated that the target genes were enriched in the response to molecules of bacterial origin and the response to lipopolysaccharide (Figure 2D).
Single-cell atlas of AD
The single-cell analysis yielded 19,094 high-quality cells that were annotated into 10 major cell types: natural killer cells, innate lymphoid cells, T cells, phagocytes, keratinocytes, B cells, endothelial cells, fibroblasts, smooth muscle cells, and melanocytes (Figure 3A–D). A total of 366 cell-type-specific DEGs met the criteria of |average log2 fold change| ≥ 0.5 and BH-adjusted p < 0.05. Intersection of these genes with 42 predicted Cortex Dictamni targets identified IRF1, PTGS2, TNF, and IFNG (Figure 3E). IRF1 was upregulated in natural killer cells (average log2 fold change = 0.525, adjusted p = 3.67 x 10⁻²⁵) and innate lymphoid cells (average log2 fold change = 0.576, adjusted p = 1.72 x 10−74). PTGS2 was upregulated in innate lymphoid cells (average log2 fold change = 0.836, adjusted p = 1.91 x 10−51), TNF was upregulated in T cells (average log2 fold change = 0.716, adjusted p = 3.71 x 10⁻¹⁵), and IFNG was downregulated in natural killer cells (average log2 fold change = −0.648, adjusted p = 5.97 x 10⁻⁶). KEGG analysis of the broader cell-type-specific DEG sets, rather than only the four candidate genes, identified significant ribosome-pathway enrichment across B cells, innate lymphoid cells, natural killer cells, phagocytes, and T cells (Figure 3F).
GSEA
Using nominal p < 0.05 and FDR q < 0.25 as the significance criteria, no GO Biological Process gene set remained significant for IFNG after multiple-testing correction. IRF1-high samples showed enrichment of monocyte chemotaxis (NES = 2.011, nominal p = 3.41 × 10⁻⁵, FDR q = 0.0759) and eosinophil chemotaxis (NES = 2.032, nominal p = 1.07 x 10⁻⁴, FDR q = 0.1217). PTGS2-low samples showed enrichment of anterograde axonal transport (NES = −2.295, nominal p = 1.82 x 10⁻⁶, FDR q = 0.0186). TNF-high samples showed enrichment of lymphocyte chemotaxis (NES = 2.057, nominal p = 2.05 x 10⁻⁵, FDR q = 0.0543) and regulation of neuron migration (NES = 2.053, nominal p = 9.57 x 10⁻⁵, FDR q = 0.1219) (Figure 4A–D).
Correlations between candidate genes and ssGSEA-derived immune-cell and pathway scores
BH-adjusted correlation analysis revealed gene-specific positive and negative associations between candidate-gene expression and ssGSEA-derived immune-cell scores (Figure 5A). Among the strongest significant associations, IFNG was positively correlated with effector memory CD4 T-cell scores (Spearman ρ = 0.632, adjusted p = 0.0048), IRF1 was positively correlated with plasmacytoid dendritic-cell scores (ρ = 0.602, adjusted p = 0.00835), and TNF was positively correlated with effector memory CD8 T-cell scores (ρ = 0.817, adjusted p = 2.2 x 10⁻⁵). PTGS2 was positively correlated with eosinophil scores (ρ = 0.647, adjusted p = 0.0048) but negatively correlated with gamma delta T-cell scores (ρ = −0.538, adjusted p = 0.0211). Although candidate-gene expression showed positive and negative correlations with several Hallmark pathway scores, none of these associations remained statistically significant after BH correction (Figure 5B). Therefore, the Hallmark correlations were interpreted as exploratory trends.
Molecular docking and laboratory verification
The active-component–target network supported the selection of luteolin–IFNG and β-sitosterol–PTGS2 for molecular docking. Molecular docking predicted binding scores of −7.3 kcal/mol for luteolin–IFNG and −9.0 kcal/mol for β-sitosterol–PTGS2. The predicted luteolin pose involved hydrogen-bond contacts with GLN48, LYS55, and LYS194 at distances of 2.1, 2.5, and 2.3 Å, respectively. The predicted β-sitosterol pose involved TRP139 and ASP229 at distances of 2.1 and 2.3 Å, respectively (Figure 6A,B, and Table 2). These results represent computationally predicted poses and do not verify direct biological binding.
Dictamnine reduced HaCaT cell viability in a concentration-dependent manner, with an estimated IC₅₀ of 59.15 µM (95% CI, 51.21–68.41 µM; R2 = 0.9671) after 48 h (Figure 7A). Because 12.5 µM maintained cell viability close to the vehicle-control level, 6.25 and 12.5 µM were selected for the subsequent low-dose experiments. Treatment with 12.5 µM dictamnine alone did not significantly alter IRF1, PTGS2, TNF, or IFNG mRNA expression compared with the vehicle control. TNF-α/IFN-γ stimulation significantly increased the relative mRNA levels of all four genes. Compared with the cytokine-model group, both 6.25 and 12.5 µM dictamnine significantly reduced the relative mRNA expression of IRF1, PTGS2, TNF, and IFNG, with lower mean expression values observed at 12.5 µM (Figure 7B).
The integrated analysis nominated IRF1, PTGS2, TNF, and IFNG as potential Cortex Dictamni-associated targets in AD and localized their differential expression to specific immune-cell populations. Molecular docking predicted possible luteolin–IFNG and β-sitosterol–PTGS2 binding poses. Low-dose dictamnine reduced cytokine-induced expression of the four genes in HaCaT cells. These findings provide hypothesis-generating evidence but do not establish direct target engagement, whole-herb efficacy, or clinical effectiveness.
DATA AVAILABILITY:
The publicly available transcriptomic datasets analyzed in this study are accessible through the Gene Expression Omnibus under accession numbers GSE121212 (https://www.ncbi.nlm.nih.gov/geo/query/acc.cgi?acc=GSE121212) and GSE180885 (https://www.ncbi.nlm.nih.gov/geo/query/acc.cgi?acc=GSE180885). The processed data, raw qPCR Ct values, raw OD450 readings and corresponding cell-viability calculations, figure source data, and analysis scripts supporting this study are available at https://www.jianguoyun.com/p/DRkf9k0Q0fW9Dhi6oasGIAA.
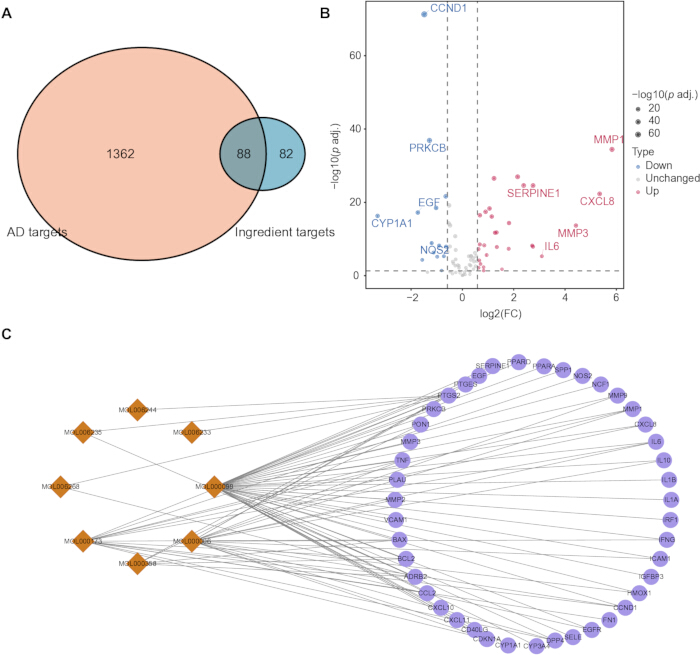
Figure 1: Construction of an active component-target network. (A) Venn diagram showing the overlap between predicted Cortex Dictamni targets and AD-related genes. (B) Volcano plot showing the differential expression of the 88 overlapping targets. (C) Active component–target network comprising eight active components and 43 differentially expressed target genes. Active components are shown as orange diamonds, and target genes are shown as purple circles. Abbreviations: AD = atopic dermatitis; FC = fold change; p adj. = Benjamini–Hochberg-adjusted p value. Please click here to view a larger version of this figure.
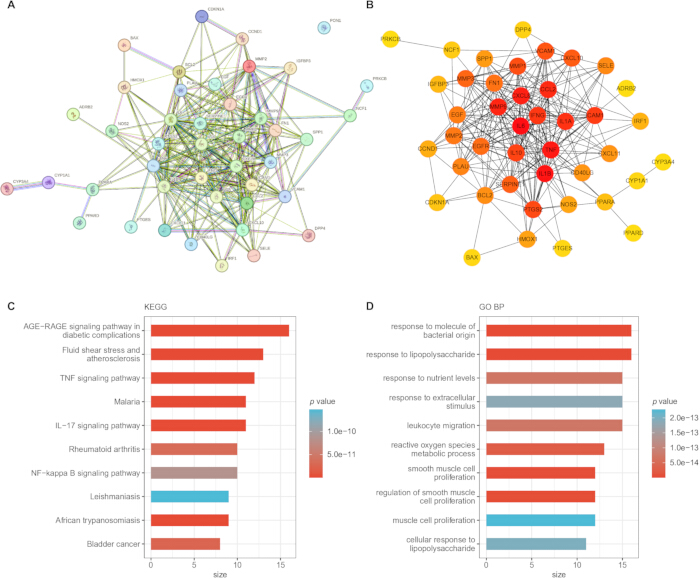
Figure 2: Protein-protein interaction (PPI) network and enrichment analysis. (A) PPI network of the 42 interacting targets. (B) Target ranking based on the maximal clique centrality (MCC) algorithm; nodes with higher MCC scores are shown in darker colors. (C) Kyoto Encyclopedia of Genes and Genomes (KEGG) pathway enrichment analysis. (D) Gene Ontology Biological Process (GO BP) enrichment analysis of the candidate targets. Abbreviations: AGE = advanced glycation end product; RAGE = receptor for advanced glycation end products; IL = interleukin; TNF = tumor necrosis factor; NF-κB = nuclear factor kappa B. Please click here to view a larger version of this figure.
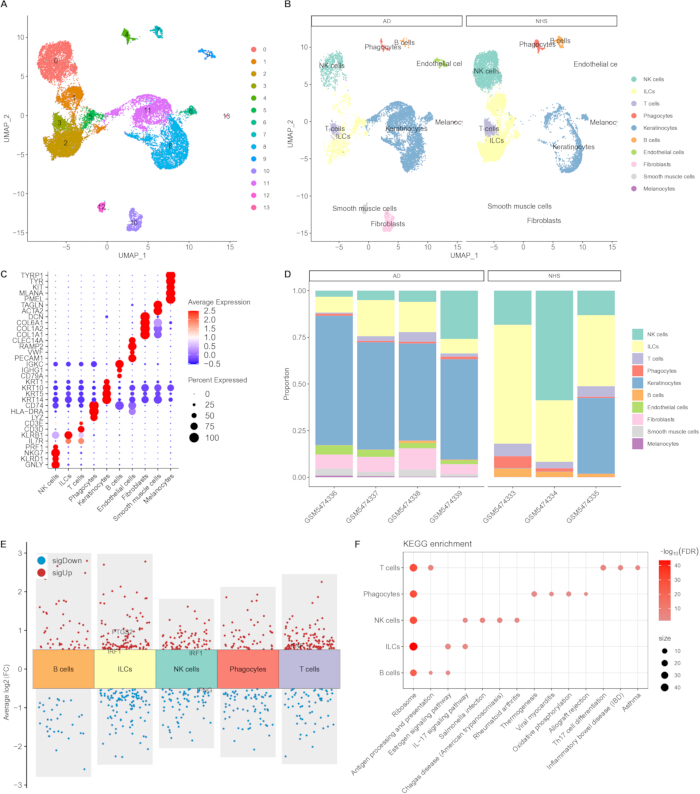
Figure 3: Single-cell data mapping analysis of atopic dermatitis. (A) UMAP visualization of transcriptionally distinct cell clusters. (B) UMAP visualization of the annotated major cell types in AD and normal human skin samples. (C) Expression of canonical marker genes used for cell-type annotation. (D) Relative proportions of the annotated cell types in individual samples. (E) Cell-type-specific DEGs and intersection of 366 DEGs with 42 predicted Cortex Dictamni targets, identifying IRF1, PTGS2, TNF, and IFNG. (F) KEGG enrichment analysis of the broader cell-type-specific DEG sets. Panel F does not represent enrichment analysis of only the four candidate genes. Abbreviations: AD = atopic dermatitis; NHS = normal human skin; UMAP = uniform manifold approximation and projection; NK = natural killer; ILC = innate lymphoid cell; DEG = differentially expressed gene; FC = fold change; FDR = false discovery rate; KEGG = Kyoto Encyclopedia of Genes and Genomes; IL = interleukin; Th17 = T helper 17; IBD = inflammatory bowel disease. Please click here to view a larger version of this figure.
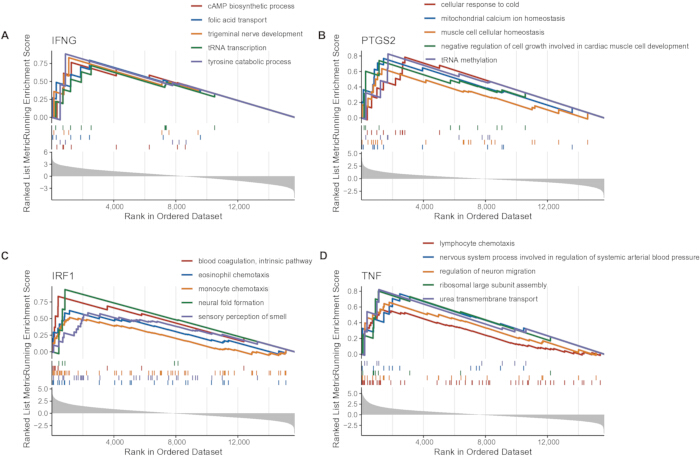
Figure 4: GSEA associated with candidate-gene expression. (A) GSEA associated with IFNG expression. (B) GSEA associated with PTGS2 expression. (C) GSEA associated with IRF1 expression. (D) GSEA associated with TNF expression. AD samples were divided into high- and low-expression groups according to the median expression of each candidate gene. Panels B–D show representative GO Biological Process gene sets meeting the criteria of nominal p < 0.05 and FDR q < 0.25. Panel A displays the leading IFNG-associated gene sets for completeness; none met the FDR q < 0.25 criterion, and these gene sets were not interpreted as statistically supported enrichment. Abbreviations: GSEA = gene set enrichment analysis; AD = atopic dermatitis; GO = Gene Ontology; FDR = false discovery rate; cAMP = cyclic adenosine monophosphate; tRNA = transfer RNA. Please click here to view a larger version of this figure.
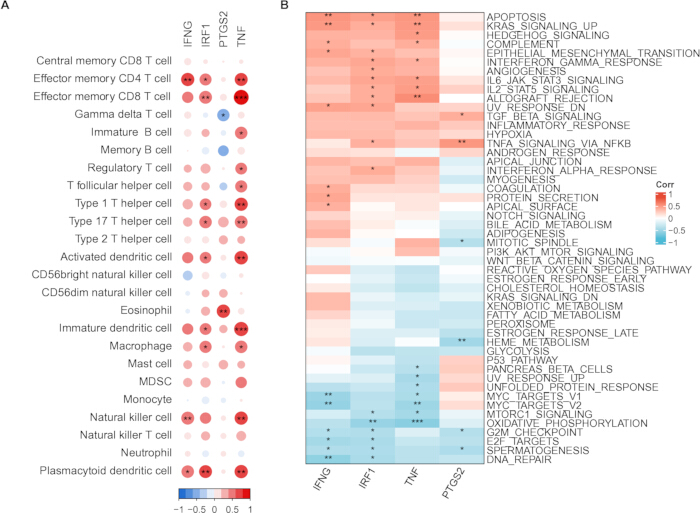
Figure 5: Correlation of candidate-gene expression with ssGSEA-derived scores. (A) Spearman correlations between candidate-gene expression and immune-cell signature scores. Bubble color represents Spearman’s ρ, and bubble size represents |ρ|. (B) Spearman correlations between candidate-gene expression and Hallmark pathway scores. None of the Hallmark correlations remained significant after BH correction. Significance symbols in panel A are based on BH-adjusted p values: *adjusted p < 0.05, **adjusted p < 0.01, and ***adjusted p < 0.001. ssGSEA scores represent relative gene-set enrichment rather than directly measured immune-cell infiltration. Abbreviations: ssGSEA = single-sample gene set enrichment analysis; BH = Benjamini–Hochberg; CD = cluster of differentiation; MDSC = myeloid-derived suppressor cell. Please click here to view a larger version of this figure.
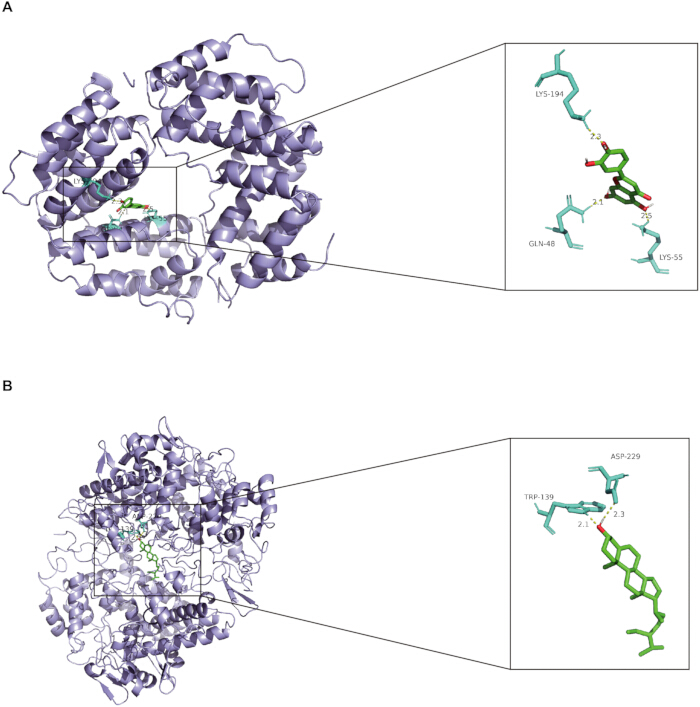
Figure 6: Predicted molecular-docking poses. (A) Predicted binding pose of luteolin with IFNG. (B) Predicted binding pose of β-sitosterol with PTGS2. Receptor proteins are shown in purple, ligands in green, interacting amino-acid residues in cyan, and predicted hydrogen bonds as yellow dashed lines. Numbers indicate predicted hydrogen-bond distances in Å. Docking represents computational prediction and does not verify direct biological binding. Abbreviations: LYS = lysine; GLN = glutamine; TRP = tryptophan; ASP = aspartic acid.Please click here to view a larger version of this figure.
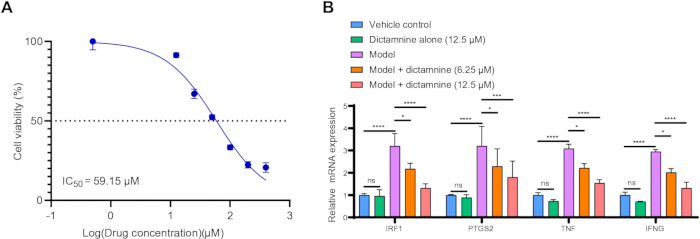
Figure 7: Low-dose validation of dictamnine in HaCaT keratinocytes. (A) Concentration–response relationship for HaCaT cell viability after 48 h of dictamnine exposure. The estimated IC₅₀ was 59.15 µM. (B) Relative mRNA expression of IRF1, PTGS2, TNF, and IFNG in the vehicle-control, 12.5 µM dictamnine-alone, cytokine-model, model plus 6.25 µM dictamnine, and model plus 12.5 µM dictamnine groups. The model was induced using TNF-α and IFN-γ at 10 ng/mL each. Gene expression was normalized to GAPDH using the 2−ΔΔCt method. Data are presented as the mean ± SD (n = 3 independent biological experiments for each concentration in panel A and n = 3 independent biological experiments for each treatment group in panel B). ns = not significant; *p < 0.05; **p < 0.01; ***p < 0.001; ****p < 0.0001. Abbreviations: IC₅₀ = half-maximal inhibitory concentration; mRNA = messenger RNA; TNF-α = tumor necrosis factor alpha; IFN-γ = interferon gamma; GAPDH = glyceraldehyde-3-phosphate dehydrogenase; Ct = cycle threshold; SD = standard deviation. Please click here to view a larger version of this figure.
| Mol ID | Molecule Name | MW | AlogP | Hdon | Hacc | OB (%) | Caco-2 | BBB | DL | FASA- | HL | |
| MOL000173 | wogonin | 284.28 | 2.59 | 2 | 5 | 30.68 | 0.79 | 0.04 | 0.23 | 0.32 | 17.75 | |
| MOL002663 | skimmianin | 259.28 | 2.33 | 0 | 5 | 40.14 | 1.26 | 1.1 | 0.2 | 0.14 | -2.43 | |
| MOL000358 | beta-sitosterol | 414.79 | 8.08 | 1 | 1 | 36.91 | 1.32 | 0.99 | 0.75 | 0.23 | 5.36 | |
| MOL005043 | campest-5-en-3beta-ol | 400.76 | 7.63 | 1 | 1 | 37.58 | 1.32 | 0.94 | 0.71 | 0.23 | 4.43 | |
| MOL000006 | luteolin | 286.25 | 2.07 | 4 | 6 | 36.16 | 0.19 | -0.84 | 0.25 | 0.39 | 15.94 | |
| MOL006233 | 3'-O-methyl taxifolin | 318.3 | 1.74 | 4 | 7 | 48.36 | -0.11 | -0.76 | 0.3 | 0.34 | 14.86 | |
| MOL006235 | dasycarpamin | 303.39 | 3.9 | 1 | 5 | 59.14 | 1.01 | 0.61 | 0.21 | 0.19 | 2.19 | |
| MOL006236 | Limonin diosphenol | 484.54 | 1.09 | 1 | 9 | 91.69 | -0.19 | -0.72 | 0.55 | 0.31 | -3.24 | |
| MOL006244 | (1R,4R,6S,8aR)-1-(3-furyl)-4,6-dihydroxy-5,8a-dimethyl-4,6,7,8-tetrahydro-1H-isochromen-3-one | 278.33 | 1.38 | 2 | 5 | 49.09 | -0.06 | -0.4 | 0.19 | 0.27 | -11.68 | |
| MOL006257 | dictamnusine_qt | 278.33 | 1.53 | 2 | 5 | 69.27 | 0.21 | 0.06 | 0.19 | 0.27 | -11.1 | |
| MOL006261 | isomaculosidine | 259.28 | 2.36 | 0 | 5 | 31.99 | 0.92 | 0.69 | 0.2 | 0.15 | 12.96 | |
| MOL006262 | 7alpha-acetylobacunol | 498.62 | 3.1 | 0 | 8 | 36.08 | 0.02 | -0.6 | 0.71 | 0.29 | -11.88 | |
| MOL013352 | obacunone | 454.56 | 2.68 | 0 | 7 | 43.29 | 0.01 | -0.43 | 0.77 | 0.31 | -13.04 | |
| MOL006268 | preskimmianine | 303.39 | 2.54 | 1 | 5 | 42.14 | 0.89 | 0.53 | 0.21 | 0.22 | 1.64 | |
| MOL006270 | tirucallane | 426.8 | 7.93 | 1 | 1 | 44.02 | 1.42 | 1.08 | 0.75 | 0.26 | 5.97 | |
| MOL006271 | trichirubine,b | 560.74 | 3.35 | 1 | 7 | 35.51 | 0.04 | -0.76 | 0.27 | 0.31 | 19.24 | |
| MOL006272 | 9alpha-hydroxyfraxinellone-9-o-beta-d-glucoside | 424.49 | 0.47 | 4 | 9 | 55.52 | -0.88 | -1.28 | 0.62 | 0.24 | -6.45 | |
| MOL000098 | quercetin | 302.25 | 1.5 | 5 | 7 | 46.43 | 0.05 | -0.77 | 0.28 | 0.38 | 14.4 | |
Table 1: Active compounds of Cortex Dictamni and their pharmacokinetic properties. Compounds retained using oral bioavailability ≥ 30% and drug likeness ≥ 0.18 are listed together with the pharmacokinetic information used for compound screening.
| Compound | PubChem CID | TCMSP ID | Target | PDB ID | Grid center (x, y, z) | Grid points | Spacing (Å) | Binding energy (kcal/mol) | Predicted hydrogen-bond interactions |
| Luteolin | 5280445 | MOL000006 | IFNG | 1EKU | 7.295, 33.860, 25.727 | 60 x 50 x 56 | 0.897 | −7.3 | GLN48 (2.1 Å); LYS55 (2.5 Å); LYS194 (2.3 Å) |
| β-Sitosterol | 222284 | MOL000358 | PTGS2 | 5F19 | 20.684, 37.716, 35.807 | 62 x 54 x 80 | 1 | −9.0 | TRP139 (2.1 Å); ASP229 (2.3 Å) |
Table 2: Molecular docking results and parameters. Predicted binding energies, docking-grid settings, interacting residues, and hydrogen-bond distances are shown for luteolin–IFNG and β-sitosterol–PTGS2. Docking was performed using AutoDock Vina with exhaustiveness = 8 and num_modes = 9. Abbreviations: CID = compound identifier; TCMSP = Traditional Chinese Medicine Systems Pharmacology Database and Analysis Platform; PDB = Protein Data Bank; IFNG = interferon gamma; PTGS2 = prostaglandin-endoperoxide synthase 2; GLN = glutamine; LYS = lysine; TRP = tryptophan; ASP = aspartic acid.
Supplementary Table 1: Primer sequences used for qPCR. Forward and reverse primer sequences are listed for GAPDH, IRF1, PTGS2, TNF, and IFNG. Abbreviation: qPCR = quantitative polymerase chain reaction.Please click here to download this file.
토론
AD is a chronic inflammatory skin disease characterized by pruritus, recurrent eczematous lesions, and skin-barrier dysfunction29. Current treatment options include topical anti-inflammatory agents, systemic immunomodulatory therapies, biologics, and small-molecule inhibitors30. Network pharmacology and transcriptomic analyses were applied to systematically investigate potential Cortex Dictamni-associated targets in AD. Compared with the previous network-pharmacology study, the present study additionally incorporated bulk and single-cell transcriptomic analyses, GSEA, ssGSEA-based scoring, molecular docking, and low-dose cellular validation. The ssGSEA analysis identified candidate-gene associations with relative immune-cell signature scores rather than directly measured immune-cell infiltration. Molecular docking predicted possible luteolin–IFNG and β-sitosterol–PTGS2 binding poses but did not verify biological binding.
Four key targets, IRF1, PTGS2, TNF, and IFNG, have been identified in the target network of Cortex Dictamni and AD. Studies reported overexpressed IRF1 in the skin tissue of AD patients and the association between IRF1 and activated dendritic cells in AD31. In human keratinocytes, IL-18 has been shown to enhance IFN-γ-induced production of CXCL9, CXCL10, and CXCL11, supporting the involvement of interferon-responsive chemokine signaling in cutaneous inflammation32. IFNG, an important inflammatory factor, has been found to be upregulated in AD lesions33. Experimental evidence further indicates that IFN-γ can promote keratinocyte apoptosis in AD through miR-29b-mediated inhibition of Bcl2L234. Low IFNG expression has been associated with extrinsic atopic dermatitis, higher risk of atopic complications and epidermal lipid synthesis disorders, while high IFNG expression is associated with aging and activation of additional pro-inflammatory pathways35. TNF, particularly TNF-α, is an inflammatory cytokine produced by macrophages/monocytes during acute inflammation. TNF is an important pro-inflammatory cytokine that participates in cutaneous inflammatory responses. PTGS2 encodes COX-2 and contributes to prostaglandin synthesis and inflammatory signaling. In the present single-cell analysis, IRF1 was upregulated in innate lymphoid cells and natural killer cells, PTGS2 was upregulated in innate lymphoid cells, TNF was upregulated in T cells, and IFNG was downregulated in natural killer cells. These results indicate that candidate-gene dysregulation was cell-type dependent rather than uniform across the AD immune microenvironment. The ribosome-pathway enrichment shown in Figure 3F was derived from the broader cell-type-specific DEG sets, rather than enrichment analysis of only IRF1, PTGS2, TNF, and IFNG. Because ribosomal enrichment is frequently observed in single-cell differential-expression analyses, this result should be interpreted cautiously.
The enrichment and correlation analyses suggested candidate-gene-specific associations rather than a single uniform mechanism. IRF1-high AD samples showed enrichment of monocyte and eosinophil chemotaxis, PTGS2-low samples showed enrichment of anterograde axonal transport, and TNF-high samples showed enrichment of lymphocyte chemotaxis and regulation of neuron migration, whereas no IFNG-associated GO Biological Process gene set met the prespecified FDR criterion. The ssGSEA analysis likewise identified mixed positive and negative associations between candidate-gene expression and selected immune-cell signature scores. These associations reflect relative gene-set enrichment and should not be interpreted as direct measurements of immune-cell abundance or as evidence of causality. Luteolin and β-sitosterol were selected for docking according to the active-component–target network. The predicted luteolin–IFNG and β-sitosterol–PTGS2 poses provide hypotheses for further experimental testing but do not demonstrate direct binding or target engagement.
The safety profile of Cortex Dictamni also requires careful consideration. Cortex Dictamni and some of its furan-containing constituents have been associated with hepatotoxicity, and their risks may vary with dose, exposure duration, route of administration, and chemical composition. Experimental studies have indicated that metabolic activation of the furan ring and subsequent reactive-metabolite formation may contribute to dictamnine-associated liver injury36. Although the low dictamnine concentrations used in the present study were selected according to the HaCaT cell viability curve, this in vitro experiment was not designed to establish systemic or clinical safety. Standardized chemical characterization and dose-dependent safety evaluation are therefore required in future studies.
Several limitations should be acknowledged. First, the computational analyses were based on a limited number of publicly available samples and require validation in independent AD cohorts. Second, ssGSEA estimates relative enrichment of predefined gene signatures rather than directly measuring immune-cell abundance. Third, several nominal GSEA findings did not remain significant after FDR correction and should be regarded as exploratory. Fourth, molecular docking predicts energetically favorable poses but does not demonstrate direct target engagement. Fifth, the cellular validation used purified dictamnine and therefore cannot establish the biological activity of the complete Cortex Dictamni herb. Finally, the experimental validation was limited to mRNA measurements in a single keratinocyte model and did not include protein-level confirmation, target-specific perturbation, a positive anti-inflammatory control, or in vivo validation.
Collectively, this integrative study nominates IRF1, PTGS2, TNF, and IFNG as potential Cortex Dictamni-associated targets in AD and identifies their cell-type-specific expression and immune-related associations. Low-dose dictamnine reduced cytokine-induced expression of the four genes in HaCaT cells, providing preliminary mRNA-level support for the computational findings. However, the results do not demonstrate clinical efficacy, direct target engagement, or the activity of the complete Cortex Dictamni herb. Further protein-level, mechanistic, in vivo, and clinical studies are required.
공개 사항
The authors declare that they have no known competing financial interests or personal relationships that could have appeared to influence the work reported in this paper.
감사의 글
Not applicable.
재료
| 이름 | 회사 | 카탈로그 번호 | 댓글 |
|---|---|---|---|
| AutoDock Vina | The Scripps Research Institute | Version 1.1.2 | Molecular-docking engine; RRID:SCR_011958 |
| AutoDockTools | The Scripps Research Institute | Version 1.5.7 | Receptor and ligand preparation; RRID:SCR_026401 |
| Cell Counting Kit-8 | Beyotime Biotechnology, Shanghai, China | C0039 | WST-8 cell-viability assay; absorbance measured at 450 nm |
| CellMarker 2.0 | Harbin Medical University | Version 2.0 | Cell-marker database; http://bio-bigdata.hrbmu.edu.cn/CellMarker/; accessed February 2026 |
| Chem3D | PerkinElmer Informatics | Version 19.0 | Ligand structure preparation |
| clusterProfiler | Bioconductor | Version 4.10.0 | Functional-enrichment and GSEA analysis; RRID:SCR_016884 |
| cytoHubba | Cytoscape App Store | Version 0.1 | Hub-node ranking plugin; RRID:SCR_017677 |
| Cytoscape | Cytoscape Consortium | Version 3.7.1 | Network visualization and analysis; RRID:SCR_003032 |
| DESeq2 | Bioconductor | Version 1.42.0 | Bulk RNA-seq differential-expression analysis; RRID:SCR_015687 |
| Dictamnine | Sigma-Aldrich | PHL80583 | Purified compound used for cell treatment; CAS 484-29-7; molecular weight 199.21. |
| Dimethyl sulfoxide | Sigma-Aldrich | D8418 | Solvent for dictamnine; an equal amount was added to the vehicle-control group; final concentration maintained below 0.1% |
| DNase I, RNase-free | Thermo Scientific | EN0521 | RNase-free DNase I used during RNA preparation. |
| Dulbecco's modified Eagle's medium, high glucose | Baidi Biotechnology, China | L100-500 | High-glucose cell-culture medium; supplemented with 10% fetal bovine serum and 1% penicillin–streptomycin |
| Fetal bovine serum | Baidi Biotechnology, China | F801-500 | Used at 10% (v/v) in the cell-culture medium |
| GENCODE human gene annotation | GENCODE Consortium | Release 22 | Human protein-coding gene annotation; RRID:SCR_014966 |
| Gene Expression Omnibus | National Center for Biotechnology Information | GSE121212; GSE180885 | Public, de-identified datasets; RRID:SCR_005012 |
| GeneCards | Weizmann Institute of Science | Accessed February 2026 | Human gene database; RRID:SCR_002773; https://www.genecards.org/ |
| GraphPad Prism | GraphPad Software, LLC | Version 10.6.1.892 | Nonlinear regression, ANOVA, multiple-comparison testing, and figure preparation; RRID:SCR_002798 |
| GSVA | Bioconductor | Version 1.50.5 | Gene-set variation analysis/ssGSEA package; Bioconductor 3.18; RRID:SCR_021058 |
| HaCaT human keratinocyte cell line | Cell Bank of Chinese Academy of Sciences, Shanghai, China | GNHu64 | Established human cell line; RRID:CVCL_0038 |
| Harmony | Immunogenomics/Broad Institute | Version 1.2.0 | Sample-associated batch correction in single-cell analysis; RRID:SCR_022206 |
| Human interferon gamma, recombinant | Beyotime Biotechnology, Shanghai, China | P5664 | Used at 10 ng/mL |
| Human tumor necrosis factor alpha, recombinant | Sigma-Aldrich | H8916 | Recombinant cytokine used for establishment of the inflammatory cell model |
| Kyoto Encyclopedia of Genes and Genomes | Kanehisa Laboratories | Accessed February 2026 | KEGG pathway database; RRID:SCR_012773; https://www.genome.jp/kegg/ |
| Molecular Signatures Database Hallmark gene sets | Broad Institute | h.all.v2025.1.Hs.symbols.gmt | Hallmark gene-set collection; RRID:SCR_016863 |
| org.Hs.eg.db | Bioconductor | Version 3.18.0 | Human genome-wide annotation package; RRID:SCR_024739 |
| SYBR Green qPCR Kit | APE-BIO | K1170-25 | SYBR Green-based quantitative real-time PCR reagent |
| Penicillin–streptomycin solution | Baidi Biotechnology, China | A200-100 | Used at 1% (v/v) in the complete cell-culture medium |
| Phosphate-buffered saline | Biosharp | BL601A | Sterile phosphate-buffered saline, pH 7.2–7.4, used for cell washing |
| PubChem | National Center for Biotechnology Information | CID 5280445; CID 222284 | Compound structures; RRID:SCR_004284; https://pubchem.ncbi.nlm.nih.gov/ |
| PyMOL | Schrodinger, LLC | Version 3.0.3 | Molecular visualization; RRID:SCR_000305 |
| R | R Foundation for Statistical Computing | Version 4.3.3 | Statistical computing environment; RRID:SCR_001905 |
| RCSB Protein Data Bank | Research Collaboratory for Structural Bioinformatics | PDB 1EKU; PDB 5F19 | Protein structures; RRID:SCR_012820; https://www.rcsb.org/ |
| cDNA Reverse Transcription Kit | Yishan Biotechnology, China | RT001 | Used for reverse transcription of total RNA into cDNA |
| sctransform | CRAN/Satija Lab | Version 0.4.1 | Variance-stabilizing normalization used through Seurat SCTransform; RRID:SCR_022146 |
| Serum-free cell-freezing medium | Baidi Biotechnology, China | A400-100 | Used for cryopreservation of HaCaT cells |
| Seurat | Satija Lab | Version 5.0.1 | Single-cell quality control, normalization, dimensionality reduction, clustering, and differential-expression analysis; RRID:SCR_007322 |
| STRING | STRING Consortium | Version 12.0 | Protein-protein association network database; RRID:SCR_005223; https://version-12-0.string-db.org/ |
| Traditional Chinese Medicine Systems Pharmacology Database and Analysis Platform | TCMSP | Accessed February 2026 | Compound and predicted-target retrieval; https://www.tcmsp-e.com/tcmsp.php |
| Trypsin–EDTA solution, 0.25% | Baidi Biotechnology, China | A300-100 | Used for cell detachment and passaging |
| RNA Extraction Reagent | Yishan Biotechnology, China | RN001 | Phenol–guanidinium-based reagent used for total RNA extraction |
| UniProt | UniProt Consortium | Accessed February 2026 | Protein knowledgebase; RRID:SCR_002380; https://www.uniprot.org/ |
참고문헌
- Sroka-Tomaszewska J, Trzeciak M. Molecular Mechanisms of Atopic Dermatitis Pathogenesis. Int J Mol Sci. 2021;22(8):4130.
- Langan SM, Irvine AD, Weidinger S. Atopic dermatitis. Lancet. 2020;396(10247):345-360.
- David Boothe W, Tarbox JA, Tarbox MB. Atopic Dermatitis: Pathophysiology. Adv Exp Med Biol. 2017;1027:21-37.
- Xiao T, Sun M, Zhao C, Kang J. TRPV1: A promising therapeutic target for skin aging and inflammatory skin diseases. Front Pharmacol. 2023;14:1037925.
- Ramírez-Marín HA, Silverberg JI. Differences between pediatric and adult atopic dermatitis. Pediatr Dermatol. 2022;39(3):345-353.
- Sidbury R, et al. Guidelines of care for the management of atopic dermatitis in adults with topical therapies. J Am Acad Dermatol. 2023;89(1):e1-e20.
- Frazier W, Bhardwaj N. Atopic Dermatitis: Diagnosis and Treatment. Am Fam Physician. 2020;101(10):590-598.
- Gatmaitan JG, Lee JH. Challenges and Future Trends in Atopic Dermatitis. Int J Mol Sci. 2023;24(14):11380.
- Zhang S, et al. Advances in the Application of Traditional Chinese Medicine Using Artificial Intelligence: A Review. Am J Chin Med. 2023;51(5):1067-1083.
- Guan W, Qi W. Ginsenoside Rh2: A shining and potential natural product in the treatment of human nonmalignant and malignant diseases in the near future. Phytomedicine. 2023;118:154938.
- Song XY, et al. Quality control of traditional Chinese medicines: a review. Chin J Nat Med. 2013;11(6):596-607.
- Xu Q, et al. Therapeutic Implications of Traditional Chinese Medicine in Clinically Relevant Diseases: Perspectives From microRNA-Modulated Apoptotic Signaling. Drug Des Devel Ther. 2025;19:6719-6749.
- Qin Y, et al. The traditional uses, phytochemistry, pharmacology and toxicology of Dictamnus dasycarpus: a review. J Pharm Pharmacol. 2021;73(12):1571-1591.
- Chou WL, et al. Topical delivery of bioactive compounds from Cortex Dictamni alleviates atopic dermatitis-like lesion by inhibiting the activation of keratinocytes, macrophages, and basophils: Dictamnine versus fraxinellone. Int Immunopharmacol. 2024;143(Pt 2):113486.
- Yang N, Shao H, Deng J, Liu Y. Network pharmacology-based analysis to explore the therapeutic mechanism of Cortex Dictamni on atopic dermatitis. J Ethnopharmacol. 2023;304:116023.
- Ye L, et al. Unraveling the complex pathophysiology of white matter hemorrhage in intracerebral stroke: A single-cell RNA sequencing approach. CNS Neurosci Ther. 2024;30(3):e14652.
- Yu Y, et al. Identification of oxidative stress signatures of lung adenocarcinoma and prediction of patient prognosis or treatment response with single-cell RNA sequencing and bulk RNA sequencing data. Int Immunopharmacol. 2024;137:112495.
- Xu X, Jackson D. Single-cell analysis opens a goldmine for plant functional studies. Curr Opin Biotechnol. 2023;79:102858.
- Zheng H, et al. Bioinformatics identification of forkhead box O3 and the proto-oncogene tyrosine-protein kinase receptor RET as aging-associated biomarkers linked to immune cell infiltration in Parkinson's disease. CytoJournal. 2026;23:38.
- Hafemeister C, Satija R. Normalization and variance stabilization of single-cell RNA-seq data using regularized negative binomial regression. Genome Biol. 2019;20(1):296.
- Korsunsky I, et al. Fast, sensitive and accurate integration of single-cell data with Harmony. Nat Methods. 2019;16(12):1289-1296.
- Hu C, et al. CellMarker 2.0: an updated database of manually curated cell markers in human/mouse and web tools based on scRNA-seq data. Nucleic Acids Res. 2023;51(D1):D870-D876.
- Ru J, et al. TCMSP: a database of systems pharmacology for drug discovery from herbal medicines. J Cheminform. 2014;6:13.
- Love MI, Huber W, Anders S. Moderated estimation of fold change and dispersion for RNA-seq data with DESeq2. Genome Biol. 2014;15(12):550.
- Majeed A, Mukhtar S. Protein-Protein Interaction Network Exploration Using Cytoscape. Methods Mol Biol. 2023;2690:419-427.
- Szklarczyk D, et al. The STRING database in 2023: protein-protein association networks and functional enrichment analyses for any sequenced genome of interest. Nucleic Acids Res. 2023;51(D1):D638-D646.
- Hänzelmann S, Castelo R, Guinney J. GSVA: gene set variation analysis for microarray and RNA-seq data. BMC Bioinformatics. 2013;14:7.
- Kwon YJ, Kwon HH, Leem J, Jang YY. Kahweol Inhibits Pro-Inflammatory Cytokines and Chemokines in Tumor Necrosis Factor-α/Interferon-γ-Stimulated Human Keratinocyte HaCaT Cells. Curr Issues Mol Biol. 2024;46(4):3470-3483.
- Afshari M, et al. Unraveling the skin; a comprehensive review of atopic dermatitis, current understanding, and approaches. Front Immunol. 2024;15:1361005.
- Lovell K, Patel N, Rao S, Strowd LC. The Future of Atopic Dermatitis Treatment. Adv Exp Med Biol. 2024;1447:227-244.
- Liu X, et al. Identification of IRF1 as a Novel Pyroptosis-Related Prognostic Biomarker of Atopic Dermatitis. Genet Test Mol Biomarkers. 2023;27(12):370-383.
- Kanda N, Shimizu T, Tada Y, Watanabe S. IL-18 enhances IFN-gamma-induced production of CXCL9, CXCL10, and CXCL11 in human keratinocytes. Eur J Immunol. 2007;37(2):338-350.
- Zhou J, et al. Single-cell RNA-seq reveals abnormal differentiation of keratinocytes and increased inflammatory differentiated keratinocytes in atopic dermatitis. J Eur Acad Dermatol Venereol. 2023;37(11):2336-2348.
- Gu C, Li Y, Wu J, Xu J. IFN-γ-induced microRNA-29b up-regulation contributes to keratinocyte apoptosis in atopic dermatitis through inhibiting Bcl2L2. Int J Clin Exp Pathol. 2017;10(10):10117-10126.
- Wasserer S, et al. Characterization of High and Low IFNG-Expressing Subgroups in Atopic Dermatitis. Int J Mol Sci. 2024;25(11):6158.
- Luo Q, et al. Role of covalent modification by hepatic aldehydes in dictamnine-induced liver injury. Toxicol Lett. 2024;392:12-21.