본 연구는 적응형 시뮬레이티드 어닐링(adaptive simulated annealing), 단계별 제안 선택(stage-dependent proposal selection) 및 재가열 제어(reheating control)를 결합하여 몰입형 전시 레이아웃을 최적화하는 재현 가능한 워크플로를 제시합니다. 선택된 레이아웃은 가상현실 전시 환경에 구현되었으며, 공간 비용 메트릭, 참가자 행동 로그 및 경험 후 평가를 통해 검증되었습니다.
이 논문에서
요약
초록
몰입형 전시 공간은 효율적인 동선, 명확한 길 찾기, 균형 잡힌 상호작용 및 쾌적한 환경 경험을 지원하는 배치가 필요합니다. 그러나 전시 배치는 흔히 수동적인 설계 결정 과정을 통해 개발되므로 이동 거리, 시각적 접근성, 혼잡 위험, 환경적 쾌적함 및 상호작용 노드 분포를 동시에 평가하는 데 어려움이 있습니다. 본 연구에서는 단계별 제안 선택 및 재가열 제어가 적용된 적응형 시뮬레이티드 어닐링(adaptive simulated annealing) 기반의 공간 설계 최적화 워크플로우를 개발하고 평가하였습니다. 36 m x 24 m 크기의 몰입형 전시홀 내에 6개의 테마 구역, 전이 복도, 1개의 휴게 구역 및 다수의 상호작용 노드를 구성하였습니다. 수동 배치, 표준 시뮬레이티드 어닐링 배치, 재가열 기능이 포함된 적응형 시뮬레이티드 어닐링 배치의 세 가지 배치 조건을 비교하였습니다. 최적화 모델은 보행 거리, 시각적 접근성, 혼잡도, 환경적 쾌적함 및 상호작용 균형을 통합한 가중 공간 비용 함수를 최소화하였습니다. 선택된 배치안들을 가상 현실 전시 씬으로 구현하였으며, 참여자의 행동 로그와 경험 후 평가를 통해 검증하였습니다. 적응형 알고리즘은 표준 시뮬레이티드 어닐링보다 계산 시간은 약간 증가하였으나, 더 낮은 최종 공간 비용, 더 높은 개선율, 그리고 최적 해에 도달하기까지 더 적은 반복 횟수를 기록하였습니다. 적응형 배치를 경험한 참여자들은 더 높은 만족도, 더 강한 실재감, 더 명확한 길 찾기, 더 낮은 체감 혼잡도 및 더 낮은 인지 부하를 보고하였으며, 더 짧은 보행 거리, 더 적은 주저함, 더 긴 체류 시간 및 더 넓은 히트맵 커버리지로 경로를 완료하였습니다. 이러한 결과는 본 워크플로우가 테스트된 전시 시나리오에 대한 의사결정 지원 접근법으로서 유효함을 뒷받침하며, 이것이 보편적으로 최적의 전시 배치이거나 모든 대안적 메타휴리스틱보다 우월함을 입증하는 것은 아닙니다.
서론
몰입형 전시 공간은 공간 디자인, 디지털 미디어, 인터랙티브 디스플레이 및 가상 현실 기술을 점점 더 많이 결합하여, 관람객이 단순히 콘텐츠를 관찰하는 것이 아니라 공간적 경험으로서 전시를 통해 이동하고 반응하며 해석하는 환경을 조성하고 있습니다. 이러한 환경에서 경험의 질은 시각적 또는 인터랙티브 콘텐츠의 풍부함뿐만 아니라 경로의 연속성, 가시성, 혼잡도, 환경적 쾌적함 및 상호작용 기회의 분포에 따라 달라집니다. 따라서 전시 공간 디자인은 다변수 문제를 수반합니다. 즉, 레이아웃은 내러티브 순서, 지각적 개방성 및 참여 기회를 유지하면서 관람객을 효율적으로 안내해야 합니다. 박물관 및 전시 행동에 관한 연구들은 관람객의 경험이 단순히 전시 콘텐츠만이 아니라 공간 조직, 동선 구조 및 해석적 접근성에 의해 형성된다는 점을 오랫동안 보여주었습니다1.
공간 구성 이론(Spatial-configuration theory)은 전시 배치를 분석 가능한 설계 문제로 다루기 위한 유용한 기초를 제공합니다. 이러한 관점에서 공간은 단순히 객체를 담는 수동적인 용기가 아니라, 이동, 조우, 가시성 및 선택을 조직하는 역할을 합니다. 건축적 구성은 사람들이 환경 내에서 이동하는 방식과 공간 간의 관계를 얼마나 쉽게 이해하는지에 영향을 미칠 수 있습니다2. 가시성 기반 공간 분석은 시야와 시선 관계를 공간 인지 및 내비게이션의 측정 가능한 특징으로 모델링할 수 있음을 보여줌으로써 이러한 관점을 더욱 뒷받침합니다3. 이러한 개념들은 관람객이 전시를 관람하며 이동하는 동안 시각적 정보, 경로 결정, 상호작용 단서 및 환경적 자극을 지속적으로 통합해야 하는 몰입형 전시에서 특히 중요합니다.
동시에, 몰입형 기술은 물리적 구현 이전에 전시 환경을 설계하고 테스트할 수 있는 방법을 확장시켰습니다. 가상 및 몰입형 인터페이스를 통해 연구자와 설계자는 제어된 공간 조건에서 사용자가 어떻게 인식하고 행동하는지 조사할 수 있으며, 콘텐츠와 환경 설정을 일정하게 유지하면서 대안적인 레이아웃을 비교 분석할 수 있습니다4. 몰입형 가상 현실 애플리케이션에 대한 검토 결과, 공간 구조, 상호작용 설계 및 과업의 명확성이 사용자 참여도와 학습 품질을 결정하는 중요한 요인임이 밝혀졌습니다5. 또한 메타 분석 증거에 따르면 몰입의 수준과 유형이 현존감에 영향을 미칠 수 있으나, 환경 구성이 부실하거나 탐색이 어려운 경우 몰입 그 자체만으로는 더 나은 결과를 보장하지 않습니다6.
몰입형 전시의 사용자 경험은 실재감, 인지 부하 및 신체적 편안함과 밀접하게 연관되어 있습니다. 실재감은 사용자가 매개된 환경 내에 위치해 있다고 느끼는 정도를 반영하며, 이는 가상 및 몰입형 환경에서 핵심적인 결과 지표가 됩니다7. 그러나 내비게이션, 상호작용 또는 감각 정보가 적절하게 조정되지 않을 경우, 몰입형 환경은 인지적 부담을 초래할 수 있습니다8. 이러한 이유로 전시 공간 최적화는 단순히 상호작용 밀도나 시각적 자극을 높이는 것에 그쳐서는 안 됩니다. 일관된 공간 경험을 지원하고, 불필요한 경로 결정을 줄이며, 피할 수 있는 피로도를 최소화해야 합니다. 또한, 불편함은 가상현실 노출의 안전성과 사용자 경험 결과의 해석 모두에 영향을 미칠 수 있으므로 시뮬레이터 멀미 또한 반드시 모니터링해야 합니다9.
이러한 요구 사항에도 불구하고, 많은 전시 레이아웃은 여전히 디자이너의 경험, 반복적인 수동 조정 또는 사후 방문객 관찰을 통해 개발됩니다. 이러한 접근 방식은 여전히 가치가 있지만, 여러 레이아웃 제약 조건을 동시에 평가하는 것을 어렵게 만듭니다. 몰입형 전시를 위한 공간 디자인은 경로 길이, 가시성, 혼잡도, 쾌적성 및 상호작용 분포를 공동으로 고려하는 제약 최적화 문제로 공식화할 수 있습니다. 시뮬레이티드 어닐링(Simulated annealing)은 크고 불규칙한 해 공간을 탐색하는 동시에 개선되지 않는 중간 해의 수용을 제어할 수 있어 국소 최적해(local optima)를 벗어나는 데 도움을 주므로 이러한 유형의 문제에 적합합니다10. 이 방식의 수용 로직은 메트로폴리스 규칙(Metropolis rule)1을 따르며, 더 일반적인 메트로폴리스-헤이스팅스(Metropolis-Hastings) 프레임워크는 제안 커널이 비대칭일 때 정방향-역방향 제안 밀도 비율을 도입합니다12. 본 구현에서는 네 가지 조건부 제안 커널이 대칭적이므로, 공식적인 유도를 통해 가역적인 실행 가능 이동에 대해 헤이스팅스 비율이 1임을 알 수 있습니다. 따라서 이 방법은 별도의 메트로폴리스-헤이스팅스 샘플러가 아니라, 메트로폴리스 수용 및 재가열(reheating)을 적용한 적응형 시뮬레이티드 어닐링으로 설명됩니다.
적응형 시뮬레이티드 어닐링(simulated-annealing) 변형 방식들은 오래전부터 비균일 이웃 선택, 냉각 일정 수정, 재가열, 재시작 전략 및 하이브리드 탐색 구성 요소를 채택해 왔습니다13,14. 따라서 본 구현은 새로운 메타휴리스틱 원형이라기보다 애플리케이션 특화 구성으로 해석되어야 합니다. 본 연구의 기여점은 단계별 4-무브 제안 일정 및 재가열을 전시 특화 가능성 제약 조건, 투명한 다중 구성 요소 공간 비용 함수, 그리고 참가자 수준의 가상 현실 검증과 명시적으로 결합했다는 점에 있습니다15. 이러한 구체적인 포지셔닝은 본 워크플로우를 근본적으로 새로운 최적화 원리라는 주장과 직접적으로 구별 짓습니다. 단계별 제안 선택은 탐색의 초점을 광범위한 시퀀스/경로 탐색에서 국소적인 공간 정밀화로 전환하고, 재가열은 정체 후 탐색 기동성을 회복시킬 것으로 기대되었습니다. 이러한 탐색-활용의 균형은 국소 최솟값에 조기에 갇히는 현상을 줄이고, 동일한 명목 반복 횟수 예산 내에서 더 낮은 비용의 실행 가능한 레이아웃에 도달할 가능성을 높일 것으로 기대되었습니다.
본 연구는 적응형 시뮬레이티드 어닐링(adaptive simulated annealing), 단계별 제안 선택, 재가열 제어, 다성분 공간 비용 모델 및 참가자 수준의 가상현실 평가를 통합한 재현 가능한 워크플로우를 제안한다. 방법론적 기여는 근본적으로 새로운 최적화 원리를 주장하기보다는 응용 지향적이며 재현성에 초점을 맞춘 것이다16. 이 방법은 통제된 가상현실 전시 환경에서 수동 배치, 표준 시뮬레이티드 어닐링 배치, 그리고 재가열 기능이 포함된 적응형 시뮬레이티드 어닐링 배치를 비교한다. 본 연구에서는 최종 공간 비용, 개선 백분율, 실재감, 경로 찾기 명확성, 만족도, 인지 부하, 보행 거리, 망설임 횟수, 체류 시간 및 히트맵 커버리지를 포함한 알고리즘 결과와 참가자 수준의 결과를 모두 조사한다. 주요 가설은 적응형 방법이 표준 시뮬레이티드 어닐링보다 더 낮은 최종 공간 비용을 달성할 것이라는 점이었으며, 참가자 수준에서는 해당 배치가 수동 및 표준 시뮬레이티드 어닐링 배치에 비해 전반적인 만족도와 경로 효율성 결과를 개선할 것으로 예상되었다. 이러한 프레임워크는 계산적 탐색이 인간의 설계 판단을 대체하는 것이 아니라 지원한다는 메타휴리스틱 설계 방법의 광범위한 논리를 따른다17.
프로토콜
본 연구 프로토콜은 Henan Agricultural University의 검토를 거쳤으며, 2025년 12월 20일에 공식적인 윤리 심사 면제 대상으로 결정되었습니다. 검토 기관으로부터 별도의 윤리 승인 또는 면제 참조 번호는 발급되지 않았습니다. 모든 참가자로부터 등록 전 서면 동의서를 받았습니다.
참가자 준비
정상 시력 또는 교정 시력이 정상인 18~60세의 성인 참가자를 모집하였습니다. 심각한 전정 기관 장애, 조절되지 않는 뇌전증, 심각한 시각 장애, 최근의 주요 수술 이력 또는 이전의 가상 현실 노출 중 심각한 불편함을 보고한 참가자는 제외되었습니다. 각 참가자는 실험 전 스크리닝 양식을 작성하였습니다. 연령대, 성별, 교육 수준, 이전의 가상 현실 경험 및 이전의 박물관 또는 전시회 방문 빈도를 통제 변수로 기록하였습니다.
참가자들은 컴퓨터로 생성된 무작위 배정 목록을 통해 수동 배치, 표준 시뮬레이티드 어닐링 배치, 재가열을 포함한 적응형 시뮬레이티드 어닐링 배치라는 세 가지 배치 조건 중 하나에 배정되었습니다. 배치 간 학습 효과를 방지하기 위해 피험자 간 설계가 사용되었습니다. 배정 비율은 1:1:1로 설정되어 각 조건에 60명씩, 총 180명의 참가자가 배정되었습니다. 참가자 특성의 기술적 평가를 위해 배정 전 연령대, 성별, 교육 수준, 가상현실 경험 유무, 박물관/전시회 방문 빈도를 기록하였으며, 이러한 변수들은 무작위 배정 후의 제외 기준으로 사용되지 않았습니다.
전시 공간 모델 준비
천장 높이 4.5 m, 가로 36 m x 세로 24 m 크기의 직사각형 몰입형 전시홀을 구축하였습니다. 총 가용 바닥 면적은 864 m2로 설정하였습니다. 홀의 서로 마주 보는 짧은 면에 각각 하나의 입구와 하나의 출구를 배치하였습니다. 입구와 출구의 너비는 모두 3.0 m로 설정하였으며, 모든 배치 조건에서 동일하게 유지하였습니다.
전시홀은 6개의 주제별 전시 구역, 2개의 전이 복도, 1개의 휴식 공간, 그리고 1개의 주 방문 경로로 나누어졌습니다. 각 주제별 구역의 허용 면적은 80–130 m2로 설정되었으며, 휴식 공간 할당 면적은 40 m2로 설정되었습니다. 주 경로의 허용 너비는 1.8–3.5 m로 설정되었습니다. 각 레이아웃에는 8개에서 12개의 상호작용 노드가 배치되었습니다. 각 상호작용 노드는 참가자가 멈춰서 디지털 콘텐츠를 활성화하거나, 전시물을 관람하거나, 또는 방향을 전환할 수 있는 지점으로 정의되었습니다.
평면도는 0.5 m x 0.5 m 격자 셀로 이산화되었습니다. 이 격자는 가시성 분석, 경로 연속성 확인, 히트맵 커버리지 계산 및 국소 밀도 추정에 사용되었습니다. 각 테마 구역은 중심 좌표, 경계 폴리곤, 면적 및 경로 순서 위치로 표시되었습니다. 각 상호작용 노드는 좌표, 관련 구역, 트리거 반경 및 여유 공간으로 표시되었습니다.
전시 배치, 가시성 및 동선 구조가 관람객의 이동, 길 찾기 및 공간 인지에 영향을 미치기 때문에 공간 구성이 핵심 설계 변수로 처리되었습니다18. 공간 모델 구축부터 배치 최적화, 가상 장면 구현, 참가자 테스트 및 통계 분석에 이르는 전체 워크플로우는 그림 1에 나와 있습니다.
배치 매개변수 및 실행 가능성 제약 조건
모든 배치 조건에 동일한 실행 가능성 제약 조건이 적용되었습니다. 첫째, 모든 테마 구역은 36 m x 24 m 경계 내에 유지되어야 했습니다. 둘째, 테마 구역 간의 중첩은 허용되지 않았습니다. 셋째, 주요 관람 경로는 입구, 6개의 테마 구역, 휴식 공간 및 출구를 중단 없이 연결해야 했습니다. 넷째, 상호작용 노드가 주요 경로를 차단해서는 안 되었습니다. 다섯째, 각 상호작용 노드는 최소 1.2 m의 이격 반경을 유지해야 했습니다. 여섯째, 주요 경로상의 예상 국소 밀도는 1.50 persons/m2 이하이어야 했습니다. 일곱째, 최종 경로는 막다른 길이나 단절된 하위 경로를 포함하지 않아야 했습니다.
세 가지 배치 조건 전반에 걸쳐 동일한 장면 규모, 경로 규칙, 환경 타겟 및 상호작용 설정이 사용되었습니다. 최적화 알고리즘을 실행하기 전, 홀 크기, 기능 구역 매개변수, 통로 너비 범위, 상호작용 노드 설정, 타당성 임계값, 가상 현실 설정, 목적 함수 가중치, 알고리즘 매개변수 및 결과 정의를 기록하였습니다. 이러한 매개변수들은 프로토콜의 재현 가능한 경계를 정의하며, 표 1에 요약되어 있습니다.
공간 비용 함수
각 후보 레이아웃은 가중 공간 비용 함수를 사용하여 평가되었습니다:

여기서 F(x)는 레이아웃 x의 총 공간 비용입니다. Cdistance(x)는 보행 거리 비용, Cvisibility(x)는 시각적 접근성 비용, Ccrowding(x)는 혼잡 비용, Ccomfort(x)는 환경적 쾌적성 패널티, 그리고 Cinteraction(x)는 상호작용 균형 패널티를 나타냅니다. F(x) 값이 낮을수록 더 유리한 레이아웃임을 의미합니다.
도보 거리 비용은 다음과 같이 계산되었습니다:

여기서 Lx는 레이아웃 x의 총 경로 길이(m)입니다. 기준 최대 경로 길이는 120 m로 설정되었습니다.
시각적 접근성 비용은 다음과 같이 계산되었습니다:
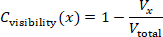
여기서 Vx는 주요 경로에서 보이는 테마 존 전면부이며, Vtotal는 모든 테마 존의 총 전면부 길이이다. 시선 광선은 방문자 경로를 따라 0.5 m마다 방출되었다. 전시 파티션, 벽 및 존 경계는 차폐물로 처리되었다.
혼잡 비용은 다음과 같이 계산되었습니다:
Ccrowding(x) = min(Dmax / 1.50, 1)
어디에 D최대 예측된 최대 국소 밀도는 인원/m²입니다.2상한 밀도 임계값 1.50명/m²2 주 경로로 사용되었습니다.
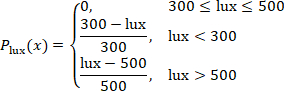
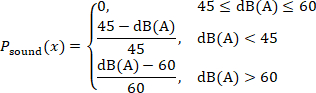
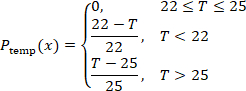
환경 쾌적성 페널티는 다음과 같이 계산되었습니다:

조도 페널티는 다음과 같이 설정되었습니다:
음압 페널티는 다음과 같이 설정되었습니다:
이산화탄소 패널티는 다음과 같이 설정되었습니다:

온도 페널티는 다음과 같이 설정되었습니다:
상호작용-균형 페널티는 다음과 같이 계산되었습니다:

여기서 sk는 인접한 두 상호작용 노드 사이의 경로 거리입니다. 이 값이 낮을수록 방문자 경로를 따라 상호작용 기회가 더 균등하게 분포되어 있음을 나타냅니다.
조명, 소리, 공기질 및 온도가 피로도, 안락함, 그리고 전시 환경에 머물고자 하는 의지에 영향을 미치기 때문에 환경적 쾌적함이 포함되었습니다19. 환경 범위는 보편적인 규제 한계라기보다 프로토콜 제어 목표입니다. 30–50 lx 조도 범위는 현재 중국의 건축 및 박물관 조명 지침과 일치하며, <90 ppm의 이산화탄소 목표는 GB/T 183-202의 일평균 한도인 1,0 ppm보다 의도적으로 더 보수적으로 설정되었습니다20,21. 2–25 °C 온도 범위는 가벼운 활동을 하는 거주자에게 일반적으로 인정되는 열 쾌적 조건 내에 있으며2, 45–60 dB(A)는 법적 실내 소음 한계가 아닌 제어된 주변 소음 범위로 사용됩니다23,24.
목적 함수 가중치는 참가자의 결과로부터 적합된 보편적 계수나 선호도 추정치가 아니라, 명시적이고 시나리오 특이적인 설계 우선순위로 선택되었습니다. 경로 효율성과 혼잡 제어를 두 가지 주요 운영 제약 조건으로 처리했기 때문에 보행 거리와 혼잡도에 각각 0.25의 가중치를 부여했습니다. 가시성은 방향 설정과 전시물 노출에 영향을 미치므로 시각적 접근성에는 0.20을 부여했으며, 환경적 쾌적함과 상호작용에는 각각 0.15를 부여하여 이러한 요소들이 순환 관련 항목을 압도하지 않으면서 탐색에 영향을 주도록 했습니다. 전시 우선순위는 상황에 따라 다를 수 있으므로, 본 프로토콜에서는 각 가중치를 개별적으로 ±10%씩 변화시키고 나머지 가중치를 비례적으로 재정규화하여 총합이 1.0으로 유지되도록 함으로써 국소적 가중치 강건성을 테스트합니다. 따라서 결과로 도출된 계수는 예술, 역사, 과학 또는 상업 전시의 특성에 맞게 재교정될 수 있는 프로토콜 특이적 설계 설정으로 해석되어야 합니다.
수동 레이아웃 생성
기준 조건으로서 수동 레이아웃을 생성하였다. 6개의 주제 구역을 입구에서 출구까지의 일반적인 내러티브 순서로 배치하였다. 휴게 구역은 경로의 중간 부분 근처에 배치하였다. 초기 주 경로의 너비는 2.2 m로 설정하였다. 상호작용 노드는 각 주제 구역의 입구 근처와 주요 경로 전환 지점에 배치하였다. 수동 레이아웃을 모든 실행 가능성 제약 조건과 대조하여 확인하였다. 구역 경계는 제약 조건이 위반된 경우에만 조정하였다. 레이아웃의 실행 가능성이 확인된 후, 총 경로 길이, 가시 전면 비율, 최대 국소 밀도, 환경 쾌적성 패널티, 상호작용 간격 계수 및 총 공간 비용을 기록하였다.
표준 시뮬레이티드 어닐링(Standard simulated annealing)
실행 가능한 수동 배치를 초기 상태로 사용하였다. 초기 온도는 10, 냉각 계수는 0.95, 최대 반복 횟수는 1,50회, 정체 임계값은 20회로 설정하였다. 알고리즘은 30개의 독립적인 무작위 시드로 실행되었다. 이 값들은 일치하는 계산 예산을 정의하기 위해 사용된 운영 프로토콜 설정이며, 문헌에서 유도된 보편적 상수나 결과에 맞춰 조정된 최적값으로 제시된 것이 아니다. T₀ = 10은 초기 단계의 광범위한 탐색을 가능하게 했고, α = 0.95는 점진적인 냉각을 제공했으며, 1,500회의 반복 횟수는 각 실행에 동일한 상한 탐색 예산을 부여했고, 20회의 정체 임계값은 개선이 없을 때 불필요하게 지속되는 것을 방지하였다. 적응형 방법(adaptive method)에도 동일한 온도 및 최대 반복 횟수 설정을 적용하여, 발생하는 차이가 명목상의 탐색 예산 증대가 아닌 제안 스케줄링 및 재가열에 기인하도록 하였다.
각 반복 단계마다 한 번의 이동을 적용하여 하나의 인접 배치를 생성했습니다. 이동 방식은 하나의 테마 구역을 0.5–2.0 m 이동시키거나, 두 테마 구역의 순서 위치를 서로 바꾸거나, 하나의 경로 구간을 0.1–0.3 m 조정하거나, 하나의 상호작용 노드를 0.5–1.5 m 이동시키는 방식이었습니다. 제안된 배치가 타당성 제약 조건을 하나라도 위반할 경우 즉시 거부되었습니다.
제안된 레이아웃이 실행 가능하고 공간 비용이 더 낮다면 이를 수용하였습니다. 만약 공간 비용이 더 높다면, 다음과 같은 확률 방정식에 따라 수용 여부를 결정하였습니다:
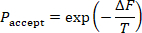
여기서 ΔF는 공간 비용의 증가분이며, T는 현재 온도입니다. 각 반복 후의 온도는 다음을 사용하여 업데이트되었습니다:
Tnew = 0.95Told
각 실행은 최대 반복 횟수에 도달하거나 최적의 공간 비용이 200회 연속으로 개선되지 않을 때 중단되었습니다. 전시 레이아웃 최적화는 전수 조사로는 효율적으로 해결할 수 없는 조합 공간 문제이므로, 이 작업에는 시뮬레이티드 어닐링(Simulated annealing)이 적합한 것으로 판단되었습니다.
표준 시뮬레이티드 어닐링(simulated annealing)은 적응형 조건과 동일한 레이아웃 인코딩, 가능성 규칙, 목적 함수, 초기화, 온도 스케줄 및 계산 예산을 공유하므로 주요 수치 알고리즘 벤치마크로 사용되었습니다. 표준 시뮬레이티드 어닐링은 본 연구의 유일한 수치 메타휴리스틱 비교 대상이었으며, 따라서 워크플로 수준에서 추가된 제안 스케줄링 및 재가열에 대한 매칭된 어블레이션(ablation) 형태의 베이스라인 역할을 했습니다. 유전 알고리즘, 입자 군집 최적화, 개미 군집 최적화 및 학습 기반 최적화 도구는 실험 범위에 포함되지 않았으며, 이에 따라 성능 주장은 매칭된 표준-SA 베이스라인으로 제한되었습니다. 각 실행마다 랜덤 시드, 초기 공간 비용, 최종 공간 비용, 개선 백분율, 최적 해까지의 반복 횟수, 실행 시간, 수락률 및 가능성 상태가 저장되었습니다. 개선 백분율은 다음 식을 사용하여 계산되었습니다:

재가열을 포함한 적응형 시뮬레이티드 어닐링
표준 시뮬레이티드 어닐링 조건과 동일한 초기 레이아웃, 실행 가능성 제약 조건, 초기 온도, 냉각 계수, 최대 반복 횟수 및 30개의 무작위 시드(random seed)가 사용되었습니다. 적응형 알고리즘은 실행 가능한 후보 레이아웃에 대해 표준 메트로폴리스 수락 규칙을 유지하면서, 단계별 이동 클래스 확률과 재가열 규칙에서만 차이를 보였습니다. 네 가지 제안 이동 클래스가 정의되었습니다: 국소 변위(L), 구역-시퀀스 교환(S), 경로 너비 조정(W), 그리고 상호작용 노드 재배치(N)입니다. 전체 반복 횟수의 처음 40% 동안 이동 클래스 확률은 pL = 0.20, pS = 0.35, pW = 0.30, pN = 0.15로 설정되었습니다. 나머지 마지막 60% 동안에는 pL = 0.35, pS = 0.15, pW = 0.20, pN = 0.30으로 설정되었습니다. 이러한 이동 클래스 빈도의 변경은 탐색의 중심을 광범위한 시퀀스/경로 탐색에서 국소적인 공간 정밀화 및 상호작용 노드의 조정으로 전환시켰습니다.
반복 단계 t에서, 전체 제안 밀도는 q(x′|x,t) = pm(t)qm(x′|x)로 표현되었으며, 여기서 m ∈ {L,S,W,N}은 선택된 이동 클래스를, pm(t)은 해당 단계별 확률을 나타냅니다. 국소 변위(local displacement)의 경우, 6개의 테마 구역 중 하나가 균일하게 선택되었고, 변위 방향은 [0,2π) 범위에서 균일하게 추출되었으며, 변위 크기는 [0.5,2.0] m 범위에서 균일하게 추출되었습니다. 따라서 qL은 (1/6)(1/2π)(1/1.5)에 비례했습니다. 구역 순서 교환(zone-sequence swap)의 경우, 순서가 없는 15개의 구역 쌍 중 하나가 균일하게 선택되어 qS = 1/15가 되었습니다. 경로 너비 조정(pathway-width adjustment)의 경우, J개의 조정 가능한 경로 세그먼트 중 하나가 균일하게 선택되었고, 부호가 있는 변화량이 [−0.3,−0.1] ∪ [0.1,0.3] m 범위에서 균일하게 추출되어 qW = (1/J)(1/0.4)가 되었습니다. 상호작용 노드 재배치(interaction-node relocation)의 경우, 현재 K개의 상호작용 노드 중 하나가 균일하게 선택되었고, 방향은 [0,2π) 범위에서 균일하게 추출되었으며, 변위 크기는 [0.5,1.5] m 범위에서 균일하게 추출되어 qN은 (1/K)(1/2π)(1/1.0)에 비례했습니다. 제약 조건을 위반하는 제안은 거부되었으며, 이는 자기 전이(self-transition)로 기여하였습니다.

이 구현에서 모든 가역적인 가능 이동에 대해 조건부 제안 커널은 대칭적이었습니다: qm(x′|x) = qm(x|x′). 특정 반복 단계에서 순방향 및 역방향 전이에 동일한 위상 특이적 이동 클래스 확률 pm(t)가 적용되었으므로, q(x|x′,t)/q(x′|x,t) = 1이 됩니다. 따라서 수락 확률은 표준 시뮬레이션 어닐링 메트로폴리스 규칙인 A(x→x′) = min{1, exp[−(C(x′)−C(x))/T]}로 단순화됩니다. 별도의 헤이스팅스 보정은 적용되지 않았으며, 따라서 이 방법은 메트로폴리스-헤이스팅스 샘플러가 아닌 재가열을 포함한 적응형 시뮬레이션 어닐링으로 명명됩니다25.
최적의 공간 비용이 150회 연속 반복 동안 개선되지 않을 때 재가열(Reheating)을 적용하였으며, 이를 통해 표준 시뮬레이티드 어닐링(simulated annealing)에서 사용하는 20회 반복 정체 시 중단 조건이 되기 전에 의도적으로 개입하였습니다. 현재 온도를 10% 높였으며, 실행당 최대 3회의 재가열 이벤트가 허용되었습니다. 표준 시뮬레이티드 어닐링 조건과 동일한 알고리즘 성능 변수가 저장되었습니다. 본 실험은 단계별 제안 일정과 재가열 구성의 결합 효과를 평가하였으므로, 각 구성 요소의 독립적인 인과적 기여도는 추정하지 않았습니다. 정확한 제안, 실행 가능성, 메트로폴리스 수락(Metropolis acceptance), 온도 업데이트, 재가열 및 출력 저장 순서에 대한 단계별 의사코드는 Supplementary File 3에 제공되었습니다.
Treheated = 1.10Tcurrent
최종 배치도
각 조건에 대해 하나의 최종 배치도가 선정되었습니다. 수동 배치 조건의 경우, 실행 가능한 수동 배치도를 사용하였습니다. 표준 시뮬레이티드 어닐링(simulated annealing) 조건에서는 30회의 실행 중 최종 공간 비용이 가장 낮은 실행 결과를 선택하였습니다. 재가열을 포함한 적응형 시뮬레이티드 어닐링 조건에서는 30회의 실행 중 실행 가능하며 최종 공간 비용이 가장 낮은 결과를 선택하였습니다. 선정된 배치도를 내보내기 전, 모든 구역이 경계 내에 있는지, 구역 간 중첩이 없는지, 경로가 연속적인지, 입구와 출구가 변경되지 않았는지, 상호작용 노드 간격이 최소 1.2 m인지, 최대 밀도가 1.50 persons/m2 미만으로 유지되었는지, 그리고 모든 테마 구역이 주 경로에서 접근 가능한지 확인하는 최종 실행 가능성 검사를 수행하였습니다.
가상 전시 장면
XR Interaction Toolkit 2.5.4를 사용하여 Unity 202.3.2f1 LTS (Unity Technologies)에서 세 가지 가상 전시 장면을 구축하였습니다. 해당 장면들은 6자유도 헤드 및 컨트롤러 트래킹이 가능한 Meta Quest 2 헤드 마운트 디스플레이 (Meta Platforms)를 통해 제공되었습니다. 전시 콘텐츠, 시각적 스타일, 객체 모델, 표지판 스타일, 조명 에셋, 주변 소음, 상호작용 메커니즘 및 내비게이션 지침은 세 장면 모두 동일하게 유지하였습니다. 공간 배치, 경로 순서, 통로 너비 및 상호작용 노드 배치만 다르게 설정하였습니다.
가상 카메라 높이는 1.65 m로, 보행 속도는 1.2 m/s로 설정하였다. 텔레포트 기능은 비활성화하였다. 입구에는 동일한 시작 트리거를, 출구에는 동일한 완료 트리거를 사용하였다. 상호작용 노드 트리거 반경은 1.0 m로 설정하였다. 각 상호작용 노드의 방문 여부를 기록하였다.
모든 장면에서 동일한 6가지 주제 콘텐츠가 사용되었습니다. 레이아웃 조건에 관계없이 각 주제는 해당 구역에 할당되었습니다. 벽 높이, 파티션 스타일, 미디어 디스플레이 크기, 텍스트 밀도 및 전시물 규모는 일정하게 유지되었습니다. 가상 현실 환경은 통제된 레이아웃 조건 하에서 공간적 실재감, 경로 명확성 및 방문객 경험을 조사할 수 있게 해주므로 본 프로토콜에 적합한 것으로 판단되었습니다26.
프로토콜을 재현하는 데 필요한 하드웨어, 소프트웨어, 환경 모니터링 도구, 설문지/코드북 파일 및 분석 리소스는 재료 표에 나열되어 있으며, 보조 파일 1–3으로 정리되어 있습니다. 등록된 연구 리소스 식별자(RRID)가 있는 연구 리소스는 재료 표에 RRID로 기재되었습니다.
참가자 세션
한 번에 한 명의 참가자를 대상으로 테스트를 진행하였습니다. 참가자는 세션 시작 전 2분 동안 앉아서 대기하였습니다. 헤드 마운트 디스플레이를 착용한 후, 참가자가 편안함을 느끼도록 동공 간 거리를 조정하였습니다. 전시 내용에 포함되지 않는 2분 분량의 연습 장면을 제공하였습니다. 연습 장면은 참가자가 움직임과 상호작용에 익숙해지도록 하는 용도로만 사용되었습니다.
한 번에 한 명의 참가자만 테스트되었기 때문에, 프로토콜에서의 혼잡도는 실제 동시다발적인 그룹 이동이 아닌 모델 기반의 밀도 추정치로 나타냈습니다. 따라서 다수 사용자의 공동 존재, 대인 간 회피 및 역동적인 군중 상호작용은 직접적으로 시뮬레이션되지 않았으며, 군중 관련 결과물을 해석할 때 이를 고려하였습니다.
연습이 끝난 후, 지정된 전시 장면이 시작되었다. 참가자는 전시관에 입장하여 자연스럽게 경로를 따라가며 표시된 노드와 상호작용하고, 6개의 주제 구역을 모두 완료한 후 퇴장하도록 안내받았다. 추가적인 경로 안내는 참가자가 30 s 이상 진행하지 못하는 경우에만 제공되었다. 완료 시간, 체류 시간, 보행 거리, 망설임 횟수, 상호작용 노드 방문 횟수 및 궤적 좌표가 자동으로 기록되었다.
참가자가 종료 트리거에 도달하면 세션이 종료되었습니다. 헤드 마운트 디스플레이를 제거하고 참가자가 3분 동안 휴식하도록 하였습니다. 휴식 시간이 끝난 직후 참가자는 경험 후 설문지를 작성하였습니다.
행동, 환경 및 설문지 결과
완료 시간은 진입 트리거 활성화부터 진출 트리거 활성화까지의 시간으로 정의되었습니다. 체류 시간은 테마 구역 및 상호작용 노드 영역 내에서 소비한 총 시간으로 정의되었습니다. 보행 거리는 궤적 좌표로부터 누적된 경로 길이로 정의되었습니다. 망설임 횟수는 상호작용 노드 영역 외부에서 3 s보다 길게 멈춘 횟수로 정의되었습니다. 히트맵 커버리지는 다음과 같이 계산되었습니다:

평균 조도는 Testo 540 조도계(Testo SE & Co. KGaA)를 사용하여 기록하였고, 음압 레벨은 Testo 816-1 Class 2 소음계(Testo SE & Co. KGaA)를, 이산화탄소 농도는 Testo 535 CO₂ 측정기(Testo SE & Co. KGaA)를, 주변 온도는 Testo 605i 온습도계(Testo SE & Co. KGaA)를 사용하여 기록하였습니다. 세 가지 장면 조건 모두에서 동일한 모니터링 위치가 사용되었습니다. 조도는 lx, 음압 레벨은 dB(A), 이산화탄소는 ppm, 온도는 °C 단위로 기록되었습니다.
현존감 및 공간-현존감 영역은 연구 프로토콜에 명시된 7점 척도 구조를 사용하여 측정되었습니다. 이러한 구성 개념은 Witmer와 Singer의 검증된 현존감 설문지(PQ) 프레임워크와 Schubert 등의 Igroup 현존감 설문지(IPQ) 프레임워크27를 참조하여 해석되었습니다. 연구 변수는 표준 PQ 또는 IPQ 총점이 아닌 영역 수준의 7점 점수로 보고되었습니다. 시뮬레이터 멀미의 경우, 시뮬레이터 멀미 설문지(SSQ) 증상 프레임워크를 미리 지정된 0–30 연구 요약 변수와 함께 사용하였으며, 값이 높을수록 불편함이 더 큼을 나타냈습니다. 이 0–30 연구 요약은 시뮬레이터 멀미 측정 관례와 사이버 멀미 보고 사이의 구분을 유지하기 위해 표준 가중 SSQ 총 심각도 점수와 별도로 보고되었습니다28. 상호작용 품질, 길 찾기 명확성, 시각적 편안함, 청각적 편안함, 열적 편안함, 인지된 혼잡도, 인지 부하 및 전반적인 만족도는 연구 전용 다항목 7점 평가 척도를 사용하여 측정되었습니다. 보충 파일 2에는 각 영역의 구성 개념 출처, 점수 범위 및 보고 관례가 기록되어 있습니다.
연구 결과
주요 알고리즘 결과는 최종 공간 비용으로 정의되었습니다. 주요 방문자 경험 결과는 전반적인 만족도로 정의되었습니다. 보조 알고리즘 결과는 개선 백분율, 최적 해까지의 반복 횟수, 실행 시간 및 수락률로 정의되었습니다. 보조 방문자 경험 결과는 실재감, 공간 실재감, 상호작용 품질, 길 찾기 명확성, 시각적 쾌적성, 음향적 쾌적성, 열적 쾌적성, 인지된 혼잡도, 인지 부하, 시뮬레이터 멀미, 완료 시간, 체류 시간, 보행 거리, 망설임 횟수 및 히트맵 커버리지로 정의되었습니다. 완료 시간과 보행 거리는 경로 효율성을 평가하는 데 사용되었습니다. 망설임 횟수와 길 찾기 명확성은 내비게이션 품질을 평가하는 데 사용되었습니다. 실재감, 공간 실재감, 상호작용 품질 및 체류 시간은 몰입형 참여도를 평가하는 데 사용되었습니다. 인지된 혼잡도, 인지 부하, 쾌적성 등급 및 시뮬레이터 멀미는 경험적 부담을 평가하는 데 사용되었습니다.
데이터 정제 및 품질 관리
분석 전 모든 참가자 기록을 점검하였다. 각 기록에 단일 참가자 식별자, 단일 조건 라벨, 완전한 행동 로그 및 설문지 점수가 포함되어 있으며 중복 식별자가 없음을 확인하였다. 현존감, 공간 현존감 및 연구 특정 경험 평가는 정의된 1–7 범위로 제한하였다. 시뮬레이터 멀미 연구 요약 변수는 미리 지정된 0–30 범위로 제한하였다. 분석에 사용된 구성 개념 출처, 응답 범위, 도메인 구성 및 파생 점수 정의가 문서화되어 있는지 확인하기 위해 설문지/코드북 파일을 점검하였다.
세션을 완료하지 않았거나, 완료 시간이 3 min 미만 또는 25 min 초과인 경우, 히트맵 커버리지가 10% 미만인 경우, 궤적 로그가 불완전하거나 기술적으로 유효하지 않은 경우, 궤적 기록이 불완전/유효하지 않으면서 보행 거리가 20 m 미만인 경우, 또는 참가자가 조기 종료를 요청한 경우 해당 참가자 기록은 제외되었습니다. 보행 거리의 상한 컷오프는 적용하지 않았으며, 보행 거리는 유효하게 관찰된 범위 전체에서 연속적인 연구 결과로 유지되었습니다. 알고리즘 실행 결과가 실행 가능성 제약 조건을 하나라도 위반한 경우 레이아웃 선택에서 제외되었습니다. 재현성을 위해 랜덤 시드, 레이아웃 파일, 알고리즘 출력값, 설문지/코드북 파일 및 분석 스크립트를 보존하였습니다. 확률적 최적화 출력값은 초기화 및 제안 동작에 따라 달라질 수 있으므로 랜덤 시드 보존이 필요했습니다29.
알고리즘 성능
30회의 표준 시뮬레이티드 어닐링 실행과 30회의 재가열 방식 적응형 시뮬레이티드 어닐링 실행을 분석하였다. 초기 공간 비용, 최종 공간 비용, 개선 백분율, 최적 해 도달까지의 반복 횟수, 실행 시간 및 수용률을 평균값으로 요약하였다. ± 집단 평균 및 알고리즘 간 차이에 대해 표준 편차(SD)와 95% 신뢰 구간을 보고하였다.
정규성은 분위수-분위수(Q-Q) 도표와 Shapiro-Wilk 검정을 사용하여 평가되었습니다. 분산의 균질성은 Levene 검정을 통해 평가되었습니다. 가정이 충족된 경우, 독립 표본 t 검정을 사용하여 두 알고리즘 조건을 비교하였습니다. 가정이 충족되지 않은 경우에는 Mann-Whitney U 검정을 사용하였습니다. 양측 p 값, 95% 신뢰 구간 및 효과 크기를 보고하였습니다. Cohen's d는 다음 식을 사용하여 계산되었습니다.

여기서:

비모수 비교를 위해 순위-이분 상관관계(Rank-biserial correlation)를 사용하였습니다. 각 목적함수 가중치를 개별적으로 ±10%씩 변경하고, 나머지 4개 가중치를 총합이 1.0이 되도록 비례적으로 재정규화하여 민감도 분석을 수행하였습니다. 각 대안 가중치 벡터에 대해 최종 공간 비용과 개선 백분율을 다시 계산하였습니다. 재가열 조건이 포함된 적응형 시뮬레이티드 어닐링(adaptive simulated annealing)이 대안 가중치 설정 전반에 걸쳐 더 낮은 최종 공간 비용을 유지했을 때, 알고리즘 비교 결과가 안정적인 것으로 간주하였습니다.
참가자 결과 분석
세 가지 배치 조건에 따른 참가자 결과는 IBM SPSS Statistics 27.0 (IBM Corp.)을 사용하여 분석하였다. 연속형 변수는 평균 ± SD로 나타냈으며, 범주형 변수는 빈도와 백분율로 나타냈다. 정규성은 Q-Q plot과 Shapiro-Wilk 검정을 사용하여 평가하였다. 분산의 동질성은 Levene 검정을 사용하여 평가하였다. 분산의 동질성이 확보된 정규 분포 결과에 대해서는 일원 분산 분석(ANOVA)을 사용하였다. 분산의 동질성 가정을 충족하지 않는 경우에는 Welch's ANOVA를 사용하였다. 비정규 분포 결과에 대해서는 Kruskal-Wallis 검정을 사용하였다.
수동 배치, 표준 시뮬레이션 어닐링 배치, 그리고 재가열을 포함한 적응형 시뮬레이션 어닐링 배치 간의 쌍별 비교를 수행하였습니다. 각 결과 내의 세 가지 쌍별 비교는 Holm 방법으로 보정되었습니다. 95% 신뢰 구간은 보정된 p-값과 함께 보고되었습니다. 표준 ANOVA의 경우 에타 제곱(eta-squared), Welch's ANOVA의 경우 오메가 제곱(omega-squared), Kruskal-Wallis 검정의 경우 엡실론 제곱(epsilon-squared), 그리고 쌍별 비교의 경우 표준화된 평균 차이를 보고하였습니다. 추가적인 강건성 분석으로, 그룹별 평균, SD 및 그룹당 n = 60을 사용하여 쌍별 Welch 대조군 분석을 계산하였습니다. Welch 자유도, 양측 p 값, Holm 보정 p 값, 평균 차이에 대한 95% CI 및 Hedges g를 산출하였습니다. 이 추가 분석은 그룹 수준 통계량을 사용하였으며 부록 표 1에 제시되었습니다.
무작위 1:1:1 세 집단 비교를 주 분석으로 처리하였습니다. 표본의 특성을 정의하고 명백한 불균형을 확인하기 위해, 배정 전 연령대, 성별, 교육 수준, 이전 가상현실 경험 및 박물관/전시관 방문 빈도를 기록하였습니다. 본 임상시험은 하위 집단 상호작용 테스트를 위해 설계되거나 검정력이 설정되지 않았으며, 사전 지정된 조절 모델도 포함되지 않았습니다. 따라서 이러한 특성들은 입증된 조절 변수가 아닌 맥락 변수로 처리되었습니다. 무작위 배정을 통해 기선 특성에 대한 설계 기반 제어를 수행하였으며, 이전 VR 친숙도의 잔류 영향은 명시적인 한계점으로 남겨두었습니다. Eta-squared는 다음을 사용하여 계산되었습니다.
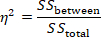
Kruskal-Wallis 검정을 위한 Epsilon-squared는 다음과 같이 계산되었습니다:
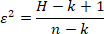
여기서 H는 Kruskal-Wallis 검정 통계량, k는 그룹 수, n은 전체 표본 크기를 나타냅니다.
공간적 효율성과 몰입형 방문자 경험을 직접적으로 반영하는 변수들이기 때문에, 해석 과정에서는 전반적인 만족도, 현존감, 길 찾기 명확성, 인지된 혼잡도, 인지 부하, 완료 시간, 보행 거리, 망설임 횟수 및 히트맵 커버리지를 우선적으로 고려하였습니다.
결과
Participant flow and data completeness
A total of 180 participants completed the immersive exhibition experiment and were included in the final analysis. The three layout conditions were balanced, with 60 participants assigned to the manual layout, 60 to the standard simulated annealing layout, and 60 to the adaptive simulated annealing with reheating layout. No participant record was excluded after data quality control. All behavioral logs and post-experience questionnaire scores were complete. Environmental measurements were recorded as experimental control checks rather than participant outcomes; the same monitoring positions and prespecified target ranges were used across all three scene conditions, and these variables were not included in the between-condition inferential analysis.
The final analysis included 180 participant-session records and 60 algorithm runs from the two optimization conditions. The manual layout served as the non-optimized baseline. The standard simulated annealing and adaptive simulated annealing with reheating conditions each included 30 independent optimization runs. The main algorithmic, behavioral, and questionnaire outcomes are summarized in Table 2.
Questionnaire reliability and score distribution
Before comparing layout conditions, the internal consistency of the multi-item questionnaire domains was examined. The questionnaire domains showed acceptable to good reliability, with Cronbach’s alpha values ranging from 0.78 to 0.91. Presence, spatial presence, interaction quality, wayfinding clarity, comfort-related ratings, cognitive load, and overall satisfaction all met the predefined reliability threshold of 0.70.
Score distributions were also reviewed before group comparison. No substantial ceiling effect or floor effect was observed for the primary visitor-experience outcome. Overall satisfaction, presence, wayfinding clarity, and cognitive load showed sufficient variability across the three layout conditions. Simulator sickness scores were right-skewed, as expected for short-duration virtual-reality exposure, and were therefore interpreted alongside distributional checks and nonparametric sensitivity testing.
Algorithm performance
The adaptive simulated annealing with reheating algorithm produced a lower final spatial cost than standard simulated annealing. The mean final spatial cost was 0.475 ± 0.019 (95% CI, 0.468–0.482) for standard simulated annealing and 0.424 ± 0.016 (95% CI, 0.418–0.430) for Adaptive SA-R. The mean between-algorithm difference (Adaptive − Standard) was −0.051 (95% CI, −0.060 to −0.042), with Welch t = 11.25, p < 0.001, and Cohen's d = 2.90.
The improvement percentage was higher in the adaptive algorithm condition: 24.91% ± 3.22% for standard simulated annealing and 32.54% ± 3.29% for Adaptive SA-R, a mean difference of +7.63 percentage points (95% CI, 5.95–9.31; Welch t = 9.07; p < 0.001; d = 2.34). Adaptive SA-R reached the best solution in 722.20 ± 90.19 iterations versus 925.47 ± 86.38 for standard simulated annealing, a difference of −203.27 iterations (95% CI, −248.91 to −157.63; Welch t = 8.92; p < 0.001; d = 2.30).
Runtime was modestly longer for Adaptive SA-R. Mean runtime increased from 47.83 ± 9.42 s to 55.86 ± 9.49 s, a mean increase of 8.03 s (95% CI, 3.14–12.92; Welch t = 3.29; p = 0.002; d = 0.85), corresponding to a 16.8% relative increase. Acceptance rate increased from 0.294 ± 0.045 to 0.372 ± 0.054, a mean difference of +0.078 (95% CI, 0.052–0.104; Welch t = 6.08; p < 0.001; d = 1.57). In return, the mean final spatial cost was 10.7% lower, and the number of iterations to the best solution was 22.0% lower. This is interpreted as a modest computational cost within the tested problem size rather than as evidence of universal computational superiority.
The convergence curves showed that the adaptive simulated annealing with reheating algorithm reduced spatial cost more rapidly during the early search stage and maintained a lower cost trajectory during later iterations. Across independent runs, the adaptive algorithm showed numerically lower variability in final spatial cost; this descriptive difference was not subjected to a separate formal variance test. The algorithm performance results, including final spatial cost, improvement percentage, iterations to the best solution, runtime, acceptance rate, and representative convergence curves, are shown in Figure 2.
Visitor-experience outcomes
Overall satisfaction differed across the three layout conditions. Participants in the manual layout condition reported a mean of 3.59 ± 0.45 (95% CI, 3.47–3.71), the standard simulated annealing layout a mean of 3.96 ± 0.44 (95% CI, 3.85–4.07), and the adaptive simulated annealing with reheating layout a mean of 4.37 ± 0.31 (95% CI, 4.29–4.45). The between-condition effect was large. Overall satisfaction was not a component of the spatial-cost function and, therefore, is not directly optimized by the algorithm.
Presence and spatial presence followed the same pattern. Presence increased from 3.77 ± 0.56 in the manual layout condition to 3.99 ± 0.55 in the standard simulated annealing condition and 4.28 ± 0.42 in the adaptive simulated annealing with reheating condition. Spatial presence increased from 3.75 ± 0.64 to 3.96 ± 0.63 and 4.27 ± 0.47 across the same three conditions.
Interaction quality and wayfinding clarity also improved under the optimized layouts. Interaction quality increased from 3.74 ± 0.56 in the manual layout condition to 4.00 ± 0.57 in the standard simulated annealing condition and 4.24 ± 0.57 in the adaptive simulated annealing with reheating condition. Wayfinding clarity increased from 3.61 ± 0.58 to 3.90 ± 0.57 and 4.17 ± 0.48, respectively.
The optimized layouts reduced negative experience indicators. Perceived crowding decreased from 3.01 ± 0.49 in the manual layout condition to 2.75 ± 0.55 in the standard simulated annealing condition and 2.56 ± 0.45 in the adaptive simulated annealing with reheating condition. Cognitive load decreased from 3.21 ± 0.48 to 2.87 ± 0.52 and 2.73 ± 0.44. Simulator sickness was lowest in the adaptive layout condition, decreasing from 2.52 ± 0.55 in the manual layout condition to 2.44 ± 0.58 in the standard simulated annealing condition and 2.12 ± 0.56 in the adaptive simulated annealing with reheating condition.
Comfort-related ratings showed consistent but more moderate improvements. Visual comfort increased from 3.67 ± 0.44 in the manual layout condition to 3.87 ± 0.44 in the standard simulated annealing condition and 4.07 ± 0.45 in the adaptive simulated annealing with reheating condition. Acoustic comfort increased from 3.64 ± 0.52 to 3.75 ± 0.42 and 3.97 ± 0.44. Thermal comfort increased from 3.69 ± 0.46 to 3.79 ± 0.32 and 3.94 ± 0.44. The main visitor-experience and behavioral outcomes are shown in Figure 3.
Behavioral outcomes
Behavioral trajectory data supported the questionnaire findings. Completion time decreased across the three layout conditions. Participants in the manual layout condition required 19.11 ± 2.63 min to complete the exhibition, compared with 17.42 ± 2.77 min in the standard simulated annealing condition and 14.93 ± 2.32 min in the adaptive simulated annealing with reheating condition.
Walking distance showed a similar reduction. The mean walking distance was 234.88 ± 24.34 m in the manual layout condition, 217.95 ± 24.33 m in the standard simulated annealing condition, and 201.86 ± 23.47 m in the adaptive simulated annealing with reheating condition. Hesitation count also decreased, from 7.10 ± 1.80 in the manual layout condition to 5.51 ± 1.79 in the standard simulated annealing condition and 4.07 ± 1.99 in the adaptive simulated annealing with reheating condition.
Dwell time and heatmap coverage increased under the optimized layouts. Dwell time increased from 11.17 ± 2.03 min in the manual layout condition to 12.24 ± 2.04 min in the standard simulated annealing condition and 13.39 ± 2.28 min in the adaptive simulated annealing with reheating condition. Heatmap coverage increased from 66.18% ± 9.40% to 74.14% ± 7.93% and 84.40% ± 9.47%, respectively.
These findings indicate that the adaptive layout did not simply shorten the route. It reduced inefficient movement and hesitation while increasing dwell time and spatial coverage.
Spatial layout and trajectory distribution
The optimized layouts showed visible differences in route organization and spatial coverage. Compared with the manual layout, the standard simulated annealing layout reduced unnecessary route turning and improved continuity between thematic zones. The adaptive simulated annealing with reheating layout further produced a more balanced distribution of exhibition zones and interaction nodes, with fewer local congestion points along the main route.
The trajectory heatmaps showed that participants in the adaptive layout condition covered a larger proportion of the exhibition hall while maintaining shorter walking distances and fewer instances of hesitation. In the manual layout condition, trajectories were more concentrated around several turning points and transition areas. Under standard simulated annealing conditions, the trajectory distribution became more continuous but still exhibited several local regions of repeated movement. Under adaptive simulated annealing with reheating, the trajectory pattern was broader and more evenly distributed across the exhibition space. The spatial layouts and visitor trajectory heatmaps are shown in Figure 4.
Statistical comparison of participant outcomes
Group comparisons showed clear between-condition differences in the primary and major secondary outcomes. Overall satisfaction differed significantly across conditions, with the highest score observed in the adaptive simulated annealing with reheating condition. Heatmap coverage, completion time, hesitation count, walking distance, wayfinding clarity, and presence also showed strong between-condition effects.
The largest effects were observed for heatmap coverage, overall satisfaction, hesitation count, and completion time. Heatmap coverage showed a large between-condition effect, with η2 = 0.413. Overall satisfaction also showed a large effect, with η2 = 0.386. Hesitation count and completion time showed large effects, with η2 = 0.311 and η2 = 0.311, respectively. Walking distance showed a moderate-to-large effect, with η2 = 0.242.
Pairwise sensitivity analyses supported the principal three-group comparisons. Relative to standard simulated annealing, Adaptive SA-R increased overall satisfaction by 0.41 points (95% CI, 0.272–0.548; Holm-adjusted p < 0.001; Hedges g = 1.07), presence by 0.29 (95% CI, 0.113–0.467; adjusted p = 0.003; g = 0.59), and wayfinding clarity by 0.27 (95% CI, 0.079–0.461; adjusted p = 0.012; g = 0.51). It reduced completion time by 2.49 min (95% CI, −3.414 to −1.566; adjusted p < 0.001; g = −0.97), walking distance by 16.09 m (95% CI, −24.733 to −7.448; adjusted p < 0.001; g = −0.67), and hesitation count by 1.44 (95% CI, −2.124 to −0.756; adjusted p < 0.001; g = −0.76), while increasing heatmap coverage by 10.26 percentage points (95% CI, 7.101–13.419; adjusted p < 0.001; g = 1.17). Perceived crowding was 0.19 points lower (95% CI, −0.372 to −0.008; adjusted p = 0.041; g = −0.38), and the 0–30 simulator-sickness study summary was 0.32 points lower (95% CI, −0.526 to −0.114; adjusted p = 0.005; g = −0.56). The complete three-contrast results for all participant outcomes are reported in Supplementary Table 1.
Distributional and variance assumptions were evaluated using Q-Q plots, Shapiro-Wilk tests, and Levene tests before choosing the prespecified parametric or robust alternative. Nonparametric sensitivity testing was used for outcomes that were clearly non-normal. Pairwise comparisons were adjusted with the Holm method, and 95% confidence intervals are reported for principal group means, algorithmic between-group differences, figure error bars, and the supplementary summary-statistic pairwise contrasts. No subgroup or moderator effects are inferred from the contextual covariates because these analyses were not prespecified or powered.
Several participant-level outcomes provide convergent validation beyond the variables directly minimized by the spatial-cost function. Overall satisfaction, presence, cognitive load, simulator sickness, dwell time, and heatmap coverage are not explicit terms in the objective function. Their between-layout differences therefore extend the evaluation beyond simple re-expression of route length or crowding penalties, although they remain measured within the same controlled virtual-reality experiment and should not be interpreted as fully independent real-world validation.
Sensitivity analysis
Sensitivity analysis varied each objective-function weight by ±10% individually and proportionally renormalized the remaining weights to maintain a total weight of 1.00. Across the alternative weight settings, the adaptive simulated annealing with reheating condition retained the lowest mean final spatial cost. The direction of the comparison remained unchanged for the final spatial cost, the improvement percentage, and the number of iterations to the best solution. These results support local robustness to moderate weight perturbations but do not establish that the same weight vector is appropriate for other types of exhibitions.
The stability analysis indicates that the adaptive algorithm was not solely dependent on one nominal weight configuration. The visitor-experience pattern was also consistent with the algorithmic results: the layout with the lowest spatial cost showed the highest satisfaction, stronger presence, clearer wayfinding, and broader heatmap coverage.
The implementation is parameter-driven rather than hard-coded to a single floor plan: hall boundary, grid resolution, zone number and allowable area, pathway-width range, density ceiling, interaction-node count, environmental targets, and objective weights are external configuration values. These inputs can be replaced without changing the proposal/accept/reheat search logic, providing structural portability to other encoded layouts. This is a software architecture property, not empirical evidence of generalization; performance has been demonstrated only for the current 36 m x 24 m rectangular single-floor scenario.
Summary of findings
Within the tested 36 m x 24 m single-floor exhibition scenario, the adaptive simulated annealing with reheating method generated the lowest spatial cost, the highest improvement percentage, and the most favorable participant-experience profile among the three evaluated layout conditions. Compared with the manual layout, the adaptive layout produced higher satisfaction, stronger presence, clearer wayfinding, lower crowding and cognitive load, shorter completion time and walking distance, fewer hesitation events, longer dwell time, and broader heatmap coverage. These findings describe performance under the predefined objective function and experimental conditions and should not be interpreted as proof of a universally optimal exhibition layout. Compared with standard simulated annealing, the adaptive algorithm exhibited stronger optimization performance and better participant-level outcomes, albeit at a modest increase in runtime. The combined algorithmic, behavioral, questionnaire, and trajectory-heatmap results support the proposed layout-optimization workflow for immersive exhibition-space environmental design.
Data availability
The source data materials associated with the current study are available on Figshare: Zhang, Guangping; Hui, Xianghui; Wang, Hanye (2026). Optimizing Immersive Exhibition Space Design Using Adaptive Simulated Annealing with Reheating and Virtual Reality Evaluation. figshare. Dataset. https://doi.org/10.6084/m9.figshare.33313611.v1
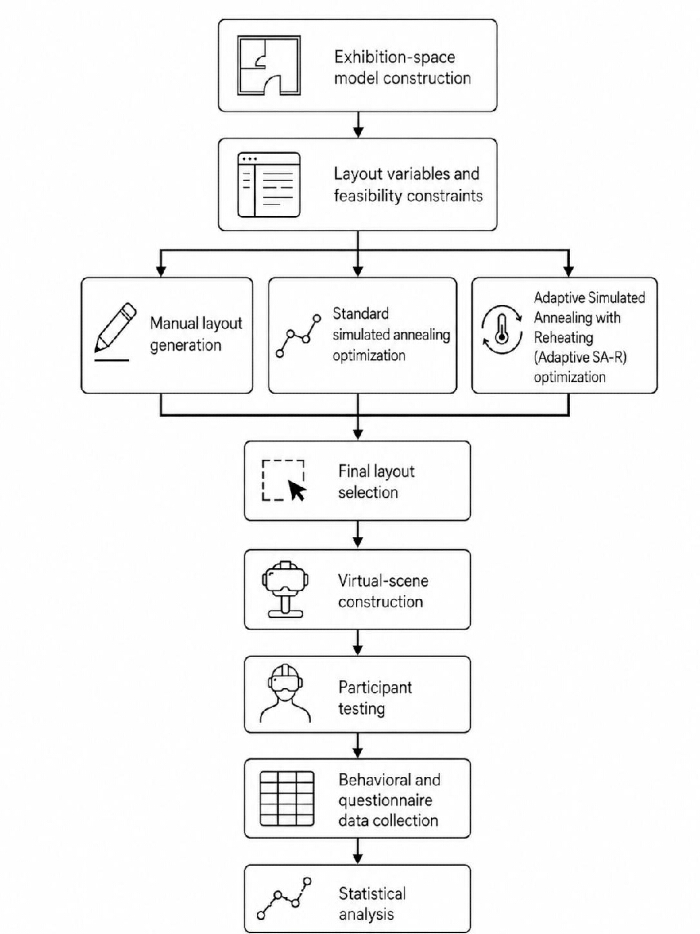
Figure 1: Workflow for immersive exhibition-space layout optimization and virtual-reality evaluation. The workflow includes exhibition-space model construction, definition of layout variables and feasibility constraints, manual layout generation, standard simulated annealing optimization, adaptive simulated annealing with reheating optimization, final layout selection, virtual-scene construction, participant testing, behavioral and questionnaire data collection, and statistical analysis. The figure summarizes the full methodological sequence used to link spatial design optimization to immersive experience evaluation. No panel subdivision or statistical notation is used in this figure. Please click here to view a larger version of this figure.
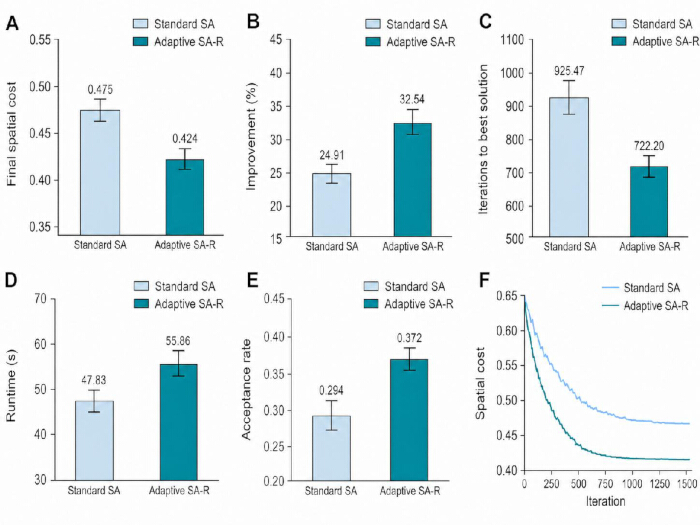
Figure 2: Algorithm performance of standard simulated annealing and adaptive simulated annealing with reheating. (A) Final spatial cost across independent optimization runs. (B) Improvement percentage from initial to final spatial cost. (C) Number of iterations required to reach the best solution. (D) Runtime in seconds. (E) Acceptance rate during the search process. (F) Representative convergence curves showing spatial cost across iterations. Standard SA denotes standard simulated annealing; Adaptive SA-R denotes adaptive simulated annealing with reheating. Panels A–E include n = 30 independent optimization runs per algorithmic condition. Central markers/bars represent the group means, and error bars represent 95% confidence intervals of the mean; individual run-level scatter points are not displayed. Between-algorithm inferential comparisons are reported in Table 2 with exact p-values and Cohen’s d effect sizes. Panel F shows representative convergence trajectories and is descriptive rather than an additional inferential test. Abbreviations: CI = confidence interval; SA = simulated annealing; SA-R = simulated annealing with reheating. Please click here to view a larger version of this figure.
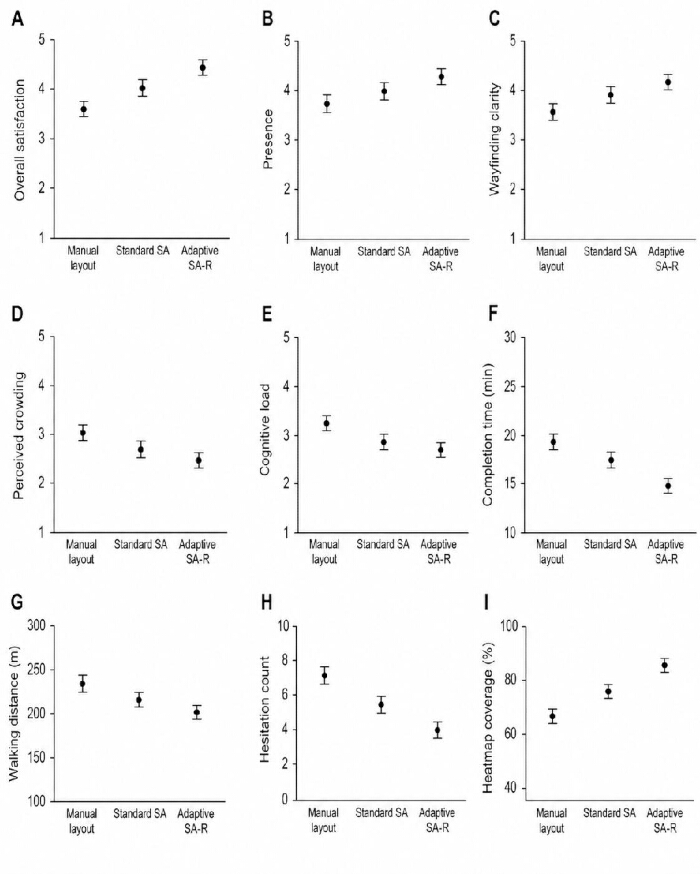
Figure 3: Visitor-experience and behavioral outcomes across the three layout conditions. (A) Overall satisfaction. (B) Presence. (C) Wayfinding clarity. (D) Perceived crowding. (E) Cognitive load. (F) Completion time. (G) Walking distance. (H) Hesitation count. (I) Heatmap coverage. The groups are Manual layout, Standard SA (standard simulated annealing), and Adaptive SA-R (adaptive simulated annealing with reheating), with n = 60 participants per group. Black markers represent group means, and vertical error bars represent 95% confidence intervals of the mean; individual participant-level scatter is not displayed. Outcomes were compared across the three groups using the prespecified ANOVA/robust alternative framework described in the Protocol; exact p values and effect sizes are provided in Table 2. Abbreviations: CI = confidence interval; ANOVA = analysis of variance; SA = simulated annealing; SA-R = simulated annealing with reheating. Please click here to view a larger version of this figure.
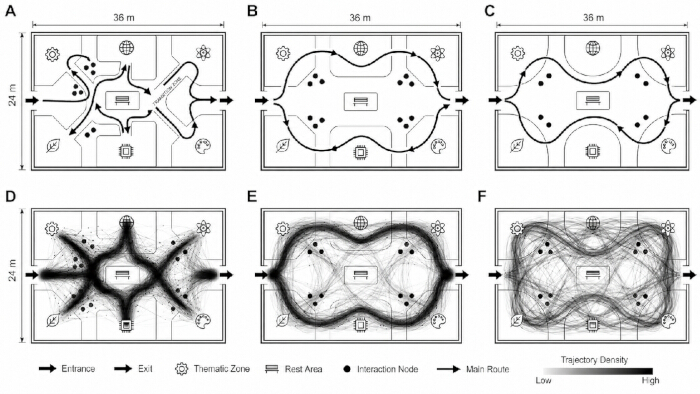
Figure 4: Spatial layouts and visitor trajectory heatmaps across the three layout conditions. (A) Manual exhibition layout. (B) Standard simulated annealing layout. (C) Adaptive simulated annealing with reheating layout. (D) Visitor trajectory heatmap in the manual layout condition. (E) Visitor trajectory heatmap in the standard simulated annealing condition. (F) Visitor trajectory heatmap for adaptive simulated annealing with reheating. The schematic symbols denote the entrance, exit, thematic zones, rest area, interaction nodes, and main route as indicated in the embedded legend. The density scale in panels D–F ranges from low to high trajectory density, and each trajectory heatmap summarizes n = 60 participant sessions in the corresponding condition. Panels A–C are layout schematics, and panels D–F are descriptive trajectory visualizations; no error bars or significance notation are used in this figure. Please click here to view a larger version of this figure.
| Parameter category | Parameter | Value / Setting | Role in protocol |
| Exhibition space | Hall size | 36 m × 24 m | Fixed spatial boundary |
| Exhibition space | Total floor area | 864 m² | Base model area |
| Exhibition space | Ceiling height | 4.5 m | Virtual scene parameter |
| Access points | Entrance width | 3.0 m | Fixed access point |
| Access points | Exit width | 3.0 m | Fixed access point |
| Functional zoning | Number of thematic zones | 6 | Main layout objects |
| Functional zoning | Thematic-zone area range | 80–130 m² | Feasibility constraint |
| Functional zoning | Transition corridors | 2 | Route-connection elements |
| Functional zoning | Rest area | 40 m² | Fixed functional space |
| Circulation | Main-pathway width | 1.8–3.5 m | Optimization variable |
| Circulation | Initial manual pathway width | 2.2 m | Baseline layout setting |
| Circulation | Maximum reference route length | 120 m | Normalization value for walking-distance cost |
| Interaction | Interaction nodes | 8–12 | Optimization variable |
| Interaction | Interaction-node trigger radius | 1.0 m | Virtual-reality interaction setting |
| Interaction | Interaction-node clearance radius | ≥1.2 m | Feasibility constraint |
| Spatial analysis | Grid size | 0.5 m × 0.5 m | Visibility, heatmap, and density calculation |
| Visibility analysis | Line-of-sight ray interval | 0.5 m | Visual-accessibility calculation |
| Crowding | Local density threshold | ≤1.50 persons/m² | Feasibility constraint and crowding-cost reference |
| Environmental comfort | Target illuminance | 300–500 lx | Component of environmental-comfort penalty |
| Environmental comfort | Target sound pressure level | 45–60 dB(A) | Component of environmental-comfort penalty |
| Environmental comfort | Target carbon dioxide | <900 ppm | Component of environmental-comfort penalty |
| Environmental comfort | Target temperature | 22–25 °C | Component of environmental-comfort penalty |
| Objective function | Walking-distance cost weight | 0.25 | Route-efficiency component |
| Objective function | Visual-accessibility cost weight | 0.2 | Visual-accessibility component |
| Objective function | Crowding cost weight | 0.25 | Crowding-control component |
| Objective function | Environmental-comfort penalty weight | 0.15 | Environmental-comfort component |
| Objective function | Interaction-balance penalty weight | 0.15 | Interaction-distribution component |
| Standard simulated annealing | Initial temperature | 100 | Starting search temperature |
| Standard simulated annealing | Cooling coefficient | 0.95 | Temperature reduction rule |
| Standard simulated annealing | Maximum iterations | 1500 | Stopping rule |
| Standard simulated annealing | Stagnation threshold | 200 iterations | Early stopping rule |
| Standard simulated annealing | Layout proposal moves | Zone movement; zone-sequence swap; pathway-width adjustment; interaction-node movement | Neighboring-solution generation |
| Standard simulated annealing | Zone movement range | 0.5–2.0 m | Proposal-move setting |
| Standard simulated annealing | Pathway-width adjustment range | 0.1–0.3 m | Proposal-move setting |
| Standard simulated annealing | Interaction-node movement range | 0.5–1.5 m | Proposal-move setting |
| Adaptive SA-R | First-stage iteration range | First 40% of iterations | Global exploration phase |
| Adaptive SA-R | First-stage proposal probabilities | Local displacement 0.20; zone-sequence swap 0.35; pathway-width adjustment 0.30; interaction-node relocation 0.15 | Adaptive proposal distribution |
| Adaptive SA-R | Second-stage iteration range | Final 60% of iterations | Local refinement phase |
| Adaptive SA-R | Second-stage proposal probabilities | Local displacement 0.35; zone-sequence swap 0.15; pathway-width adjustment 0.20; interaction-node relocation 0.30 | Adaptive proposal distribution |
| Adaptive SA-R | Reheating threshold | 150 iterations without improvement | Premature-convergence control |
| Adaptive SA-R | Reheating magnitude | 10% increase in current temperature | Adaptive reheating rule |
| Adaptive SA-R | Maximum reheating events | 3 per run | Search-stability rule |
| Algorithm evaluation | Independent random seeds | 30 per algorithmic condition | Algorithm-performance estimation |
| Virtual-reality scene | Camera height | 1.65 m | Approximate standing eye height |
| Virtual-reality scene | Walking speed | 1.2 m/s | Standardized navigation setting |
| Virtual-reality scene | Teleportation | Disabled | Standardized trajectory recording |
| Participant session | Practice scene duration | 2 min | Familiarization before test scene |
| Participant session | Pre-session seated rest | 2 min | Baseline preparation |
| Participant session | Post-session rest | 3 min | Recovery before questionnaire |
| Participant session | Route assistance threshold | >30 s unable to proceed | Standardized assistance rule |
| Study design | Layout conditions | 3 | Manual layout; standard simulated annealing layout; adaptive simulated annealing with reheating layout |
| Study design | Participants per condition | 60 | Between-subject allocation |
| Study design | Total participants | 180 | Full study sample |
| Primary algorithmic outcome | Final spatial cost | Continuous | Main optimization outcome |
| Primary visitor-experience outcome | Overall satisfaction | 1–7 scale | Main participant-reported outcome |
| Secondary algorithmic outcomes | Improvement percentage; iterations to best solution; runtime; acceptance rate | Continuous | Algorithm-performance evaluation |
| Secondary visitor-experience outcomes | Presence; spatial presence; interaction quality; wayfinding clarity; visual comfort; acoustic comfort; thermal comfort; perceived crowding; cognitive load; simulator sickness | Continuous | Experience evaluation |
| Secondary behavioral outcomes | Completion time; dwell time; walking distance; hesitation count; heatmap coverage | Continuous | Trajectory and route-behavior evaluation |
| Exclusion rule | Completion time | <3 min or >25 min | Participant-record exclusion criterion |
| Exclusion rule | Walking distance | No upper cutoff; records <20 m were considered invalid only when associated with incomplete/invalid trajectory | Data-integrity rule |
| Exclusion rule | Heatmap coverage | <10% | Participant-record exclusion criterion |
| Multiple comparison control | Pairwise comparison adjustment | Holm method | Type-I error control |
| Sensitivity analysis | Objective-function weight change | ±10%, total weight retained at 1.00 | Stability check |
Table 1: Spatial-design variables, optimization parameters, feasibility constraints, and outcome definitions. This table summarizes the fixed exhibition-space parameters, variable design elements, feasibility constraints, objective-function settings and rationale, standard simulated annealing parameters, adaptive simulated annealing with reheating settings, virtual-reality scene parameters, participant-session procedures, data-integrity exclusion rules, and primary and secondary outcomes used in the protocol. SA = simulated annealing; SA-R = adaptive simulated annealing with reheating; VR = virtual reality.
| Category | Outcome | Manual layout | Standard SA | Adaptive SA-R | Statistical test / mean difference | p value | Effect size |
| Algorithm-performance outcomes | Final spatial cost | — | 0.475 ± 0.019 (95% CI, 0.468–0.482) | 0.424 ± 0.016 (95% CI, 0.418–0.430) | Welch t = 11.25; mean difference = −0.051 (95% CI, −0.060 to −0.042) | <0.001 | Cohen’s d = 2.90 |
| Improvement percentage (%) | — | 24.91 ± 3.22 (95% CI, 23.708–26.112) | 32.54 ± 3.29 (95% CI, 31.311–33.769) | Welch t = 9.07; mean difference = +7.63 (95% CI, 5.95 to 9.31) | <0.001 | Cohen’s d = 2.34 | |
| Iterations to best solution | — | 925.47 ± 86.38 (95% CI, 893.215–957.725) | 722.20 ± 90.19 (95% CI, 688.523–755.877) | Welch t = 8.92; mean difference = −203.27 (95% CI, −248.91 to −157.63) | <0.001 | Cohen’s d = 2.30 | |
| Runtime (s) | — | 47.83 ± 9.42 (95% CI, 44.313–51.347) | 55.86 ± 9.49 (95% CI, 52.316–59.404) | Welch t = 3.29; mean difference = +8.03 (95% CI, 3.14 to 12.92) | 0.002 | Cohen’s d = 0.85 | |
| Acceptance rate | — | 0.294 ± 0.045 (95% CI, 0.277–0.311) | 0.372 ± 0.054 (95% CI, 0.352–0.392) | Welch t = 6.08; mean difference = +0.078 (95% CI, 0.052 to 0.104) | <0.001 | Cohen’s d = 1.57 | |
| Visitor-experience outcomes | Presence | 3.77 ± 0.56 (95% CI, 3.625–3.915) | 3.99 ± 0.55 (95% CI, 3.848–4.132) | 4.28 ± 0.42 (95% CI, 4.172–4.388) | ANOVA F = 14.86 | <0.001 | η² = 0.144 |
| Spatial presence | 3.75 ± 0.64 (95% CI, 3.585–3.915) | 3.96 ± 0.63 (95% CI, 3.797–4.123) | 4.27 ± 0.47 (95% CI, 4.149–4.391) | ANOVA F = 11.99 | <0.001 | η² = 0.119 | |
| Interaction quality | 3.74 ± 0.56 (95% CI, 3.595–3.885) | 4.00 ± 0.57 (95% CI, 3.853–4.147) | 4.24 ± 0.57 (95% CI, 4.093–4.387) | ANOVA F = 11.68 | <0.001 | η² = 0.117 | |
| Wayfinding clarity | 3.61 ± 0.58 (95% CI, 3.460–3.760) | 3.90 ± 0.57 (95% CI, 3.753–4.047) | 4.17 ± 0.48 (95% CI, 4.046–4.294) | ANOVA F = 15.83 | <0.001 | η² = 0.152 | |
| Visual comfort | 3.67 ± 0.44 (95% CI, 3.556–3.784) | 3.87 ± 0.44 (95% CI, 3.756–3.984) | 4.07 ± 0.45 (95% CI, 3.954–4.186) | ANOVA F = 12.21 | <0.001 | η² = 0.121 | |
| Acoustic comfort | 3.64 ± 0.52 (95% CI, 3.506–3.774) | 3.75 ± 0.42 (95% CI, 3.642–3.858) | 3.97 ± 0.44 (95% CI, 3.856–4.084) | ANOVA F = 7.94 | <0.001 | η² = 0.082 | |
| Thermal comfort | 3.69 ± 0.46 (95% CI, 3.571–3.809) | 3.79 ± 0.32 (95% CI, 3.707–3.873) | 3.94 ± 0.44 (95% CI, 3.826–4.054) | ANOVA F = 5.61 | 0.004 | η² = 0.060 | |
| Perceived crowding | 3.01 ± 0.49 (95% CI, 2.883–3.137) | 2.75 ± 0.55 (95% CI, 2.608–2.892) | 2.56 ± 0.45 (95% CI, 2.444–2.676) | ANOVA F = 12.33 | <0.001 | η² = 0.122 | |
| Cognitive load | 3.21 ± 0.48 (95% CI, 3.086–3.334) | 2.87 ± 0.52 (95% CI, 2.736–3.004) | 2.73 ± 0.44 (95% CI, 2.616–2.844) | ANOVA F = 15.79 | <0.001 | η² = 0.151 | |
| Overall satisfaction | 3.59 ± 0.45 (95% CI, 3.474–3.706) | 3.96 ± 0.44 (95% CI, 3.846–4.074) | 4.37 ± 0.31 (95% CI, 4.290–4.450) | ANOVA F = 55.67 | <0.001 | η² = 0.386 | |
| Simulator sickness | 2.52 ± 0.55 (95% CI, 2.378–2.662) | 2.44 ± 0.58 (95% CI, 2.290–2.590) | 2.12 ± 0.56 (95% CI, 1.975–2.265) | ANOVA F = 8.47 | <0.001 | η² = 0.087 | |
| Behavioral trajectory outcomes | Completion time (min) | 19.11 ± 2.63 (95% CI, 18.431–19.789) | 17.42 ± 2.77 (95% CI, 16.704–18.136) | 14.93 ± 2.32 (95% CI, 14.331–15.529) | ANOVA F = 39.85 | <0.001 | η² = 0.311 |
| Dwell time (min) | 11.17 ± 2.03 (95% CI, 10.646–11.694) | 12.24 ± 2.04 (95% CI, 11.713–12.767) | 13.39 ± 2.28 (95% CI, 12.801–13.979) | ANOVA F = 16.46 | <0.001 | η² = 0.157 | |
| Walking distance (m) | 234.88 ± 24.34 (95% CI, 228.592–241.168) | 217.95 ± 24.33 (95% CI, 211.665–224.235) | 201.86 ± 23.47 (95% CI, 195.797–207.923) | ANOVA F = 28.28 | <0.001 | η² = 0.242 | |
| Hesitation count | 7.10 ± 1.80 (95% CI, 6.635–7.565) | 5.51 ± 1.79 (95% CI, 5.048–5.972) | 4.07 ± 1.99 (95% CI, 3.556–4.584) | ANOVA F = 39.74 | <0.001 | η² = 0.310 | |
| Heatmap coverage (%) | 66.18 ± 9.40 (95% CI, 63.752–68.608) | 74.14 ± 7.93 (95% CI, 72.091–76.189) | 84.40 ± 9.47 (95% CI, 81.954–86.846) | ANOVA F = 62.33 | <0.001 | η² = 0.413 |
Table 2: Algorithmic and participant-level outcomes across the three layout conditions. This table reports algorithm-performance outcomes, visitor-experience outcomes, and behavioral trajectory outcomes across the Manual layout, Standard SA (standard simulated annealing), and Adaptive SA-R (adaptive simulated annealing with reheating) conditions. Algorithm-performance comparisons are based on n = 30 independent optimization runs per algorithmic condition. Participant-level comparisons are based on n = 60 participants per layout condition. Values are reported as mean ± SD with 95% confidence intervals for the mean. For algorithm outcomes, the Statistical Test column also reports the mean between-algorithm difference and its 95% CI. The p-value and Effect Size columns provide the corresponding inferential result. Detailed pairwise participant sensitivity contrasts are presented in Supplementary Table S1. SD = standard deviation; CI = confidence interval; ANOVA = analysis of variance; SA = simulated annealing; SA-R = adaptive simulated annealing with reheating; η2 = eta-squared; d = Cohen's d.
Supplementary File 1. Hardware, software, and environmental-monitoring resources. Hardware, software, and environmental monitoring resources are used for spatial optimization and virtual reality experiments. Please click here to download this file.
Supplementary File 2. Participant screening and questionnaire/codebook framework. Participant screening criteria and questionnaire/codebook information, including the study domains, scoring ranges, and reporting conventions used for participant outcomes. Please click here to download this file.
Supplementary File 3. Adaptive SA-R pseudocode and analysis resources. Pseudocode for the Adaptive SA-R workflow, including the four proposal kernels, together with software dependencies, variable definitions, and figure-source file descriptions. Please click here to download this file.
Supplementary Table 1. Pairwise sensitivity comparisons of participant outcomes. Pairwise sensitivity comparisons were calculated using the group means, standard deviations, and sample sizes. Please click here to download this file.
토론
본 연구에서는 가중치 기반 공간 비용 모델, 재가열 기능이 포함된 적응형 시뮬레이티드 어닐링(adaptive simulated annealing), 그리고 가상 현실에서의 참여자 테스트를 결합한 재현 가능한 전시 배치 워크플로우를 평가하였습니다. 사전 정의된 36 m x 24 m 시나리오 내에서, 적응형 배치는 표준 시뮬레이티드 어닐링보다 낮은 공간 비용을 달성했으며, 더 높은 만족도, 더 강한 현존감, 더 명확한 길찾기, 더 짧은 이동 경로, 더 적은 망설임 및 더 넓은 공간 커버리지와 연관이 있는 것으로 나타났습니다. 여기서 “최적화되었다”라는 용어는 명시된 제약 조건 하에서 지정된 비용 함수의 값을 더 낮게 얻었다는 제한적인 수학적 의미로 사용되었으며, 해당 배치가 미적 품질, 정서적 반응, 서사적 순서 또는 가능한 모든 전시 목적에 대해 전역적으로 최적임을 의미하지는 않습니다. 공간 구성은 이동, 가시성 및 인지적 접근성을 형성할 수 있지만30,31, 디자인 품질은 여전히 다기준의 인간 중심적 판단 영역으로 남아 있습니다.
참가자 결과는 비록 제한적이긴 하지만 유용한 검증 계층을 추가하는데, 이는 여러 결과 지표가 목적 함수(objective function)의 직접적인 항목이 아니었기 때문입니다. 전반적인 만족도, 실재감, 인지 부하, 시뮬레이터 멀미, 체류 시간 및 히트맵 커버리지는 탐색 과정에서 최소화된 것이 아니라 레이아웃 생성 후에 측정되었습니다. 따라서 이러한 지표들의 방향성은 저비용 레이아웃이 단순히 보행 거리 단축으로 인한 수학적 결과물이 아니었음을 시사합니다32. 동시에, 이번 검증은 단일 사용자 가상 환경 내에서 이루어졌습니다. 이전의 가상 현실 숙련도는 내비게이션의 편안함과 성능에 영향을 미칠 수 있으며, 이를 상황 변수로 기록하기는 했으나 본 연구는 하위 그룹별 효과나 상호작용 효과를 추정할 수 있는 통계적 검정력을 갖추지 못했습니다. 그러므로 결과는 인구통계학적 또는 경험 관련 요인이 영향이 없다는 증거라기보다는, 레이아웃 간의 무작위 비교 결과로 해석되어야 합니다3,34.
알고리즘 비교 또한 보수적으로 해석되어야 합니다. 4가지 제안 커널의 정식 유도를 통해 가역적인 실행 가능 이동(reversible feasible moves)에 대해 전방 및 후방 조건부 제안 밀도가 대칭임을 확인하였으며, 결과적으로 Hastings 비율은 1이 되고 구현된 수락 규칙은 시뮬레이션 어닐링(simulated annealing) 내의 표준 Metropolis 규칙이 됩니다. 따라서 본 연구의 기여는 새로운 Metropolis-Hastings 알고리즘이 아니라, 단계별 이동 선택, 재가열, 명시적 실행 가능성 제약 및 재현 가능한 가상 환경 검증을 결합한 도메인 특화 설정에 있습니다. 표준 시뮬레이션 어닐링은 동일한 인코딩, 목적 함수, 제약 조건, 초기화, 냉각 일정 및 공칭 실행 예산을 공유하므로 적절한 대조군이 됩니다. 본 실험에는 수치적 GA, PSO, ACO 또는 학습 기반의 벤치마크 실행이 포함되지 않았으므로, 주장은 일치하는 표준 SA 베이스라인으로 제한됩니다. 또한, 결합된 설정으로는 제안 일정 계획과 재가열의 개별 효과를 분리하여 분석하지 않았습니다.
실제적인 트레이드오프는 테스트된 문제 크기에서는 유리했으나, 추가적인 벤치마킹 없이 일반화해서는 안 됩니다. 표준 시뮬레이티드 어닐링과 비교했을 때, 런타임은 16.8% 증가한 반면, 최종 공간 비용은 10.7% 더 낮았으며, 최적해에 도달하기 위한 반복 횟수는 22.0% 더 적었습니다. 이는 현재의 단층 모델에서 추가된 적응형 제어의 계산 비용이 감당 가능한 수준임을 시사합니다. 목적 함수 가중치 또한 ±10%의 섭동에 대해 방향성 있게 견고한 상태를 유지했으나, 가중치는 의도적으로 시나리오 특이적으로 설정되었습니다. 즉, 환경적 쾌적함이나 상호작용 균형보다 경로 효율성과 혼잡도가 우선시되었습니다. 예술적, 역사적, 과학적 또는 상업적 전시에서는 경로 효율성 중심의 비용 함수가 감점 요인으로 처리할 수 있는 비선형 순환이나 서사적 전이 등을 포함하여 다른 우선순위를 합리적으로 사용할 수 있습니다. 따라서 최적화는 큐레이팅이나 건축적 판단을 대체하는 것이 아니라, 트레이드오프를 명확하게 하는 의사결정 지원 레이어로 사용되어야 합니다35.
본 결론의 범위는 몇 가지 제한 사항에 의해 정의됩니다. 첫째, 검증 과정에서 하나의 직사각형 단층 가상 전시 공간과 한 번에 한 명의 참가자만을 대상으로 하였습니다. 따라서 더 큰 규모의 홀, 불규칙한 기하학적 구조, 다층 순환 구조, 동시다발적인 그룹 이동, 대인 회피, 동적인 혼잡도, 신체적 피로 및 실제 환경의 방해 요소들은 테스트되지 않았습니다. 둘째, 비교군에 대표적인 진화 알고리즘, 군집 지능 또는 학습 기반 최적화 도구가 포함되지 않았으며, 단계별 제안 확률의 효과를 재가열(reheating) 효과와 분리하여 분석하는 구성 요소 제거(component-ablation) 실험이 수행되지 않았습니다. 셋째, 참가자의 평가에는 여전히 주관적인 부분이 남아 있으며, 무작위 배정을 했더라도 이전의 가상현실 경험이 내비게이션 및 편안함에 영향을 미쳤을 수 있습니다. 본 연구는 하위 그룹 분석이나 조절 변수 분석을 위해 설계되지 않았습니다. 넷째, 만족도, 실재감, 인지 부하, 시뮬레이터 멀미, 체류 시간 및 히트맵 커버리지는 명시적인 공간 비용 항은 아니지만, 본 연구에서는 독립적인 주의집중도, 정서적 반응, 학습 효과 또는 장기 기억 종점(endpoints)을 수집하지 않았습니다. 다섯째, 공간 비용 함수는 정서적 반응, 큐레이팅 내러티브, 놀라움, 의미 형성 또는 장기 기억과 같은 질적 차원을 직접적으로 표현할 수 없습니다. 여섯째, 짧은 가상현실 노출은 더 긴 세션 동안 발생하는 불편함을 과소평가할 가능성이 있습니다36,37. 이러한 제한 사항들은 본 프레임워크를 모든 전시 환경에 대해 일반적으로 검증된 최적화 도구라기보다, 테스트된 시나리오에 대한 재현 가능한 워크플로 입증 사례로 보아야 함을 의미합니다.
향후 연구에서는 더 넓고 불규칙하며 다층 구조인 공간에서 본 프레임워크를 테스트하고, 다수 사용자 군중 시뮬레이션과 물리적 또는 혼합 현실 검증을 포함하며, 주의력, 정서적 반응, 학습 및 지연 기억에 대한 객관적 평가지표를 추가하고, 단계별 제안 스케줄링 및 리히팅(reheating)에 대한 구성 요소별 어블레이션(ablation) 연구를 수행해야 합니다. 알고리즘의 경쟁력은 NSGA-II38, 입자 군집 최적화(particle swarm optimization)39, 개미 시스템/개미 군집 최적화(Ant System/ant-colony optimization)40와 같은 대표적인 대안들과 동일한 계산 예산 조건 하에서 테스트되어야 하며, 방법론별 파라미터 튜닝 결과가 투명하게 보고되어야 합니다. 또한, 서사 순서, 접근성, 교육적 효과, 정서적 참여 또는 체류 시간 목표가 현재 시나리오와 다를 경우, 전시 특화 선호도 도출을 통해 목적 함수 가중치를 재조정할 수 있습니다. 이러한 확장 연구는 하나의 고정된 비용 함수가 최적의 전시 경험을 정의한다고 가정하지 않고, 확장성, 전이 가능성 및 알고리즘 경쟁력을 평가하게 될 것입니다.
공개 사항
저자들은 상충하는 재정적 이해관계가 없음을 밝힙니다.
감사의 글
저자들은 가상 현실 전시 평가에 참여해주신 참가자분들께 감사드립니다. 또한, 몰입형 전시 공간 디자인 워크플로우의 개발 및 평가를 지원해준 허난 농업대학교(Henan Agricultural University)의 예술 및 디자인 학부와 정보 및 경영 과학 대학에 감사를 표합니다. 본 연구는 외부 지원금을 받지 않았습니다. 본 연구는 저자들의 자체 리소스와 허난 농업대학교의 일반 기관 시설의 지원을 받아 수행되었습니다.
재료
| 이름 | 회사 | 카탈로그 번호 | 댓글 |
|---|---|---|---|
| 3D 모델링 소프트웨어 | Blender Foundation | N/A | Blender 4.0.2; 전시 공간 기하구조, 테마 구역, 파티션 및 공간 에셋 구축에 사용됨. RRID:SCR_08606 |
| 분석 스크립트 | Custom research scripts | N/A | Version 1.0; 통계 분석, 민감도 분석, 신뢰 구간 계산 및 그림 데이터 준비에 사용됨. |
| 이산화탄소 측정기 | Testo SE & Co. KGaA | testo 535; 0563 0535 | 디지털 CO2 측정기; 측정 범위 0–10,00 ppm; 사전 정의된 환경 목표에 따른 이산화탄소 농도의 프로토콜 제어 확인용으로 사용됨. |
| 데스크톱 워크스테이션 | Dell Technologies | Precision 360 Tower | 32 GB RAM; 가상 장면 렌더링, 레이아웃 시뮬레이션, 알고리즘 실행 및 참가자 세션 로깅에 사용됨. |
| 그림 생성 스크립트 | Custom research scripts | N/A | Version 1.0; 알고리즘 성능 도표, 방문자 결과 도표 및 궤적 히트맵 생성에 사용됨. |
| 게임 엔진 / VR 플랫폼 | Unity Technologies | N/A | Unity 202.3.2f1 LTS; 가상 전시 장면을 구축하고 실행하는 데 사용됨. |
| 헤드 마운트 디스플레이 | Meta Platforms, Inc. | Meta Quest 2 (128 GB) | 6-DoF 단독형 HMD; 안구당 1832 × 1920 픽셀; 90 Hz 세션 재생률; 몰입형 가상 현실 장면을 제공하고 참가자의 움직임을 추적하는 데 사용됨. |
| 조도계 | Testo SE & Co. KGaA | testo 540; 0560 0540 | 디지털 럭스 미터; 측정 범위 0–9,99 lx; 사전 정의된 환경 목표에 따른 조도의 프로토콜 제어 확인용으로 사용됨. |
| NumPy | NumPy Developers | N/A | Version 1.26.4; 수치 배열 연산 및 데이터 준비에 사용됨. RRID:SCR_0863 |
| 최적화 스크립트 | Custom research script | N/A | Python 3.1, version 1.0; 단계별 제안 선택, Metropolis 수용 및 재가열을 포함한 표준 SA 및 재가열 적응형 시뮬레이티드 어닐링(Adaptive SA-R)을 구현함. |
| pandas | pandas development team | N/A | Version 2.1.4; 데이터셋 정제, 표 작성 및 그림용 데이터 준비에 사용됨. RRID:SCR_018214 |
| 참가자 스크리닝 양식 | Custom research form | N/A | Version 1.0; 적격성, 인구통계학적 변수, 이전 가상 현실 경험 및 박물관/전시 관람 빈도를 기록하는 데 사용됨. |
| 경험 후 평가 설문지 | Custom research form | N/A | Version 1.0; 7점 척도; 상호작용 품질, 길 찾기 명확성, 시각적/청각적/열적 쾌적성, 인지된 혼잡도, 인지 부하 및 전반적인 만족도를 평가하는 데 사용됨. |
| 현존감 및 공간 현존감 평가 양식 | Custom research form | N/A | Version 1.0; PQ/IPQ 프레임워크를 참조하여 해석된 연구 특정적 7점 도메인 점수; 표준 PQ 또는 IPQ 총점은 보고되지 않음. |
| Python 프로그래밍 언어 | Python Software Foundation | N/A | Version 3.1; 알고리즘 실행, 비용 함수 계산, 데이터 처리 및 민감도 분석에 사용됨. RRID:SCR_08394 |
| SciPy | SciPy community | N/A | Version 1.1.4; 통계 테스트 및 보조 수치 분석에 사용됨. RRID:SCR_08058 |
| 시뮬레이터 멀미 평가 양식 | Custom research form | N/A | Version 1.0; SSQ 증상 프레임워크에 기반한 사전 지정된 0–30 연구 요약; 표준 가중 SSQ 총 심각도 점수와는 구별됨. |
| 소음계 | Testo SE & Co. KGaA | testo 816-1; 0563 8170 | IEC 61672-1 Class 2; 30–130 dB; A/C 주파수 가중치; 사전 정의된 환경 목표에 따른 음압 레벨의 프로토콜 제어 확인용으로 사용됨. |
| 스프레드시트 소프트웨어 | Microsoft | N/A | Microsoft Excel 2021; 데이터셋 구성, 코드북 준비 및 보조 스프레드시트 파일 작성에 사용됨. RRID:SCR_016137 |
| 통계 소프트웨어 | IBM | N/A | IBM SPSS Statistics 27.0; ANOVA, Welch 테스트, 가정 검정 및 보조 통계 검증에 사용됨. RRID:SCR_02865 |
| 온도 모니터 | Testo SE & Co. KGaA | testo 605i; 0560 2605 03 | 온습도계; 온도 범위 −20 ~ +60 °C; 0.1 °C 분해능; 사전 정의된 환경 목표에 따른 주변 온도의 프로토콜 제어 확인용으로 사용됨. |
| VR 통합 패키지 | Unity Technologies | N/A | XR Interaction Toolkit 2.5.4; VR 상호작용, 이동 제어, 트리거 이벤트 및 궤적 로깅에 사용됨. |
| 참고: 본 연구에서는 생물학적 자원을 사용하지 않았습니다. 해당되는 연구 자원에 대해 RRID를 제공합니다. |
참고문헌
- Falk JH, Dierking LD. The museum experience revisited. Left Coast Press; Walnut Creek, CA; 2013.
- Hillier B, Hanson J. The social logic of space. Cambridge University Press; Cambridge; 1984.
- Turner A, Doxa M, O'Sullivan D, Penn A. From isovists to visibility graphs: a methodology for the analysis of architectural space. Environ Plan B Plan Des. 2001;28:103-21.
- Kuliga SF, Thrash T, Dalton RC, Hölscher C. Virtual reality as an empirical research tool: exploring user experience in a real building and a corresponding virtual model. Comput Environ Urban Syst. 2015;54:363-75.
- Radianti J, et al. A systematic review of immersive virtual reality applications for higher education: design elements, lessons learned, and research agenda. Comput Educ. 2020;147:103778.
- Cummings JJ, Bailenson JN. How immersive is enough? A meta-analysis of the effect of immersive technology on user presence. Media Psychol. 2016;19:272-309.
- Witmer BG, Singer MJ. Measuring presence in virtual environments: a presence questionnaire. Presence-Teleop Virt. 1998;7:225-40.
- Makransky G, Petersen GB. The Cognitive Affective Model of Immersive Learning: a theoretical research-based model of learning in immersive virtual reality. Educ Psychol Rev. 2021;33:937-58.
- Kennedy RS, Lane NE, Berbaum KS, Lilienthal MG. Simulator Sickness Questionnaire: an enhanced method for quantifying simulator sickness. Int J Aviat Psychol. 1993;3:203-20.
- Kirkpatrick S, Gelatt CD Jr, Vecchi MP. Optimization by simulated annealing. Science. 1983;220:671-80.
- Metropolis N, et al. Equation of state calculations by fast computing machines. J Chem Phys. 1953;21:1087-92.
- Hastings WK. Monte Carlo sampling methods using Markov chains and their applications. Biometrika. 1970;57:97-109.
- Aarts EHL, Korst JHM. Simulated annealing and Boltzmann machines: a stochastic approach to combinatorial optimization and neural computing. John Wiley & Sons; Chichester; 1989.
- Van Laarhoven PJM, Aarts EHL. Simulated annealing: theory and applications. D. Reidel Publishing Company; Dordrecht; 1987.
- Bertsimas D, Tsitsiklis J. Simulated annealing. Stat Sci. 1993;8:10-5.
- Talbi EG. Metaheuristics: from design to implementation. John Wiley & Sons; Hoboken, NJ; 2009.
- Sörensen K. Metaheuristics: the metaphor exposed. Int Trans Oper Res. 2015;22:3-18.
- Hillier B. Space is the machine: a configurational theory of architecture. Cambridge University Press; Cambridge; 1996.
- Lolli F, et al. Post-Occupancy Evaluation's (POE) applications for improving indoor environment quality (IEQ). Toxics. 2022;10:626.
- Ministry of Housing and Urban-Rural Development of the People's Republic of China, State Administration for Market Regulation. GB/T 50034-2024 Standard for lighting design of buildings. Beijing; 2024.
- State Administration for Market Regulation, Standardization Administration of China. GB/T 23863-2024 Specification for lighting design of museum. Beijing; 2024.
- State Administration for Market Regulation, Standardization Administration of China. GB/T 18883-2022 Standards for indoor air quality. Beijing; 2022.
- Ministry of Housing and Urban-Rural Development of the People's Republic of China, General Administration of Quality Supervision, Inspection and Quarantine. GB/T 50785-2012 Evaluation standard for indoor thermal environment in civil buildings. Beijing; 2012.
- Ministry of Environmental Protection of the People's Republic of China, General Administration of Quality Supervision, Inspection and Quarantine. GB 3096-2008 Environmental quality standard for noise. Beijing; 2008.
- Chib S, Greenberg E. Understanding the Metropolis-Hastings algorithm. Am Stat. 1995;49:327-35.
- Slater M, Sanchez-Vives MV. Enhancing our lives with immersive virtual reality. Front Robot AI. 2016;3:74.
- Schubert T, Friedmann F, Regenbrecht H. The experience of presence: factor analytic insights. Presence-Teleop Virt. 2001;10:266-81.
- Stanney KM, Kennedy RS, Drexler JM. Cybersickness is not simulator sickness. Proc Hum Factors Ergon Soc Annu Meet. 1997;41:1138-42.
- Blum C, Roli A. Metaheuristics in combinatorial optimization: overview and conceptual comparison. ACM Comput Surv. 2003;35:268-308.
- Benedikt ML. To take hold of space: isovists and isovist fields. Environ Plan B Plan Des. 1979;6:47-65.
- Penn A. Space syntax and spatial cognition: or why the axial line? Environ Behav. 2003;35:30-65.
- Sherman WR, Craig AB. Understanding virtual reality: interface, application, and design. Morgan Kaufmann; San Francisco, CA; 2003.
- Slater M. Place illusion and plausibility can lead to realistic behaviour in immersive virtual environments. Philos Trans R Soc Lond B Biol Sci. 2009;364:3549-57.
- Sweller J. Cognitive load during problem solving: effects on learning. Cogn Sci. 1988;12:257-85.
- Heydarian A, Carneiro JP, Gerber D, Becerik-Gerber B. Immersive virtual environments versus physical built environments: a benchmarking study for building design and user-built environment explorations. Autom Constr. 2015;54:116-26.
- Rebenitsch L, Owen C. Review on cybersickness in applications and visual displays. Virtual Real. 2016;20:101-25.
- Clay V, König P, König SU. Eye tracking in virtual reality. J Eye Mov Res. 2019;12:3.
- Deb K, Pratap A, Agarwal S, Meyarivan T. A fast and elitist multiobjective genetic algorithm: NSGA-II. IEEE Trans Evol Comput. 2002;6:182-97.
- Kennedy J, Eberhart RC. Particle Swarm Optimization. Proc IEEE Int Conf Neural Netw. 4, 1942-1948.
- Dorigo M, Maniezzo V, Colorni A. Ant system: optimization by a colony of cooperating agents. IEEE Trans Syst Man Cybern B Cybern. 1996;26:29-41.