This longitudinal observational study compares material, indoor-environmental, energy, functional, and heritage outcomes across three existing conservation strategies in 72 historic masonry buildings and provides a reproducible monitoring and analysis protocol.
연구 논문
Material Performance and Environmental Response in Historic Masonry Buildings: A Multicenter Longitudinal Observational Study
이 논문에서
요약
초록
Adaptive reuse can extend the service life of historic buildings, but its performance must be evaluated without assuming that more intensive intervention causes better outcomes. This multicenter longitudinal observational study compared 72 historic masonry buildings in Guangzhou, Nanjing, and Xi'an managed under conservation-only, material-compatible passive retrofit, or adaptive reuse with reversible environmental control. Archived baseline-to-month-12 wall-moisture change was −0.23 ± 0.95, −2.09 ± 0.78, and −2.37 ± 0.86 percentage points, respectively. In the primary ANCOVA, strategy was associated with month-12 wall moisture (F(2,61) = 40.96, P < 0.001); adjusted differences were −1.88 points for passive retrofit versus conservation-only (95% CI, −2.40 to −1.36) and −2.20 for adaptive reuse versus conservation-only (95% CI, −2.73 to −1.67), while adaptive reuse and passive retrofit did not differ (−0.32; 95% CI, −0.84 to 0.20; Holm-adjusted P = 0.222). The monthly humidity ratio showed no independent association with strategy (P = 0.410). In a transparent reanalysis of all five questionnaire outcomes, respondent-rated thermal comfort (q = 0.0038), functional fit (q = 0.0110), and heritage authenticity (q = 0.0038) were associated with strategy, whereas perceived air quality and overall satisfaction were not (both q = 0.592). Archived thermal-comfort-hour percentages, soluble-salt percentages, and monthly wall-moisture summaries were not used for confirmatory inference because their underlying classification, extraction/conversion, or acquisition/calibration records were unavailable. The supported findings are adjusted observational associations and do not establish causation.
서론
Historic buildings embody cultural, architectural, social, and material values, but their continued survival depends on their capacity to remain usable under changing urban, environmental, and functional conditions. Adaptive reuse can extend the service life of existing buildings, reduce vacancy and demolition, and reconnect inherited structures with contemporary activities. Its effectiveness, however, depends on the compatibility between the new function, the existing building, and the degree of physical intervention. Research on heritage-building reuse has shown that successful projects require more than assigning a new function; they require coordinated decisions regarding physical condition, use, maintenance, cultural significance, financial viability, and stakeholder expectations1,2.
The implementation of adaptive reuse is complicated by the restrictions attached to protected fabric and by the diversity of historic construction. Existing wall assemblies may contain irregular masonry, lime-based mortar, porous finishes, timber elements, previous repairs, and concealed alterations whose behavior differs from that of modern building systems. Regulatory requirements, ownership structures, technical uncertainty, project costs, and conflicts among stakeholders can therefore delay or limit otherwise viable reuse proposals3. These constraints are especially important when interventions intended to improve usability or energy performance require new services, changes in ventilation, internal insulation, surface treatments, or modifications to the original spatial organization.
The environmental argument for reuse often centers on extending the life of an existing asset and avoiding the material and carbon demands of demolition and replacement. Buildings that are adaptable to future changes may remain useful for longer and generate fewer repeated cycles of demolition and reconstruction. Design-for-adaptability research has consequently emphasized reversibility, access to services, spatial flexibility, material durability, and the capacity to accommodate later alterations without major fabric loss4. Historic buildings were not originally designed according to these principles, but conservation planning can apply them retrospectively by favoring interventions that are limited, removable, and compatible with the inherited structure.
Energy improvement introduces a more difficult balance. Historic buildings often have thick walls, high thermal mass, natural ventilation pathways, and construction details that cannot be assessed with assumptions based on modern sealed envelopes. Standard retrofit measures may reduce heat transfer but alter moisture movement, remove significant finishes, or introduce condensation at previously stable interfaces. Energy renovation must therefore be adapted to the construction, climate, use, and heritage significance of each building rather than treated as a standardized package5. A retrofit that performs well in energy terms may still be unsuitable if it traps moisture, damages original materials, or requires irreversible alteration5,6.
Reviews of energy retrofits in traditional and historic buildings have identified moisture risk, uncertain material properties, discontinuous insulation, thermal bridging, air leakage, occupant behavior, and limited post-intervention monitoring as recurring methodological problems5,6. Many studies rely on predicted energy savings or short-term environmental measurements without simultaneously examining material response. This is a critical limitation because the environmental performance of a historic building is inseparable from the continued stability of its masonry, mortar, finishes, and embedded salts.
A further difficulty is that improvements in operational energy do not necessarily represent the full environmental performance of a conservation project. The effect of a retrofit depends on the baseline building, the extent of retained material, the carbon and material burden of the intervention, the operating schedule, and the services provided after reuse. Whole-building assessments have therefore called for energy performance to be evaluated together with environmental sustainability and conservation compatibility7. This distinction becomes particularly important when a reused building operates for longer hours or serves more users than before the intervention.
Post-occupancy studies also indicate that measured energy and environmental conditions should be considered alongside user experience. Historic buildings can accommodate contemporary activities and provide acceptable indoor environmental quality, but this outcome depends on design decisions involving ventilation, daylight, water management, spatial organization, and retained materials8. A technically efficient intervention may remain unsuccessful if occupants perceive the building as uncomfortable, functionally unsuitable, or disconnected from its historic character.
Long-term indoor monitoring is necessary because temperature and relative humidity vary with climate, building use, ventilation, thermal mass, and environmental control operations. Historical microclimate research has shown that annual or seasonal patterns provide information that cannot be obtained from isolated measurements, particularly when conservation risks are related to repeated fluctuations or threshold exceedance rather than annual mean conditions9. Continuous environmental data can therefore support preventive conservation by identifying when and where damaging conditions occur.
Material response must be monitored with equal care. Traditional brick masonry exhibits coupled heat and moisture behavior influenced by wall thickness, orientation, rainfall, mortar properties, finishes, indoor conditions, and previous interventions. Field and laboratory evaluations have demonstrated that moisture response can differ substantially among apparently similar historic walls and cannot be inferred from indoor temperature or energy performance alone10. Wall-moisture measurements should therefore be interpreted together with external exposure, drainage, vertical sampling position, and evidence of salts or surface deterioration.
Repair materials add another source of uncertainty. Mortars and plasters influence water absorption, evaporation, salt transport, mechanical compatibility, and the visual continuity of historic surfaces. Their suitability cannot be determined solely from strength or appearance; performance must be considered in relation to the existing masonry and the exposure conditions in which the repair will function11. Material compatibility is consequently a central mechanism linking conservation strategy to long-term wall performance.
Despite growing research on adaptive reuse, energy retrofits, indoor comfort, and conservation materials, these areas are frequently examined in isolation. Few multicenter field studies have compared low-intervention conservation, material-compatible passive retrofit, and adaptive reuse with active but reversible environmental control using the same material, environmental, energy, functional, and authenticity outcomes. Evidence is particularly limited on whether more intensive reuse provides additional material benefits beyond those achievable through compatible passive measures and whether gains in usability are accompanied by changes in energy demand or perceived authenticity.
This study compared 72 historic masonry buildings across three Chinese climate zones over a complete annual monitoring period. The primary hypothesis was that buildings already managed with material-compatible passive retrofit or adaptive reuse with reversible environmental control would show greater 12 month reductions in wall moisture than conservation-only buildings after adjustment for baseline moisture, city, building characteristics, exposure, and occupancy; no directional superiority hypothesis was specified for adaptive reuse versus passive retrofit. Secondary analyses compared material-condition, psychrometric, indoor-environmental, energy, functional, and authenticity outcomes, treating them as distinct outcome families with multiplicity control.
프로토콜
Documentation of ethical and heritage-management approvals
Written permission was obtained from the owner, institution, or heritage-management authority for building access, environmental monitoring, photography, and material assessment. Removable fixtures were used, and decorated surfaces, inscriptions, original finishes, and structurally sensitive locations were avoided. Permission records were retained and, where required, the approving heritage authorities were documented in the study records.
Survey participants received written study information and provided written informed consent before participation. Direct identifiers were omitted from the analytical database. The study protocol was reviewed and approved by the Ethics Committee on Human Research Protection, School of Architecture and Environmental Art, Shanghai Urban Construction Vocational College (Approval No. 5231BO1153). Written informed consent was obtained from all questionnaire participants.
Definition of the observational study design and setting
The study was defined as a multicenter longitudinal observational comparison of buildings already managed under three conservation strategies; the strategies were neither randomized nor assigned by the investigators. The study was conducted in Guangzhou, Nanjing, and Xi’an, representing hot-humid, hot-summer/cold-winter, and cold-dry climates. Installation, calibration, baseline building assessment, and material testing were completed between December 15 and December 31, 2024, and monitoring was conducted from January 1 through December 31, 2025.
A complete annual cycle was used to capture seasonal rainfall, outdoor temperature, humidity, wall drying, occupancy, and environmental control operation. Building documentation, continuous environmental monitoring, repeated material measurements, verified energy records, and post-occupancy assessments were linked by a unique building identifier. The city-specific candidate frames were screened using the following criteria. Buildings were included if they were at least 50 years old, were constructed primarily from brick or stone masonry, appeared in a municipal heritage register or institutional conservation inventory, retained at least 60% of the original external-wall fabric, remained accessible during follow-up, had a stable strategy completed at least 6 months before baseline, and had repeatable wall-measurement locations plus occupancy and energy records. Buildings were excluded if they underwent major reconstruction during screening or follow-up, had unresolved roof failure or active plumbing leakage affecting the monitored wall, had non-masonry external walls, had incomplete intervention records, had insufficient monitoring access, or lacked repeatable measurements. One primary exclusion reason was recorded for every excluded candidate in the screening log.
Selection of buildings and classification of existing conservation strategies
Buildings were selected using stratified purposive sampling rather than random allocation. A quota of eight eligible buildings was prespecified for each city-strategy cell, resulting in 24 buildings per strategy and 72 buildings in total. Screening continued in each city until all quotas were filled, and all screened candidates and exclusions were documented. This balanced quota prevented complete confounding of city and strategy but did not create exchangeable or randomized groups.
Conservation-only was defined as maintenance or local stabilization without systematic environmental or thermal upgrading; material-compatible passive retrofit as vapor-permeable, low-intervention repair combined with drainage, openings, shading, and passive ventilation measures; and adaptive reuse with reversible environmental control as contemporary use supported by removable or minimally invasive demand-controlled ventilation, localized dehumidification, and limited heating/cooling. Equipment was classified as reversible only when its removal would not cause permanent loss of significant historic fabric12.
The conservation strategy was classified based on intervention records, construction drawings, site inspections, equipment inventories, and an interview with the responsible building manager. Before monitoring, the building age, gross floor area, external wall thickness, masonry type, original and current use, weekly occupied hours, occupancy density, rain exposure, drainage condition, intervention age, retained historic fabric, material compatibility, and environmental-control intensity were recorded. Classification uncertainty was resolved by document review and joint site review before outcomes were examined. Table 1 gives the operational definitions and explicitly identifies the non-random sampling basis.
Completion of the baseline building and intervention assessment
A structured field form was used to document the construction form, wall composition, mortar, finishes, roof and drainage condition, visible dampness, salt deposits, biological growth, cracking, and prior repairs. Each assessment zone was photographed perpendicular to the wall with a scale and fixed reference distances. Wall thickness was obtained from drawings or accessible openings and recorded to the nearest 10 mm.
Rain exposure and drainage were scored using written 0–10 rubrics. The rain-exposure score incorporated façade orientation, shelter, prevailing wind, roof projection, splash back, and rain staining, with higher values indicating greater exposure. The drainage score incorporated roof drainage, gutters, downpipes, ground drainage, and evidence of standing water, with higher values indicating better drainage. The item-level form was retained with the study records so that the total score could be reproduced.
Material compatibility (0 = incompatible, impermeable, or irreversible intervention; 10 = fully compatible, vapor-permeable, mechanically appropriate, and reversible) and environmental-control intensity (0 = no active control; 10 = extensive automated heating, cooling, ventilation, or dehumidification) were independently scored by two conservation specialists. The two ratings were averaged, and when they differed by more than two points, a documented joint review was conducted. Retained historic fabric was estimated from drawings, repair records, photographs, and site inspection. The two specialists used the same written scoring rubrics. Inter-rater reliability statistics could not be reconstructed from the retained study records and, therefore, were not reported.
Installation, validation, and summary of environmental monitoring
At least two CO₂/temperature/relative-humidity loggers were installed in representative occupied zones of each building. The loggers were positioned 1.1–1.5 m above the floor and away from direct sunlight, external doors, supply-air outlets, heat sources, and visibly damp surfaces. Temperature, relative humidity, and CO₂ were recorded at 10 min intervals, and the logger identifier, room, height, installation date, and any relocations were documented.
Instruments meeting at least ±0.3 °C temperature accuracy, ±2 percentage-point relative-humidity accuracy, and ±50 ppm plus 3% of reading for CO₂ were used. Shielded outdoor loggers were installed within each city cluster, and daily precipitation data were obtained from the nearest official meteorological station. The instrument model and manufacturer were recorded in the Table of Materials.
Sensors were checked against retained reference instruments before installation and at months 3, 6, 9, and 12. Sensors were recalibrated or replaced when deviation exceeded 0.5 °C, 3 percentage points of relative humidity, or 100 ppm CO₂. Data collected during power interruption, maintenance, documented drift, or equipment failure were marked invalid. Monthly summaries were calculated only when at least 75% of the expected 10 min observations were valid, and annual summaries were calculated only when at least nine months of data were valid.
Indoor humidity ratio was derived from paired temperature and relative-humidity observations using ASHRAE psychrometric equations at standard atmospheric pressure (101.325 kPa). Water-vapor partial pressure was calculated as Pv = (RH/100) × pws(T), where RH is the measured relative humidity (%) and pws(T) is saturation vapor pressure at the measured temperature; W = 0.621945Pv/(P−Pv) was then calculated, and 1,000 W was reported as g/kg dry air. If either input was missing, the humidity ratio was retained as missing. Indoor temperature, relative humidity, humidity ratio, wall moisture, RH > 75% h, occupied-period CO₂, thermal-comfort hours, and energy use were summarized separately13. The measurement framework and quality-control criteria are summarized in Table 2.
Occupied intervals were derived from operating schedules, access records, visitor counts, or staff logs. The retained monthly analysis file contained a derived percentage labeled thermal_comfort_hours_pct, but it did not contain the interval-level operative temperature, mean radiant temperature, air speed, clothing, metabolic rate, prevailing outdoor temperature, equipment/window-state records, valid occupied-interval counts, or classification code needed to identify the standard, acceptability category, numerical limits, or mode-switch rule used in 2025. The percentage, therefore, could not be independently reconstructed and was not used for inferential conclusions. ANSI/ASHRAE Standard 55-202314 was consulted only as a reporting framework for the missing inputs; its adaptive and standard-method criteria were not retrospectively assigned to the archived percentages.
Measurement of material performance and wall condition
At baseline and at month 12, three fixed measurement zones were established on one representative external wall per building, at approximately 0.3, 1.2, and 2.1 m above the adjacent ground or floor level. The zones were marked using photographs and fixed reference distances. Height, orientation, substrate, finish, and access status were recorded, and inaccessible locations were retained as missing rather than replaced. Three T660 readings were obtained within a 150 mm radius at each height; their mean was used, and the set was repeated after inspection if one reading differed from the other two by more than 20%. The retained building-month file also contained 847 wall-moisture summary values. However, it did not preserve monthly visit dates, height-level readings, material-specific calibration equations, reference gravimetric measurements, or the aggregation and invalidity rules needed to reconstruct those monthly values. Monthly wall-moisture trajectories and longitudinal models were therefore treated as descriptive archive summaries and not used to draw inferential conclusions. Supplementary Figure S1 shows the baseline/month-12 wall assessment and indoor monitoring geometry.
The same fixed wall zones were used at baseline and month 12 to relate rain exposure, splashback, capillary rise, evaporation, indoor monitoring, and material condition measures. Wall moisture was measured with a dielectric moisture indicator. The moisture indicator manual characterizes readings in ordinary building materials primarily as comparative indications; conversion to mass-percent moisture requires a material-specific gravimetric calibration. The retained files did not contain the calibration specimens, equations, ranges, or uncertainty estimates, so the archived percentage values could not be independently traced to dry-basis gravimetric moisture content. The endpoint analysis used the archived derived values, and this measurement limitation was carried into the interpretation.
Soluble salts were screened in surface or shallow powder samples by aqueous extraction, followed by conductivity measurement using a benchtop conductivity meter. The retained analysis file contained a derived variable labeled soluble_salt_pct. However, the supplied records did not contain the dry sample masses, extraction volumes and durations, water-blank readings, calibration standards, temperature-compensation settings, raw conductivity readings, ion-specific measurements, or the equation used to derive percentage values. The percentage values, therefore, could not be independently reconstructed and were treated as unverified legacy-derived values rather than ion-specific concentrations; they were excluded from confirmatory material-family inference.
The primary outcome was defined as the building-level month-12 archived wall-moisture value, adjusted for its archived baseline value; the unadjusted change from baseline in percentage points was also reported. Confirmatory secondary material outcomes were visible deterioration area, ultrasonic pulse velocity, surface hardness, and maximum crack width. The archived soluble-salt percentage was reported only as an unreconstructed, legacy-derived variable and was excluded from confirmatory inference. Height-level observations were retained and averaged only for the prespecified building-level analyses.
Reconciliation of energy, occupancy, and operational-carbon records
Monthly electricity and fuel records were obtained from utility bills, submeters, or facility-management systems. All energy carriers were converted to kWh and matched to the monitored floor area boundary. For each building, the reconciliation factor was calculated by dividing the verified annual energy-use intensity by the sum of its available raw monthly energy-use intensities. Each available raw monthly value was then multiplied by this factor. Missing source months were retained as missing, and the available monthly profile was scaled without altering its relative seasonal pattern. The resulting monthly sum was checked against the verified annual total, and the raw values, reconciliation factors, reconciled values, and annual residual were retained in an audit file.
Weekly occupied hours were verified quarterly using access records, schedules, visitor counts, or staff logs. Annual energy use was reported as kWh/m2 and kWh/m2 per 100 occupied hours. Total and use-normalized energy were analyzed separately because adaptive reuse could increase service hours without changing energy use per unit of service.
Operational-carbon results were not reported because the retained study files did not document the applicable regional annual emission factor, source year, and system boundary sufficiently for verification. Because complete intervention quantities were also unavailable, no comparative claims were made for operational, embodied, avoided, or whole-life carbon. Retained-fabric information was described separately, and this limitation was identified in the Discussion.
Administration of postoccupancy, functional, and heritage measures
Between October 1 and December 15, 2025, six respondents were recorded for each building (n = 432). The retained analytical file identified one manager, one staff member, one visitor, one tenant, one conservation specialist, and one maintenance respondent per building. Each respondent had a unique within-building number, and no direct identifier or respondent-age field was present in the analytical file.
After participants had spent at least 30 min in the monitored space, the same author-developed questionnaire was administered. The retained analytical file contained five study-specific outcome scores: thermal comfort, perceived air quality, and overall satisfaction on numeric 1–7 ranges, and functional fit and heritage authenticity on numeric 0–100 ranges. The administered questionnaire, item wording, number of items contributing to each score, verbal endpoint anchors, scoring algorithm, administered-language version, translation/adaptation record, and validation record were not present in the supplied study files. Item-level responses were also unavailable; internal consistency, structural validity, test–retest reliability, and cross-cultural validity, therefore, could not be calculated. The outcomes were treated as exploratory, study-specific continuous scores rather than validated scales. Decimal values in the 1–7 fields were retained as recorded derived scores; the archive did not establish whether they represented multi-item means, continuous-slider responses, weighted scores, or transformed values.
The five questionnaire outcomes were analyzed separately at the respondent level. Outcome-specific available case samples were used because item-level responses and a missing-item scoring key were unavailable. Respondent-derived building means were calculated only for descriptive summaries and sensitivity analyses; the three similarly named fields in the building registry were not substituted because they were not exact means of the deposited respondent records deposited.
Validation of data and management of missing observations
All records were linked using a unique building identifier. The dataset was screened for duplicate timestamps, impossible dates, relative humidity values outside 0–100%, negative energy values, CO₂ values outside the validated instrument range, inconsistent units, and values outside instrument limits. Each flagged record was resolved against field forms, photographs, calibration records, sensor logs, and source documents. Physically plausible extreme values were retained when supported.
Missingness was summarized by variable, building, city, strategy, month, height, and source. Monthly sensor outcomes were not interpolated in the primary longitudinal analyses, and primary outcomes were not imputed. Complete observations were used for analyses with low missingness, whereas multiple imputation was used only for retained covariates with 5–20% missingness. The imputation variables, iterations, datasets, convergence, and pooling procedures were documented.
Cross-file consistency was audited before analysis. Included building identifiers were confirmed to match across the screening, building-level, monthly, material, and questionnaire datasets. The building-level analysis registry was used as the authoritative source for included-building city and strategy labels because the analytical files agreed with it, and it preserved the prespecified eight-building city-strategy cells. All original screening labels and corrections were retained in a separate audit file. Monthly energy use was reconciled to verified annual totals, and the raw monthly values, reconciliation factors, and residual checks were retained. Where specified, sensitivity analyses were restricted to buildings with at least 90% sensor completeness.
Setting the building-level sample size and balanced quotas
A target of 72 buildings was set a priori to fill the nine city-strategy quota cells, with 24 buildings per existing strategy and eight buildings per city-strategy cell. The retained study files did not include a verifiable a priori power calculation output; therefore, no minimum sample size based on 80% power is reported.
The study included 24 buildings per existing conservation strategy and eight buildings per city-strategy cell. These equal group sizes arose from stratified purposive quota sampling rather than randomization. The building was treated as the independent sampling unit for the primary analysis.
Calculation of psychrometric variables and statistical analyses
The statistical analyses were performed in Python 3.12.13 using pandas 3.0.5, NumPy 2.5.1, SciPy 1.18.0, and statsmodels 0.14.6. Continuous variables were summarized as mean ± SD or median (IQR), as appropriate, and categorical variables as n (%). Between-group differences were described using maximum absolute standardized mean differences (SMDs); baseline significance tests were not used to claim group equivalence. Large SMDs for strategy-defining variables were interpreted as expected design differences rather than evidence of exchangeability.
The primary ANCOVA was fitted with month-12 wall moisture as the outcome and conservation strategy as the principal exposure. Baseline wall moisture, city, age, wall thickness, rain exposure, drainage condition, and weekly occupied hours were included as covariates. Material compatibility was excluded from the primary covariate set because it helped define the strategy and could be downstream of strategy, and it was added only in a prespecified sensitivity model. Conservation-only served as the reference group. The global strategy F test, adjusted means, three pairwise contrasts, 95% confidence intervals, and Holm-adjusted P values were reported.
Repeated monthly humidity-ratio measurements were analyzed using generalized estimating equations with an exchangeable working correlation and building-clustered robust standard errors. The model included strategy, month, city, outdoor temperature, outdoor relative humidity, rainfall, weekly occupied hours, and environmental-control intensity. Complete monthly observations were used, and an omnibus two-degree-of-freedom strategy test was reported.
Repeated material measurements that had reconstructable measurement definitions were analyzed with observations nested within buildings and fixed effects for strategy, time point, sampling height, city, and the strategy × time interaction. Building-level mean changes with 95% confidence intervals were reported for direct interpretation.
Questionnaire outcomes were analyzed at the respondent level using Gaussian linear mixed-effects models with a random intercept for building. Separate models were fitted for thermal comfort, perceived air quality, functional fit, heritage authenticity, and overall satisfaction. Each model included conservation strategy, city, respondent role, weekly occupied hours, annual mean indoor relative humidity, and annual mean occupied-period carbon dioxide as fixed effects.
Respondent age was not included because no age or age-category field was retained. Available observations were used for each outcome, and the omnibus two-degree-of-freedom strategy test was reported. As a sensitivity analysis, each outcome was averaged within each building and analyzed using a linear model that included strategy, city, weekly occupied hours, annual mean indoor relative humidity, and annual mean occupied-period carbon dioxide. The building-mean analysis produced the same family-level classification for all five outcomes.
Secondary outcomes were interpreted in terms of material condition, indoor environment, energy, and questionnaire/heritage families. Benjamini–Hochberg false-discovery-rate control was applied within each family. The five questionnaire outcomes formed a single family, and their five omnibus strategy P-values were adjusted together. A threshold of q < 0.05 was used for conclusions within a family.
The primary model was repeated with material compatibility added as a sensitivity covariate. Strategy-by-city tests were treated as exploratory. The executable Python pipeline reproduced the primary ANCOVA (F(2,61) = 40.96, P < 0.001) and monthly humidity-ratio GEE (χ2(2) = 1.78, P = 0.410), audited the unreconstructed fields, generated descriptive tables and supporting figures, and preserved input hashes and software versions. The five-questionnaire-outcome mixed-model reanalysis and its building-mean sensitivity analysis were independently reproduced in R 4.6.0 using nlme 3.1-169. Supplementary Table S1 identifies the exact models, audits, and exclusions.
결과
Building inclusion, data completeness, and baseline characteristics
Ninety candidate buildings were screened. Seventy-two were included, and 18 were excluded: six for incomplete intervention records, five for insufficient monitoring access, four for major reconstruction during screening, and three for a non-masonry external wall. The included set contained 24 buildings per city and 24 per strategy, with eight buildings in every city-strategy cell. All 72 completed the month-12 assessment (Figure 1).
A cross-file audit identified inconsistent city labels for 48 of the 72 included buildings in the screening log. The building-level analysis registry was used as the authoritative city source because the monthly, material, and questionnaire files agreed with it, and it retained eight buildings per city-strategy cell; the original screening labels and all corrections were preserved in the audit file, and no city mismatches remained after reconciliation. The environmental dataset contained 864 building-month records. Valid values were available for 844 indoor-temperature, 844 indoor-RH, 847 wall-moisture, 843 CO₂, and 851 raw monthly-energy records. Paired temperature and RH were available for 824 records used to derive the humidity ratio. Every building contributed at least 10 valid months for each principal environmental variable. All 72 buildings required downward proportional reconciliation because each raw monthly sum exceeded its verified annual value. The mean reconciliation factor was 0.832 (range, 0.759–0.905); the raw-minus-verified difference averaged 23.478 kWh/m2/year (range, 10.312–38.061), and the maximum absolute reconciled annual residual was 2.84 × 10⁻14 kWh/m2/year.
The repeated-material dataset contained 432 planned building-time-height observations; 11 observations were unavailable, leaving 421 valid records. All 432 questionnaires were returned, and 396 were complete for all five outcomes. Missing item counts were 10 for comfort, 5 for air quality, 9 for functional fit, 8 for authenticity, and 4 for satisfaction. The primary building-level outcome and all primary model covariates were complete, so the primary ANCOVA included all 72 buildings.
Table 3 presents group summaries with maximum absolute pairwise SMDs. Several non-strategy baseline variables showed nontrivial imbalance, including surface deterioration (maximum |SMD|=0.494), surface hardness (0.436), sensor completeness (0.377), age (0.361), crack width (0.347), and occupied hours (0.335); therefore, the groups should not be described as uniformly similar. Larger differences in material compatibility (1.833), environmental-control intensity (4.310), and retained historic fabric (2.773) were expected because these variables helped define the existing strategy groups.
Primary wall-moisture outcome
Mean wall moisture decreased by 0.23 ± 0.95 percentage points in the conservation-only group, 2.09 ± 0.78 percentage points in the material-compatible passive-retrofit group, and 2.37 ± 0.86 percentage points in the adaptive-reuse group. The unadjusted overall group difference was significant (F = 43.44, P < 0.001).
In the primary ANCOVA, strategy was associated with month-12 wall moisture after adjustment for baseline moisture, city, building age, wall thickness, rain exposure, drainage condition, and weekly occupied hours (F(2,61) = 40.96, P < 0.001; R2 = 0.857). Adjusted month-12 means were 9.55% for conservation-only, 7.67% for passive retrofit, and 7.35% for adaptive reuse. Relative to conservation-only, the adjusted difference was −1.88 percentage points for passive retrofit (95% CI, −2.40 to −1.36; Holm-adjusted P < 0.001) and −2.20 for adaptive reuse (95% CI, −2.73 to −1.67; Holm-adjusted P < 0.001). Adaptive reuse and passive retrofit did not differ (−0.32; 95% CI, −0.84 to 0.20; Holm-adjusted P = 0.222).
Material compatibility was excluded from the primary model because it was strategy-defining. When it was added in a sensitivity model, the estimates remained similar: passive retrofit versus conservation-only, −1.78 percentage points (95% CI, −2.43 to −1.12; Holm-adjusted P < 0.001); adaptive reuse versus conservation-only, −2.14 (95% CI, −2.72 to −1.55; Holm-adjusted P < 0.001); and adaptive reuse versus passive retrofit, −0.36 (95% CI, −0.91 to 0.18; Holm-adjusted P = 0.191).
Archived monthly wall-moisture summaries showed progressive drying in the passive-retrofit and adaptive-reuse groups and little change in conservation-only buildings (Figure 2). Because the monthly acquisition and calibration method could not be reconstructed, these trajectories are not presented as inferential evidence. The primary conclusion is based on the baseline/month-12 building-level ANCOVA.
Secondary material outcomes
Visible surface deterioration decreased by 0.58 ± 1.88, 2.22 ± 1.71, and 2.15 ± 1.74 percentage points in the conservation-only, passive-retrofit, and adaptive-reuse groups, respectively. The adjusted strategy result remained significant after Benjamini–Hochberg correction within the material-outcome family (q < 0.005). Because the groups were observational, this result is reported as an association.
The archived soluble_salt_pct change values were −0.11 ± 0.40, −0.10 ± 0.34, and −0.08 ± 0.28 percentage points in conservation-only, passive retrofit, and adaptive reuse, respectively. Because the extraction parameters, raw conductivity values, and conductivity-to-percentage conversion were unavailable, these legacy values were not independently reconstructed, tested, or interpreted as quantitative salt concentrations.
Ultrasonic pulse velocity changed by 2.7 ± 74.2 m/s in conservation-only, −0.2 ± 56.9 m/s in passive retrofit, and 48.3 ± 51.1 m/s in adaptive reuse. The model-adjusted result was not significant (P = 0.099; material-family q = 0.165), despite the unadjusted P = 0.012. Surface-hardness changes were 0.01 ± 1.15, 0.00 ± 0.99, and 0.37 ± 1.09 index units, respectively. The model-adjusted result was not significant (P = 0.192; material-family q = 0.240).
Maximum crack width changed by 0.02 ± 0.09 mm in conservation-only and −0.05 ± 0.10 mm and −0.05 ± 0.08 mm in passive retrofit and adaptive reuse, respectively. The adjusted group association was P = 0.006 and remained after material-family correction (q = 0.015); the two intervention groups did not differ. The observed building-level mean changes in visible surface deterioration, ultrasonic pulse velocity, surface hardness, and maximum crack width are shown in Figure 3. The unreconstructable archived salt-percentage panel was removed from the confirmatory presentation.
Environmental response and energy use
Figure 4 summarizes observed monthly indoor temperature, humidity ratio, and the percentage of valid monitoring intervals with RH > 75% across the three strategies. The archived monthly wall-moisture panel was removed from the inferential presentation because its monthly acquisition and calibration method was not retained. Percentages of valid intervals with RH > 75% were 29.95 ± 8.66%, 23.37 ± 9.73%, and 17.89 ± 7.83% in conservation-only, passive retrofit, and adaptive reuse. The unadjusted comparison was P < 0.001, whereas the adjusted strategy P was 0.202, and the indoor-environment-family q was 0.606.
The archived thermal_comfort_hours_pct values were 37.44 ± 8.66%, 47.72 ± 8.95%, and 58.26 ± 9.74% in conservation-only, passive retrofit, and adaptive reuse. Because the standard, category, numerical limits, interval-level inputs, occupied-time denominator, and mode-switch records were unavailable, the percentages were not independently reconstructed or used for inferential conclusions. This archived building-performance field is distinct from the respondent-rated questionnaire thermal-comfort score reported below.
Annual building-level mean indoor temperature was 19.53 ± 0.36 °C in conservation-only, 19.80 ± 0.31 °C in passive retrofit, and 20.11 ± 0.42 °C in adaptive reuse. Mean humidity ratios were 10.31 ± 0.40, 10.22 ± 0.31, and 10.03 ± 0.43 g/kg dry air, respectively. In the adjusted humidity-ratio GEE (824 building-month observations; 72 buildings), the omnibus strategy association was not significant (χ2(2) = 1.78, P = 0.410).
Annual mean occupied-period carbon dioxide concentration was 904.3 ± 108.2 ppm in conservation-only, 870.0 ± 115.4 ppm in passive retrofit, and 895.0 ± 104.7 ppm in adaptive reuse. The unadjusted comparison was P = 0.536. The incoming adjusted P = 0.697 and monthly interaction P = 0.924 were retained as legacy model outputs.
Annual energy-use intensity was 108.5 ± 16.5, 114.2 ± 22.1, and 124.5 ± 14.1 kWh/m2/year, respectively (unadjusted P = 0.010). The incoming adjusted P = 0.991 was not reproduced when the stated city, floor-area, occupied-hours, and control-intensity formula was applied to the deposited data (reproduced P = 0.392); Monthly trajectories use values reconciled to each building’s verified annual utility total.
Use-normalized energy was 5.55 ± 1.61, 6.02 ± 1.55, and 5.80 ± 1.26 kWh/m2 per 100 occupied hours, respectively (unadjusted P = 0.558). The incoming adjusted P = 0.676 was not exactly reproduced by the transparent building-level formula used in the audit (P = 0.556).
Figure 5 presents supported monthly outcomes: indoor relative humidity, occupied-period CO₂, and reconciled energy-use intensity. The unreconstructable, archived, thermal-comfort-hours panel was removed; all retained plotted points are group means, and all bands are 95% confidence intervals.
Functional performance, occupant evaluation, and heritage authenticity
All 432 questionnaires were returned, and 396 respondents had complete values for all five outcomes. Outcome-specific model samples were 422 for thermal comfort, 427 for perceived air quality, 423 for functional fit, 424 for heritage authenticity, and 428 for overall satisfaction. Respondent-derived building means in conservation-only, passive retrofit, and adaptive reuse were 4.48 ± 0.36, 4.89 ± 0.42, and 5.31 ± 0.41 for thermal comfort; 3.82 ± 0.43, 3.97 ± 0.52, and 3.80 ± 0.40 for perceived air quality; 54.1 ± 8.5, 61.2 ± 8.5, and 69.3 ± 9.7 for functional fit; 84.6 ± 5.9, 81.3 ± 4.4, and 74.9 ± 5.6 for heritage authenticity; and 3.88 ± 0.60, 4.33 ± 0.83, and 4.67 ± 0.65 for overall satisfaction. In the five-outcome reanalysis, strategy met the questionnaire/heritage-family criterion for thermal comfort (F(2,64) = 7.18, P = 0.0015, q = 0.0038), functional fit (F(2,64) = 5.44, P = 0.0066, q = 0.0110), and heritage authenticity (F(2,64) = 7.38, P = 0.0013, q = 0.0038). It did not meet the criteria for perceived air quality (F(2,64) = 0.64, P = 0.533, q = 0.592) or overall satisfaction (F(2,64) = 0.53, P = 0.592, q = 0.592). The building-mean sensitivity analysis produced the same classification for all five outcomes.
Relative to conservation-only, adjusted differences were 0.34 points (95% CI, 0.07 to 0.60) for passive-retrofit thermal comfort and 0.75 (95% CI, 0.35 to 1.14) for adaptive-reuse thermal comfort; the adaptive-reuse versus passive-retrofit difference was 0.41 (95% CI, 0.12 to 0.70). Corresponding functional-fit differences were 7.12 (95% CI, 0.82 to 13.43), 15.29 (95% CI, 6.03 to 24.56), and 8.17 (95% CI, 1.36 to 14.99). These intervals are nominal model-based intervals; family-level inference used the five Benjamini–Hochberg-adjusted omnibus tests.
For heritage authenticity, the adjusted passive-retrofit versus conservation-only difference was −3.68 points (95% CI, −7.48 to 0.13), the adaptive-reuse versus conservation-only difference was −10.50 (95% CI, −16.09 to −4.91), and the adaptive-reuse versus passive-retrofit difference was −6.82 (95% CI, −10.93 to −2.71). These observational associations do not establish that the strategy caused the differences in scores. The unadjusted group values and adjusted estimates for the primary, environmental, energy, functional, and heritage outcomes are summarized in Table 4.
Sensitivity analyses
The primary wall-moisture association was robust to the addition of material compatibility as a sensitivity covariate (global strategy P < 0.001); both intervention-versus-conservation-only contrasts remained significant (P < 0.001) after Holm correction, and adaptive reuse versus passive retrofit remained non-significant (P = 0.191).
No psychrometric wall-moisture GEE was retained because the archived monthly wall-moisture acquisition and calibration method could not be reconstructed. The independently reproducible monthly humidity-ratio GEE remained the longitudinal psychrometric analysis (χ2(2) = 1.78, P = 0.410). Exploratory city-specific analyses were not interpreted as separate intervention effects because the design used fixed quotas of eight buildings per city-strategy cell and was not randomized.
After prespecified multiplicity control, the supported secondary associations were visible surface deterioration, maximum crack width, respondent-rated thermal comfort, functional fit, and heritage authenticity. Perceived air quality, overall satisfaction, RH > 75% intervals, CO₂, annual energy use, and use-normalized energy did not meet their respective within-family criteria. Archived salt percentages, thermal-comfort-hour percentages, and monthly wall-moisture summaries were not used for confirmatory conclusions because their derivation methods were not reconstructable.
DATA AVAILABILITY:
The de-identified datasets used for the analyses in this study are publicly available from Zenodo at https://doi.org/10.5281/zenodo.21822124. The repository contains the building-level, environmental, material-assessment, questionnaire, and screening datasets used in the reported analyses.
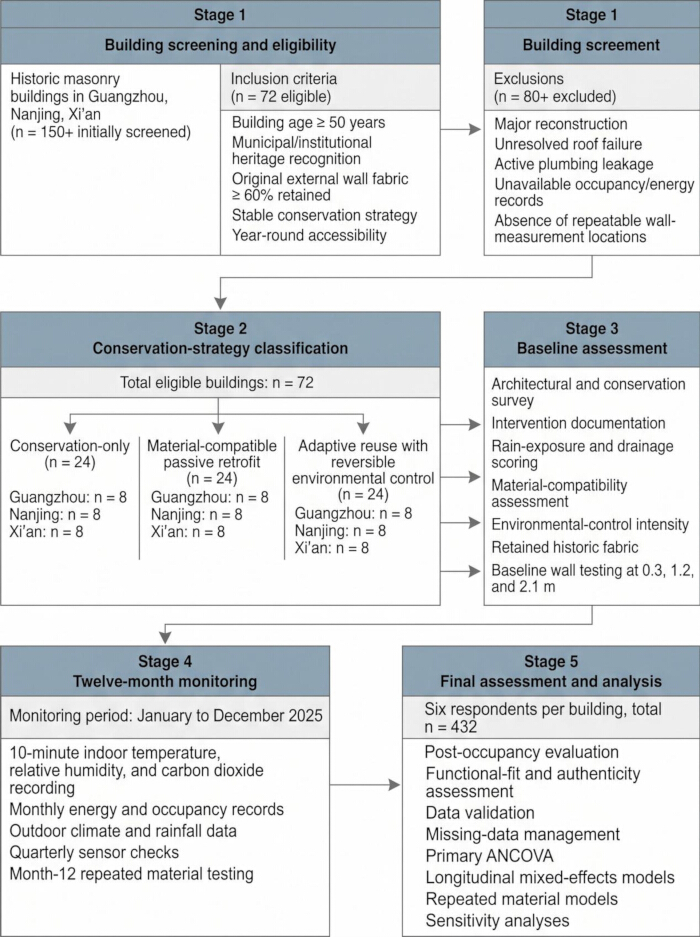
Figure 1: Study screening and workflow. Ninety candidate buildings were screened; 72 were included, and 18 were excluded (incomplete intervention records, n = 6; insufficient monitoring access, n = 5; major reconstruction during screening, n = 4; non-masonry external wall, n = 3). The included sample comprised 24 buildings per existing strategy and eight per city-strategy cell. The design used stratified purposive quota sampling and no random allocation. Abbreviations: CO = conservation-only; MPR = material-compatible passive retrofit; AR-REC = adaptive reuse with reversible environmental control. Please click here to view a larger version of this figure.
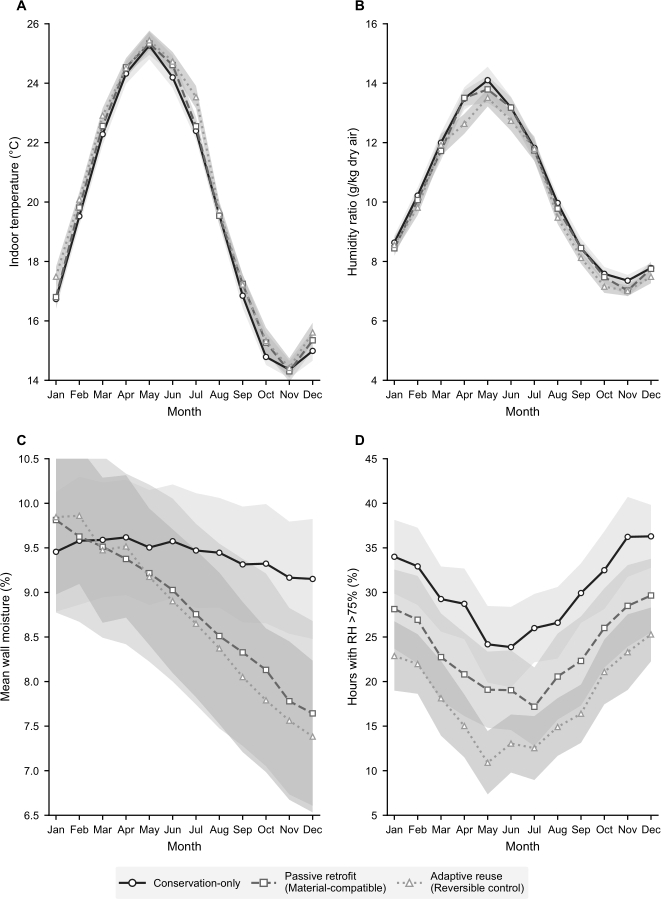
Figure 2: Monthly environmental responses by conservation strategy. (A) Indoor temperature. (B) Indoor humidity ratio derived from paired temperature and relative humidity measurements. (C) Wall moisture. (D) Percentage of monitored hours with relative humidity >75%. Values are observed monthly building-level group means. Lines connect monthly means and shaded bands indicate 95% confidence intervals. The panels present descriptive summaries of the monitored data. Please click here to view a larger version of this figure.
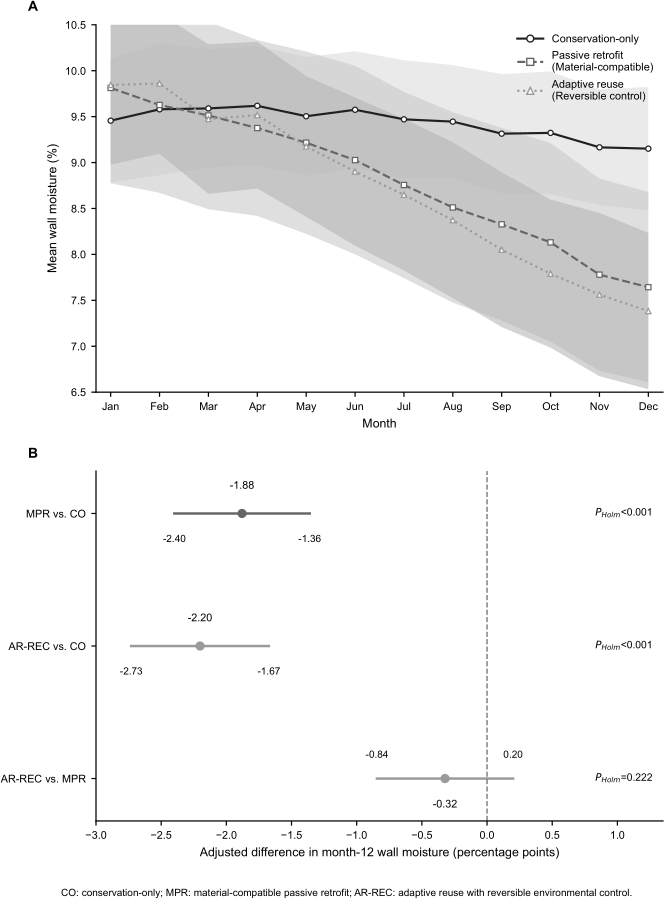
Figure 3: Primary wall-moisture outcome by conservation strategy. (A) Observed monthly building-level wall-moisture means for the three conservation strategies. Lines connect monthly means, and shaded bands indicate 95% confidence intervals. (B) Adjusted month-12 wall-moisture differences from the prespecified primary ANCOVA, shown as adjusted mean differences with 95% confidence intervals. Pairwise comparisons are relative to the conservation-only reference group, with Holm-adjusted P values reported in the manuscript. The inferential conclusions are based on the prespecified building-level ANCOVA rather than visual separation of the trajectories. Please click here to view a larger version of this figure.
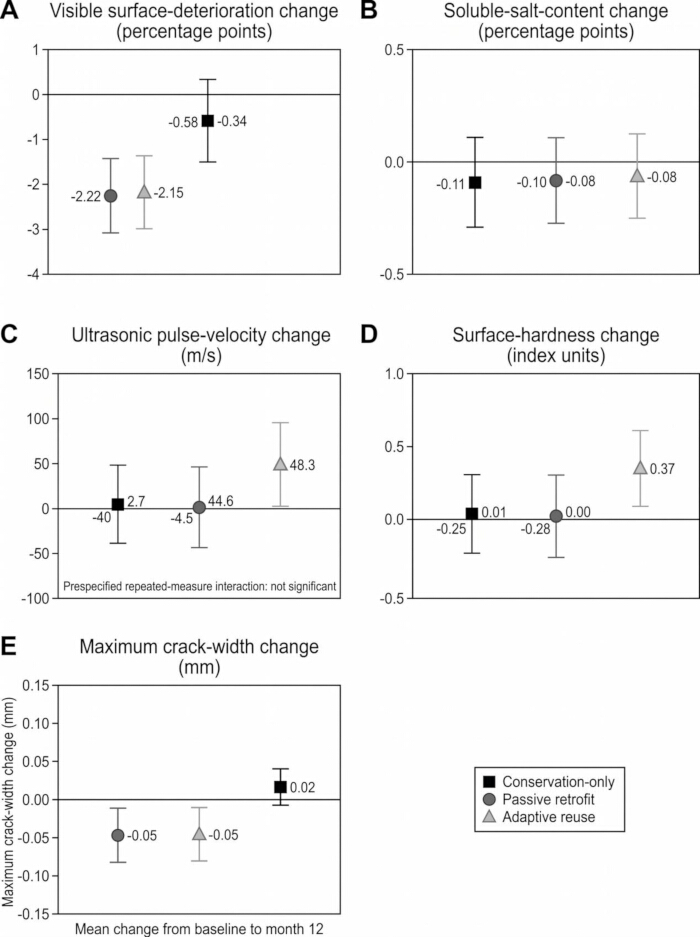
Figure 4: Material-condition outcomes by conservation strategy. (A) Surface deterioration. (B) Soluble-salt content. (C) Ultrasonic pulse velocity. (D) Surface hardness. (E) Maximum crack width. Values are building-level group means with 95% confidence intervals at baseline and month 12. Statistical comparisons are reported in the Results. Please click here to view a larger version of this figure.
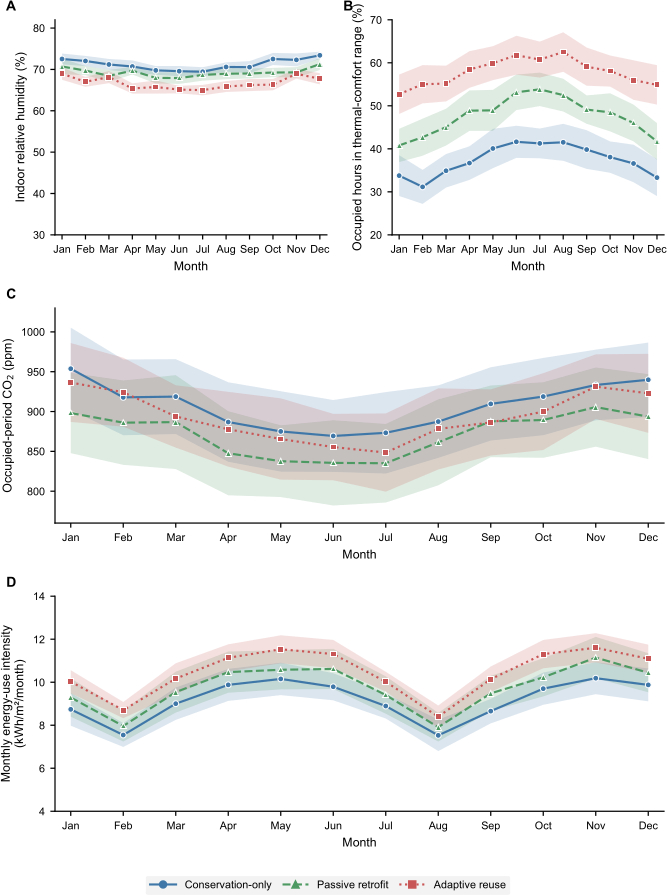
Figure 5: Monthly indoor-environmental and energy responses. Observed building-month group means, and 95% confidence intervals are shown for (A) indoor relative humidity, (B) thermal-comfort hours, (C) occupied-period CO₂, and (D) energy-use intensity... Please click here to view a larger version of this figure.
| Strategy | n | Main intervention characteristics | Environmental-control approach | Heritage requirement | Sampling and assignment basis |
| Conservation-only | 24 | Routine maintenance and localized stabilization without systematic thermal or environmental retrofit | Existing natural ventilation and basic services only | At least 60% of the original external wall fabric was retained | Existing-strategy stratum; non-randomized, stratified purposive sampling with a prespecified quota of 8 buildings per city |
| Material-compatible passive retrofit | 24 | Lime-based repair, vapour-permeable treatment, drainage improvement, repair of operable openings, reversible shading, and passive ventilation enhancement | Passive measures predominated; no extensive new active environmental-control system was introduced | New materials were required to be compatible, low-intervention, and reversible | Existing-strategy stratum; non-randomized, stratified purposive sampling with a prespecified quota of 8 buildings per city |
| Adaptive reuse with reversible environmental control | 24 | Contemporary reuse with limited service integration, compatible fabric repair, and minimally invasive environmental upgrading | Demand-controlled ventilation, localized dehumidification, and limited heating or cooling | Contemporary additions were required to be removable and distinguishable from the historic fabric | Existing-strategy stratum; non-randomized, stratified purposive sampling with a prespecified quota of 8 buildings per city |
Table 1: Definitions of the three existing conservation strategies. Notes: Each strategy included eight buildings per city. Buildings were selected by stratified purposive quota sampling and were not randomized.
| Variable | Method and timing | Unit | Validity criterion |
| Age, floor area, wall thickness, and occupied hours | Archival records, drawings, operating records, and baseline site survey | Years; m2; mm; h/week | Verified against documentary or field records |
| Rain exposure and drainage condition | Independent baseline ratings using the structured assessment form; disagreements were reviewed jointly | 0–10 | The supplied manuscript states that two conservation specialists rated each building; author must confirm training, masking, and inter-rater reliability |
| Material compatibility and environmental-control intensity | Intervention records, equipment inventory, and structured ratings | 0–10 | Used to describe strategy implementation; because these variables help define strategy, material compatibility was excluded from the primary strategy model and retained only in sensitivity analysis |
| Temperature, relative humidity, carbon dioxide, and derived humidity ratio | Electronic monitoring at 10-minute intervals throughout 2025; humidity ratio derived from indoor temperature and relative humidity using ASHRAE psychrometric equations at 101.325 kPa | °C; %; ppm; g/kg dry air | Monthly summaries required at least 75% valid observations; humidity ratio was missing if either temperature or relative humidity was missing |
| Temperature, relative humidity, and rainfall | Outdoor loggers and the nearest official meteorological station | °C; %; mm/month | Incomplete station data were checked against an alternative official source |
| Wall moisture and soluble-salt content | Three fixed wall heights (0.3, 1.2, and 2.1 m) at baseline and month 12; three readings at each accessible height | % | The same marked locations and instrument settings were used; inaccessible readings were retained as missing |
| Surface deterioration, ultrasonic pulse velocity, surface hardness, and crack width | Repeated measurement at fixed marked locations at baseline and month 12 | %; m/s; index; mm | The same locations, instrument settings, operators, and procedures were intended at both visits; author must confirm calibration and inter-rater reliability procedures |
| Energy-use intensity, occupancy-standardized energy use, and operational carbon | Verified annual utility totals, submeters, occupancy records, and regional emission factors; available monthly observations were proportionally reconciled within each building to the verified annual total while preserving the monthly profile | kWh/m²/year; kWh/m²/100 h; kg CO₂e/m²/year | Energy, floor-area, occupancy, and reporting boundaries had to correspond; reconciliation factors were audited by building |
| Functional fit and heritage authenticity | Six respondent ratings per building, aggregated as a building-level mean | 0–100 | Scale anchors, instrument development, and validation evidence require author confirmation |
| Comfort, perceived air quality, and satisfaction | Six eligible respondents per building completed seven-point items | 1–7 | Item wording, aggregation rules, and validation evidence require author confirmation |
Table 2: Measurement framework and quality-control criteria. The table distinguishes relative humidity from derived humidity ratio, specifies the monthly-to-annual energy reconciliation, and separates 1–7 postoccupancy measures from 0–100 functional-fit and authenticity measures.
| Characteristic | Conservation-only (n=24) | Material-compatible passive retrofit (n=24) | Adaptive reuse with reversible control (n=24) | Maximum |SMD| |
| Guangzhou, n (%) | 8 (33.3) | 8 (33.3) | 8 (33.3) | — |
| Nanjing, n (%) | 8 (33.3) | 8 (33.3) | 8 (33.3) | — |
| Xi’an, n (%) | 8 (33.3) | 8 (33.3) | 8 (33.3) | — |
| Building age, years | 110.0 ± 27.9 | 102.5 ± 25.9 | 100.6 ± 24.1 | 0.361 |
| Floor area, m² | 1118.1 ± 431.8 | 1132.6 ± 372.7 | 1182.9 ± 425.2 | 0.151 |
| External-wall thickness, mm | 440.2 ± 66.6 | 446.2 ± 68.5 | 446.1 ± 58.7 | 0.094 |
| Weekly occupied hours | 39.8 ± 10.5 | 39.2 ± 13.2 | 43.2 ± 10.5 | 0.335 |
| Rain-exposure score, 0–10 | 5.35 ± 2.18 | 5.53 ± 2.17 | 5.87 ± 2.45 | 0.224 |
| Drainage-condition score, 0–10 | 5.51 ± 1.86 | 5.50 ± 1.88 | 5.28 ± 1.74 | 0.128 |
| Baseline wall moisture, % | 9.56 ± 1.56 | 9.86 ± 2.33 | 9.84 ± 1.89 | 0.162 |
| Baseline soluble-salt content, % | 2.62 ± 0.50 | 2.57 ± 0.61 | 2.53 ± 0.51 | 0.178 |
| Baseline surface deterioration, % | 23.21 ± 5.87 | 20.69 ± 5.70 | 23.21 ± 4.42 | 0.494 |
| Baseline ultrasonic pulse velocity, m/s | 2309.2 ± 299.0 | 2312.2 ± 260.4 | 2330.2 ± 355.0 | 0.064 |
| Baseline surface-hardness index | 32.33 ± 4.86 | 30.53 ± 4.15 | 32.48 ± 4.78 | 0.436 |
| Baseline maximum crack width, mm | 0.77 ± 0.35 | 0.67 ± 0.32 | 0.66 ± 0.28 | 0.347 |
| Material-compatibility score, 0–10 | 5.02 ± 1.43 | 7.17 ± 0.84 | 6.45 ± 1.33 | 1.833 |
| Environmental-control intensity, 0–10 | 2.27 ± 0.86 | 4.14 ± 1.22 | 6.29 ± 1.00 | 4.31 |
| Retained historic fabric, % | 95.51 ± 4.11 | 90.56 ± 4.38 | 83.77 ± 4.38 | 2.773 |
| Sensor-data completeness, % | 89.92 ± 6.19 | 93.98 ± 3.76 | 92.29 ± 5.50 | 0.377 |
Table 3: Baseline characteristics and data completeness. Values are mean ± SD unless stated otherwise. Maximum absolute pairwise standardized mean differences are reported. Strategy-defining material compatibility, environmental-control intensity, and retained fabric were expected to differ and should not be interpreted as evidence of baseline balance.
| Outcome | Conservation-only (n = 24) | Material-compatible passive retrofit (n = 24) | Adaptive reuse with reversible environmental control (n = 24) | Unadjusted P | Adjusted strategy P | Multiplicity-adjusted result |
| PRIMARY OUTCOME | ||||||
| Archived wall-moisture change, percentage points | −0.23 ± 0.95 | −2.09 ± 0.78 | −2.37 ± 0.86 | <0.001 | <0.001 | Holm pairwise: MPR vs CO <0.001; AR vs CO <0.001; AR vs MPR = 0.222 |
| MATERIAL CONDITION | ||||||
| Visible surface-deterioration change, percentage points | −0.58 ± 1.88 | −2.22 ± 1.71 | −2.15 ± 1.74 | 0.002 | <0.001 | BH q <0.005† |
| Ultrasonic pulse-velocity change, m/s | 2.7 ± 74.2 | −0.2 ± 56.9 | 48.3 ± 51.1 | 0.012 | 0.099 | BH q = 0.165† |
| Surface-hardness change, index units | 0.01 ± 1.15 | 0.00 ± 0.99 | 0.37 ± 1.09 | 0.406 | 0.192 | BH q = 0.240† |
| Maximum crack-width change, mm | 0.02 ± 0.09 | −0.05 ± 0.10 | −0.05 ± 0.08 | 0.009 | 0.006 | BH q = 0.015† |
| ENVIRONMENT AND ENERGY | ||||||
| Annual mean indoor temperature, °C | 19.53 ± 0.36 | 19.80 ± 0.31 | 20.11 ± 0.42 | — | — | — |
| Annual mean humidity ratio, g/kg dry air | 10.31 ± 0.40 | 10.22 ± 0.31 | 10.03 ± 0.43 | — | 0.410 | Not multiplicity-adjusted |
| Valid intervals with RH >75%, % | 29.95 ± 8.66 | 23.37 ± 9.73 | 17.89 ± 7.83 | <0.001 | 0.202 | BH q = 0.606† |
| Annual mean occupied-period CO₂, ppm | 904.3 ± 108.2 | 870.0 ± 115.4 | 895.0 ± 104.7 | 0.536 | 0.697‡ | BH q = 0.913† |
| Annual energy-use intensity, kWh/m²/year | 108.5 ± 16.5 | 114.2 ± 22.1 | 124.5 ± 14.1 | 0.010 | 0.991‡; audit 0.392 | BH q = 0.991† |
| Use-normalized energy, kWh/m² per 100 occupied hours | 5.55 ± 1.61 | 6.02 ± 1.55 | 5.80 ± 1.26 | 0.558 | 0.676‡; audit 0.556 | BH q = 0.991† |
| QUESTIONNAIRE / HERITAGE | ||||||
| Respondent-rated thermal comfort, 1–7 | 4.48 ± 0.36 | 4.89 ± 0.42 | 5.31 ± 0.41 | <0.001 | 0.0015 | BH q = 0.0038 |
| Perceived air quality, 1–7 | 3.82 ± 0.43 | 3.97 ± 0.52 | 3.80 ± 0.40 | 0.383 | 0.533 | BH q = 0.592 |
| Functional fit, 0–100 | 54.1 ± 8.5 | 61.2 ± 8.5 | 69.3 ± 9.7 | <0.001 | 0.0066 | BH q = 0.0110 |
| Heritage authenticity, 0–100 | 84.6 ± 5.9 | 81.3 ± 4.4 | 74.9 ± 5.6 | <0.001 | 0.0013 | BH q = 0.0038 |
| Overall satisfaction, 1–7 | 3.88 ± 0.60 | 4.33 ± 0.83 | 4.67 ± 0.65 | 0.001 | 0.592 | BH q = 0.592 |
Table 4: Primary and secondary outcomes by strategy. Values are mean ± SD; questionnaire values are calculated from the 24 respondent-derived building means per strategy. Five respondent outcomes are reported, and their omnibus P values are adjusted jointly using the Benjamini–Hochberg procedure.
Supplementary Figure S1: Wall-assessment locations and environmental-monitoring framework. Schematic cross-section showing external rain, splashback, capillary rise, evaporation, fixed material-assessment heights (0.3, 1.2, and 2.1 m), the indoor logger height (1.1–1.5 m), and the measured material-condition variables. The schematic is conceptual and not to scale. Please click here to download this file.
Supplementary Table S1: Evidence-aligned statistical analysis plan. The table identifies the exact primary ANCOVA, humidity-ratio GEE, five-questionnaire-outcome mixed models, multiplicity families, and sensitivity models. Please click here to download this file.
토론
This multicenter observational study found that existing passive-retrofit and adaptive-reuse strategies were associated with greater wall-drying from baseline to month 12 than conservation-only management, after adjustment for measured baseline and exposure variables. Adaptive reuse was not superior to passive retrofit for the primary outcome. Supported secondary associations included visible surface deterioration, crack width, respondent-rated thermal comfort, functional fit, and heritage authenticity. Perceived air quality, satisfaction, supported environmental measures, and energy outcomes did not meet their within-family criteria. Archived salt percentage, thermal-comfort-hour percentage, and monthly wall-moisture fields were not interpreted inferentially because the retained files did not permit their derivation methods to be reconstructed.
The primary result is consistent with a material-compatible, moisture-management pathway, but it does not identify which component caused the drying. Compatible repair, drainage, ventilation, dehumidification, maintenance, and unmeasured management practices may all contribute. The similar adjusted estimates for passive retrofit and adaptive reuse indicate no evidence of an additional moisture benefit from the more intensive strategy over one year; they do not prove equivalence15,16,17.
The supported secondary material findings show that historic masonry did not respond uniformly across indicators: visible deterioration and crack width differed by strategy, whereas ultrasonic pulse velocity and surface hardness did not meet the material-family criterion. The archived soluble-salt percentage could not be quantitatively interpreted because the sample-extraction and conductivity-to-percentage records were unavailable. Published salt-extraction standards cannot retrospectively establish what was performed in this study18; future work should retain dry mass, extractant volume, extraction time, blank and calibration readings, raw conductivity or ion concentrations, and the conversion equation.
The supported psychrometric analysis tempered the descriptive differences across environments. Humidity ratio did not show an independent association with strategy in the adjusted monthly GEE. The archived monthly wall-moisture series was retained only as an analysis-ready summary, not as inferential evidence, because records of monthly sampling, calibration, and aggregation were unavailable. Future wall-moisture studies should retain visit-level fixed-zone readings and material-specific gravimetric calibration in accordance with applicable conservation and hygrothermal measurement standards19,20.
The energy analysis separated total demand from service intensity and reconciled monthly profiles to verified annual utility totals. Higher unadjusted annual energy in adaptive-reuse buildings disappeared after adjustment and did not remain after within-family false-discovery-rate correction; use-normalized energy also did not differ. The study did not have complete intervention inventories, so only operational-energy boundaries can be evaluated, and no comparative embodied-carbon, avoided-carbon, or whole-life sustainability claim is supported21.
Within the complete five-outcome questionnaire/heritage family, respondent-rated thermal comfort and functional fit were positively associated with more intensive strategies, whereas heritage authenticity scores were lower, particularly for adaptive reuse. The air quality and overall satisfaction perceived did not retain independent associations with strategy after adjustment. These exploratory, study-specific scores lack retained item wording, verbal anchors, translation documentation, and validation data; they must not be presented as validated scales. The observational design and potential residual differences in building programs, management, and respondent composition preclude causal inference22,23.
The five-outcome reanalysis changed the interpretation of heritage authenticity: its omnibus association remained significant after correction across all five questionnaire outcomes (P = 0.0013; q = 0.0038). Adjusted scores were lower for adaptive reuse than for both conservation-only and passive retrofit. This finding is exploratory because the authenticity instrument was author-developed, and its item-level content and validation record were unavailable. Replication should use a documented, validated authenticity instrument and retain item-level ratings24.
The findings have practical implications for conservation planning. The absence of a significant moisture difference between passive retrofit and adaptive reuse suggests that interventions should begin with drainage correction, compatible repair, controlled ventilation, and targeted moisture management before installing more extensive environmental systems. Active control may still be necessary where occupancy, collections, or climatic exposure demand tighter conditions, but its contribution should be assessed against energy use, maintenance capacity, reversibility, and heritage impact. Decision frameworks for adaptive reuse increasingly use multiple criteria because technical, cultural, environmental, social, and economic objectives can conflict25. A staged strategy would allow managers to implement low-intervention measures first, monitor their effects, and add active control only where predefined performance thresholds are not achieved.
Limitations include non-random strategy selection, residual confounding, fixed city-strategy quotas, baseline imbalance, and large expected differences in strategy-defining variables. Three archived derived outcomes were not fully reproducible: thermal-comfort hours lacked an interval-level standard/category/mode-switch record; monthly wall moisture lacked visit-level acquisition, calibration, and aggregation records; and soluble-salt percentage lacked extraction, raw-conductivity, and conversion records. The endpoint wall-moisture percentages also lacked retained material-specific gravimetric calibration equations. Questionnaire item wording, verbal anchors, administered language, translation history, scoring key, and validation data were unavailable, and respondent age was not retained. Monthly energy values required proportional reconciliation to verified annual totals, and embodied-carbon inventories were incomplete. These limitations preclude claims of causality, measurement equivalence, durability, and whole-life sustainability.
In conclusion, in this 72-building observational cohort, material-compatible passive retrofit and adaptive reuse with reversible environmental control were each associated with lower archived month-12 wall-moisture values than conservation-only management, while the two intervention strategies did not differ. After within-family correction, supported secondary associations included surface deterioration, maximum crack width, respondent-rated thermal comfort, functional fit, and heritage authenticity; perceived air quality, satisfaction, supported environmental measures, and energy outcomes did not. These are adjusted observational associations. Archived salt percentage, thermal-comfort hours, and monthly wall-moisture fields require original method records to support quantitative inference.
The findings support testing compatible passive measures as a lower-intervention first stage and monitoring material, operational, user, and heritage outcomes separately. They do not establish that either strategy caused the observed differences. Replication with transparent sampling registries, verified measurement reliability, validated questionnaires, longer follow-up, and complete life-cycle inventories is required before stronger recommendations are made.
공개 사항
The author has no conflicts of interest to declare.
Author Contributions:
Sun Yaolong: Conceptualization, Methodology, Investigation, Data curation, Formal analysis, Visualization, Project administration, Supervision, Writing—original draft, and Writing—review & editing. Sun Yaolong is the sole author and takes responsibility for the integrity of the work and the final manuscript. Field technicians, two conservation specialists, and other collaborators provided technical assistance under the author’s supervision; they did not participate in manuscript drafting or final approval and are acknowledged rather than listed as authors.
감사의 글
The author thanks the building owners, heritage management authorities, field technicians, two conservation specialists, and research collaborators in Guangzhou, Nanjing, and Xi’an for providing site access and technical assistance. Funding: This work received no external funding.
재료
| 이름 | 회사 | 카탈로그 번호 | 댓글 |
|---|---|---|---|
| ASHRAE Handbook-Fundamentals, Chapter 1 | ASHRAE | 2025 edition | Psychrometric equations used to derive indoor humidity ratio from temperature and relative humidity at standard atmospheric pressure |
| Benchtop Conductivity Meter | Mettler Toledo | SevenCompact S230 | Soluble-salt quantification by conductivity of aqueous extracts |
| Building Assessment and Intervention-Scoring Form | Author-developed | No catalog number | Structured recording of retained fabric, material compatibility, environmental-control intensity, rain exposure, and drainage condition |
| CO2 / Temperature / Relative Humidity Data Logger | Onset Computer Corporation | MX1102A | Continuous indoor microclimate monitoring at 10-minute intervals |
| Handheld Digital Microscope | Dino-Lite | AF4915ZT | Micro-crack imaging and maximum crack-width verification at fixed locations |
| Material Moisture Microwave Meter | Trotec GmbH | T660 | Non-destructive wall-moisture measurement at fixed heights and locations |
| NumPy | NumPy Developers | 2.5.1 | Numerical operations in the reproducible Python analysis workflow |
| Outdoor Temperature / Relative Humidity Data Logger | Onset Computer Corporation | MX2301A | Outdoor ambient monitoring with a weather shield |
| pandas | PyData Development Team | 3.0.5 | Data cleaning, reconciliation, derivation, and tabulation |
| Post-occupancy Questionnaire | Author-developed | No catalog number | Six eligible respondents per building; comfort, air quality, and satisfaction used 1–7 scales, whereas functional fit and heritage authenticity used 0–100 scales |
| Python | Python Software Foundation | 3.12.13 | Primary revised statistical-analysis and figure-generation environment |
| Rebound Hammer (Type L) | Screening Eagle Technologies | Original Schmidt Type L | Low-impact surface-hardness index testing for historic masonry |
| SciPy | SciPy Developers | 1.18.0 | Statistical distributions and numerical procedures |
| Seaborn | Seaborn Developers | 0.13.2 | Consistent scientific-plot styling |
| statsmodels | statsmodels Developers | 0.14.6 | ANCOVA, robust covariance estimation, multiple-comparison adjustment, and generalized estimating equations |
| Ultrasonic Pulse Velocity Tester | Screening Eagle Technologies | Proceq Pundit Lab+ | Non-destructive ultrasonic pulse-velocity measurement of masonry fabric |
참고문헌
- Bullen PA, Love PED. Adaptive reuse of heritage buildings. Struct Surv. 2011;29(5):411-21.
- Vafaie F, Remøy H, Gruis V. Adaptive reuse of heritage buildings: a systematic literature review of success factors. Habitat Int. 2023;142:102926.
- Yung EHK, Chan EHW. Implementation challenges to the adaptive reuse of heritage buildings: towards the goals of sustainable, low carbon cities. Habitat Int. 2012;36(3):352-61.
- Conejos S, Langston C, Smith J. AdaptSTAR model: a climate-friendly strategy to promote built environment sustainability. Habitat Int. 2013;37:95-103.
- Mazzarella L. Energy retrofit of historic and existing buildings: the legislative and regulatory point of view. Energy Build. 2015;95:23-31.
- Webb AL. Energy retrofits in historic and traditional buildings: a review of problems and methods. Renew Sustain Energy Rev. 2017;77:748-59.
- Magrini A, Franco G. The energy performance improvement of historic buildings and their environmental sustainability assessment. J Cult Herit. 2016;21:834-41.
- Al-Obaidi KM, Wei SL, Ismail MA, Kam KJ. Sustainable building assessment of colonial shophouses after adaptive reuse in Kuala Lumpur. Buildings. 2017;7(4):87.
- Fabbri K, Pretelli M, Bonora A. The study of historical indoor microclimate to contribute towards heritage buildings preservation. Heritage (Basel). 2019;2(3):2287-97.
- Litti G, Khoshdel S, Audenaert A, Braet J. Hygrothermal performance evaluation of traditional brick masonry in historic buildings. Energy Build. 2015;105:393-411.
- Caroselli M, Ruffolo SA, Piqué F. Mortars and plasters: how to manage mortars and plasters conservation. Archaeol Anthropol Sci. 2021;13(11):188.
- Rieser A, et al. Integration of energy-efficient ventilation systems in historic buildings: review and proposal of a systematic intervention approach. Sustainability (Basel). 2021;13(4):2325.
- ASHRAE. 2025 ASHRAE handbook—fundamentals. ASHRAE; Atlanta, GA; 2025. Chapter 1, Psychrometrics.
- ASHRAE. ANSI/ASHRAE Standard 55-2023: Thermal environmental conditions for human occupancy. ASHRAE; Atlanta, GA; 2023.
- Arfa FH, Lubelli B, Zijlstra H, Quist W. Criteria of “effectiveness” and related aspects in adaptive reuse projects of heritage buildings. Sustainability (Basel). 2022;14(3):1251.
- Arfa FH, Zijlstra H, Lubelli B, Quist W. Adaptive reuse of heritage buildings: from a literature review to a model of practice. Hist Environ Policy Pract. 2022;13(2):148-70.
- Lanz F. Adaptive reuse: a critical review. J Archit. 2022;27(2-3):441-62.
- CEN. EN 16455:2014 Conservation of cultural heritage—Extraction and determination of soluble salts in natural stone and related materials used in and from cultural heritage. European Committee for Standardization; Brussels; 2014.
- ISO. ISO 12570:2000 Hygrothermal performance of building materials and products—Determination of moisture content by drying at elevated temperature. International Organization for Standardization; Geneva; 2000. Amendments 1:2013 and 2:2018.
- CEN. EN 16682:2017 Conservation of cultural heritage—Methods of measurement of moisture content, or water content, in materials constituting immovable cultural heritage. European Committee for Standardization; Brussels; 2017.
- Hu M, Świerzawski J. Assessing the environmental benefits of adaptive reuse in historical buildings: a case study of a life cycle assessment approach. Sustain Environ. 2024;10(1):2375439.
- Vardopoulos I. Industrial building adaptive reuse for museum: factors affecting visitors’ perceptions of the sustainable urban development potential. Build Environ. 2022;222:109391.
- Alhojaly RA, Alawad AA, Ghabra NA. A proposed model of assessing the adaptive reuse of heritage buildings in historic Jeddah. Buildings. 2022;12(4):406.
- Boateng GO, et al. Best practices for developing and validating scales for health, social, and behavioral research: a primer. Front Public Health. 2018;6:149.
- Vizzarri C, Sangiorgio V, Fatiguso F, Calderazzi A. A holistic approach for the adaptive reuse project selection: the case of the former Enel power station in Bari. Land Use Policy. 2021;111:105709.