This article presents a reproducible structured collaborative speaking protocol and an instructor-matched clustered quasi-experimental evaluation of its feasibility, implementation, communicative confidence, and related exploratory outcomes in university English as a Foreign Language (EFL) speaking classes.
방법 논문
A Structured Collaborative Speaking Protocol to Support Communicative Confidence: An Instructor-Matched Clustered Quasi-Experimental Evaluation
이 논문에서
요약
초록
Communicative speaking activities do not always provide equitable or psychologically manageable opportunities for all learners in university English as a Foreign Language (EFL) classrooms. This article presents a reproducible structured collaborative speaking protocol and documents its feasibility and preliminary outcomes through an instructor-matched clustered quasi-experimental design. The multicomponent protocol combined rotating interactional roles, repeated speaking attempts, criterion-based peer feedback, one observable revision target, guided reflection, and scheduled behavior-focused video review. It was implemented once weekly for eight weeks in eight intact university EFL classes organized into four instructor-matched pairs. Within each pair, one class received the structured collaborative speaking condition and the other received an active-comparison condition matched for task topics, session duration, preparation time, and number of speaking attempts. Communicative confidence was the primary outcome and was assessed at baseline, post-intervention, and four-week follow-up. Willingness to communicate, speaking anxiety, speaking self-efficacy, perceived peer psychological safety, and independently rated speaking performance were secondary exploratory outcomes. Weekly process measures documented participation, state anxiety, feedback uptake, fidelity, contamination, and video-review completion. A total of 180 students entered the study; 176 completed the post-intervention assessment, and 159 completed follow-up. The protocol met the prespecified feasibility thresholds. Communicative confidence increased in both conditions, with a larger instructor-matched class-level increase in the structured condition at post-intervention, where the matched difference in change was 0.38 on a 1-7 scale (95% confidence interval, 0.24-0.52; four instructor-matched pairs), and at follow-up, where the matched difference in change was 0.55 (95% confidence interval, 0.38-0.72; four instructor-matched pairs). Because condition placement was nonrandom and the number of independent clusters was small, the estimates are best interpreted as preliminary class-level evidence rather than confirmatory evidence of general effectiveness.
서론
Speaking in an additional language cannot be separated from the conditions under which communication occurs. Learners must formulate meaning, retrieve language, monitor intelligibility, interpret others, and decide when to enter an exchange within a short period of time. A classroom activity may therefore provide nominal speaking time without giving every student a realistic opportunity to participate. A holistic account of speaking instruction treats cognitive processing, discourse management, interaction, affect, and metacognitive awareness as connected components of the same instructional problem1. This is particularly relevant in university English as a Foreign Language (EFL) classes, where students may possess sufficient grammatical knowledge for written work but still hesitate when required to respond publicly without a complete script.
Speaking anxiety is one reason that speaking opportunities are not always used. Speaking can expose pauses, pronunciation difficulties, lexical gaps, and unfinished ideas to immediate evaluation. Speaking anxiety has been associated with oral-performance difficulty and with stressors arising both inside and outside the classroom2. A meta-analysis similarly identified a consistent negative association between second-language anxiety and achievement3. Reducing anxiety alone, however, is insufficient. Students also need repeated experiences in which they can enter interaction, remain involved after hesitation, and recognize that communication can continue despite imperfect language.
In this study, communicative confidence refers to a learner's perceived ability to initiate speech, explain an idea, respond without a complete script, clarify meaning, continue after hesitation, and contribute usefully to group interaction in an EFL speaking class. It is related to, but not identical with, willingness to communicate, speaking self-efficacy, speaking anxiety, perceived peer psychological safety, or speaking performance. Willingness to communicate concerns readiness to enter communication, self-efficacy concerns perceived capability for defined speaking actions, anxiety concerns negative affective arousal, psychological safety concerns the perceived interpersonal safety of participation, and performance concerns externally rated speaking behavior. These constructs are expected to be associated, but they are treated as conceptually distinct outcomes or process-related variables in the present study.
Communicative confidence is closely related to willingness to communicate. In Chinese EFL classrooms, confidence, motivation, learner beliefs, and classroom environment operate together in shaping willingness to use English4. Willingness is not a fixed individual preference; it varies with the topic, interlocutor, group size, emotional state, and task demands. Ecological and group-level studies have shown that learners can move between talk and silence as classroom conditions change5,6. Task design therefore carries part of the instructional responsibility. Reluctant students are unlikely to participate more fully unless speaking activities make participation understandable, legitimate, and manageable.
The protocol is informed by social interdependence theory, self-efficacy theory, task-based language teaching, and ecological accounts of classroom willingness to communicate. Social interdependence theory supports structured group responsibility rather than unorganized group placement7. Self-efficacy theory suggests that capability judgments may develop through mastery experiences, observation, feedback, and interpretation of emotional responses8. Task-based language teaching supports preparation, task repetition, and post-task revision as ways to shape learning opportunities9,10. Ecological willingness-to-communicate research further emphasizes that participation changes with the immediate social and task environment. Together, these perspectives support a multicomponent speaking cycle in which structured participation, repeated attempts, criterion-based feedback, focused revision, guided reflection, and scheduled video review make speaking practice more predictable, behaviorally actionable, and socially manageable.
Collaborative speaking activities can offer opportunities for clarification, repair, peer response, and shared problem-solving, but these opportunities are not automatic. In speaking classes, one confident learner may dominate while others contribute only brief agreements. Pair-work research shows that interaction may involve shared control, participant dominance, or weak engagement11. Peer assistance is also shaped by preparation, task design, relationship patterns, and feedback quality12. The present protocol therefore assigns four rotating interactional roles: Initiator, Clarifier, Challenger, and Synthesizer. These roles define minimum communicative responsibilities without prescribing students' answers, and rotation prevents the same interactional functions from remaining associated with the most or least confident group members.
The protocol also incorporates two related speaking attempts separated by a structured feedback-and-revision interval. A first attempt exposes learners to the combined demands of content, language, and interaction, while a related second attempt gives them an immediate opportunity to apply one selected revision target. This sequence is consistent with classroom-based work showing that task repetition, feedback, and learner self-assessment can support oral task performance when learners have a second opportunity to review and improve their output13. During the interval, each learner receives one evidence-based communication strength and one observable revision target, such as asking for clarification, responding directly to a peer, reducing an extended pause, improving intelligibility, or summarizing the group decision. Feedback is limited to one target so that the second attempt does not recreate the cognitive pressure it is intended to reduce. In selected weeks, scheduled behavior-focused video review asks learners to identify one effective contribution, one point of hesitation or unclear communication, and one observable behavior to change.
The individual components of this protocol are not presented as new pedagogical principles. Role assignment, peer feedback, task repetition, guided reflection, psychological safety, and willingness to communicate are already represented in EFL and second-language pedagogy, including work on group dynamics and student roles in language classrooms14. The contribution of this article is procedural and evaluative: it provides a detailed implementation and fidelity framework for integrating these established principles into a reproducible cycle of participation, observation, revision, and reperformance, and it reports an active-comparison evaluation of the complete multicomponent package. The design evaluates the protocol as a package and does not isolate the effect of any single component.
To address the need for reproducible implementation guidance, this study applied an eight-week structured collaborative speaking protocol in eight intact university EFL classes organized into four instructor-matched pairs. Within each pair, one class received the structured collaborative speaking condition and the other received an active-comparison condition matched for task topics, session duration, preparation time, and number of speaking attempts. The primary objective was to present a reproducible protocol for implementing this multicomponent speaking cycle. Secondary objectives were to assess feasibility, estimate instructor-matched class-level changes in communicative confidence as the primary outcome, examine secondary exploratory outcomes including willingness to communicate, speaking anxiety, speaking self-efficacy, perceived peer psychological safety, and speaking performance, and document weekly process measures including speaking time, substantive turns, state anxiety, participation equity, feedback uptake, fidelity, contamination, and video-review completion. The quasi-experimental evaluation was designed to provide preliminary class-level estimates for the complete protocol in a real university EFL setting.
프로토콜
The Medical Human Research Ethics Committee of Shandong University of Technology approved the study on 10 March 2026 (approval number 2026027). Data collection was conducted from March 2026 to May 2026. The approval covered recruitment, written informed consent, questionnaire administration, classroom observation, audio and video recording, guided video review, withdrawal management, and release of de-identified participant-level data for supplementary reproducibility. Participation was voluntary, and declining participation or withdrawing before data anonymization did not affect course access, classroom participation, assessment, or grades. Separate written consent was obtained for questionnaires, classroom observation, audio and video recording, guided video review, and use of de-identified data. Students who declined recording were placed in nonrecorded groups or outside the recording frame. Consent forms, identifier keys, and research data were stored separately in encrypted institutional locations accessible only to authorized researchers. Recruitment, consent collection, questionnaire administration, and withdrawal management were conducted by a researcher who did not teach or grade the participating students.
1. Establish the study design
- Use an instructor-matched clustered quasi-experimental design with eight intact university English as a Foreign Language (EFL) classes and four instructors.
- Pair two classes taught by the same instructor; each instructor teaches one structured collaborative speaking class and one active-comparison class.
- Assign one class within each instructor-matched pair to each condition before baseline assessment. Base placement on the pre-existing timetable and administrative class arrangement, not on student achievement, expected class ability, instructor preference, or baseline questionnaire results.
- Record the placement rationale, timetable, instructor, course section, and administrative decision record before baseline data collection.
- Record instructor comparability before implementation, including academic degree, EFL teaching experience, focal-course teaching experience, usual class size, assigned pair, textbook, assessment requirements, and weekly teaching schedule.
- Store these records before baseline data collection and use them to verify that each instructor-matched pair followed the same syllabus, institutional assessment requirements, and weekly course schedule.
- Conduct baseline assessment within 7 days before Week 1. Deliver one 32 min target speaking session weekly for 8 weeks.
- Conduct post-intervention assessment within 7 days after Week 8 and follow-up assessment 28 days later, allowing a deviation of no more than 3 days. Follow the study sequence shown in Figure 1.
2. Enroll participants and create study records
- Include students who are formally enrolled in a participating class, provide written consent, and complete the baseline communicative-confidence assessment. Exclude data from students who decline participation or withdraw before anonymization.
- Record eligible students, consent status, recording permission, baseline completion, analytic inclusion, withdrawal status, withdrawal stage, withdrawal date, and withdrawal reason when provided.
- Assign each participant an identifier consisting of EFL followed by three digits, such as EFL001. Assign class identifiers C1-C8 and instructor identifiers T1-T4.
- Use these identifiers on questionnaires, recordings, attendance records, observation forms, peer-feedback forms, revision records, reflection forms, video-review records, and follow-up records.
- Maintain a screening-and-flow file containing eligibility, consent, recording permission, baseline completion, weekly attendance, post-intervention completion, follow-up completion, withdrawal status, withdrawal stage, withdrawal date, and withdrawal reason when provided. Record code completion as 1 and noncompletion as 0.
- Prespecify six feasibility domains: recruitment, retention, structured-condition fidelity, comparison-condition contamination, recording availability, and speaking-performance inter-rater reliability. Assess retention at post-intervention and follow-up.
- Classify the protocol as feasible when recruitment is ≥70%, post-intervention retention is ≥80%, follow-up retention is ≥75%, mean structured-condition fidelity is ≥80%, contaminated comparison sessions are ≤20%, usable scheduled recordings are ≥80%, and inter-rater reliability is ≥0.75.
3. Standardize instructional and assessment materials
- Use the same intervention manual in all structured-condition classes and record deviations in the protocol-deviation log.
- Apply the intervention components according to reproducible intervention-reporting principles15. Use the complete instructional materials and fidelity records in Supplementary File 1.
- Prepare eight instructional tasks covering campus life, study decisions, interpersonal problem-solving, service improvement, cultural comparison, and group decision-making.
- Reserve three parallel tasks for baseline, post-intervention, and follow-up speaking assessments. Require each task to include an information gap, opinion difference, prioritization decision, or practical problem.
- Ask two EFL specialists outside the participating classes to rate vocabulary demand, topic familiarity, conceptual complexity, interactional demand, and expected completion difficulty from 1 to 5.
- Revise a task when one dimension differs by more than 1 point from the task-set median or when specialist ratings differ by more than 1 point. Resolve disagreements by discussion, retain the final rating record, and pilot the instructions with 10–15 students outside the study sample.
- Standardize four structured-condition roles. The Initiator introduces a position and invites a response; the Clarifier requests an explanation or clarification at least twice; the Challenger introduces an alternative or raises a concern; and the Synthesizer states the group's final position. Rotate roles weekly without consecutive repetition.
- Standardize peer feedback. Rate message clarity, interactional responsiveness, fluency, intelligibility, and turn-taking from 1 to 5. Require one evidence-based communication strength and one observable revision target.
- Exclude comments on personality, appearance, accent preference, or language errors that do not interfere with communication. Use criterion-based peer feedback to connect peer observation with oral revision and speaking self-efficacy16.
- Administer communicative confidence, willingness to communicate, speaking anxiety, speaking self-efficacy, and perceived peer psychological safety at baseline, post-intervention, and follow-up using the domains, response scales, scoring rules, and data sources shown in Table 1. Use 1–7 response scales except for speaking anxiety, which uses a 1–5 scale. Base the adapted measures on established measurement domains17,18,19,20.
- Verify adapted and author-developed items before baseline assessment. Ask two applied-linguistics specialists and one educational-measurement specialist to rate relevance, clarity, and construct alignment from 1 to 4. Revise an item when at least two reviewers assign a score below 3.
- Conduct cognitive interviews with 10-15 students outside the study sample and retain identical wording across assessments.
- Administer questionnaire items, examiner prompts, speaking rubric, observer coding definitions, assessment timing, response ranges, and data-source rules according to Table 1 and Supplementary File 2.
4. Train instructors, observers, examiners, and raters
- Conduct one 90 min instructor-training session before baseline assessment. Demonstrate one complete structured-condition session using four volunteers.
- Require each instructor to rehearse the full sequence while a researcher completes the six-component fidelity checklist. Repeat rehearsal when fewer than five components are completed correctly.
- Reduce cross-condition contamination with separate condition checklists and explicit prohibited behaviors. In comparison classes, prohibit role cards, criterion-based peer-feedback forms, documented revision targets, feedback-uptake coding, behavior-focused video reflection, structured role prompting, individualized revision targets, structured feedback criteria, and behavior-change reflection. Require instructors to complete a condition checklist after every session.
- Review one recorded session from each class during Weeks 2, 4, 6, and 8. Classify a comparison session as contaminated when two or more intervention-specific components occur.
- Retrain the instructor when two consecutive comparison sessions show contamination or when one session contains behavior-focused video review.
- Train observers to code speaking time, substantive turns, role fulfillment, participation equity, fidelity, and contamination.
- Define substantive turns as utterances that introduce, explain, question, challenge, clarify, evaluate, or integrate task-relevant meaning. Exclude instruction reading, off-task speech, one-word acknowledgments, and repetitions that do not advance interaction. Continue training until categorical agreement is ≥80% and speaking-time intraclass correlation is ≥0.75.
- Train examiners to deliver the same speaking-assessment instructions and three follow-up prompts without correction, translation, additional prompting, or feedback.
- Recruit two masked raters with postgraduate training in applied linguistics, Teaching English to Speakers of Other Languages, or language assessment. Exclude participating instructors from rating. Continue rater training until the absolute-agreement intraclass correlation is ≥0.75 across 12 practice recordings.
5. Conduct baseline assessment
- Record age, gender, academic major, previous English-speaking experience, current proficiency band, class identifier, instructor identifier, and condition. Obtain proficiency from the most recent institutional placement result when available.
- Administer communicative confidence, willingness to communicate, speaking anxiety, speaking self-efficacy, and perceived peer psychological safety in the same order. Allow 20–25 min for completion. A non-teaching researcher collects the questionnaires before students leave.
- Conduct the baseline speaking assessment using a trained examiner. Provide the task prompt and 2 min of silent preparation with a maximum of six written keywords.
- Conduct a 1 min individual response followed by a 2 min examiner-led interaction using the same three follow-up prompts. Prohibit scripts, translation applications, rehearsal, corrective feedback, and additional prompting.
- Record the assessment after a 10 s sound check. Replace the participant identifier with a randomly generated recording code and remove condition, class, instructor, and time-point information before rating.
6. Form groups and assign roles
- Rank structured-condition participants within each class by baseline proficiency band and form groups of four by distributing participants from different proficiency positions across groups. Record group membership before Week 1.
- Maintain the same groups during Weeks 1–4. Change membership only after withdrawal, absence from three consecutive sessions, safeguarding concern, or documented administrative change. For absences, assign the missing role to a present member for that session only. If fewer than three members are present, combine the remaining members with the nearest same-condition group and record the deviation.
- Assign roles randomly during Week 1 and rotate each participant through Initiator, Clarifier, Challenger, and Synthesizer without consecutive repetition. Continue the original rotation at the next attended session after the absence.
7. Deliver the instructional conditions
- Deliver the structured collaborative speaking session using the 32 min sequence shown in Table 2: 2 min briefing, 3 min preparation, 8 min first interaction, 4 min criterion-based peer feedback, 2 min revision-target selection, 8 min second interaction with a parallel task, 3 min reflection, and 2 min form verification.
- Permit a maximum of six written keywords during preparation. Record speaking seconds and substantive turns during both interactions.
- Limit instructor intervention during speaking interactions. Intervene only when communication stops for more than 20 s, a participant is repeatedly excluded, discussion remains off task for more than 30 s, or inappropriate conduct occurs. Do not provide model answers, vocabulary lists, translations, corrective feedback, or additional arguments.
- Complete the structured feedback-and-revision interval. Assign each participant one peer, require one evidence-based communication strength and one observable revision target, and classify the target as organization, clarification, peer response, pause management, intelligibility, or turn-taking. During the second interaction, code whether the selected revision is observable.
- Complete reflection and fidelity records. Ask participants to rate current communicative confidence from 1 to 7, rate current speaking anxiety from 1 to 5, and record one next-step speaking behavior. Verify identifiers, collect forms, and complete the fidelity checklist.
- Deliver the active-comparison session using the same topic, objective, task difficulty, preparation time, number of speaking attempts, and 32 min duration as the matched structured-condition class. Use the sequence shown in Table 2 without role cards, criterion-based peer feedback, documented revision targets, feedback-uptake coding, or behavior-focused reflection.
- Conduct scheduled video review during Weeks 2, 4, 6, and 8 when valid video consent is available. Transfer recordings to encrypted storage and select the first eligible 60–90 s segment containing at least one contribution and one response by the focal participant.
- In the structured condition, ask the participant to identify one effective contribution, one unclear communication point, and one observable behavior to change. In the active-comparison condition, ask the participant to describe the topic and sequence of ideas without identifying a behavioral target. Limit each review activity to 10 min.
8. Record weekly process and fidelity data
- Record attendance when a participant is present for at least 75% of the 32 min target session. Record late arrival and early departure in minutes and calculate exposure as attended sessions divided by eight.
- Record speaking seconds and substantive speaking turns separately for the first and second speaking attempts. Calculate each participant's speaking-time proportion and participation equity using the normalized inverse Herfindahl index21:

where pi is participant i's speaking-time proportion and k is the number of participants present. Code participation equity as missing when fewer than two participants are present.
Note: Values range from 0 to 1, with higher values indicating more equal participation. - Code feedback uptake only in the structured condition. Code observed revision as 1, absent revision as 0, and unjudgeable revision as 9. Calculate uptake as observed revisions divided by judgeable selected revisions, excluding code 9. Set feedback uptake as not applicable for active-comparison participants.
- Administer the weekly 1–5 state-speaking-anxiety item immediately after the second speaking attempt and before instructor feedback.
- Calculate structured-condition fidelity as the percentage of six completed components: role rotation, individual preparation, first speaking attempt, structured feedback, revision with second speaking attempt, and individual reflection. Classify sessions below 80% as fidelity deviations and retrain an instructor after two consecutive deviations.
- Record active-comparison contamination after every session. Code whether rotating roles, criterion-based feedback, documented revision targets, feedback-uptake coding, or behavior-focused video reflection occurred. Classify a session as contaminated when two or more intervention-specific components occur.
9. Conduct post-intervention and follow-up assessments
- Conduct the post-intervention assessment within 7 days after Week 8. Re-administer the five questionnaire measures using the same wording, order, response scales, and scoring rules used at baseline.
- Conduct the reserved speaking task with 2 min preparation, a 1 min individual response, and a 2 min examiner-led interaction. Offer one make-up assessment within 7 days.
- Conduct the follow-up assessment 28 days after the post-intervention assessment, allowing a deviation of no more than 3 days. Re-administer the five questionnaire measures, conduct the reserved speaking task under the same examiner and recording procedures, and record any organized English-speaking instruction received during follow-up.
10. Score and verify the measures
- Score questionnaires by reverse-scoring the two positively worded anxiety items and calculating each scale as the mean of completed items when at least 80% of items are complete. Leave the scale missing when more than 20% of items are unanswered.
- Score speaking performance using two masked raters. Each rater scores fluency, intelligibility, interactional responsiveness, message clarity, and task completion from 1 to 5. Sum the five domains to obtain a 5–25 raw score and store the rescaled 0-100 score for descriptive reporting:
Speakingscore = ((rawscore - 5)/20) × 100
NOTE: The 0–100 score is a descriptive rescaling and does not imply greater measurement precision. - Average the two rater scores when they differ by no more than 10 points on the 0-100 scale. When the difference exceeds 10 points, require independent rescoring without disclosure of the other rater’s score or the rater’s previous score. Use the mean of the rescored values as the final score. Record whether rescoring was required.
- Calculate Cronbach's alpha and McDonald's omega for each multi-item measure at each assessment point. Calculate two-way random-effects, absolute-agreement intraclass correlation coefficients for speaking scores and classify values ≥0.75 as acceptable22.
- Report intercorrelations among communicative confidence, willingness to communicate, speaking self-efficacy, speaking anxiety, and perceived peer psychological safety. Compare one-factor and correlated-factor models for communicative confidence and speaking self-efficacy to assess discriminant validity.
- Verify valid ranges and logical consistency before analysis. Check questionnaire ranges, speaking scores, participation equity, feedback uptake, duplicate identifiers, impossible dates, inconsistent class assignments, repeated roles, process data during absence, and active-comparison feedback-uptake values. Compare flagged entries with source forms or recordings and document corrections in the data-query log.
11. Freeze and analyze the data
- Store unobserved responses as system missing. Do not use 0, 99, 999, midpoint substitution, group-mean substitution, or last observation carried forward. Construct the final datasets using the definitions, valid ranges, missing-value rules, derivation formulas, contamination codes, and merge keys in Supplementary File 3.
- For the primary class-level analysis, use all observed communicative-confidence data available within each class and report the number contributing to each class mean at each assessment point. Conduct complete-case and multiply imputed sensitivity analyses for missing post-intervention or follow-up communicative-confidence scores.
- Use chained-equation multiple imputation for incomplete covariates, secondary questionnaire measures, and sensitivity analyses when the missing-at-random assumption is defensible23. Include condition, class, instructor pair, time, baseline outcomes, attendance, proficiency, and observed repeated outcomes in the imputation model; preserve the longitudinal structure24. Use 40 imputations with 20 iterations and inspect trace plots and imputed distributions.
- Freeze the verified participant-level, item-level, weekly-process, group-level, class-session, speaking-rating, video-review, and class-level datasets before final analysis. Record file checksums and run all analyses from frozen-file copies. Do not edit frozen files manually.
- Report recruitment, post-intervention retention, follow-up retention, attendance, structured-condition fidelity, active-comparison contamination, recording availability, video-review completion, and rating reliability.
- Classify feasibility as full when all six prespecified domains are met, feasible with modification when four or five are met, and not yet feasible when three or fewer are met.
- Conduct the primary class-level analysis. Calculate each class mean at baseline, post-intervention, and follow-up; calculate baseline-to-post and baseline-to-follow-up change; subtract the active-comparison class change from the structured-condition class change within each instructor-matched pair; and calculate the mean difference and 95% confidence interval from the four paired differences using a t distribution with 3 degrees of freedom. Report all four pair-level differences in the main results.
- Conduct primary-outcome sensitivity analyses using baseline-adjusted class-level estimates, leave-one-pair-out analysis, observed-data estimates, complete-case estimates, and multiply imputed estimates. Report estimates and confidence intervals for each sensitivity analysis.
- Conduct the participant-level supplementary analysis using a linear mixed-effects model with communicative confidence as the dependent variable; categorical time, condition, time-by-condition interaction, baseline proficiency, and instructor pair as fixed effects; and participant and class random intercepts. Estimate the model using restricted maximum likelihood25 and apply the Kenward-Roger small-sample correction26.
Note: Interpret this model as supplementary because only eight class clusters are available. - Analyze secondary outcomes as exploratory. Repeat the class-level and participant-level procedures for willingness to communicate, speaking anxiety, speaking self-efficacy, perceived peer psychological safety, and speaking performance. Report unadjusted estimates and false-discovery-rate-adjusted q values.
- Analyze weekly process outcomes as exploratory. Fit weekly models for speaking seconds, substantive turns, weekly state anxiety, and participation equity using week, condition, and condition-by-week interaction as fixed effects, with clustering by class or participant as appropriate. Report model estimates, confidence intervals, and interaction tests.
- Analyze feedback uptake only among structured-condition participants with judgeable selected revision targets. Estimate its association with post-intervention communicative confidence after adjustment for baseline communicative confidence, proficiency, attendance, instructor pair, and class. Do not include condition as a predictor in this model.
NOTE: Feedback uptake is defined only for structured-condition participants and is not applicable to the active-comparison condition. - Conduct robustness analyses among participants attending at least six sessions, after excluding structured-condition classes with mean fidelity below 80%, after excluding contaminated active-comparison sessions, and after excluding participants receiving organized English-speaking instruction during follow-up. Compare completers and noncompleters on baseline characteristics and outcomes to assess attrition bias.
12. Verify analytical reproducibility
- Run all cleaning, scoring, imputation, modeling, table-generation, and figure-generation scripts from a clean copy of the frozen datasets using the software names, versions, commands, and package versions listed in the Table of Materials and Supplementary File 3. The statistical workflow is script-based rather than menu-driven; therefore, menu-operation screenshots are not applicable.
- In R statistical software version 4.6.0, open the RStudio project file, run renv::restore(), run source("00_run_all.R"), and save session information, package versions, warnings, and convergence messages to the analysis log.
- Confirm that participant counts, derived variables, statistical estimates, tables, and figures are reproduced without manual replacement. Export all figures as high-resolution Portable Document Format (PDF) files.
- Remove names, student numbers, email addresses, course codes, free-text identifiers, and original recording filenames from distributable data. Retain only release-specific participant, class, and instructor codes. Exclude raw audio and video recordings.
Note: The data dictionary, analysis specification, scripts, and reproducibility log were included in Supplementary File 3. The de-identified Collaborative Speaking Final Analysis Dataset was provided separately as Supplementary File 4 and contained the coded records used to reproduce the reported tables and figures that did not require restricted raw audio or video recordings.
결과
Participant flow and feasibility
A total of 210 students from eight university English as a Foreign Language (EFL) speaking classes were assessed for eligibility. Thirty students did not enter the study: 18 did not provide written consent, 8 did not complete the baseline communicative-confidence assessment within the baseline window, and 4 withdrew or became unavailable before enrollment was finalized. The remaining 180 students provided written consent, completed the baseline communicative-confidence assessment, and entered the study, yielding a recruitment rate of 85.7%. Four intact classes with 92 participants received the structured collaborative speaking condition, and four classes with 88 participants received the active-comparison condition. Each of the four instructors taught one class in each condition. Post-intervention primary-outcome data were available for 176 participants, corresponding to 97.8% retention: 90 of 92 participants in the structured condition and 86 of 88 participants in the active-comparison condition. Four-week follow-up data were available for 159 participants, corresponding to 88.3% retention: 78 of 92 participants in the structured condition and 81 of 88 participants in the active-comparison condition. Participant enrollment, non-enrollment reasons, assessment completion, attrition, and analytic inclusion are shown in Figure 2.
Recruitment and retention exceeded the prespecified thresholds. Mean structured-condition fidelity across 32 sessions was 92.7%; three sessions fell below the 80% session threshold. Two of 32 active-comparison sessions contained at least two intervention-specific components, giving a contamination rate of 6.3%, below the prespecified 20% boundary. Across Weeks 2, 4, 6, and 8, 638 participant-level video reviews were scheduled; 596 were completed, and 567 produced usable recordings, corresponding to 93.4% completion and 88.9% recording usability. All 515 completed speaking-assessment recordings were usable for scoring. No formal peer-conflict complaint, exclusion complaint, or recording-related withdrawal was documented during implementation. Participant-level characteristics, retention, exposure, fidelity, contamination, and recording availability are summarized in Table 3. Because condition placement occurred at the class level, instructor-matched class-pair baseline summaries are reported separately in Supplementary Table 1.
Participant characteristics, baseline measures, and measurement performance
The four instructors had 6–14 years of university EFL teaching experience, held postgraduate qualifications in English-language teaching or applied linguistics, and taught both conditions using the same syllabus and institutional assessment requirements. The structured and active-comparison conditions were similar in participant-level baseline summaries. Mean age was 19.92 ± 1.14 years in the structured condition and 19.70 ± 1.06 years in the active-comparison condition. The structured condition included 49 female participants, 42 male participants, and one participant who preferred not to report gender; the active-comparison condition included 53 female participants, 33 male participants, and two participants who preferred not to report gender. Proficiency bands referred to the Common European Framework of Reference for Languages (CEFR) and were derived from the university’s pre-existing institutional placement record before analysis. Institutional placement scores were mapped into three study bands: scores below the institutional B1 threshold were coded as A2, scores in the lower part of the B1 range were coded as lower B1, and scores in the upper part of the B1 range were coded as higher B1. No participant had an institutional placement record above B1. Proficiency distributions were similar: 32, 36, and 24 structured-condition participants were classified at A2, lower B1, and higher B1, respectively, compared with 30, 38, and 20 active-comparison participants.
Baseline communicative-confidence scores were 4.00 ± 0.83 in the structured condition and 4.03 ± 0.81 in the active-comparison condition. The corresponding baseline values were 3.93 ± 0.78 and 3.86 ± 0.76 for willingness to communicate, 3.17 ± 0.57 and 3.16 ± 0.53 for speaking anxiety, 3.97 ± 0.79 and 3.86 ± 0.77 for speaking self-efficacy, 4.20 ± 0.56 and 4.17 ± 0.55 for perceived peer psychological safety, and 65.35 ± 8.22 and 65.35 ± 7.15 for speaking performance. Participant characteristics and baseline measures are summarized in Table 3. Across the four instructor-matched pairs, structured-minus-comparison baseline communicative-confidence differences ranged from -0.16 to 0.11, and baseline speaking-performance differences ranged from -2.4 to 2.1 points.
Internal consistency was acceptable for all five multi-item measures at each assessment point. McDonald’s omega ranged from 0.804 to 0.882 at baseline, from 0.868 to 0.915 post-intervention, and from 0.892 to 0.921 at follow-up. For communicative confidence, omega was 0.882 at baseline, 0.913 post-intervention, and 0.921 at follow-up; the corresponding Cronbach’s alpha values were 0.881, 0.912, and 0.920. Communicative confidence and speaking self-efficacy were strongly associated but empirically distinguishable. Their baseline correlation was 0.71, and a correlated-factor model for the two measures fit better than a one-factor model, supporting separate reporting of the two constructs. Agreement between the two masked speaking-performance raters exceeded the prespecified threshold at all assessments. The two-way random-effects, absolute-agreement intraclass correlation coefficient was 0.870 at baseline, 0.891 post-intervention, and 0.930 at follow-up. Eighteen of 515 recordings required rescoring because the initial rater difference exceeded 10 points.
Instructional exposure and weekly process outcomes
Participants attended a mean of 7.21 ± 0.91 sessions in the structured condition and 7.09 ± 0.75 sessions in the active-comparison condition. Weekly process analyses were exploratory. In model-based summaries, the structured condition showed larger increases in speaking seconds and substantive speaking turns and a larger decrease in state speaking anxiety. Descriptively, structured-condition first-attempt speaking time increased from 91.7 s in Week 1 to 122.4 s in Week 8, and second-attempt speaking time increased from 119.0 s to 158.6 s. In the active-comparison condition, the corresponding values increased from 95.6 s to 111.3 s and from 111.4 s to 132.2 s, respectively (Figure 3A). First-attempt substantive turns increased from 5.39 to 6.09 in the structured condition and from 5.01 to 6.00 in the active-comparison condition; second-attempt turns increased from 6.66 to 7.52 and from 5.91 to 7.10, respectively (Figure 3B). Weekly state-speaking anxiety decreased from 3.21 to 2.84 in the structured condition and from 3.11 to 3.02 in the active-comparison condition (Figure 3C). Participation equity was higher in the structured condition, with a participant-level mean of 0.69 ± 0.09 compared with 0.61 ± 0.10 in the active-comparison condition (Figure 3D).
Week 1 process data were available for 83 structured-condition participants and 75 active-comparison participants. The unavailable Week 1 records reflected absence from the target session, unusable or unavailable session recording, or incomplete observer records: six, two, and one structured-condition records, respectively, and nine, three, and one active-comparison records, respectively. Week 8 process data were available for 79 structured-condition participants and 78 active-comparison participants. The corresponding unavailable Week 8 records reflected absence, unusable or unavailable recording, or incomplete observer records: 10, two, and one structured-condition records, respectively, and seven, two, and one active-comparison records, respectively. These denominator rules were applied consistently in Figure 3 and the weekly-process dataset. Feedback uptake was calculated only for the structured condition because the active-comparison condition did not use criterion-based peer feedback or formal revision targets. Among structured-condition participants with judgeable targets, the mean feedback-uptake proportion was 0.589 ± 0.146.
Primary outcome: communicative confidence
Communicative confidence increased in both conditions, with a larger instructor-matched class-level increase in the structured condition. Mean scores in the structured condition increased from 4.00 ± 0.83 at baseline to 4.67 ± 0.97 post-intervention and 4.76 ± 0.95 at follow-up. In the active-comparison condition, the corresponding values were 4.03 ± 0.81, 4.33 ± 0.92, and 4.24 ± 0.97. The four pair-level post-intervention differences were 0.28, 0.35, 0.41, and 0.48 points. Using these four instructor-matched paired differences and a t distribution with 3 degrees of freedom, the structured-minus-comparison difference in baseline-to-post-intervention change was 0.38 points on the 1–7 scale (95% confidence interval, 0.24–0.52; p = 0.003). The four follow-up differences were 0.43, 0.50, 0.59, and 0.68 points. The corresponding baseline-to-follow-up difference was 0.55 points (95% confidence interval, 0.38–0.72; p = 0.002). Class-level trajectories are shown in Figure 4A, and participant-level distributions are shown in Figure 4B.
The baseline-adjusted class-level estimate was 0.36 points post-intervention and 0.52 points at follow-up. Leave-one-pair-out estimates ranged from 0.35 to 0.41 post-intervention and from 0.51 to 0.59 at follow-up. Complete-case and multiply imputed estimates were similar in direction and magnitude. In the supplementary participant-level mixed-effects analysis, the post-intervention time-by-condition coefficient was 0.374 points (95% confidence interval, 0.242–0.505; p < 0.001), and the follow-up coefficient was 0.475 points (95% confidence interval, 0.338–0.611; p < 0.001). The model converged without a singular fit, and the class-level intraclass correlation was 0.041. This model was interpreted as supplementary because only eight class clusters were available. Individual change counts were treated as descriptive trajectories. Among the 90 structured-condition participants with post-intervention data, 82 showed a raw-score increase in communicative confidence and eight showed a raw-score decrease. Among the 86 active-comparison participants, 66 showed a raw-score increase and 20 showed a raw-score decrease.
Secondary exploratory outcomes
Secondary exploratory outcomes are summarized in Table 4, which presents the raw condition means at baseline, post-intervention, and follow-up together with the instructor-matched class-level differences in change, 95% confidence intervals, unadjusted p values, and false-discovery-rate-adjusted q values. These analyses were treated as exploratory.
Willingness to communicate increased from 3.93 ± 0.78 to 4.44 ± 0.89 post-intervention and 4.39 ± 0.89 at follow-up in the structured condition, compared with 3.86 ± 0.76, 4.01 ± 0.97, and 3.92 ± 1.02 in the active-comparison condition. The instructor-matched difference in change was 0.36 points post-intervention (95% confidence interval, 0.19–0.52; p = 0.006; q = 0.014) and 0.40 points at follow-up (95% confidence interval, 0.20–0.60; p = 0.008; q = 0.018). Speaking anxiety decreased from 3.17 ± 0.57 to 2.87 ± 0.65 post-intervention and 2.87 ± 0.69 at follow-up in the structured condition, compared with 3.16 ± 0.53, 3.06 ± 0.59, and 3.17 ± 0.63 in the active-comparison condition. The instructor-matched difference in change was −0.20 points post-intervention (95% confidence interval, −0.31 to −0.08; p = 0.012; q = 0.020) and −0.30 points at follow-up (95% confidence interval, −0.45 to −0.16; p = 0.007; q = 0.018). Speaking self-efficacy increased from 3.97 ± 0.79 to 4.51 ± 0.91 post-intervention and 4.51 ± 1.00 at follow-up in the structured condition, compared with 3.86 ± 0.77, 3.96 ± 0.85, and 3.89 ± 0.94 in the active-comparison condition. The instructor-matched difference in change was 0.44 points post-intervention (95% confidence interval, 0.22–0.66; p = 0.008; q = 0.018) and 0.51 points at follow-up (95% confidence interval, 0.34–0.67; p = 0.002; q = 0.010).
Perceived peer psychological safety increased from 4.20 ± 0.56 to 4.81 ± 0.74 post-intervention and 4.75 ± 0.86 at follow-up in the structured condition, compared with 4.17 ± 0.55, 4.29 ± 0.79, and 4.24 ± 0.88 in the active-comparison condition. The instructor-matched difference in change was 0.49 points post-intervention (95% confidence interval, 0.16–0.82; p = 0.018; q = 0.030) and 0.49 points at follow-up (95% confidence interval, 0.08–0.91; p = 0.033; q = 0.047). Speaking performance increased from 65.35 ± 8.22 to 69.53 ± 8.80 post-intervention and 69.37 ± 10.01 at follow-up in the structured condition, compared with 65.35 ± 7.15, 67.81 ± 8.59, and 66.31 ± 8.99 in the active-comparison condition. The immediate instructor-matched difference in change was 1.69 points (95% confidence interval, −0.36 to 3.74; p = 0.078; q = 0.078). At follow-up, the exploratory difference was 2.94 points (95% confidence interval, 1.37–4.51; p = 0.010; q = 0.020).
Feedback uptake, attrition, and robustness checks
In the adjusted process model restricted to structured-condition participants with observed baseline and post-intervention communicative-confidence data and judgeable revision targets (n = 84), feedback uptake showed a positive but imprecise association with communicative-confidence change. The adjusted coefficient was 0.44 points per one-unit increase in feedback uptake (95% confidence interval, −0.31 to 1.19; p = 0.245). Follow-up noncompletion was more frequent in the structured condition than in the active-comparison condition, although completers and noncompleters were similar in baseline communicative confidence, willingness to communicate, speaking anxiety, and speaking self-efficacy; baseline speaking performance was slightly lower among noncompleters. The primary follow-up estimate nevertheless remained positive across the prespecified sensitivity analyses. The complete-case estimate was 0.54 points (95% confidence interval, 0.36–0.72), and the multiply imputed estimate was 0.53 points (95% confidence interval, 0.35–0.71). Restricting the analysis to participants who attended at least six sessions produced an estimate of 0.57 points (95% confidence interval, 0.39–0.75). The fidelity-restricted estimate was 0.55 points (95% confidence interval, 0.38–0.72), while applying the active-comparison contamination restriction produced an estimate of 0.54 points (95% confidence interval, 0.36–0.72). After excluding participants who received organized English-speaking instruction during follow-up, the estimate was 0.56 points (95% confidence interval, 0.37–0.75). None of these restrictions materially changed the direction or magnitude of the primary follow-up finding.
Individual responses remained heterogeneous. Sixteen of 90 structured-condition participants with post-intervention willingness-to-communicate data showed a raw-score decrease, compared with 34 of 86 active-comparison participants. Speaking anxiety increased in 15 structured-condition participants and 28 active-comparison participants, while speaking-performance scores decreased in 10 and 24 participants, respectively. These counts were treated as descriptive trajectories because raw-score change may include measurement error. Overall, recruitment, retention, fidelity, contamination control, recording quality, and scoring reliability met the prespecified feasibility criteria. Communicative confidence showed a consistent instructor-matched class-level advantage for the structured condition, whereas the immediate speaking-performance estimate remained uncertain. The sensitivity analyses did not materially alter the primary follow-up estimate, supporting the feasibility of the complete multicomponent protocol and providing preliminary instructor-matched class-level estimates for communicative confidence and related exploratory outcomes.
DATA AVAILABILITY:
The de-identified Collaborative Speaking Final Analysis Dataset is provided as Supplementary File 4. The data dictionary, variable definitions, missing-data rules, analysis specification, software-environment information, analysis scripts, and reproducibility log are provided in Supplementary File 3. Raw audio and video recordings are not included in the publicly available supplementary materials because they contain potentially identifiable participant speech and image data and remain subject to the consent and confidentiality conditions of the approved study protocol.
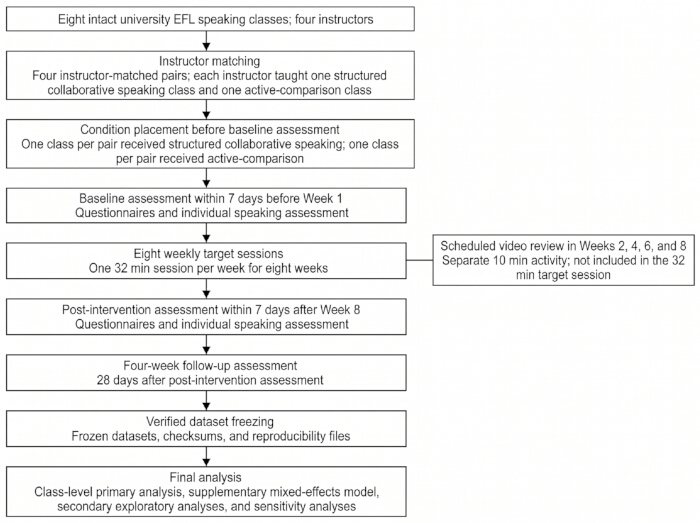
Figure 1: Study workflow. Workflow of the instructor-matched clustered quasi-experimental study, including class matching, baseline assessment, eight weekly target sessions, post-intervention assessment, four-week follow-up, dataset freezing, and final analysis. Please click here to view a larger version of this figure.
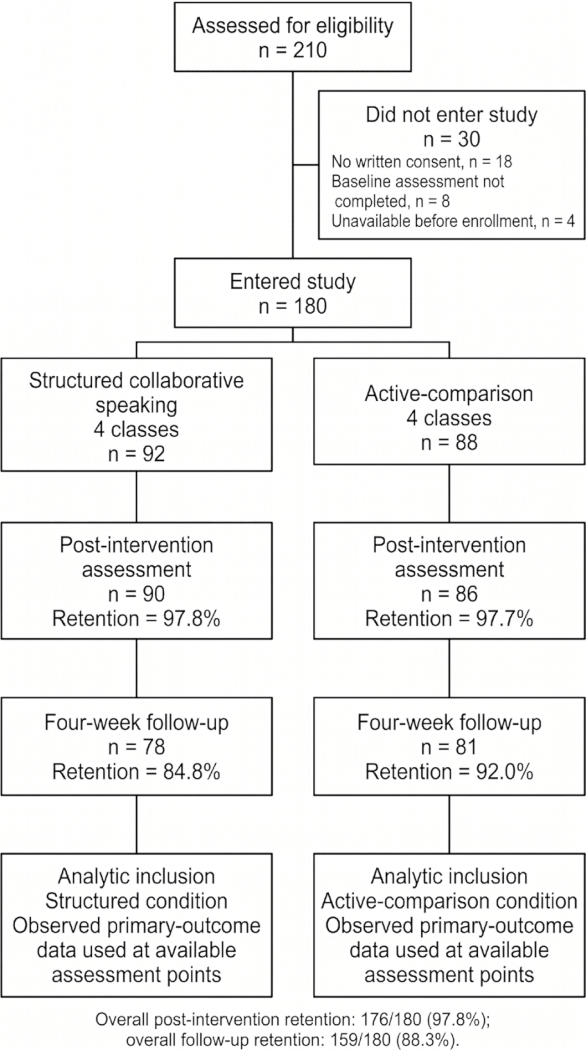
Figure 2: Participant flow. Participant flow from eligibility assessment and written consent to condition placement, post-intervention assessment, four-week follow-up, and analytic inclusion. Please click here to view a larger version of this figure.
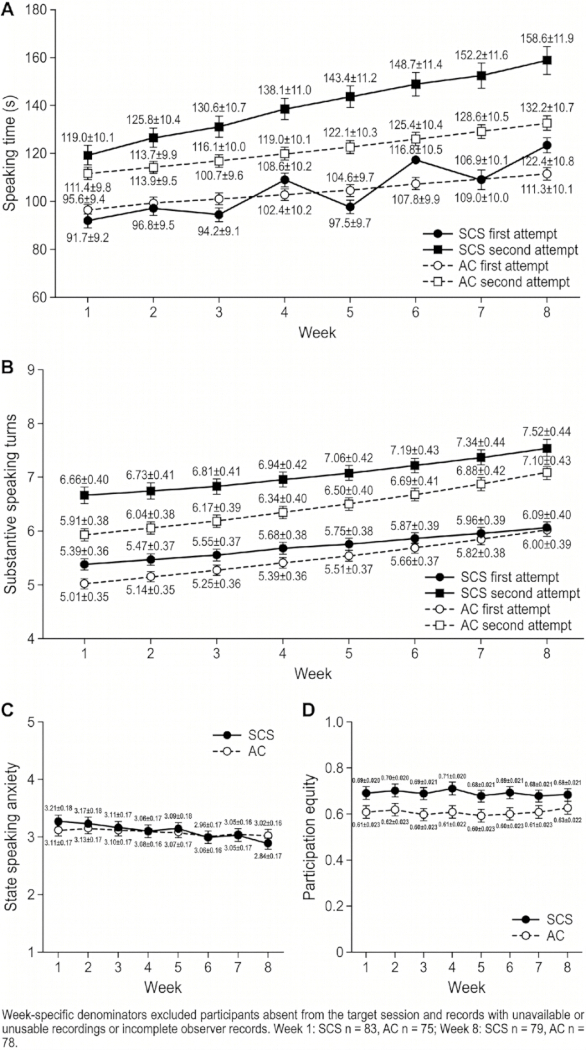
Figure 3: Weekly process outcomes across the eight instructional weeks. (A) First- and second-attempt speaking time. (B) First- and second-attempt substantive speaking turns. (C) Weekly state-speaking-anxiety scores measured after the focal speaking activity. (D) Participation equity derived from within-group speaking-time distribution. Error bars indicate 95% confidence intervals. Please click here to view a larger version of this figure.
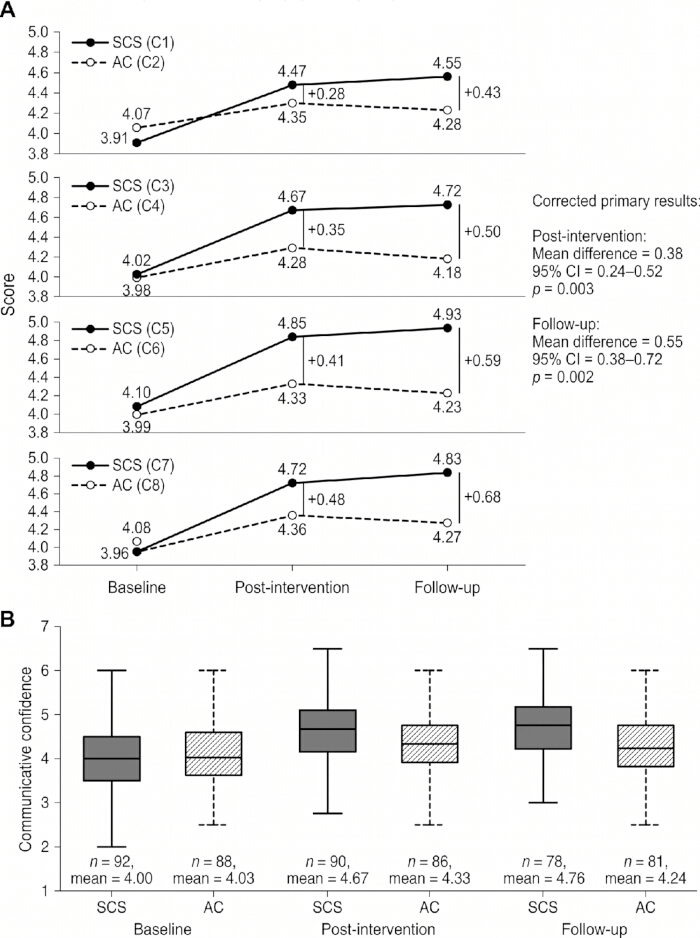
Figure 4: Communicative-confidence outcomes across the three assessment points. (A) Class-level mean communicative-confidence trajectories for the four instructor-matched pairs. (B) Participant-level communicative-confidence distributions by condition and assessment point. Please click here to view a larger version of this figure.
Table 1: Assessment schedule, scoring rules, feasibility thresholds, and data sources. Operational definitions, assessment timing, response ranges, scoring and coding rules, feasibility thresholds, and data sources for outcomes, weekly process indicators, and implementation variables. Please click here to download this Table.
Table 2: Timing and condition-specific content of the weekly target speaking session. Timing and matched activities in the 32 min structured collaborative speaking and active-comparison sessions.
Note: In Weeks 2, 4, 6, and 8, conduct a separate 10 min scheduled video-review activity within the same teaching week. This activity is not included in the 32 min target session. Select the first eligible 60–90 s segment containing at least one contribution and one response by the focal participant. Structured-condition participants identify one effective contribution, one unclear communication point, and one observable behavior to change. Active-comparison participants describe the topic and sequence of ideas without identifying a behavioral target. Please click here to download this Table.
Table 3: Participant characteristics, baseline measures, retention, exposure, and implementation feasibility. Baseline demographic, proficiency, and outcome summaries; retention, attendance, fidelity, contamination, video-review completion, recording availability, rescoring frequency, implementation concerns, and inter-rater reliability.
Note: Values are presented as mean ± standard deviation or n/N (%). Standardized mean differences are reported for continuous participant-level baseline characteristics and baseline outcome measures; positive values indicate higher values in the structured collaborative speaking condition. Proficiency categories were CEFR-referenced bands derived from the university’s pre-existing institutional placement records. Because condition placement occurred at the class level, instructor-matched class-pair baseline summaries are reported separately in Supplementary Table 1. Recruitment was calculated from the complete eligible sample. Inter-rater reliability was calculated from pooled speaking-performance recordings across both conditions at each assessment point. CEFR, Common European Framework of Reference for Languages; ICC, intraclass correlation coefficient; SD, standard deviation. Please click here to download this Table.
Table 4: Raw condition means and instructor-matched class-level differences in change. Baseline, post-intervention, and follow-up values for the primary and exploratory secondary outcomes, with instructor-matched class-level differences in change, 95% confidence intervals, p values, and q values.
Note: Values at each assessment point are raw participant-level means ± standard deviations. The matched difference in change was calculated at the class level as the structured-condition class change minus the active-comparison class change within each of the four instructor-matched pairs. Confidence intervals and two-sided p values were calculated from the four paired class-level differences using a t distribution with 3 degrees of freedom. Communicative confidence was the primary outcome and was not included in the false-discovery-rate adjustment. Secondary outcomes were exploratory; q values are false-discovery-rate-adjusted values for the secondary analyses. CI, confidence interval; SCS, structured collaborative speaking condition; AC, active-comparison condition. Please click here to download this Table.
Supplementary Table 1: Instructor-matched class-pair baseline summaries. Class-level baseline summaries for the four instructor-matched pairs. (Top) Communicative confidence, willingness to communicate, and speaking anxiety. (Bottom) Speaking self-efficacy, perceived peer psychological safety, and speaking performance. Differences are calculated as structured condition minus active-comparison condition within each pair. Note: Values are instructor-matched class-level baseline means unless otherwise stated. S indicates the structured collaborative speaking condition, and C indicates the active-comparison condition. Differences were calculated as structured condition minus active-comparison condition within each instructor-matched class pair. Participant-weighted overall values correspond to the participant-level baseline summaries reported in Table 3. Communicative confidence, willingness to communicate, speaking self-efficacy, and perceived peer psychological safety were scored from 1 to 7; speaking anxiety was scored from 1 to 5; speaking performance was reported on the descriptive 0–100 scale. These class-pair summaries were used to inspect baseline comparability because condition placement occurred at the class level. Please click here to download this file.
Supplementary File 1: Instructional materials and fidelity records. Condition and task codes, 32 min session procedures, instructor scripts, role cards, weekly task pairs, peer-feedback and revision forms, reflection forms, video-review procedures, fidelity checklists, contamination checklists, and protocol-deviation records. Please click here to download this file.
Supplementary File 2: Measurement, speaking-assessment, and observation materials. Questionnaire adaptation procedures, outcome measures, weekly state-speaking-anxiety items, parallel speaking-assessment tasks, task-comparability criteria, examiner instructions, speaking-performance rubric, scoring rules, rater procedures, reliability specifications, and observation definitions. Please click here to download this file.
Supplementary File 3: Data dictionary and reproducible analysis specification. Dataset definitions, variable coding, derivation formulas, missing-data rules, logical-validation rules, analysis procedures, multiple-imputation settings, software-environment requirements, project structure, dataset-freezing procedures, checksum procedures, and reproducibility outputs. Please click here to download this file.
Supplementary File 4: Collaborative Speaking Final Analysis Dataset. De-identified analysis dataset containing the coded participant-level, class-level, weekly-process, speaking-rating, and video-review records used for the reported analyses, tables, and figures. Raw audio and video recordings are not included. Please click here to download this file.
토론
This instructor-matched clustered quasi-experimental study examined an eight-week structured collaborative speaking protocol in intact university English as a Foreign Language (EFL) speaking classes. Communicative confidence increased in both conditions, but the instructor-matched class-level increase was larger in the structured condition at post-intervention and remained evident at four-week follow-up. All four instructor-matched class pairs showed a structured-minus-comparison advantage, although the magnitude varied across pairs. Similar directional patterns were observed for willingness to communicate, speaking self-efficacy, perceived peer psychological safety, and speaking anxiety. The immediate between-condition difference in speaking performance was less clear and became more evident only at follow-up. This pattern suggests that learners' perceived readiness and capacity to participate may develop before externally rated speaking performance becomes clearly differentiated.
The protocol's value appeared to lie in organizing familiar pedagogical elements into a reproducible cycle rather than introducing a single new instructional component. Peer work may provide speaking opportunities, but participation can remain uneven and feedback may be too general to guide revision unless learners are trained to observe communication and provide usable responses27. In this protocol, rotating roles defined minimum interactional responsibilities, criterion-based peer feedback focused attention on observable communication, one selected revision target limited cognitive load, and a parallel second attempt gave learners an immediate opportunity to revise. This structure is consistent with task-repetition research, which suggests that repeated performance can reduce procedural uncertainty and help learners reuse recently activated language and interactional strategies, although effects vary by task and proficiency28. Focused feedback followed by another speaking opportunity may also support speaking development and reduce anxiety when it is behaviorally specific and manageable29.
The weekly process findings further support the importance of structure within collaborative speaking. Speaking time and substantive turns increased across the instructional period, second-attempt speaking time exceeded first-attempt speaking time, and participation equity remained higher in the structured condition. These findings are relevant because a task may appear communicative while still allowing a small number of confident students to occupy most of the available speaking space. The role system made initiating, clarifying, challenging, and synthesizing legitimate task responsibilities rather than optional behaviors. This may have helped students experience interaction as a jointly managed activity, which is important because authentic communication depends on negotiation of meaning, peer response, and collaborative repair30. Emotional experience and classroom environment also influence whether learners enter second-language communication31, and willingness to communicate varies across activities, interlocutors, and local classroom conditions32. In the present context, reducing ambiguity about how to participate may have helped learners move from passive presence toward purposeful talk33.
The results should be interpreted as evidence for the complete multicomponent protocol rather than for any single element. Speaking self-efficacy improved more in the structured condition, but feedback uptake did not independently predict communicative-confidence change after adjustment for baseline confidence, attendance, proficiency, instructor pair, and class. This suggests that confidence may have developed through the full instructional cycle rather than through visible uptake of one peer-feedback target alone. Peer-feedback environments may influence self-efficacy even when differences between feedback formats are limited34. The uptake measure captured whether a selected behavioral target was visibly attempted during the second performance, but it did not capture feedback accuracy, target difficulty, learner interpretation, delayed uptake, or less visible changes. Similarly, speaking performance should be interpreted separately from confidence. Confidence and self-efficacy concern perceived capacity to act, whereas the speaking rubric required observable changes in fluency, intelligibility, responsiveness, clarity, and task completion. In multilingual university settings, effective communication often depends on clarification, paraphrase, examples, and collaborative repair rather than approximation to an idealized native-speaker model35.
The feasibility findings indicate that the protocol can be implemented in intact university EFL speaking classes, but several execution points require attention. Recruitment, retention, mean fidelity, contamination control, recording availability, and inter-rater reliability met the prespecified criteria. However, three structured sessions fell below the fidelity threshold, two comparison sessions contained multiple intervention-specific components, and some scheduled video reviews were incomplete or unusable. Practical troubleshooting should therefore focus on instructor rehearsal before Week 1, separate condition checklists, clear prohibition of intervention-specific elements in comparison classes, immediate fidelity recording, role-rotation checks after absences, equipment checks before recorded activities, and short replacement procedures when a participant lacks valid video consent or usable footage. For low-quality peer feedback, instructors should redirect students to the criterion sheet and require one evidence-based strength and one observable revision target rather than general praise or personality-based comments. For group absence or membership change, the missing role should be reassigned for that session only, and the deviation should be recorded rather than informally changing the rotation.
Several limitations remain. Condition placement was nonrandom, students and instructors could not be blinded, and the effective number of independent instructor-matched pairs was four. The primary outcome was self-reported communicative confidence, and the follow-up period was limited to four weeks. The study was conducted in one Chinese university EFL context, where peer evaluation, classroom silence, teacher authority, and concern about public error may shape participation differently from other educational systems or proficiency levels. Observer-coded process measures captured the amount and distribution of participation but did not fully assess linguistic complexity, interactional repair quality, or long-term transfer. Even so, the active-comparison design strengthened interpretation because both conditions received matched topics, preparation time, two speaking attempts, and total instructional exposure. The protocol may be adapted for larger classes by using stable subgroups and rotating observer sampling, for lower-proficiency learners by simplifying task prompts and allowing more planning time, for online classes by replacing role cards with shared digital forms, and for shorter courses by reducing video review to selected weeks while retaining the core cycle of role-guided participation, focused feedback, revision, and reperformance. Overall, the protocol was feasible and was associated with a larger increase in communicative confidence than matched speaking practice alone, supporting further evaluation in larger randomized or more strongly controlled studies with more instructional clusters, longer follow-up, broader proficiency ranges, and more detailed linguistic-performance measures.
공개 사항
The authors declare no competing financial interests or personal relationships that could have influenced the work reported in this article.
감사의 글
The authors thank the participating students for their time and cooperation. The authors also thank the academic and administrative staff who supported classroom coordination, scheduling, and data collection. This work was supported by the Key Project of Scientific Research in Universities of Anhui Province (Grant No. 2024AH052107), the New Era Education Quality Project of Anhui Province (Grant No. 2024zyxwjxalk089), and University-level Projects of Anhui University of Finance & Economics (Grant No. acszjyzd2025006).
재료
| 이름 | 회사 | 카탈로그 번호 | 댓글 |
|---|---|---|---|
| Analysis scripts and reproducibility log | Study authors | Supplementary File 3; final frozen script set | Data cleaning, scoring, imputation, modeling, table generation, figure generation, and reproducibility verification. |
| Audio/video recording device | Institution-approved classroom recording equipment | Digital audio/video recording device with exportable timestamped files | Recording speaking assessments and scheduled video-review segments. Coded filenames were used, and raw audio and video recordings were excluded from released materials. |
| Collaborative Speaking Final Analysis Dataset | Study authors | Supplementary File 4; frozen de-identified final analysis dataset | De-identified analysis-ready dataset used to reproduce reported tables and figures that did not require restricted raw audio or video recordings. |
| dplyr R package | CRAN; Posit contributors | Version 1.2.1 | Dataset construction, validation, merging, grouped summaries, and participant-, class-, and condition-level summaries. |
| ggplot2 R package | CRAN; Posit contributors | Version 4.0.3 | Generation of weekly process figures and communicative-confidence outcome figures. |
| Instructional materials and fidelity forms | Study authors | Supplementary File 1 | Condition codes, weekly task procedures, instructor scripts, role cards, peer-feedback forms, revision records, reflection forms, video-review procedures, fidelity checklists, contamination checklists, and protocol-deviation records. |
| lme4 R package | CRAN; lme4 development team | Version 2.0-1 | Supplementary participant-level linear mixed-effects analysis, including convergence checks, random-effect variance estimates, and singular-fit diagnostics. |
| Measurement, speaking-assessment, and observation materials | Study authors | Supplementary File 2 | Questionnaire adaptation procedures, outcome measures, speaking-assessment tasks, examiner instructions, speaking-performance rubric, scoring rules, rater procedures, reliability specifications, and observation definitions. |
| mice R package | CRAN; mice development team | Version 3.19.0 | Chained-equation multiple imputation for missing-data sensitivity analyses. |
| psych R package | CRAN; William Revelle | Version 2.6.5 | Cronbach’s alpha, McDonald’s omega, and descriptive psychometric analyses. |
| R statistical software | R Foundation for Statistical Computing | R 4.6.0 | Data cleaning, scale scoring, descriptive analysis, class-level analysis, mixed-effects analysis, imputation workflow, table generation, and figure generation. |
| readr R package | CRAN; Posit contributors | Version recorded in renv.lock | Import of CSV and delimited research files with explicit column types, character encoding, and missing-value strings. |
| renv R package and renv.lock | CRAN; Posit Software, PBC; generated from final R project | renv 1.2.3; frozen renv.lock | Freezing and restoring the R package environment before rerunning the validated analysis scripts. |
| RStudio Desktop | Posit Software, PBC | RStudio Desktop 2026.04.0 | Management and execution of the script-based analysis workflow through an RStudio Project with relative file paths and UTF-8 encoding. |
| tidyr R package | CRAN; Posit contributors | Version recorded in renv.lock | Construction of longitudinal and weekly process datasets while preserving participant, class, instructor, condition, week, and assessment-time identifiers. |
참고문헌
- Goh CCM, Burns A. Teaching speaking: a holistic approach. Cambridge University Press; Cambridge; 2012.
- Woodrow L. Anxiety and speaking English as a second language. RELC J. 2006;37(3):308–28.
- Teimouri Y, Goetze J, Plonsky L. Second language anxiety and achievement: a meta-analysis. Stud Second Lang Acquis. 2019;41(2):363–87.
- Peng JE, Woodrow L. Willingness to communicate in English: a model in the Chinese EFL classroom context. Lang Learn. 2010;60(4):834–76.
- Cao Y. Investigating situational willingness to communicate within second language classrooms from an ecological perspective. System. 2011;39(4):468–79.
- Yashima T, MacIntyre PD, Ikeda M. Situated willingness to communicate in an L2: interplay of individual characteristics and context. Lang Teach Res. 2018;22(1):115–37.
- Johnson DW, Johnson RT. An educational psychology success story: social interdependence theory and cooperative learning. Educ Res. 2009;38(5):365–79.
- Bandura A. Self-efficacy: the exercise of control. W.H. Freeman and Company; New York; 1997.
- Ellis R, et al. Task-based language teaching: theory and practice. Cambridge University Press; Cambridge; 2020.
- Skehan P. Tasks versus conditions: two perspectives on task research and their implications for pedagogy. Annu Rev Appl Linguist. 2016;36:34–49.
- Storch N. Patterns of interaction in ESL pair work. Lang Learn. 2002;52(1):119–58.
- Philp J, Adams R, Iwashita N. Peer interaction and second language learning. Routledge; New York; 2014.
- Kartchava E, Nassaji H. The role of task repetition and learner self-assessment in technology-mediated task performance. ITL Int J Appl Linguist. 2019;170(2):180–203.
- Dörnyei Z, Murphey T. Group dynamics in the language classroom. Cambridge University Press; Cambridge; 2003.
- Hoffmann TC, et al. Better reporting of interventions: template for intervention description and replication (TIDieR) checklist and guide. BMJ. 2014;348:g1687.
- Hattie J, Timperley H. The power of feedback. Rev Educ Res. 2007;77(1):81–112.
- MacIntyre PD, Baker SC, Clément R, Conrod S. Willingness to communicate, social support, and language-learning orientations of immersion students. Stud Second Lang Acquis. 2001;23(3):369–88.
- Horwitz EK, Horwitz MB, Cope J. Foreign language classroom anxiety. Mod Lang J. 1986;70(2):125–32.
- Bandura A. Guide for constructing self-efficacy scales. In: Pajares F, Urdan T, editors. Self-efficacy beliefs of adolescents. Information Age Publishing; Greenwich, CT; 2006. p. 307–37.
- Edmondson AC. Psychological safety and learning behavior in work teams. Adm Sci Q. 1999;44(2):350–83.
- Laakso M, Taagepera R. “Effective” number of parties: a measure with application to West Europe. Comp Polit Stud. 1979;12(1):3–27.
- Koo TK, Li MY. A guideline of selecting and reporting intraclass correlation coefficients for reliability research. J Chiropr Med. 2016;15(2):155–63.
- White IR, Royston P, Wood AM. Multiple imputation using chained equations: issues and guidance for practice. Stat Med. 2011;30(4):377–99.
- Grund S, Lüdtke O, Robitzsch A. Multiple imputation of missing data for multilevel models: simulations and recommendations. Organ Res Methods. 2018;21(1):111–49.
- Bates D, Mächler M, Bolker BM, Walker SC. Fitting linear mixed-effects models using lme4. J Stat Softw. 2015;67(1):1–48.
- Kenward MG, Roger JH. Small sample inference for fixed effects from restricted maximum likelihood. Biometrics. 1997;53(3):983–97.
- Sato M, Lyster R. Peer interaction and corrective feedback for accuracy and fluency development: monitoring, practice, and proceduralization. Stud Second Lang Acquis. 2012;34(4):591–626.
- Bygate M. Effects of task repetition on the structure and control of oral language. In: Bygate M, Skehan P, Swain M, editors. Researching pedagogic tasks: second language learning, teaching, and testing. Longman; Harlow; 2001:23–48.
- Ebadijalal M, Yousofi N. The impact of mobile-assisted peer feedback on EFL learners’ speaking performance and anxiety: does language make a difference? Lang Learn J. 2023;51(1):112–30.
- van Lier L. Interaction in the language curriculum: awareness, autonomy and authenticity. Longman; London; 1996.
- MacIntyre PD, Clément R, Dörnyei Z, Noels KA. Conceptualizing willingness to communicate in a L2: a situational model of L2 confidence and affiliation. Mod Lang J. 1998;82(4):545–62.
- Han H, Li B. Perceptions of social interactions and second language willingness to communicate in different activities. Asian Pac J Second Foreign Lang Educ. 2024;9:48.
- Mercer N, Dawes L. The value of exploratory talk. In: Mercer N, Hodgkinson S, editors. Exploring talk in school: inspired by the work of Douglas Barnes. SAGE Publications; London; 2008. p. 55–72.
- Au HYC, Bardakçı M. An analysis of the effect of peer and teacher feedback on EFL learners’ oral performances and speaking self-efficacy levels. Int Online J Educ Teach. 2020;7(4):1453–68.
- Kaur J. Raising explicitness through self-repair in English as a lingua franca. J Pragmat. 2011;43(11):2704–15.