This video presents a high-throughput protocol for measuring the levels and dynamics of the bacterial stress-response nucleotides ppGpp and pppGpp using thin-layer chromatography (TLC). The method provides a powerful, rapid, and cost-effective approach to quantifying (p)ppGpp in bacterial cultures under various stress conditions, enabling high-resolution analysis of bacterial physiology and the stringent response.
Een abonnement op JoVE is vereist om deze inhoud te bekijken. Log in of start vandaag met uw gratis proefperiode.
Methodenartikel
Thin-Layer Chromatography-Based Separation of (p)ppGpp Nucleotides Isolated from Stress-Induced Bacteria
607 weergaven
⸱
26 september 2025
In dit artikel
Samenvatting
Protocol
- Thin-layer Chromatography
- With a soft pencil, mark an origin line 1 cm from the edge of the 20 cm x 20 cm Polyethylenimine-Cellulose (PEI-cellulose) thin-layer chromatography (TLC) plate that has had 5 cm removed from the top with scissors. Apply 5 µL as a droplet on the PEI surface for each sample. Begin ascending development without allowing this spot to dry, which improves resolution by minimizing streaking.
- Do ascending development in a tank with a layer of 1.5 M KH2PO4 (pH 3.4) solution shallow enough so that liquid does not touch the origin sample spot. Cover the tank with an air-tight seal and allow liquid ascent to the top of the trimmed sheet, 15 cm. To achieve pH 3.4 for a 1.5 M KH2PO4 solution, it is necessary to adjust the pH by adding H3PO4.
- Remove the fully developed chromatogram and air dry at room temperature.
- Cut and discard the top (pH front) portion of the chromatogram containing the free 32P into radioactive waste. This portion is represented in yellow color in Figure 1 and is easily visualized under UV light. If measuring only (p)ppGpp nucleotides that migrate slower than guanosine triphosphate (GTP), it is recommended to run a UV-visible GTP standard and then cut and discard a larger upper portion (anything above GTP, as shown in Figure 1).
- Expose autoradiographic films overnight with a phosphor screen.
- Develop the film. Capture and quantitate the phosphor screen signal with a phosphoimager.
- Quantitation of (p)ppGpp
- Quantitate radioactive spots with Image J.
NOTE: The amount of (p)ppGpp can be normalized to the total amount of G nucleotides observed in each sample (Figure 1). If the amount of background is homogeneous, a single blank (box 4 from Figure 1) can be subtracted to correct for background. Total G is the sum of GTP + ppGpp + pppGpp detected. This normalization assumes that guanosine monophosphate (GMP) and guanosine diphosphate (GDP) levels are negligible, which is true for Escherichia coli. The ratio of a given nucleotide to total G provides an important way to correct for variations in applied sample volume.
- Quantitate radioactive spots with Image J.
Toegang beperkt. Log in of start een proefperiode om deze inhoud te bekijken.
Resultaten
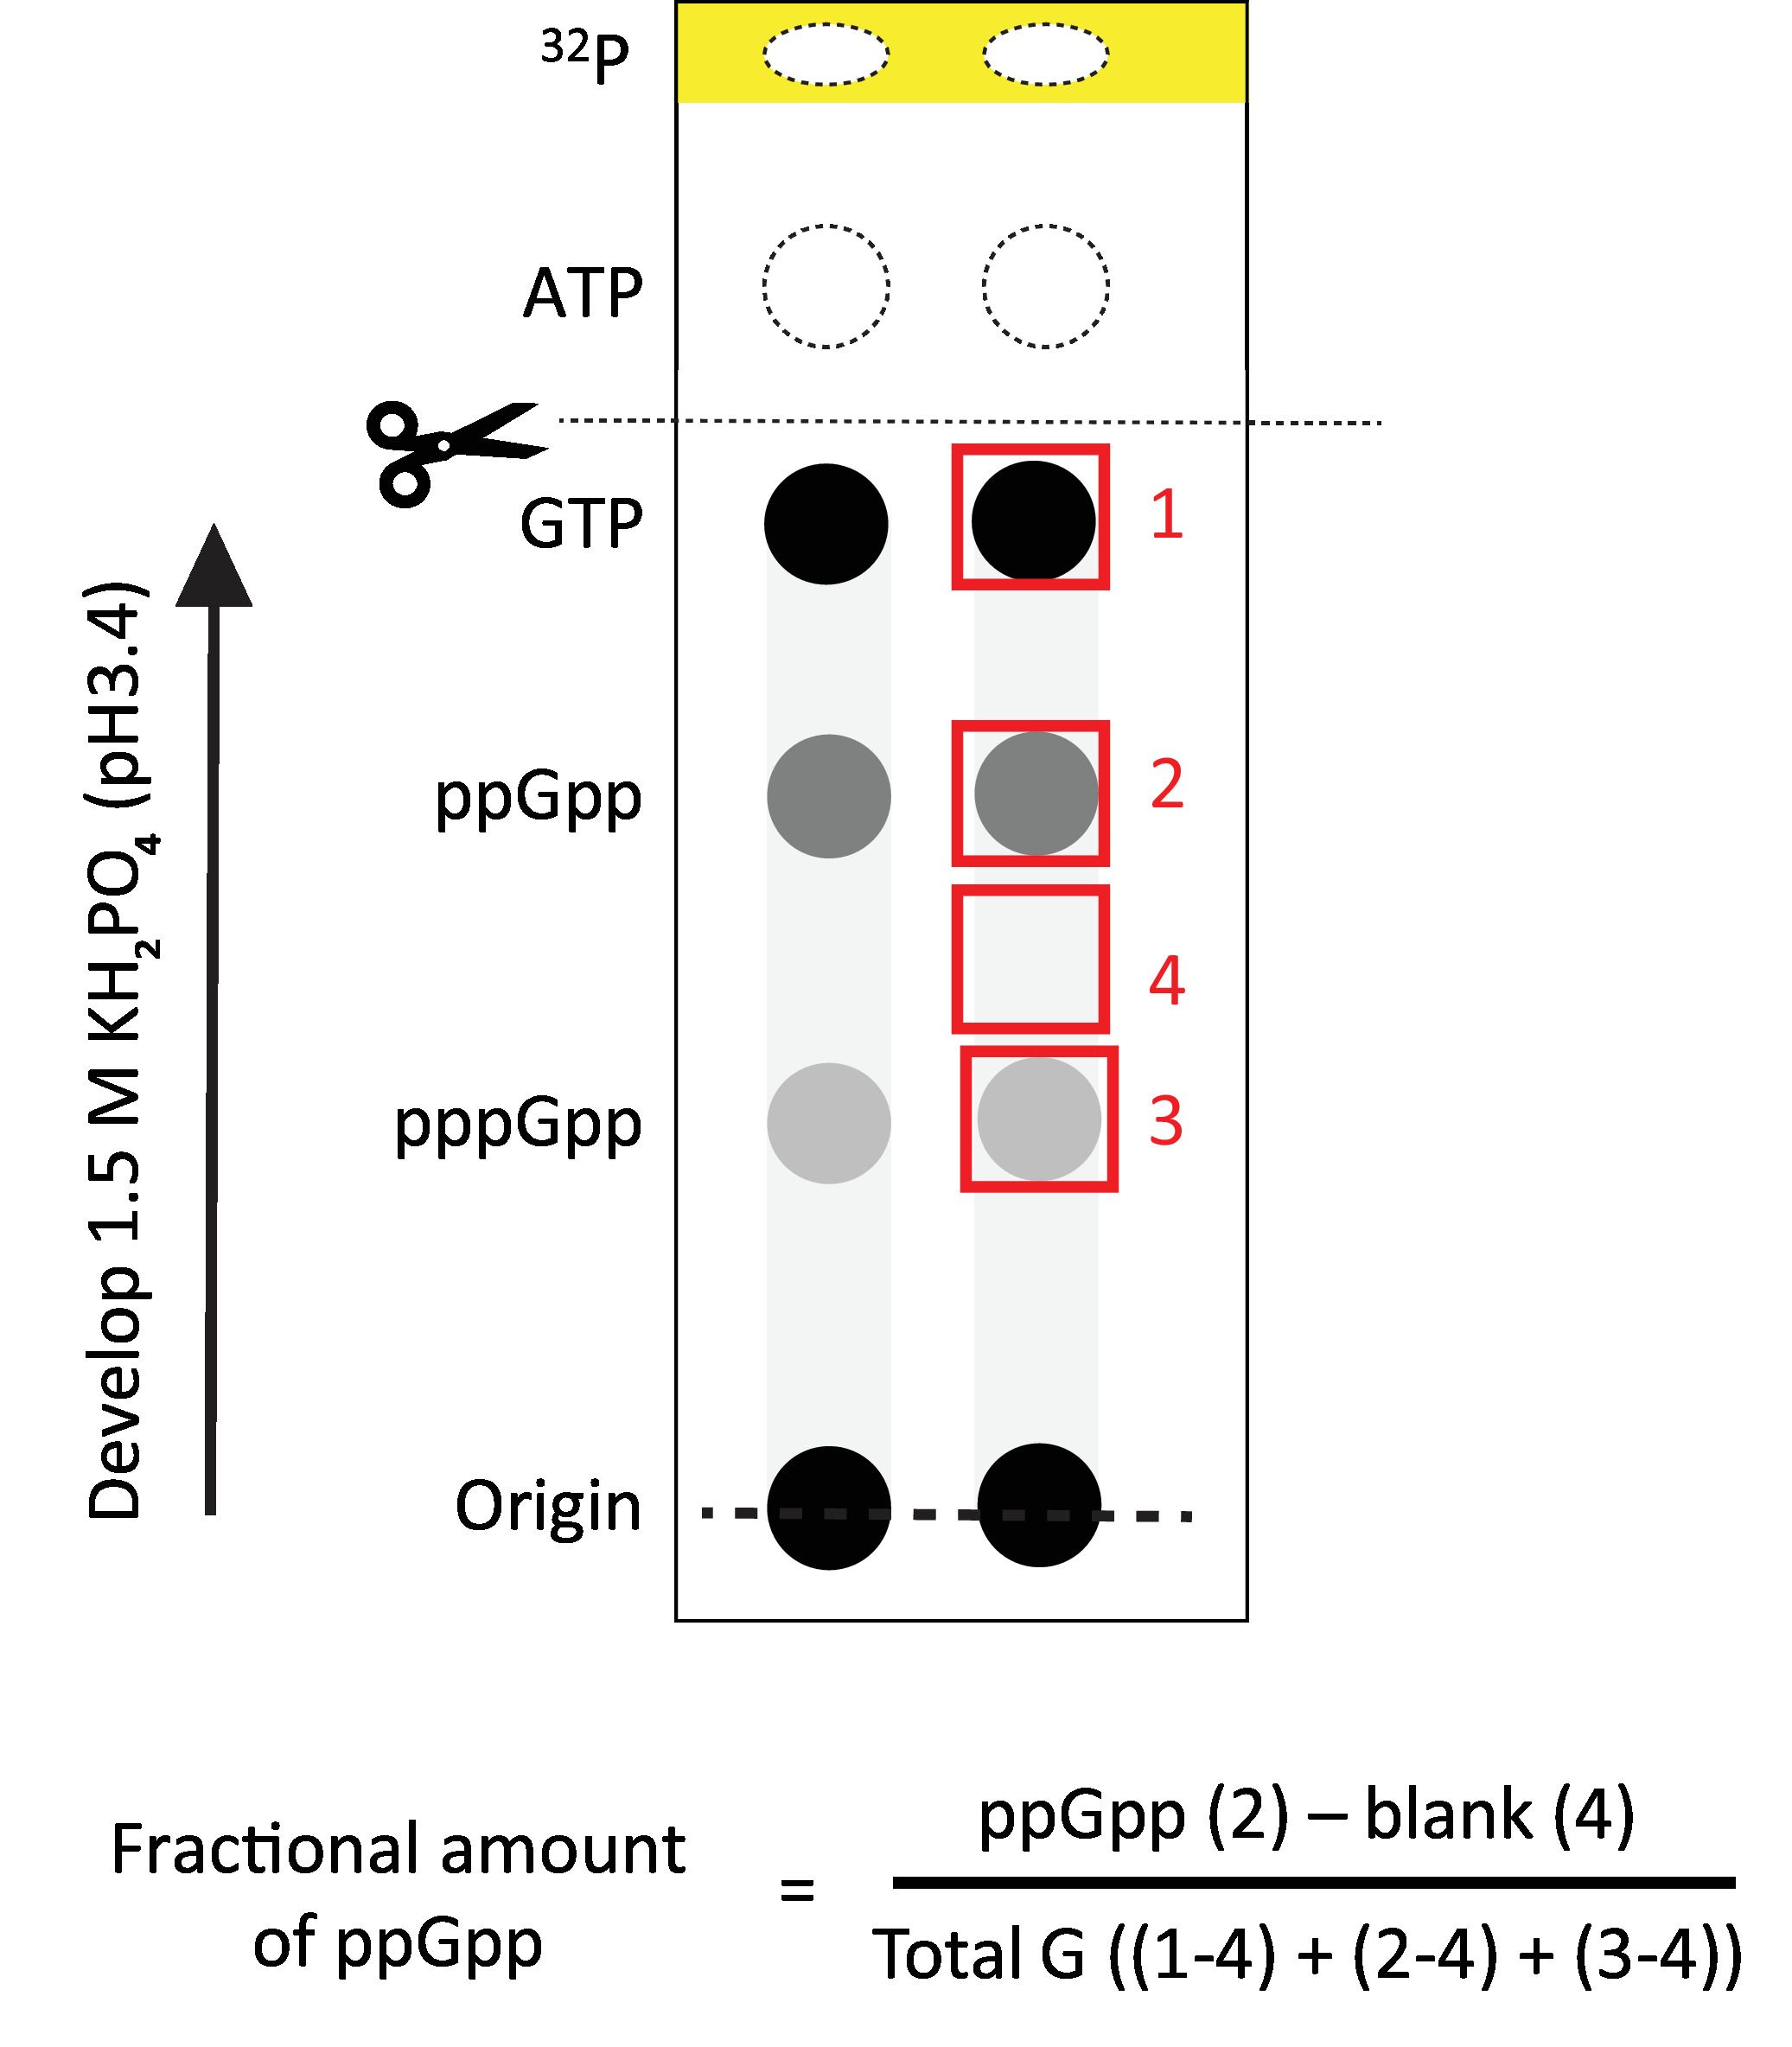
Figure 1: Representative TLC analysis. Schematic representation of the results obtained af...
Toegang beperkt. Log in of start een proefperiode om deze inhoud te bekijken.
Materialen
| Naam | Bedrijf | Catalogusnummer | Opmerkingen |
|---|---|---|---|
| Autoradiography film | Denville scientific inc. | E3218 | |
| Storage phosphor screen | Kodak | So230 | |
| TLC PEI Cellulose F | Merk-Millipore | 1.05579.0001 | |
| Typhoon 9400 imager | GE Healthcare | ||
| KH₂PO₄ | Fisher Biotech | BP362-500 | |
| H₃PO₄ | J.T.Baker | 0260-02 |
