This video demonstrates a method for studying host-pathogen interactions using a micro-parallel plate flow chamber seeded with human primary endothelial cells. Following endothelial cell activation by an ionophore and perfusion with fluorescently labeled bacteria, the cells release von Willebrand factor (VWF), which binds bacterial adhesins under shear flow conditions. Fluorescence microscopy is then used to visualize and quantify adherent bacteria on the cell surface.
Een abonnement op JoVE is vereist om deze inhoud te bekijken. Log in of start vandaag met uw gratis proefperiode.
Methodenartikel
Micro-Parallel Plate Flow Chamber Model for Studying Bacterial Adhesion to Human Endothelial Cells
174 weergaven
⸱
1 juli 2026
In dit artikel
Samenvatting
Protocol
1. In Vitro Perfusion Experiments
- Coating of Glass Coverslips
- Dilute von Willebrand factor (VWF) (Haemate P, stock concentration 2,400 µg/ml) in laboratory-grade water (deionized distilled) to a final concentration of 50 µg/ml.
- Dilute collagen in isotonic glucose solution (SKF solution, pH 2.7-2.9, as supplied by the manufacturer) to a final concentration of 160 µg/ml.
- Coat glass coverslips (24 × 50 mm) with VWF or collagen by dropping 200 µl of the coating on parafilm and placing the coverslip on top of the droplet. The droplet will spread along the surface of the coverslip.
- Incubate the coverslip in a humidified container for 4 hr at room temperature (RT). Carefully lift the coverslips from the parafilm with a blunt needle. Mount the coverslip in the bottom part of the flow chamber.
- Coating of Plastic Slips with Endothelial Cells
- Coat plastic slips (1-well PCA cell culture chamber, Sarstedt, Germany) with 1 ml of a 1% gelatin solution in phosphate-buffered saline (PBS) and incubate for 30 min at 37°C. Seed human umbilical vein endothelial cells (HUVECs) on the gelatin-coated plastic slips and grow them to 70-80% confluency. Mount the plastic slip in the bottom part of the flow chamber.
- Perfusion Experiment
NOTE: A schematic overview of the in vitro perfusion model is represented in Figure 1.- Perform in vitro bacterial adhesion studies in a micro-parallel plate flow chamber at a laminar shear stress between 2.5 dyne/cm2 and 20 dyne/cm2 to simulate different physiological flow conditions.
- The flow chamber (in-house design) consists of a metal frame and a perfusion chamber made out of plexiglas (poly(methyl) methacrylate (PMMA)). By connecting it to a high-accuracy infusion pump (PHD 2000 Infusion, Harvard Apparatus, USA), we can generate flow rates between 0.0001 µl/min and 220.82 ml/min.
- Connect the tubing to the upper part of the flow chamber and inject medium into the tubing. Gently place the upper part of the flow chamber on top of the bottom part and assemble the flow chamber. Be careful to avoid air bubbles. Inject 1 ml of medium through the chamber to make sure that the chamber is not leaking and to remove excess coating solution. Avoid air bubbles.
- Place the mouse on a thermo-controlled heating pad at 37 °C on a microscope tray. Since this is a terminal procedure, there is no need for strict aseptic procedures. Make an incision near the jugular vein, gently remove the right side of the cervical muscle, and isolate the jugular vein from the surrounding tissue.
- Set up the infusion pump and fluorescence microscope. Infusion pump settings depend on the syringe diameter and the desired flow rate. From now on, work in a dark room.
- VWF Coating:
- Fill a syringe with fluorescently labeled bacteria and connect it to the inlet tube. Avoid air bubbles. Start the infusion pump for 10 min. The infusion time depends on the shear rate and the coating, bacteria, and medium used, and should represent the steady state of adhesion.
- After 10 min, wash away unbound bacteria by connecting a syringe with PBS to the inlet tube and starting the infusion pump.
- Take at least 15 images or movies at different locations after the wash process. Bacteria are small and potentially difficult to focus on. Prior to the in vitro flow experiment, the appropriate focal plane can be retrieved by placing a drop of fluorescently labeled bacteria on a coverslip and placing the coverslip in the flow chamber. Then, search for the appropriate focal plane and save the settings.
NOTE: During the in vitro flow experiment, capturing the images during the washing step (± 5 min after start) ensures that only the signal for adherent bacteria is captured.
- Endothelial Cells:
- Activate the endothelial cells by perfusion with a 0.1 mM solution of the Ca2+-ionophore A23187 (stock solution 10 mM dissolved in dimethyl sulfoxide (DMSO) in DMEM at the same shear rate as the bacterial perfusion for 10 min by perfusion with a 0.1 mM.
- Calculate shear rate and shear stress as follows.
Shear rate = 6Q/wh2
Where: Q: flow rate in ml/min, w: width in cm, h: height in cm
Shear stress (τ) = shear rate x viscosity (µ)
Where µ: medium: 0.01 dynes x sec/cm2 , whole blood: 0.04 dynes x sec/cm2 - Image analysis
- Obtain live images using an inverted fluorescence microscope with a black and white camera and develop using imaging software. Use an exposure time of 1.5 sec. Take multiple snapshots (at least 15) randomly spread over the coated surface of the flow chamber and save them in the appropriate file format.
- Perform image analysis with ImageJ. Subtract the background to remove smooth, continuous backgrounds from the image (Process – Subtract Background) and define the threshold to set lower and upper threshold values, segmenting gray-scale images into features of interest. Measure the area limited to the threshold.
- Compare bacterial adhesion, expressed as fluorescent area, e.g., using statistical analysis software. Compare the groups using one-way ANOVA or two-tailed Student’s t-test. Report all values as mean ± standard error of the mean (SEM). Consider a p-value of <0.05 significant (* p <0.05; ** p <0.01; *** p <0.001).
Toegang beperkt. Log in of start een proefperiode om deze inhoud te bekijken.
Resultaten
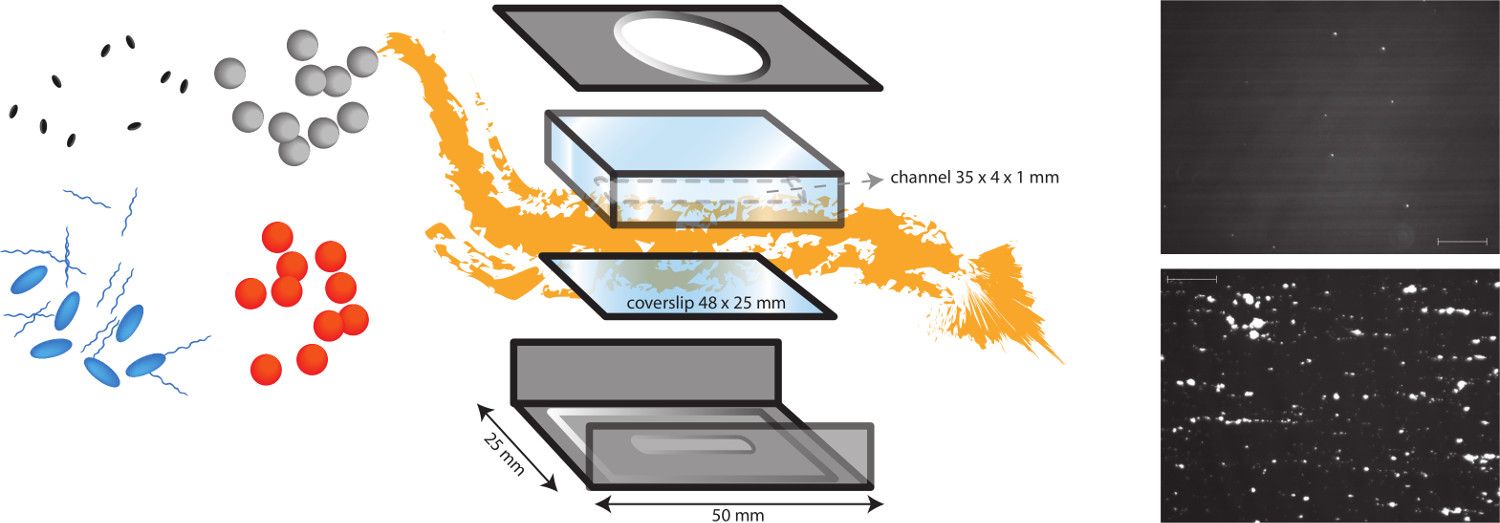
Figure 1. A schematic representation of the in vitro flow model. The in vitro flow model is a multifunctional model, which allows the study of different shear-dependent mechanisms, such as bacterial adhes...
Toegang beperkt. Log in of start een proefperiode om deze inhoud te bekijken.
Materialen
| Naam | Bedrijf | Catalogusnummer | Opmerkingen |
|---|---|---|---|
| Brain Heart Infusion (BHI) | BD Plastipak | 237500 | |
| Tryptic Soy Broth (TSB) | Oxoid | CM0129 | |
| Phosphate Buffered Saline (PBS) | Invitrogen | 14190-169 | D-PBS |
| 5(6)-carboxy-fluorescein N-hydroxysuccinimidyl ester | Sigma-Aldrich | 21878-25MG-F | fluorescent labeling |
| Bovine Serum Albumin Fraction V (BSA) | Roch | 10 735 086 001 | |
| Haemate-P | CSL Behring | PL 15036/0010 | VWF |
| Horm collagen | Takeda | 10500 | collagen |
| 1-well PCA cell culture chambers | Sarstedt | 94.6140.102 | plastic slips |
