Een abonnement op JoVE is vereist om deze inhoud te bekijken. Log in of start vandaag met uw gratis proefperiode.

Methodenartikel

A STAGE Tip Procedure for Desalting and Purification of Peptides

3K weergaven

⸱

15 januari 2026

In dit artikel

Samenvatting

Source:
Tia Rizakos1, Jennifer Geddes-McAlister1

1Molecular and Cellular Biology Department, University of Guelph.

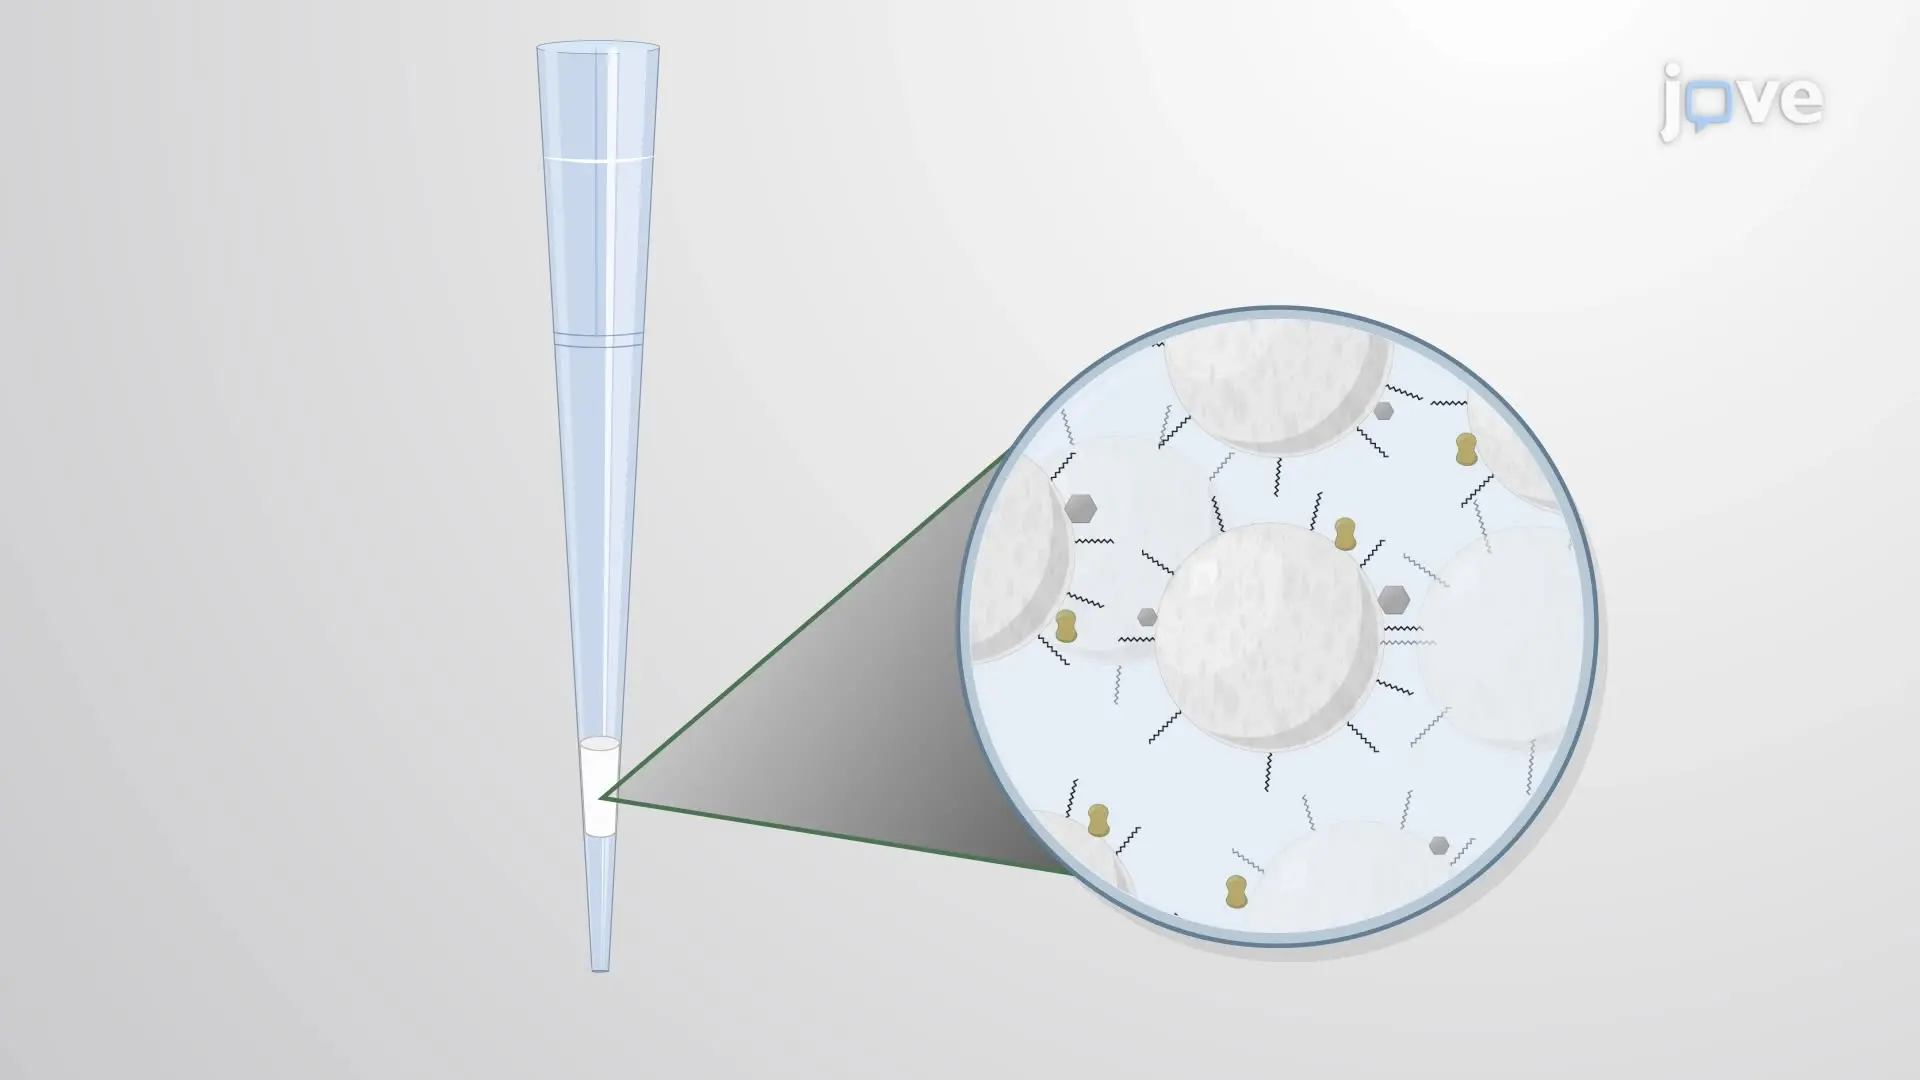
This video demonstrates peptide purification through the STAGE Tip procedure. A miniature column containing resin beads bonded to long hydrocarbon chains facilitates hydrophobic interaction-based purification. Upon loading a pre-digested peptide sample into the column, the peptide fragments bind to the resin beads, allowing impurities to pass through. An elution buffer that disrupts the hydrophobic interaction is applied to elute the peptide fragments.
Protocol

1. Purification and Desalting of Peptides

  1. Pack three layers of C18 resin in a 200 μl pipette tip for each peptide sample to construct a STop And Go Extraction (STAGE)-tip.
  2. Add 1/10 stopping solution (20% acetonitrile [ACN)] and 6% trifluoroacetic acid [TFA]) to samples.
  3. Centrifuge samples for pellet precipitation at 13,200 rpm for 10 min.
  4. Transfer the supernatant to a new 2 mL tube and discard the pellet.
  5. Wash stage tips with 100 μl of 100% ACN.
  6. Centrifuge STAGE tips at 1000 x g for 2 min.
    NOTE: Centrifuge STAGE tips until all liquid has run through the C18 resin.
  7. Wash STAGE tips with 50 μl Buffer B (80% ACN, 0.5% Acetic acid, and ddH2O).
  8. Centrifuge STAGE tips at 1000 x g for 2 min.
  9. Wash STAGE tips with 200 μl Buffer A (2% ACN, 0.1% TFA, 0.5% Acetic acid, and ddH2O).
  10. Centrifuge stage tips at 1000 x g for 2 min.
  11. Load samples into STAGE tips.
  12. Centrifuge samples at 1000 x g for 3-5 min.
  13. Wash STAGE tips with 200 μl Buffer A.
  14. Centrifuge at 1000 x g for 3-5 min.
  15. Add 50 μl of Buffer B into each STAGE tip
  16. Using a syringe, elute samples containing Buffer B into a 0.2 mL PCR strip tube.
  17. Once samples are eluted, dry the peptides using a vacuum centrifuge for 45 mins.
  18. Once samples are dry, store them at room temperature until MS.
    NOTE: If peptide storage is needed for more than two weeks, we suggest storing at -20°C.
  19. Run the sample on a high-resolution mass spectrometry (MS).
    NOTE: Sample measurement parameters (e.g., amount of sample loaded, liquid chromatography gradient length, resolution) will depend on the instrumentation used.

2. Proteomic Profiling of Neutrophils 

  1. Raw data processing
    1. Upload Raw data files obtained from MS into MaxQuant.
    2. The software is designed to run with bottom-up, data-dependent acquisition files, and many default parameters are optimized for such samples. Default parameters include Digestion (Trypsin P), Variable modifications of methionine oxidation (oxidation (M)) and N-acetylation of proteins (Acetyl (Protein N-term)), and fixed modifications of carbamidomethylation of cysteine (carbamidomethyl (C)).
    3. Adjustments to these parameters include label-free quantification (LFQ; set minimum ratio count to 1), Match Between Runs (i.e., on/off), and a minimum number of peptides identified per protein (recommend setting to 2).
    4. In global parameters, import the FASTA file for sequence identification. For this experiment, the Homo sapiens (Human) (UP000005640) FASTA file from the Uniprot database was used. NOTE: Record the following information for record-keeping: Organism ID = 9606; the number of proteins = 79,740; file download date.
    5. Set the number of computer cores to be used for processing and select Start.
    6. Upon completion of MaxQuant, a 'combined' folder, along with other files, will be generated.
      NOTE: The other files may be used to identify peptides, modifications, etc., and may be needed to upload the full dataset to data repositories, including Proteome Xchange (PRIDE).
  2. Data analysis and visualization in Perseus
    1. Upload the 'proteingroups.txt' into Perseus and select all LFQ intensity files for the 'Main' window.
      NOTE: Baseline information is imported directly into the Perseus windows, but other information (e.g., modification sites) may need to be added manually.
    2. Filter rows by removing contaminants, reverse peptides, and peptides only identified by site.
    3. Transform the data by log2(x).
    4. To observe the number of proteins detected in each replicate, construct a numeric Venn diagram.
    5. Set categorial annotations for each sample.
      NOTE: For statistical purposes, all replicates of one biological sample should have the same name.
    6. Filter rows based on valid values, with the protein identified in >50% of the replicates and within at least one group.
      NOTE: Filtering by valid values can be more stringent, depending on the experiment setup and goals (e.g., protein must be present in all samples).
    7. To replace missing values for LFQ, imputation from the normal distribution can be performed.
      ​NOTE: the default parameters are optimized for LFQ data but can be adjusted as desired.
    8. Add annotation information to the protein rows. Add the txt.gz FASTA file (obtained from the Perseus website) in the 'bin', 'conf', and 'annotation' folders and bring in specific terms (e.g., protein names, gene names, gene ontology).
    9. The matrix is now complete and can be used for statistical testing (e.g., ANOVA, t-tests) to determine significant changes in protein abundance between the tested conditions. Other forms of visualization tools include principal component analysis plots, heat maps, and category enrichment.
      NOTE: Annotation information can also be downloaded from UniProt and integrated into the Perseus framework.

Toegang beperkt. Log in of start een proefperiode om deze inhoud te bekijken.

Meer artikelen verkennen

Peptidezuiveringhydrofobe interactieC18-harspeptide-elutieproteomische profileringmassaspectrometrieMaxQuant-softwarePerseus-analysevacuümcentrifugatie