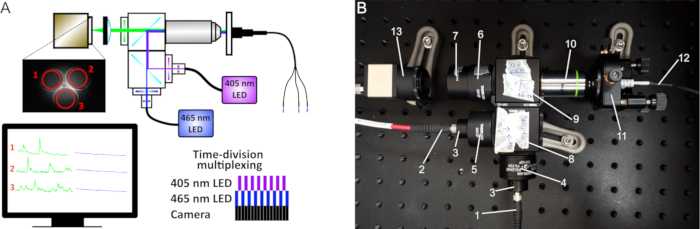
All procedures involving animal models have been reviewed by the local institutional animal care committee and the JoVE veterinary review board.
1. Alignment of the optical path between the CMOS (complementary metal oxide semiconductor) camera and the individual or branching patch cord
- Loosen all screws on the 5-axis translator (Figure 1B).
- Screw in the patch cord (Figure 1B) to the adaptor [SMA (sub-miniature A) or FC (fiber optic connector)] that is affixed to the 5-axis translator.
- Turn on the 470 nm excitation light (Figure 1B) at low power (100 μW) and place the tip of the patchcord pointing to an autofluorescent plastic slide. This does not have any bearing on future recordings but is solely for visualizing the alignment process.
- Record from the CMOS camera (Figure 1B) in live mode. Increase the gain or adjust the lookup table (LUT) until the image is not entirely black. The point is to be able to see an image at the focal point of the objective (Figure 1B).
- Advance the 5-axis translator towards the objective, ensuring that the 470 nm light is centered on the fiber at the SMA or FC end of the patch cord until an image can be resolved on the camera.
- Adjust the X and Y axes until the image is centered and well-resolved.
- Visualize the light emitted from the ferrule end of the patch cord. It should appear as an isotropic circle. If a branching patch cord is used, the amount of light emitted at the ferrule ends of each patch cord should be similar. If the circle is not isotropic or the emitted light is unequal, adjust the 5-axis translator in the X-Y axis.
2. Setup of ROIs around fibers for measurement of mean fluorescent intensity
- Turn on all the excitation lights to visualize the fibers better. Adjust the camera gain so that no pixels are saturated and a clear image of the fibers is present.
- Live record or take a preliminary image.
- Draw ROIs around the fibers and keep them for measuring the mean intensity values during recordings (Figure 1A).
- For multiple fiber recordings, test for independence in signals.
- Live record from all fibers.
- Point one fiber towards a light source and tap with a finger. Large fluctuations should occur solely in that channel (acceptable leakage 1:1000).
- If the signals are not independent, redraw more conservative ROIs and repeat the independence test.
- To label and track which ROI corresponds to which fiber, colored tape, or nail polish can be applied to the end of the fibers. Take a picture before the start of any experiment as a secondary reminder.
3. Setup of recording arena
- Hang the patch cord above the arena using stands, clamps, or holders.
- Make sure that the animal can freely move throughout the entire arena, uninhibited by the length of the fiber.
- If an operant box or open field is used, ensure the patch cord can reach the animal with minimal bending. If this requires a nose poke, ensure that there is enough room overhead to prevent the bending of the fiber. Avoid any excessive bending or twisting of the patch cord.
4. In vivo recordings
- Visually inspect the distal end of the fibers of the patch cord by eye and with a minifiber microscope. If the surface of the fibers is scratched, repolish the fibers using fiber polishing/lapping film with fine grit (1 μm and 0.3 μm).
- Clean the distal ends of the patch cord with 70% ethanol and a cotton tip applicator.
- Clean the fiber-optic cannulas using 70% ethanol and a cotton tip applicator.
- Connect the ferrule end of the patch cord to the implanted fiber using a ceramic split sleeve covered with a black shrink tube. Ensure the sleeve is tight during the connection. Otherwise, use a new sleeve.
NOTE: If there is any space between the patch cord ferrule and the implant, there will be a large amount of signal loss, and the recordings will not work.
- Allow the animal to recover for a few minutes before the start of behavioral testing.
- Start recording the optical signal and run the experiment.
- While recording, keep a careful eye on the live-trace to ensure quality recordings. The signal is expected to rapidly decrease as a function of time in the first 2 min of recording. This effect is caused by heat-mediated LED decay, whereby the increase in heat increases the resistance of the optical element.
- If a jump in the signal that exceeds the on/off kinetics of GCaMP occurs, this often indicates that the sleeve is not tight enough and the space between the patch cord and the implant is changing. In this case, stop the experiment and reconnect the animal using a new sleeve.