This video demonstrates the imaging of human neuroblastoma cells using a total internal reflection fluorescence (TIRF) microscope to visualize fluorophore-tagged synaptic vesicles. The cells are first focused in epifluorescence mode. Adjustments are then made to achieve total internal reflection, generating evanescent waves that selectively excite fluorophores near the membrane. Before TIRF imaging, acquisition parameters are configured, and the sampling frequency is set.
Een abonnement op JoVE is vereist om deze inhoud te bekijken. Log in of start vandaag met uw gratis proefperiode.
Methodenartikel
Cell Imaging Using Total Internal Reflection Fluorescence Microscopy
1.1K weergaven
⸱
17 juni 2025
In dit artikel
Samenvatting
Protocol
1. Cell Culture and Transfection
- SH-SY5Y cell culture
NOTE: The experiments have been performed using the human neuroblastoma SH-SY5Y (ATCC# CRL-2266). SH-SY5Y cells grow as a mixture of floating clusters and adherent cells. Follow the instructions reported in the protocol (cell density, splitting ratio, etc.) to have cells that grow firmly attached to the glass cover, which is crucial for total internal reflection fluorescence microscopy (TIRFM).- Before starting, under the laminar flow biosafety cabinet, make the opportune volume of sterile phosphate buffer saline (PBS) solution and culture medium.
- Make 50 ml of PBS with concentrations of 150 mM Sodium Chloride (NaCl), 24 mM phosphate buffer, pH 7.4. Filter the solution.
- Make 50 ml of cell medium from Dulbecco’s modified Eagle medium (DMEM) with high glucose, 10% heat-inactivated fetal bovine serum (FBS), penicillin (100 U/ml), streptomycin (100 µg/ml), L-glutamine (2 mM), and sodium pyruvate (1 mM). Filter the solution.
- Remove the complete growth medium and wash the cells with 3 ml of PBS.
- Incubate cells with 2 ml of 0.05% trypsin-ethylenediaminetetraacetic acid (EDTA) (for a 6 cm Petri dish) for 5 min at 37 °C, 5% CO2, and detach cells using a pipette.
- Inactivate trypsin by adding 2 ml of DMEM and collect cells by centrifugation at 300 x g for 5 min.
- Remove the supernatant, add 1 ml of DMEM to the pellet, and pipette the solution up and down sufficiently to disperse cells into a single-cell suspension.
- Split them 1:4 in a new 6 cm diameter Petri dish containing 3 ml of complete medium. Maintain cells in culture in 6 cm diameter Petri dishes at 37 °C in a 5% CO2 incubator. Sub-culture once a week, or when they have covered 80 - 90% of the surface area.
- Before starting, under the laminar flow biosafety cabinet, make the opportune volume of sterile phosphate buffer saline (PBS) solution and culture medium.
- SH-SY5Y cell plating for imaging
- For TIRFM experiments, plate cells are placed on glass covers. Employ glass covers with 0.17 ± 0.005 mm thickness and a 1.5255 ± 0.00015 refractive index. Before starting, prepare the glass coverslips as follows:
- Clean glass covers with 90% ethanol overnight (O/N).
- Rinse them thoroughly in distilled water (three changes of distilled water). Dry glass covers in a drying oven.
- Place covers in glass Petri dishes and sterilize in a preheated oven at 200 °C for 3 hr.
- The day before transfection, place each coverslip in a 3.5 cm Petri dish, add 1 ml of culture medium, and incubate at 37 °C in a 5% CO2 incubator.
- Trypsinize cells as described in steps 1.1.3 - 1.1.5, suspend the cell pellet in 1 ml of complete medium, and count. Calculate the correct volume of cell suspension to add to each Petri dish to yield 3 x 10⁵ cells/well. This density is required for optimal cell growth and efficient transfection. Incubate at 37 °C in a 5% CO2 incubator O/N.
- For TIRFM experiments, plate cells are placed on glass covers. Employ glass covers with 0.17 ± 0.005 mm thickness and a 1.5255 ± 0.00015 refractive index. Before starting, prepare the glass coverslips as follows:
- SH-SY5Ytransfection by polyethylenimine (PEI)
NOTE: To visualize synaptic vesicles dynamics, a pCB6 vector containing synapto-pHluorin has been used. The synapto-pHluorin has been generated by in-frame fusion of a pH-sensitive variant of the green fluorescent protein (GFP) and the vesicular membrane protein synaptobrevin 2. The construct has been extensively employed to investigate synaptic vesicle properties within neurons.- Before starting transfection, make 10 ml of the following solutions. Keep the solutions for a maximum of 1 month.
- Make a 150 mM NaCl solution. Adjust to pH 5.5 with 0.01 N hydrochloric acid (HCl).
- Make a PEI solution at 10% polyethylenimine (PEI; 25 kDa linear) in 150 mM NaCl solution. The pH of the solution rises to 8.8. Adjust pH to 7.8 with 0.01 N HCl.
- 24 hr after plating, remove the medium and refresh with 1.5 ml of complete medium. Keep the cells at 37 °C in a 5% CO2 incubator.
- Under the laminar flow biosafety cabinet, in a 1.5 ml microfuge tube, add 3 µg of plasmid DNA to 25 μl of 150 mM NaCl solution and 100 μl of PEI solution per 3.5 cm Petri dish.
- Vortex for 10 sec, then incubate the DNA/PEI mixture for 30 min at room temperature (RT).
- Carefully add the DNA/PEI mixture to the Petri dish containing coverslips with cells and gently shake to equally distribute the reagent in the Petri dish.
- After 4 h, change the medium and incubate the cells O/N at 37 °C in a 5% CO2 incubator. Perform imaging experiments 24 - 48 h after transfection.
- Before starting transfection, make 10 ml of the following solutions. Keep the solutions for a maximum of 1 month.
2. Cell Imaging by TIRFM
- Imaging set-up
- Perform TIRF imaging with the setup described in Figure 1. It comprises a motorized inverted microscope (Figure 1, inset A), the laser source (Figure 1, inset B), and the TIRF-slider (Figure 1, inset C). Reach TIRFM illumination through a high numerical aperture (NA 1.45 Alpha Plan-Fluar) 100X oil, immersion objective.
- For TIRFM illumination, employ a multi-line (458/488/514 nm) 100 mW argon-ion laser. Using a mono-mode fiber, introduce the linearly polarized laser light into the beam path via the TIRF slider. Insert the TIRF slider into the luminous field diaphragm plane of the reflected-light beam path.
- For wide-field illumination, connect the microscope to a conventional mercury short-arc lamp HBO white light. A polarization-maintaining double prism in the slider ensures the simultaneous combination of TIRF illumination and white light.
- Filter the laser light with an excitation filter (bandwidth 488/10 nm) mounted on a filter wheel and introduced into the laser path. Employ a high-speed, software-controlled shutter to allow fast control of laser illumination. For pHluorin analysis, mount a bandpass 525/50 nm emission filter. Capture digital images (512 x 512 pixels) on a cooled Fast CCD camera with the Image ProPlus software.
- Achieving TIRF illumination (Figure 2)
- Turn on the lasers, the computer, the camera, the filter wheel, and the shutter controllers; then, wait 20 minutes before starting the experiment as the lasers need to warm up and stabilize.
- Before imaging, make the opportune volume of the following solutions.
- Make 50 ml of Krebs (KRH) solution at 125 mM NaCl, 5 mM Potassium chloride (KCl), 1.2 mM Magnesium sulfate (MgSO4), 1.2 mM Potassium dihydrogen phosphate (KH2PO4), 25 mM 4-(2-Hydroxyethyl) piperazine-1-ethanesulfonic acid (HEPES) (buffered to pH 7.4), 2 mM Calcium chloride (CaCl2), and 6 mM glucose.
- Make 10 ml of KCl-KRH solution (pH 7.4) at 80 mM NaCl, 50 mM KCl, 1.2 mM MgSO4, 1.2 mM KH2PO4, 25 mM HEPES (buffered to pH 7.4), 2 mM CaCl2, and 6 mM glucose.
- Remove the glass cover with transfected cells and insert it in the appropriate imaging chamber. Assemble the chamber and add 500 µl of KRH solution in the center of the glass.
- Add oil over the objective. Place the imaging chamber on the stage of the microscope and position the objective under the glass coverslip. Position the safe cover over the sample.
- In epifluorescence mode, focus on the coverslip (upper surface) and choose the transfected cells placed in the chamber center. Select cells whose fluorescent signal can be clearly recorded using an exposure time below 80 msec.
- Under software control, switch to TIRF illumination in live mode.
- To set the TIRF configuration, check the position of the beam that emerges out of the objective on the sample cover (Figure 2B). When the beam is positioned in the center of the objective lens (Figure 2A, left), a spot is visible in the center of the TIRF sample cover (Figure 2B, left), and the cell is imaged in epifluorescence mode (several focus planes, high background fluorescence; Figure 2C, left).
- To reach the critical angle, move the focused spot in the Y direction (forward or backward; Figure 2B, center) using the angle adjustment screw on the TIRF slider (Figure 1C). When the beam converges on the sample plane at an angle larger than the critical angle (Figure 2A, right), the spot disappears, and a straight, thin, focused line is evident in the middle of the sample cover (Figure 2B, right).
- To fine-tune the TIRF angle, use the cell sample (Figure 2C). Watch the fluorescence image in the video. At this stage, an epifluorescence-like image is still visible. Gently move the screw until the TIRF condition is achieved: only one optical plane of the cell is in focus (i.e., the plasma membrane in contact with the coverslip). This results in a flat image with high contrast (Figure 2C, right).
- Sample imaging
- Set the single-channel time-lapse experiment. To minimize photobleaching, capture the image using a low exposure time and high gain. Appropriate exposure times are between 40 - 80 msec. Acquire images at 1 - 2 Hz sampling frequency. Vesicle kinetics may be better appreciated sampling at higher frequency (10 Hz). The regular time of observation is usually 2 min.
Toegang beperkt. Log in of start een proefperiode om deze inhoud te bekijken.
Resultaten
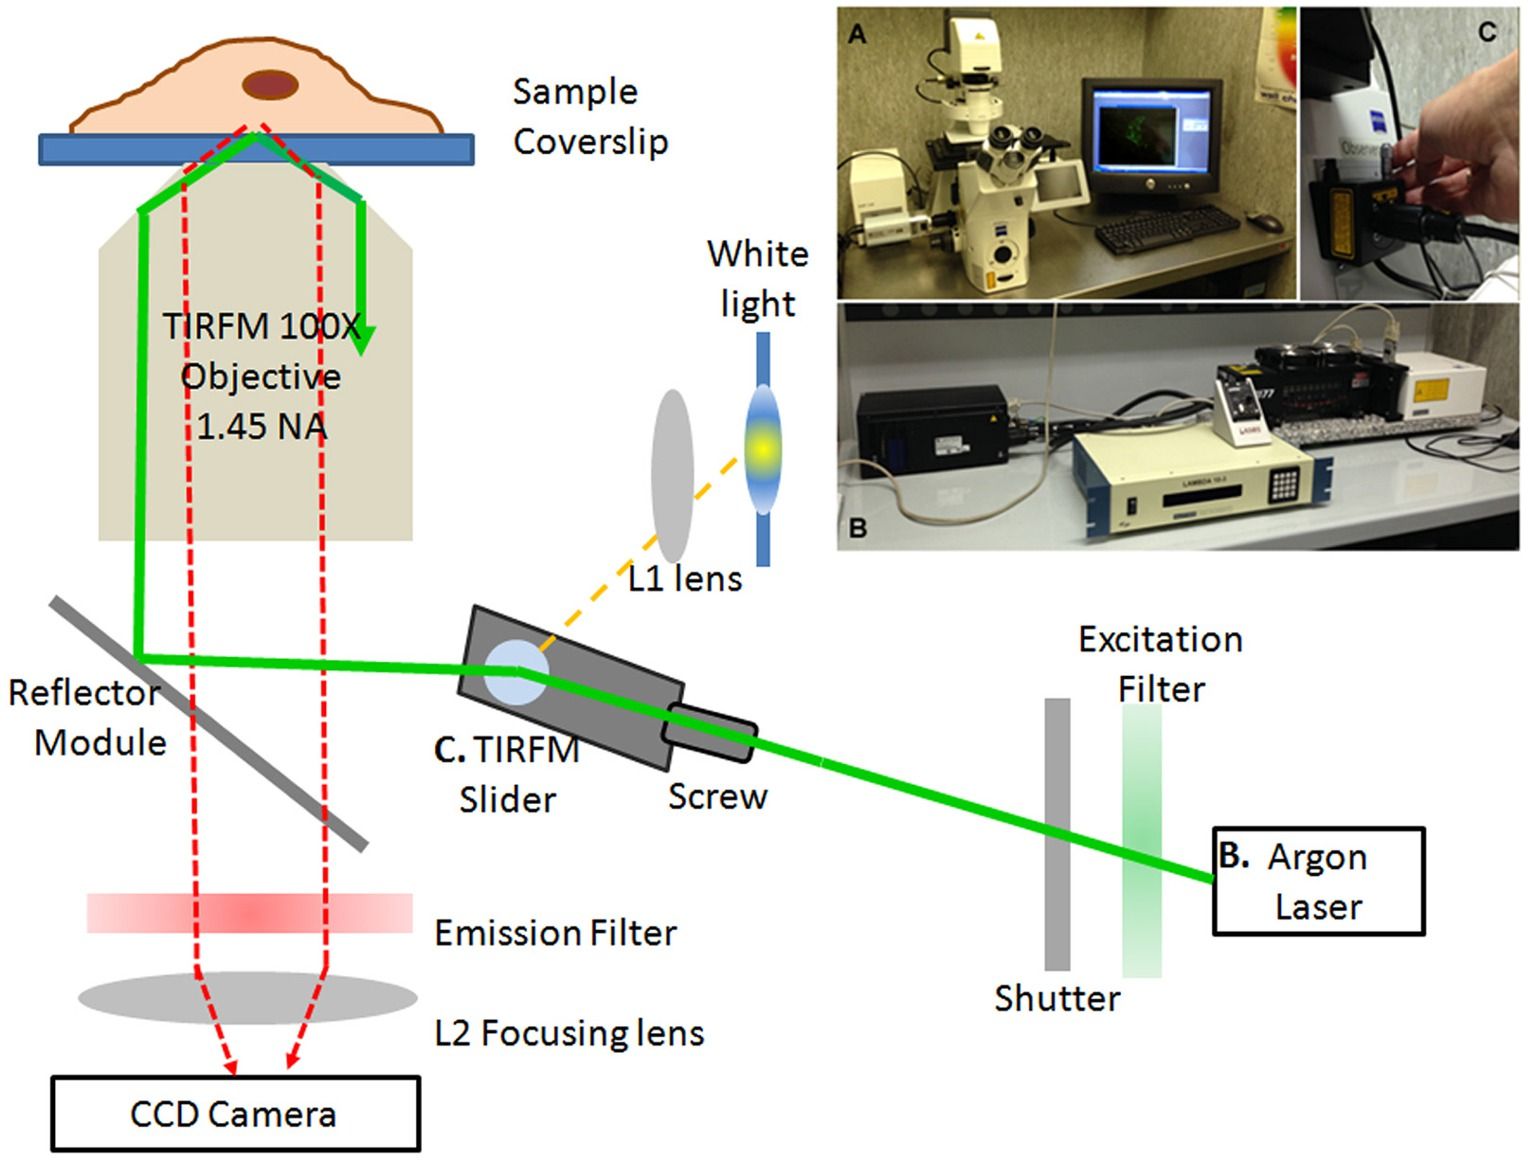
Figure 1. TIRF microscope set up. Schematic view and image (inset) of the TIRF microscope system.
Toegang beperkt. Log in of start een proefperiode om deze inhoud te bekijken.
Materialen
